Embed Size (px)
Citation preview
EVS 18 Berlin, 2001
Optimizing Energy Management Strategy and Degree of Hybridization for a Hydrogen Fuel Cell SUV
Keith Wipke, Tony Markel, and Doug Nelson
Abstract Previous work examined degree of hybridization on the fuel economy of a hybrid electric sport utility vehicle. It was observed that not only was the vehicle control strategy important, but that its definition should be coupled with the component sizing process. Both degree of hybridization and the energy management strategy have been optimized simultaneously in this study. Simple mass scaling algorithms were employed to capture the effect of component and vehicle mass variations as a function of degree of hybridization. Additionally, the benefits of regenerative braking and power buffering have been maximized using optimization methods to determine appropriate battery pack sizing. Both local and global optimization routines were applied to improve the confidence in the solution being close to the true optimum. An optimal configuration and energy management strategy that maximizes the benefit of hybridization for a hydrogen fuel cell hybrid SUV was derived. The optimal configuration was explored, and sensitivity to drive cycle in the optimization process was studied. Keywords: simulation, optimization, fuel cell, energy consumption, HEV
1 Introduction In support of the U.S. Department of Energy’s hybrid vehicle program, the National Renewable Energy Laboratory (NREL) created an Advanced VehIcle SimulatOR called ADVISOR in 1994. It is written in the modular and object-oriented language of MATLAB/Simulink from The MathWorks, Inc. When NREL released ADVISOR on the web for free in 1998 [1], the user-base grew quickly. Today, over 3600 people from around the world have downloaded one or more versions of ADVISOR for their own use. It has a user-friendly graphical user interface (GUI) and includes a library of existing component and vehicle data. The source code and documentation are included with the download, making user modification and customization possible. The user-base includes all of the major automotive OEMs and suppliers, as well as small businesses, universities, and government. ADVISOR is a vehicle simulator capable of simulating conventional, hybrid electric, electric, and fuel cell vehicles [2]. It uses drivetrain component characteristics to estimate fuel economy and emissions on given cycles as well as other quantitative performance metrics (i.e., maximum-effort acceleration, gradeability). Roughly 30 different drive cycles and numerous complex test procedures can be used to assess the fuel economy and emissions under various simulated test conditions. Because of the complexity of hybrid electric vehicles (HEV), including issues such as component sizing, energy management strategy, and battery state-of-charge (SOC) balancing, optimization becomes necessary to give results that can be accurately compared with other vehicles. One useful aspect from an optimization perspective is that ADVISOR runs extremely quickly, allowing a single drive cycle to be run on the order of 20 seconds on a PC. The current version of ADVISOR (version 3.1) has some optimization features built-in, including the ability to automatically size the main powertrain components subject to user-selectable performance constraints. Additionally, it can use optimization to select the proper control strategy to maximize fuel economy and minimize emissions. Although the GUI does not provide the ability to simultaneously optimize both the component sizing and control strategy of a vehicle, the core subroutines of ADVISOR are accessible in a batch mode without the use of the GUI. This is the mode of operation that was used for this study.
EVS 18 Berlin, 2001
ADVISOR 3.1 was used in this study as the ‘objective function’ call within the MATLAB environment. Various optimization algorithms have been linked to ADVISOR to both understand the differences in their approach and their effectiveness in satisfying the needs of finding optimal solutions in the challenging design space of hybrid electric vehicles. The optimization tools that have been evaluated included FMINCON from the Matlab Optimization Toolbox (FMINCON) [3], Response Surface Approximations and Direct Gradient Optimization in VisualDOC (VisualDOC RSA and VisualDOC DGO) [4], DIRECT developed by Donald R. Jones [5, 6] and distributed in TOMLAB 3.0 [7, 8], and Genetic Algorithm and Sequential Quadratic Programming with Approximations in iSIGHT (iSIGHT GA and iSIGHT DONLP) [9]. Links to all of these programs have been created within the MATLAB environment, making it extremely easy to apply various optimization algorithms while preserving the identical problem setup. Each of these programs and algorithms were described briefly in [10] with the exception of iSIGHT, which was more recently acquired. ISIGHT is an optimization software package developed and distributed by Engineous Software, Inc. It offers a wide variety of algorithms and solution methods to choose from. Two key features of this tool are 1) its flexibility in defining linkages between multiple programs, and 2) the ability to combine multiple solution methods in series or parallel to solve a specific problem. It also provides response surface visualization tools that allow the user to explore the impacts of design parameters manually based on design-of-experiments based approximation. In recent work, the Genetic Algorithms and the Sequential Quadratic Programming with Approximations methods have been explored. Based on previous experience, the hybrid vehicle design space is highly non-linear and can have discontinuous regions. Therefore, it is believed that these two methods would be effective routines. Additionally, the various optimization tools were applied to a simple 2-dimensional sample problem to provide insight into the solution approach and efficiency of the various algorithms [10]. It was concluded that the non-gradient based methods of DIRECT were extremely effective in finding the regions likely to contain local and possibly global optimum solutions but required considerable amount of solution time to converge onto the answer within a small tolerance. Previous work relating to optimization of hybrid vehicles has included efforts at University of California, Davis [11] that examined whether, and under which conditions, hybridization of a pure fuel cell vehicle made sense. University of Michigan [12] focused on the development of an object-oriented programming environment for the analysis of vehicle design based on ADVISOR with an application to a parallel hybrid electric vehicle. More recently, collaborative work was performed with Virginia Polytechnic Institute and State University (Virginia Tech) on sizing of components for fuel cell hybrids, which this work will build upon [13]. Atwood, et. al. concluded that some level of fuel cell system hybridization was beneficial to the design. Based on a revision to their published results, it was shown that the best City/Highway fuel economy could be obtained at a fuel cell to total power (fuel cell + battery) ratio of 0.26. This translated to a fuel cell providing a net peak power of 52 kW and a 150 kW battery pack for a GMC Suburban vehicle (a total of 202 kW was required to meet the performance requirements). A key assumption that is believed to contribute significantly to this solution is that the vehicle mass will remain constant for all cases. As a result, there was no mass penalty associated with a larger fuel cell system. In this study, a vehicle design optimization problem will be defined and the application of optimization tools to the design of a hybrid fuel cell SUV will be explored in detail. Multiple algorithms will be applied and vehicles will be designed for several driving schedules that exhibit a wide variety of performance characteristics. The operating behavior of the optimal vehicles will be discussed and conclusions will be drawn based on the results provided.
EVS 18 Berlin, 2001
2 Optimization Problem Definition and Configuration
2.1 Vehicle Modeling Assumptions For this study, the HEV vehicle characteristics are assumed to be based on a current production baseline conventional mid-size SUV similar to a Jeep Cherokee. Table 1 and 2 outline the vehicle assumptions and the components used. Table 1: Vehicle Assumptions
Vehicle Type Rear wheel drive mid-size SUV (i.e. Jeep Cherokee) VEH_SUV_RWD.m
Baseline conventional vehicle mass 1813 kg HEV glider mass (no powertrain) 1202 kg Rolling Resistance 0.012 Wheel Radius 0.343 m Frontal Area 2.66 m^2 Coefficient of Aerodynamic Drag 0.44
Table 2: Baseline Components
Component ADVISOR filename Description Fuel Converter FC_HH52_Honeywell.m Efficiency vs. net power performance data for 52 kW net
Honeywell pressurized fuel cell system Motor/Controller MC_AC119_VPT.m AC induction motor developed by Virginia Power
Technologies 83 kW @ 275 Vmin Energy Storage System ESS_NIMH45_Ovonic.m Ovonic 45 Ah nickel metal hydride battery modules
The HEV components are based on the current state of the art technology for which data is available. The fuel cell and motor/controller data files are proprietary data, and have not been included in a public release of ADVISOR at this time. The previous study [13] used the following simplifying assumptions:
• Total mass of the vehicle is assumed to be constant regardless of the component sizes. • Component sizes will vary in discrete steps. • Energy management strategy will remain the same in all cases.
In this analysis, we have eliminated these assumptions, however, the assumption that there will be no delay or fuel penalty associated with fuel cell system start-up and shutdown will remain intact. A fuel consumption penalty is included to account for inefficiencies during warm-up of the fuel cell system. We have also included one additional assumption: we will assume that the fuel storage system will be sized to provide 563 km (350 miles) of range. The mass associated with storing a sufficient amount of hydrogen to provide the desired range was calculated and will remain constant for all analyses (average fuel consumption of 3.62 L/100 km (65 mpgge) gasoline equivalent and a fuel storage specific energy of 2000 Wh/kg was assumed). All component masses are assumed to scale linearly with respect to peak power except for the energy storage system. The energy storage system mass is assumed to scale linearly with respect to the number of modules in the pack and by the following relationship with respect to capacity: scaled mass = base mass * (C1*ess_cap_scale + C2) (1) Where C1 and C2 are 0.9832 and 0.01602, respectively, and were derived from nickel metal hydride battery technology data in the ADVISOR data file library.
EVS 18 Berlin, 2001
2.2 Interfacing between ADVISOR and Optimization tools The ability to use ADVISOR in a "GUI-free" or batch mode was introduced and documented with the release of ADVISOR v3.1. This mode was specifically developed to make it easy to use ADVISOR as an automated function or response-generating tool to be connected to optimization routines. As currently configured, this functionality provides the user with nearly all of the functionality available from the GUI, and in some instances even more functionality. The general approach for linking the optimization tools to ADVISOR includes three primary files and five basic steps. The files include a main function routine for configuring the workspace and performing post processing operations, a function for generating the objective response value, and a function for generating the constraint response values. Each of the optimization software tools explored requires minor variations to this implementation process but use the same general approach. As a result, it requires minimal effort to apply multiple algorithms to the solution of the same problem. The basic optimization process using ADVISOR can be summarized as follows,
1. Initialize the MATLAB workspace 2. Modify the design variable values in the workspace with input from optimizer 3. Run simulation to generate objective responses 4. Run simulation to generate constraint responses 5. Process results with optimization tool and return to step 2 until convergence criteria met
Each of the first four operations is achieved using the unique options as input to the adv_no_gui function as defined in the ADVISOR documentation [1].
2.3 Optimization Problem Definition The design variables for this study consist of 8 variables: 4 defining sizing of the fuel cell, motor, and batteries, and 4 defining energy management strategy variables including the maximum and minimum fuel cell power, battery charge power, and the minimum fuel cell off-time. The ADVISOR variables and their upper and lower bounds are listed in Table 3.
Table 3: Design Variables
ADVISOR name Description Units Lower Bound Upper Bound fc_pwr_scale Fuel Cell System Peak Power Scale -- 1 3 mc_trq_scale Motor/ Controller Peak Power Scale -- 0.8 2.5 ess_module_num Battery Pack Number of Modules # 11 35 ess_cap_scale Battery Module Maximum Ah Capacity Scale -- 0.333 2 cs_min_pwr Minimum Power Setting W 0 25000 cs_max_pwr Maximum Power Setting W 25000 50000 cs_charge_pwr Charge Power Setting W 0 25000 cs_min_off_time Minimum Off Time Setting s 10 1000
In order to ensure performance equivalence, constraints were established that ensure that the vehicle will have the same acceleration, gradeability, and charge-neutrality of the baseline conventional SUV upon which this fuel cell vehicle is based. Table 4 includes all of the vehicle performance constraints used in the optimization problem. Table 4: Vehicle Performance Constraints
Type Description Condition Acceleration 0-96.5 km/h <= 11.2 s 64-96.5 km/h <= 4.4 s 0-137 km/h <= 20.0 s Gradeability @ 88.5 km/h for 20 min. at Curb Weight + 5 passengers and cargo (408 kg) >= 6.5 % Drive Cycle Difference between drive cycle requested speed and vehicle achieved speed
at every second during the drive cycle <= 3.2 km/h
SOC Balancing Difference between final and initial battery state of charge <= 0.5 %
EVS 18 Berlin, 2001
Finally, the objective of this study will be to maximize fuel economy (i.e. minimize fuel consumption). In a conventional internal combustion engine-powered hybrid, an OEM would need to consider cost and emissions in addition to fuel economy when optimizing the vehicle. Since a hydrogen fuel cell-powered hybrid is essentially a zero emissions vehicle, we have eliminated emissions from the problem. At this time cost models are under development by other U.S. Federal National Labs that will allow us to include vehicle cost in the equation for future studies. For more detailed descriptions of the ADVISOR design variables and data files mentioned in Tables 1-4, please refer to the documentation for ADVISOR 3.1 [1]. As a result of the constraints and objectives defining this problem, a single function evaluation for this analysis problem in ADVISOR will include an iterative zero-delta SOC balanced cycle calculation for the applicable drive cycles individually, a 20 minute gradeabilty test, and a 0-137 km/h (0-85 mph) acceleration test. On a Pentium III 700 MHz machine a single function evaluation will range between 60-180 seconds of processing time.
3 Optimization Results for Fuel Cell SUV Designed for U.S. City/Highway Composite Test Procedure
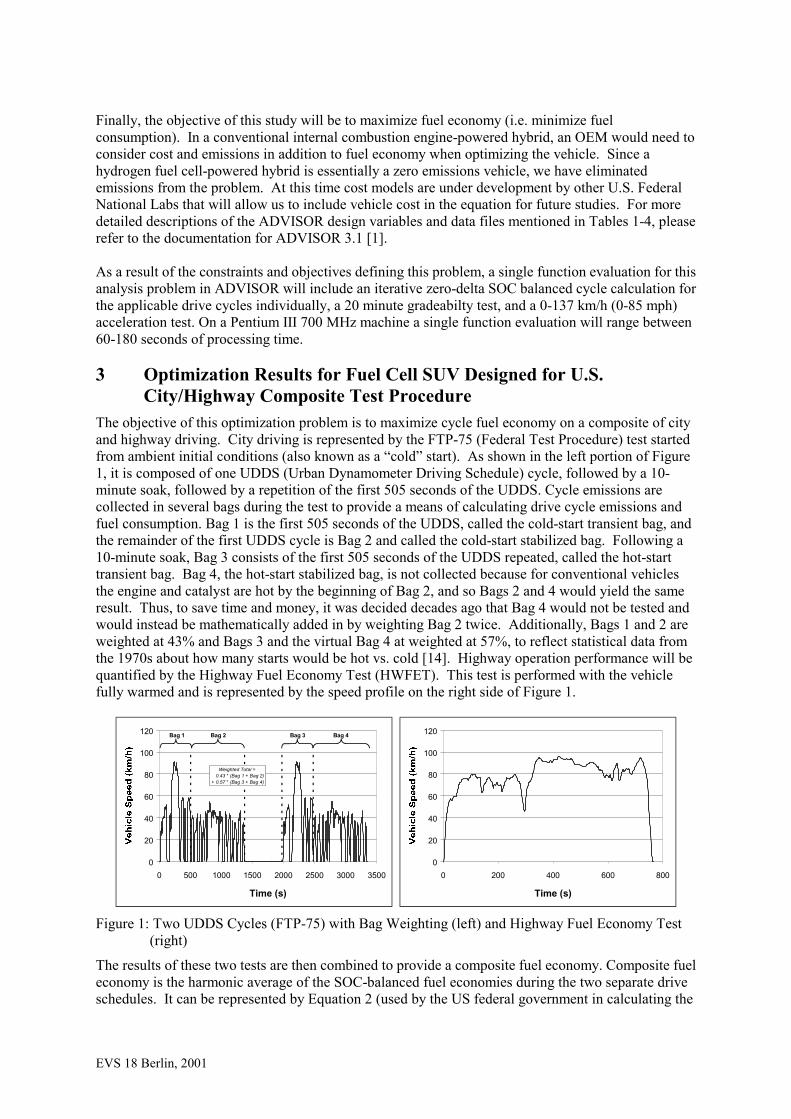
The objective of this optimization problem is to maximize cycle fuel economy on a composite of city and highway driving. City driving is represented by the FTP-75 (Federal Test Procedure) test started from ambient initial conditions (also known as a “cold” start). As shown in the left portion of Figure 1, it is composed of one UDDS (Urban Dynamometer Driving Schedule) cycle, followed by a 10-minute soak, followed by a repetition of the first 505 seconds of the UDDS. Cycle emissions are collected in several bags during the test to provide a means of calculating drive cycle emissions and fuel consumption. Bag 1 is the first 505 seconds of the UDDS, called the cold-start transient bag, and the remainder of the first UDDS cycle is Bag 2 and called the cold-start stabilized bag. Following a 10-minute soak, Bag 3 consists of the first 505 seconds of the UDDS repeated, called the hot-start transient bag. Bag 4, the hot-start stabilized bag, is not collected because for conventional vehicles the engine and catalyst are hot by the beginning of Bag 2, and so Bags 2 and 4 would yield the same result. Thus, to save time and money, it was decided decades ago that Bag 4 would not be tested and would instead be mathematically added in by weighting Bag 2 twice. Additionally, Bags 1 and 2 are weighted at 43% and Bags 3 and the virtual Bag 4 at weighted at 57%, to reflect statistical data from the 1970s about how many starts would be hot vs. cold [14]. Highway operation performance will be quantified by the Highway Fuel Economy Test (HWFET). This test is performed with the vehicle fully warmed and is represented by the speed profile on the right side of Figure 1.
0
20
40
60
80
100
120
0 500 1000 1500 2000 2500 3000 3500
Time (s)
Bag 1 Bag 2 Bag 3 Bag 4
Weighted Total = 0.43 * (Bag 1 + Bag 2) + 0.57 * (Bag 3 + Bag 4)
0
20
40
60
80
100
120
0 200 400 600 800
Time (s)
Figure 1: Two UDDS Cycles (FTP-75) with Bag Weighting (left) and Highway Fuel Economy Test (right)
The results of these two tests are then combined to provide a composite fuel economy. Composite fuel economy is the harmonic average of the SOC-balanced fuel economies during the two separate drive schedules. It can be represented by Equation 2 (used by the US federal government in calculating the
EVS 18 Berlin, 2001
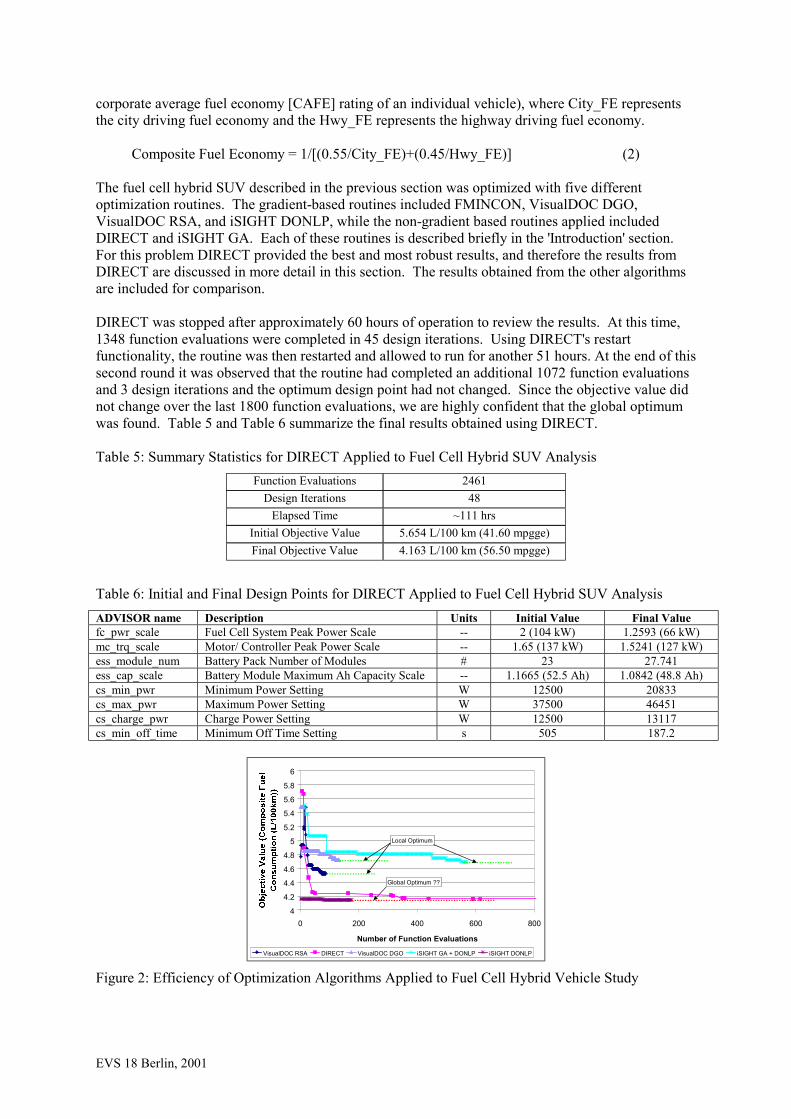
corporate average fuel economy [CAFE] rating of an individual vehicle), where City_FE represents the city driving fuel economy and the Hwy_FE represents the highway driving fuel economy. Composite Fuel Economy = 1/[(0.55/City_FE)+(0.45/Hwy_FE)] (2) The fuel cell hybrid SUV described in the previous section was optimized with five different optimization routines. The gradient-based routines included FMINCON, VisualDOC DGO, VisualDOC RSA, and iSIGHT DONLP, while the non-gradient based routines applied included DIRECT and iSIGHT GA. Each of these routines is described briefly in the 'Introduction' section. For this problem DIRECT provided the best and most robust results, and therefore the results from DIRECT are discussed in more detail in this section. The results obtained from the other algorithms are included for comparison. DIRECT was stopped after approximately 60 hours of operation to review the results. At this time, 1348 function evaluations were completed in 45 design iterations. Using DIRECT's restart functionality, the routine was then restarted and allowed to run for another 51 hours. At the end of this second round it was observed that the routine had completed an additional 1072 function evaluations and 3 design iterations and the optimum design point had not changed. Since the objective value did not change over the last 1800 function evaluations, we are highly confident that the global optimum was found. Table 5 and Table 6 summarize the final results obtained using DIRECT. Table 5: Summary Statistics for DIRECT Applied to Fuel Cell Hybrid SUV Analysis
Function Evaluations 2461 Design Iterations 48
Elapsed Time ~111 hrs Initial Objective Value 5.654 L/100 km (41.60 mpgge) Final Objective Value 4.163 L/100 km (56.50 mpgge)
Table 6: Initial and Final Design Points for DIRECT Applied to Fuel Cell Hybrid SUV Analysis ADVISOR name Description Units Initial Value Final Value fc_pwr_scale Fuel Cell System Peak Power Scale -- 2 (104 kW) 1.2593 (66 kW) mc_trq_scale Motor/ Controller Peak Power Scale -- 1.65 (137 kW) 1.5241 (127 kW) ess_module_num Battery Pack Number of Modules # 23 27.741 ess_cap_scale Battery Module Maximum Ah Capacity Scale -- 1.1665 (52.5 Ah) 1.0842 (48.8 Ah) cs_min_pwr Minimum Power Setting W 12500 20833 cs_max_pwr Maximum Power Setting W 37500 46451 cs_charge_pwr Charge Power Setting W 12500 13117 cs_min_off_time Minimum Off Time Setting s 505 187.2
4
4.2
4.4
4.6
4.8
5
5.2
5.4
5.6
5.8
6
0 200 400 600 800
Number of Function Evaluations
VisualDOC RSA DIRECT VisualDOC DGO iSIGHT GA + DONLP iSIGHT DONLP
Local Optimum
Global Optimum ??
Figure 2: Efficiency of Optimization Algorithms Applied to Fuel Cell Hybrid Vehicle Study
EVS 18 Berlin, 2001
In Figure 2, the best objective value is plotted against the number of function evaluations for five of the six optimization algorithms applied to the fuel cell hybrid vehicle study. At the time of writing we were unable to obtain useful results from FMINCON. As was observed in the 2D sample problem study [10], DIRECT leaps ahead of the gradient based tools by finding a very good local design space in which to search for the optimum value in less than 100 function evaluations. However, as was observed in the sample 2D problem, DIRECT requires a large number of function evaluations once it has closed in on the optimum region to gain only minor improvements in the objective value. One run using iSIGHT DONLP was performed starting from the best point found by DIRECT. Since it only slightly adjusted the design and only improved fuel economy by 0.007 L/100km (0.2%), it confirmed that DIRECT found what is believed to be the optimal design configuration. In contrast to the 2D sample problem, none of the other tools were able to reach the same local design space as DIRECT and thus could not find the likely global optimum. The gradient-based tools find local minima based on their initial starting points and the optimizer control parameters. If the other tools were allowed to restart from a variety of initial points they may indeed also find what is believed to be the global optimum found by DIRECT. It would be interesting to see how many different gradient based runs from varying initial points would need to be run to robustly get to the same optimal value found by DIRECT. The details of this optimal vehicle configuration were then evaluated using ADVISOR and its GUI to help visualize the vehicle behavior and try to understand why the optimizer chose this specific design configuration. In comparison to the three hybrids on the market today (Toyota Prius, Honda Insight, and the Nissan Tino) this fuel cell vehicle has a significantly larger battery pack (~50 Ah compared to 3-7 Ah packs in existing hybrids). This large battery pack results because a fuel cell vehicle is a series hybrid, while all of the existing vehicles are parallel hybrids or parallel/series hybrids. We also see that on a power basis the series fuel cell system only provides ~38% of the total system power, whereas today's parallel hybrids are much more engine-dominant.
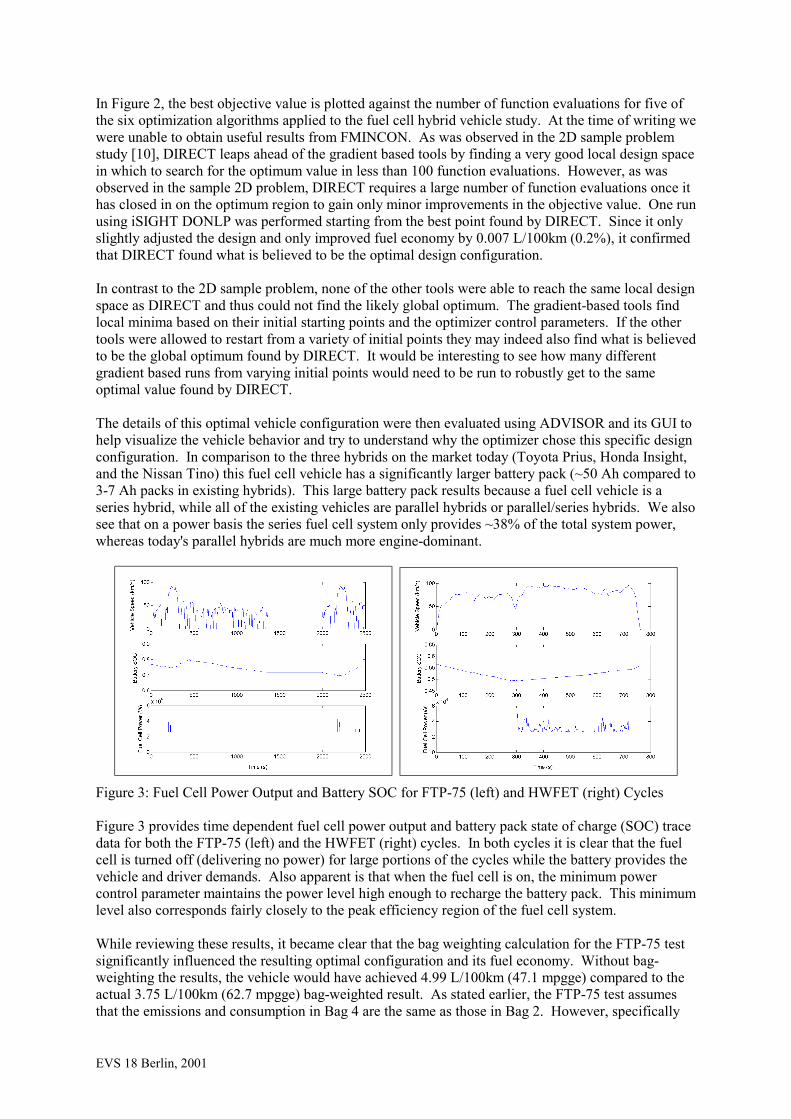
Figure 3: Fuel Cell Power Output and Battery SOC for FTP-75 (left) and HWFET (right) Cycles Figure 3 provides time dependent fuel cell power output and battery pack state of charge (SOC) trace data for both the FTP-75 (left) and the HWFET (right) cycles. In both cycles it is clear that the fuel cell is turned off (delivering no power) for large portions of the cycles while the battery provides the vehicle and driver demands. Also apparent is that when the fuel cell is on, the minimum power control parameter maintains the power level high enough to recharge the battery pack. This minimum level also corresponds fairly closely to the peak efficiency region of the fuel cell system. While reviewing these results, it became clear that the bag weighting calculation for the FTP-75 test significantly influenced the resulting optimal configuration and its fuel economy. Without bag-weighting the results, the vehicle would have achieved 4.99 L/100km (47.1 mpgge) compared to the actual 3.75 L/100km (62.7 mpgge) bag-weighted result. As stated earlier, the FTP-75 test assumes that the emissions and consumption in Bag 4 are the same as those in Bag 2. However, specifically
EVS 18 Berlin, 2001
with series hybrids, the operation in Bag 4 is not necessarily the same (or even similar) to that of Bag 2. Therefore this assumption no longer holds true, and including bag weighting for a 3-bag test will introduce uncertainty. Therefore, for the subsequent analyses discussed in Section 4 the optimization will use the 2 UDDS approach for the FTP test that was put forth in the Society of Automotive Engineers International “Recommended Practice for Measuring the Exhaust Emissions and Fuel Economy of Hybrid-Electric Vehicles,” also known as SAE J1711 [15].
4 Optimization Results for Fuel Cell SUV Designed for Various Worldwide Driving Schedules
In the previous section, we optimized the vehicle for maximum fuel economy based on the City/Highway Composite test. In this portion of the study we will explore the impacts and resulting design variation based on vehicle optimization for various worldwide drive cycles. The drive cycles considered include:
• City/Highway Composite (2 complete UDDS cycles {i.e. real bag 4} and one HWFET cycle) • US06 – High-speed, high acceleration rate driving profile to be used in US EPA
Supplemental Federal Test Procedure (SFTP) • NEDC – New European Drive Cycle, including both low speed urban as well as high speed
highway driving • 10-15 – Japanese 10-15 Mode cycle, characteristic of congested driving in a Japanese city
0
20
40
60
80
100
120
140
0 100 200 300 400 500 600 700
Time (s)
0
20
40
60
80
100
120
140
0 200 400 600 800 1000 1200 1400
Time (s)
0
10
20
30
40
50
60
70
80
0 100 200 300 400 500 600 700
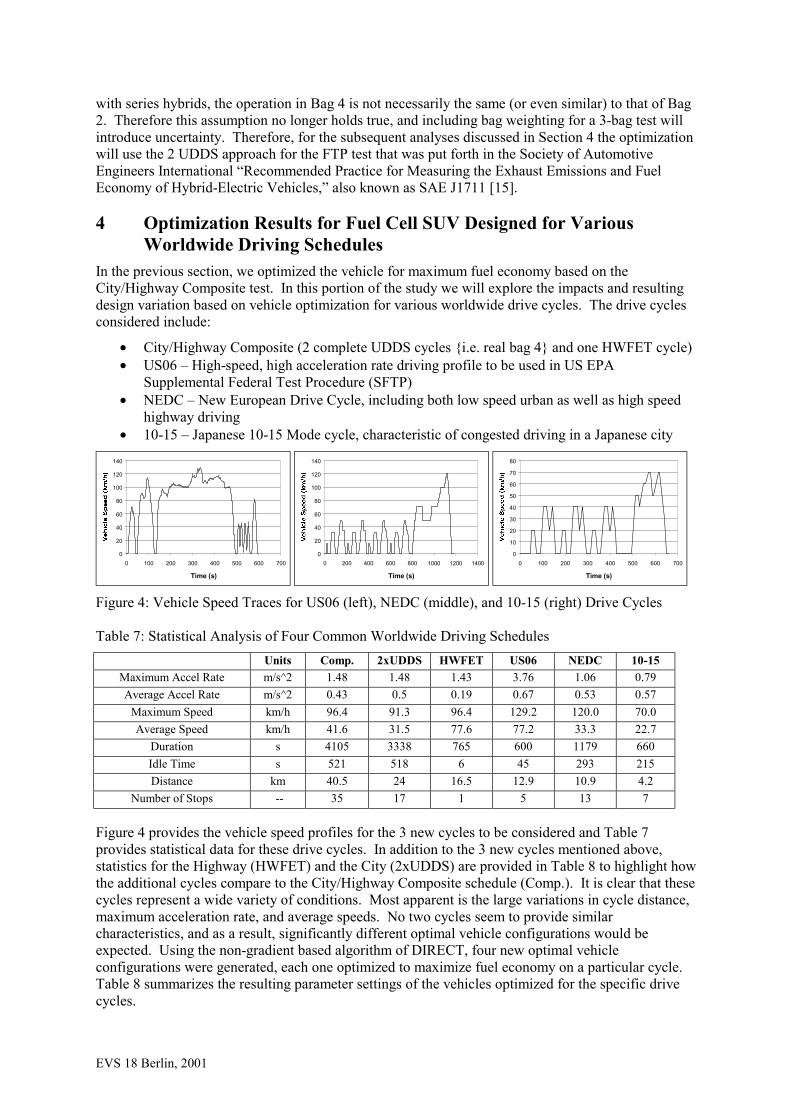
Time (s) Figure 4: Vehicle Speed Traces for US06 (left), NEDC (middle), and 10-15 (right) Drive Cycles Table 7: Statistical Analysis of Four Common Worldwide Driving Schedules
Units Comp. 2xUDDS HWFET US06 NEDC 10-15 Maximum Accel Rate m/s^2 1.48 1.48 1.43 3.76 1.06 0.79 Average Accel Rate m/s^2 0.43 0.5 0.19 0.67 0.53 0.57
Maximum Speed km/h 96.4 91.3 96.4 129.2 120.0 70.0 Average Speed km/h 41.6 31.5 77.6 77.2 33.3 22.7
Duration s 4105 3338 765 600 1179 660 Idle Time s 521 518 6 45 293 215 Distance km 40.5 24 16.5 12.9 10.9 4.2
Number of Stops -- 35 17 1 5 13 7 Figure 4 provides the vehicle speed profiles for the 3 new cycles to be considered and Table 7 provides statistical data for these drive cycles. In addition to the 3 new cycles mentioned above, statistics for the Highway (HWFET) and the City (2xUDDS) are provided in Table 8 to highlight how the additional cycles compare to the City/Highway Composite schedule (Comp.). It is clear that these cycles represent a wide variety of conditions. Most apparent is the large variations in cycle distance, maximum acceleration rate, and average speeds. No two cycles seem to provide similar characteristics, and as a result, significantly different optimal vehicle configurations would be expected. Using the non-gradient based algorithm of DIRECT, four new optimal vehicle configurations were generated, each one optimized to maximize fuel economy on a particular cycle. Table 8 summarizes the resulting parameter settings of the vehicles optimized for the specific drive cycles.
EVS 18 Berlin, 2001
Table 8: Comparison of Vehicles Optimized for Specific Drive Cycles ADVISOR name Description Units Comp.
Vehicle US06
Vehicle NEDC Vehicle
10-15 Vehicle
fc_pwr_scale Fuel Cell System Peak Power Scale
-- 1.11 (57.8 kW)
2.44 (127 kW)
1.333 (69.3 kW)
1.086 (56.5 kW)
mc_trq_scale Motor/ Controller Peak Power Scale
-- 1.461 (121 kW)
2.156 (179 kW)
1.524 (126.5 kW)
1.671 (138.7 kW)
ess_module_num Battery Pack Number of Modules
# 34.56 15 21.22 33.67
ess_cap_scale Battery Module Maximum Ah Capacity Scale
-- 0.693 (31.2 Ah)
0.549 (24.7 Ah)
1.125 (50.6 Ah)
1.990 (89.5 Ah)
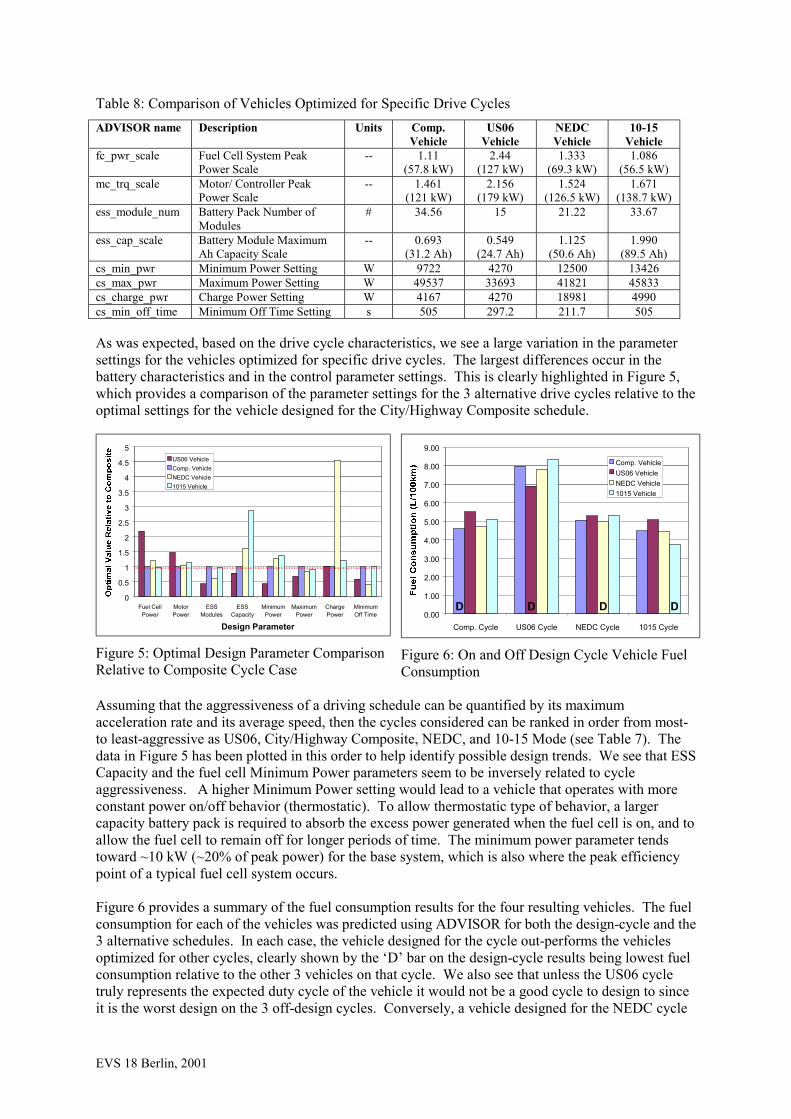
cs_min_pwr Minimum Power Setting W 9722 4270 12500 13426 cs_max_pwr Maximum Power Setting W 49537 33693 41821 45833 cs_charge_pwr Charge Power Setting W 4167 4270 18981 4990 cs_min_off_time Minimum Off Time Setting s 505 297.2 211.7 505 As was expected, based on the drive cycle characteristics, we see a large variation in the parameter settings for the vehicles optimized for specific drive cycles. The largest differences occur in the battery characteristics and in the control parameter settings. This is clearly highlighted in Figure 5, which provides a comparison of the parameter settings for the 3 alternative drive cycles relative to the optimal settings for the vehicle designed for the City/Highway Composite schedule.
0
0.5
1
1.5
2
2.5
3
3.5
4
4.5
5
Fuel CellPower
MotorPower
ESSModules
ESSCapacity
MinimumPower
MaximumPower
ChargePower
MinimumOff Time
Design Parameter
US06 VehicleComp. VehicleNEDC Vehicle1015 Vehicle
Figure 5: Optimal Design Parameter Comparison Relative to Composite Cycle Case
0.00
1.00
2.00
3.00
4.00
5.00
6.00
7.00
8.00
9.00
Comp. Cycle US06 Cycle NEDC Cycle 1015 Cycle
Comp. VehicleUS06 VehicleNEDC Vehicle1015 Vehicle
D DDD
Figure 6: On and Off Design Cycle Vehicle Fuel Consumption
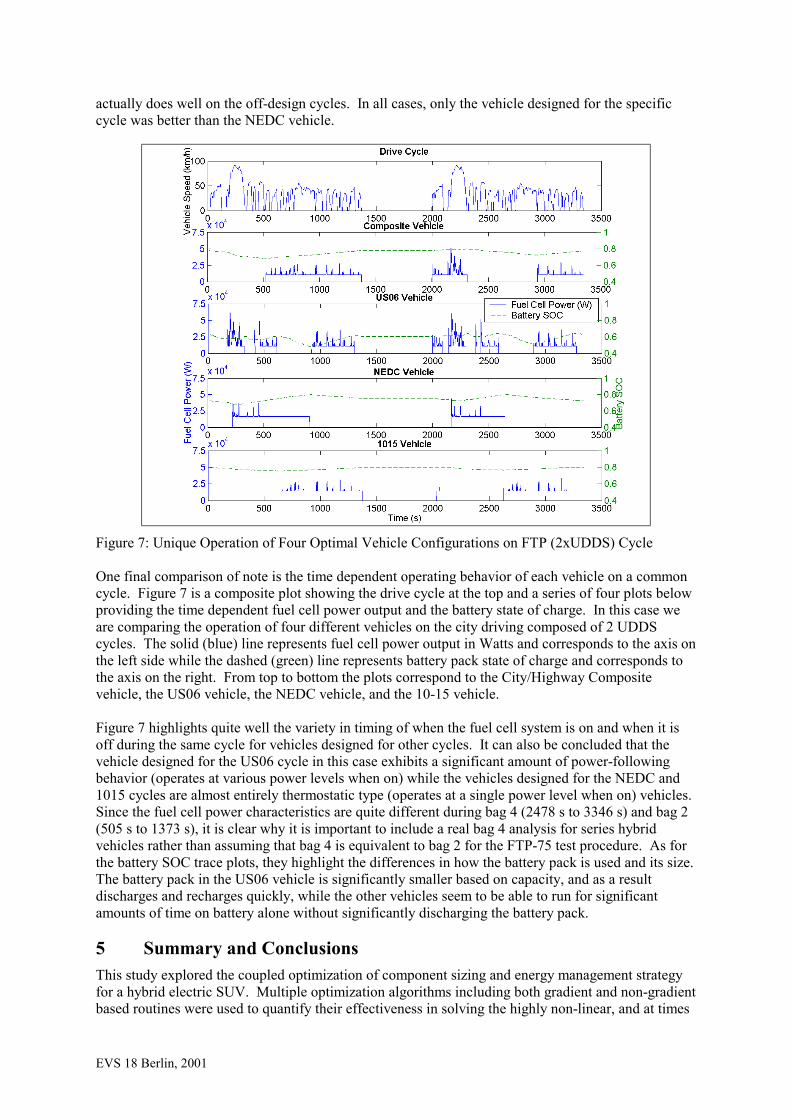
Assuming that the aggressiveness of a driving schedule can be quantified by its maximum acceleration rate and its average speed, then the cycles considered can be ranked in order from most- to least-aggressive as US06, City/Highway Composite, NEDC, and 10-15 Mode (see Table 7). The data in Figure 5 has been plotted in this order to help identify possible design trends. We see that ESS Capacity and the fuel cell Minimum Power parameters seem to be inversely related to cycle aggressiveness. A higher Minimum Power setting would lead to a vehicle that operates with more constant power on/off behavior (thermostatic). To allow thermostatic type of behavior, a larger capacity battery pack is required to absorb the excess power generated when the fuel cell is on, and to allow the fuel cell to remain off for longer periods of time. The minimum power parameter tends toward ~10 kW (~20% of peak power) for the base system, which is also where the peak efficiency point of a typical fuel cell system occurs. Figure 6 provides a summary of the fuel consumption results for the four resulting vehicles. The fuel consumption for each of the vehicles was predicted using ADVISOR for both the design-cycle and the 3 alternative schedules. In each case, the vehicle designed for the cycle out-performs the vehicles optimized for other cycles, clearly shown by the ‘D’ bar on the design-cycle results being lowest fuel consumption relative to the other 3 vehicles on that cycle. We also see that unless the US06 cycle truly represents the expected duty cycle of the vehicle it would not be a good cycle to design to since it is the worst design on the 3 off-design cycles. Conversely, a vehicle designed for the NEDC cycle
EVS 18 Berlin, 2001
actually does well on the off-design cycles. In all cases, only the vehicle designed for the specific cycle was better than the NEDC vehicle.
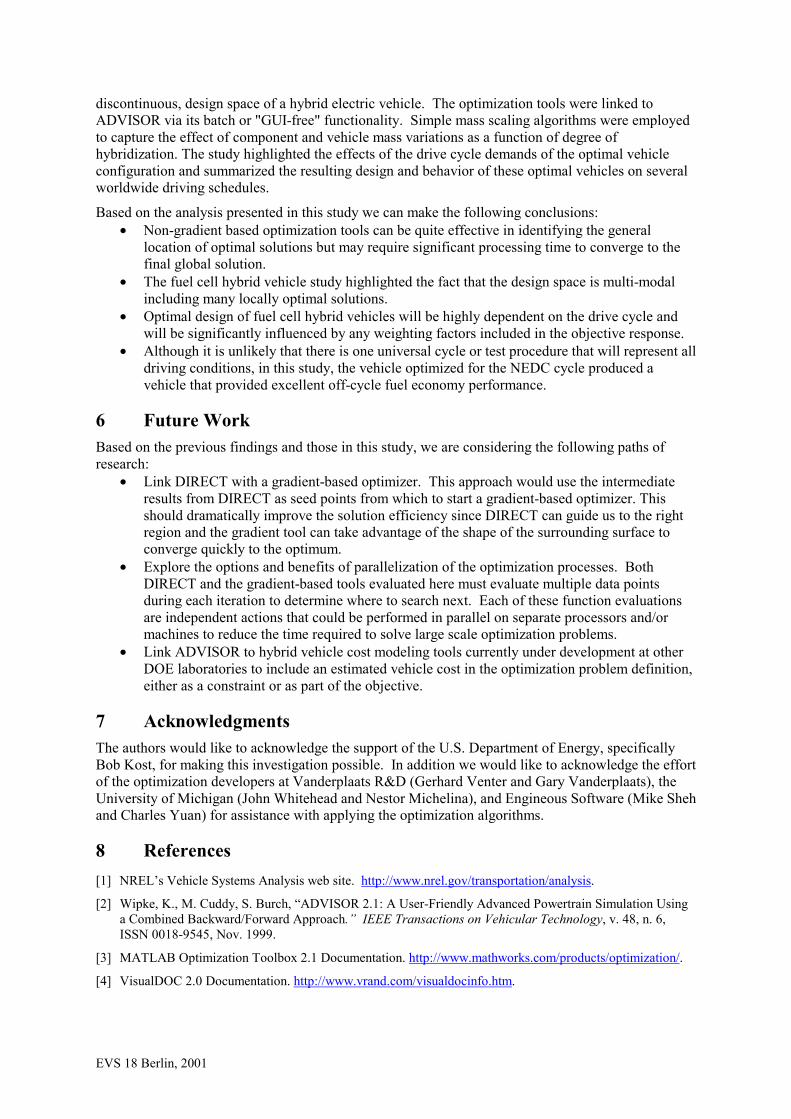
Figure 7: Unique Operation of Four Optimal Vehicle Configurations on FTP (2xUDDS) Cycle One final comparison of note is the time dependent operating behavior of each vehicle on a common cycle. Figure 7 is a composite plot showing the drive cycle at the top and a series of four plots below providing the time dependent fuel cell power output and the battery state of charge. In this case we are comparing the operation of four different vehicles on the city driving composed of 2 UDDS cycles. The solid (blue) line represents fuel cell power output in Watts and corresponds to the axis on the left side while the dashed (green) line represents battery pack state of charge and corresponds to the axis on the right. From top to bottom the plots correspond to the City/Highway Composite vehicle, the US06 vehicle, the NEDC vehicle, and the 10-15 vehicle. Figure 7 highlights quite well the variety in timing of when the fuel cell system is on and when it is off during the same cycle for vehicles designed for other cycles. It can also be concluded that the vehicle designed for the US06 cycle in this case exhibits a significant amount of power-following behavior (operates at various power levels when on) while the vehicles designed for the NEDC and 1015 cycles are almost entirely thermostatic type (operates at a single power level when on) vehicles. Since the fuel cell power characteristics are quite different during bag 4 (2478 s to 3346 s) and bag 2 (505 s to 1373 s), it is clear why it is important to include a real bag 4 analysis for series hybrid vehicles rather than assuming that bag 4 is equivalent to bag 2 for the FTP-75 test procedure. As for the battery SOC trace plots, they highlight the differences in how the battery pack is used and its size. The battery pack in the US06 vehicle is significantly smaller based on capacity, and as a result discharges and recharges quickly, while the other vehicles seem to be able to run for significant amounts of time on battery alone without significantly discharging the battery pack.
5 Summary and Conclusions This study explored the coupled optimization of component sizing and energy management strategy for a hybrid electric SUV. Multiple optimization algorithms including both gradient and non-gradient based routines were used to quantify their effectiveness in solving the highly non-linear, and at times
EVS 18 Berlin, 2001
discontinuous, design space of a hybrid electric vehicle. The optimization tools were linked to ADVISOR via its batch or "GUI-free" functionality. Simple mass scaling algorithms were employed to capture the effect of component and vehicle mass variations as a function of degree of hybridization. The study highlighted the effects of the drive cycle demands of the optimal vehicle configuration and summarized the resulting design and behavior of these optimal vehicles on several worldwide driving schedules. Based on the analysis presented in this study we can make the following conclusions:
• Non-gradient based optimization tools can be quite effective in identifying the general location of optimal solutions but may require significant processing time to converge to the final global solution.
• The fuel cell hybrid vehicle study highlighted the fact that the design space is multi-modal including many locally optimal solutions.
• Optimal design of fuel cell hybrid vehicles will be highly dependent on the drive cycle and will be significantly influenced by any weighting factors included in the objective response.
• Although it is unlikely that there is one universal cycle or test procedure that will represent all driving conditions, in this study, the vehicle optimized for the NEDC cycle produced a vehicle that provided excellent off-cycle fuel economy performance.
6 Future Work Based on the previous findings and those in this study, we are considering the following paths of research:
• Link DIRECT with a gradient-based optimizer. This approach would use the intermediate results from DIRECT as seed points from which to start a gradient-based optimizer. This should dramatically improve the solution efficiency since DIRECT can guide us to the right region and the gradient tool can take advantage of the shape of the surrounding surface to converge quickly to the optimum.
• Explore the options and benefits of parallelization of the optimization processes. Both DIRECT and the gradient-based tools evaluated here must evaluate multiple data points during each iteration to determine where to search next. Each of these function evaluations are independent actions that could be performed in parallel on separate processors and/or machines to reduce the time required to solve large scale optimization problems.
• Link ADVISOR to hybrid vehicle cost modeling tools currently under development at other DOE laboratories to include an estimated vehicle cost in the optimization problem definition, either as a constraint or as part of the objective.
7 Acknowledgments The authors would like to acknowledge the support of the U.S. Department of Energy, specifically Bob Kost, for making this investigation possible. In addition we would like to acknowledge the effort of the optimization developers at Vanderplaats R&D (Gerhard Venter and Gary Vanderplaats), the University of Michigan (John Whitehead and Nestor Michelina), and Engineous Software (Mike Sheh and Charles Yuan) for assistance with applying the optimization algorithms.
8 References [1] NREL’s Vehicle Systems Analysis web site. http://www.nrel.gov/transportation/analysis.
[2] Wipke, K., M. Cuddy, S. Burch, “ADVISOR 2.1: A User-Friendly Advanced Powertrain Simulation Using a Combined Backward/Forward Approach.” IEEE Transactions on Vehicular Technology, v. 48, n. 6, ISSN 0018-9545, Nov. 1999.
[3] MATLAB Optimization Toolbox 2.1 Documentation. http://www.mathworks.com/products/optimization/.
[4] VisualDOC 2.0 Documentation. http://www.vrand.com/visualdocinfo.htm.
EVS 18 Berlin, 2001
[5] Jones, D.R.; Perttunen, C.D.; Stuckman, B.E. "Lipschitzian Optimization without the Lipschitz Constant." Journal of Optimization Theory and Application. Vol. 79 No. 1 October 1993.
[6] “DIRECT,” Encyclopedia of Optimization. Kluwer Academic Publishers. June 1999.
[7] Bjorkman, Mattias and Holmstrom, Kenneth. "Global Optimization using the DIRECT Algorithm in MATLAB." Advanced Modeling and Optimization. Vol.1 No. 2 1999.
[8] TOMLAB 3.0 Documentation. http://www.tomlab.net.
[9] iSIGHT Optimization Software Documentation. http://www.engineous.com.
[10] Markel, T.; Wipke, K. "Optimization Techniques For Hybrid Electric Vehicle Analysis Using ADVISOR." to be published in the Proceedings of the ASME International Mechanical Engineering Congress and Exposition. New York, New York. November 11-16, 2001.
[11] Friedman, D., “Maximizing Direct-Hydrogen PEM Fuel Cell Vehicle Efficiency – Is Hybridization Necessary?” SAE Publication 1999-01-0530, Proceedings of SAE Congress 1999, Detroit, Michigan, March 1999.
[12] Fellini, R. et. al. “Optimal Design of Automotive Hybrid Powertrain Systems.” Proceedings of the ECODesign '99: 1st Intl. Symposium on Environmentally Conscious Design and Inverse Manufacturing. Tokyo, Japan. Feb. 1999.
[13] Atwood, P.; Gurski, S.; Nelson D.J.; Wipke, K.B. "Degree of Hybridization Modeling of a Fuel Cell Hybrid Electric Sport Utility Vehicle." SAE Publication 2001-01-0236. Proceedings of SAE Congress 2001. Detroit, Michigan Jan. 2001. Reprinted in SAE SP-1589, Fuel Cell Power for Transportation 2001, pp. 23-30.
[14] Huls, T.R., “Evolution of Federal Light-Duty Mass Emission Regulations.” SAE Publication 730554, Detroit, Michigan May 1973.
[15] Society of Automotive Engineers, “Recommended Practice for Measuring the Exhaust Emissions and Fuel Economy of Hybrid-Electric Vehicles,” Surface Vehicle Recommended Practice J1711, Issued March, 1999.
9 Authors Keith B. Wipke, Senior Engineer I, National Renewable Energy Laboratory, 1617 Cole Blvd., Golden, CO 80401, USA. Phone: 303.275.4451, Fax: 303.275.4415, E-mail: [email protected]. Keith holds a M.S. in mechanical engineering from Stanford and a B.S. from the University of California, Santa Barbara. He has worked at NREL since 1993, and is currently the task leader for the vehicle systems analysis team, assisting the PNGV systems analysis team and the auto industry model advanced vehicles. His team's efforts include ADVISOR modeling and application, optimization, and linking analysis tools to help realize the vision of a "Digital Functional Vehicle” Tony Markel, Engineer II, National Renewable Energy Laboratory, 1617 Cole Blvd., Golden, CO 80401, USA. Phone: 303.275.4478, Fax: 303.275.4415, E-mail: [email protected]. Tony has a B.S.E. in mechanical engineering with an emphasis in fluid and thermal sciences. He joined the NREL team in 1996. Tony has focused on applying computer modeling and simulation to the evaluation of advanced automotive systems. He is the lead contact for the user support and development of the ADVISOR software tool. His technology focus areas include integration of optimization tools and electrical and fuel cell systems modeling. Doug Nelson, Professor of Mechanical Engineering, Virginia Polytechnic Institute and State University, Blacksburg, Virginia 24061-0238, USA. Phone: 540.231.424, Fax: 540.232.9100, E-mail: [email protected]. Doug holds BS, MS, and Ph.D. degrees in Mechanical Engineering. He teaches courses in fuel cell systems, advanced technology vehicles and design. He is the director of the Dept. of Energy GATE Center for Automotive Fuel Cell Systems. His current research is on fuel cell hybrid vehicle systems simulation and validation, and AC motor development. Dr. Nelson is the faculty advisor for the Hybrid Electric Vehicle Team of Virginia Tech (see http://fbox.vt.edu/org/hybridcar/).


![[Oil & Gas White Paper] Optimizing Pipeline Energy Consumption](https://img.pdfslide.us/doc/110x75/5557551ad8b42aa8378b5365/oil-gas-white-paper-optimizing-pipeline-energy-consumption.jpg)