Embed Size (px)
Citation preview
1
Paper 875-2017
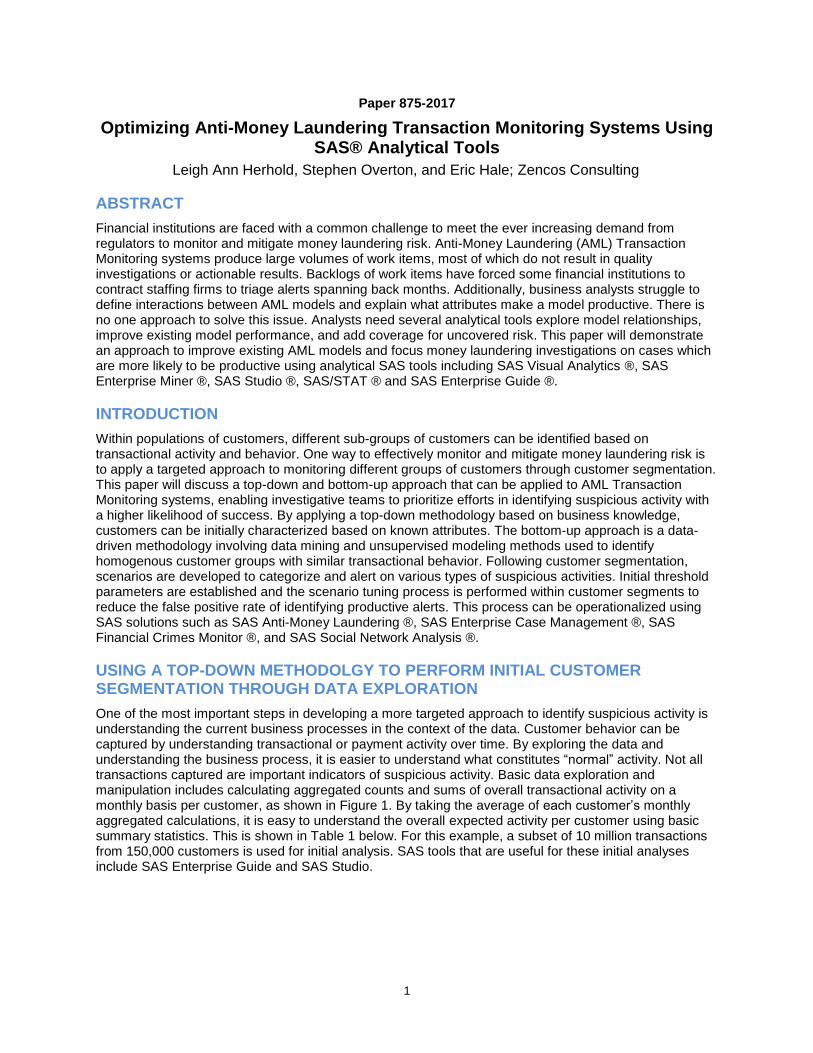
Optimizing Anti-Money Laundering Transaction Monitoring Systems Using SAS® Analytical Tools
Leigh Ann Herhold, Stephen Overton, and Eric Hale; Zencos Consulting
ABSTRACT Financial institutions are faced with a common challenge to meet the ever increasing demand from regulators to monitor and mitigate money laundering risk. Anti-Money Laundering (AML) Transaction Monitoring systems produce large volumes of work items, most of which do not result in quality investigations or actionable results. Backlogs of work items have forced some financial institutions to contract staffing firms to triage alerts spanning back months. Additionally, business analysts struggle to define interactions between AML models and explain what attributes make a model productive. There is no one approach to solve this issue. Analysts need several analytical tools explore model relationships, improve existing model performance, and add coverage for uncovered risk. This paper will demonstrate an approach to improve existing AML models and focus money laundering investigations on cases which are more likely to be productive using analytical SAS tools including SAS Visual Analytics ®, SAS Enterprise Miner ®, SAS Studio ®, SAS/STAT ® and SAS Enterprise Guide ®.
INTRODUCTION
Within populations of customers, different sub-groups of customers can be identified based on transactional activity and behavior. One way to effectively monitor and mitigate money laundering risk is to apply a targeted approach to monitoring different groups of customers through customer segmentation. This paper will discuss a top-down and bottom-up approach that can be applied to AML Transaction Monitoring systems, enabling investigative teams to prioritize efforts in identifying suspicious activity with a higher likelihood of success. By applying a top-down methodology based on business knowledge, customers can be initially characterized based on known attributes. The bottom-up approach is a data-driven methodology involving data mining and unsupervised modeling methods used to identify homogenous customer groups with similar transactional behavior. Following customer segmentation, scenarios are developed to categorize and alert on various types of suspicious activities. Initial threshold parameters are established and the scenario tuning process is performed within customer segments to reduce the false positive rate of identifying productive alerts. This process can be operationalized using SAS solutions such as SAS Anti-Money Laundering ®, SAS Enterprise Case Management ®, SAS Financial Crimes Monitor ®, and SAS Social Network Analysis ®.
USING A TOP-DOWN METHODOLGY TO PERFORM INITIAL CUSTOMER SEGMENTATION THROUGH DATA EXPLORATION
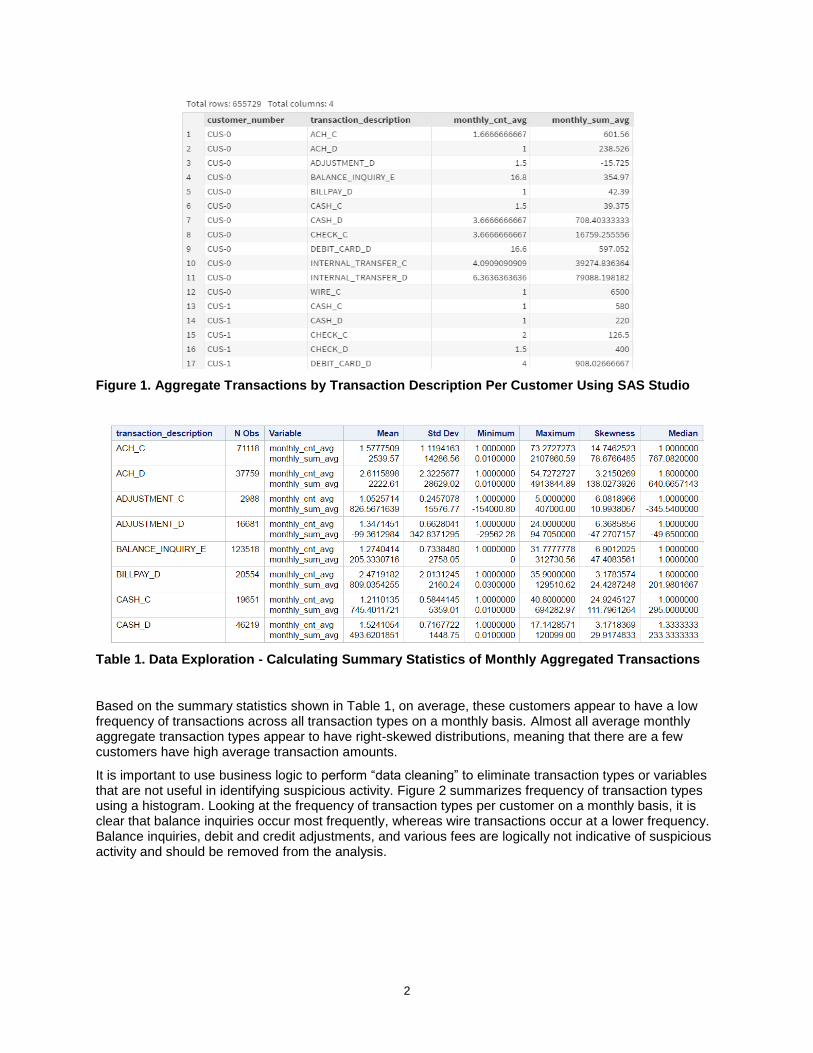
One of the most important steps in developing a more targeted approach to identify suspicious activity is understanding the current business processes in the context of the data. Customer behavior can be captured by understanding transactional or payment activity over time. By exploring the data and understanding the business process, it is easier to understand what constitutes “normal” activity. Not all transactions captured are important indicators of suspicious activity. Basic data exploration and manipulation includes calculating aggregated counts and sums of overall transactional activity on a monthly basis per customer, as shown in Figure 1. By taking the average of each customer’s monthly aggregated calculations, it is easy to understand the overall expected activity per customer using basic summary statistics. This is shown in Table 1 below. For this example, a subset of 10 million transactions from 150,000 customers is used for initial analysis. SAS tools that are useful for these initial analyses include SAS Enterprise Guide and SAS Studio.
2
Figure 1. Aggregate Transactions by Transaction Description Per Customer Using SAS Studio
Table 1. Data Exploration - Calculating Summary Statistics of Monthly Aggregated Transactions
Based on the summary statistics shown in Table 1, on average, these customers appear to have a low frequency of transactions across all transaction types on a monthly basis. Almost all average monthly aggregate transaction types appear to have right-skewed distributions, meaning that there are a few customers have high average transaction amounts.
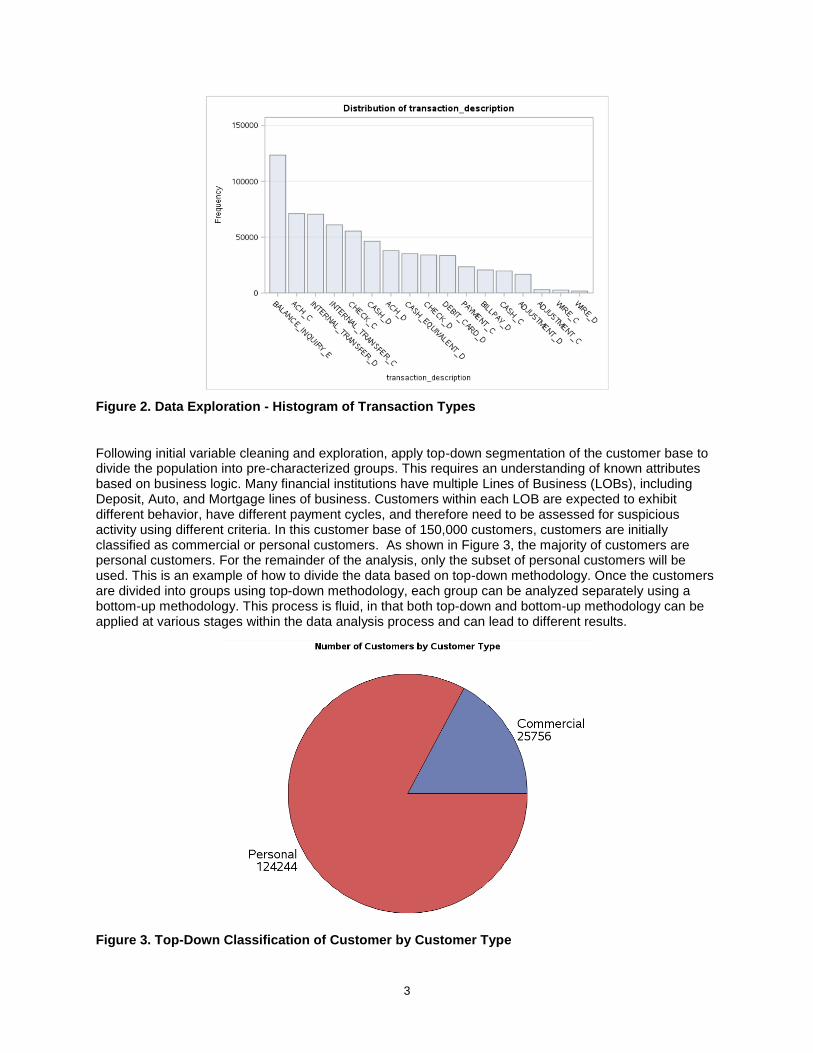
It is important to use business logic to perform “data cleaning” to eliminate transaction types or variables that are not useful in identifying suspicious activity. Figure 2 summarizes frequency of transaction types using a histogram. Looking at the frequency of transaction types per customer on a monthly basis, it is clear that balance inquiries occur most frequently, whereas wire transactions occur at a lower frequency. Balance inquiries, debit and credit adjustments, and various fees are logically not indicative of suspicious activity and should be removed from the analysis.
3
Figure 2. Data Exploration - Histogram of Transaction Types
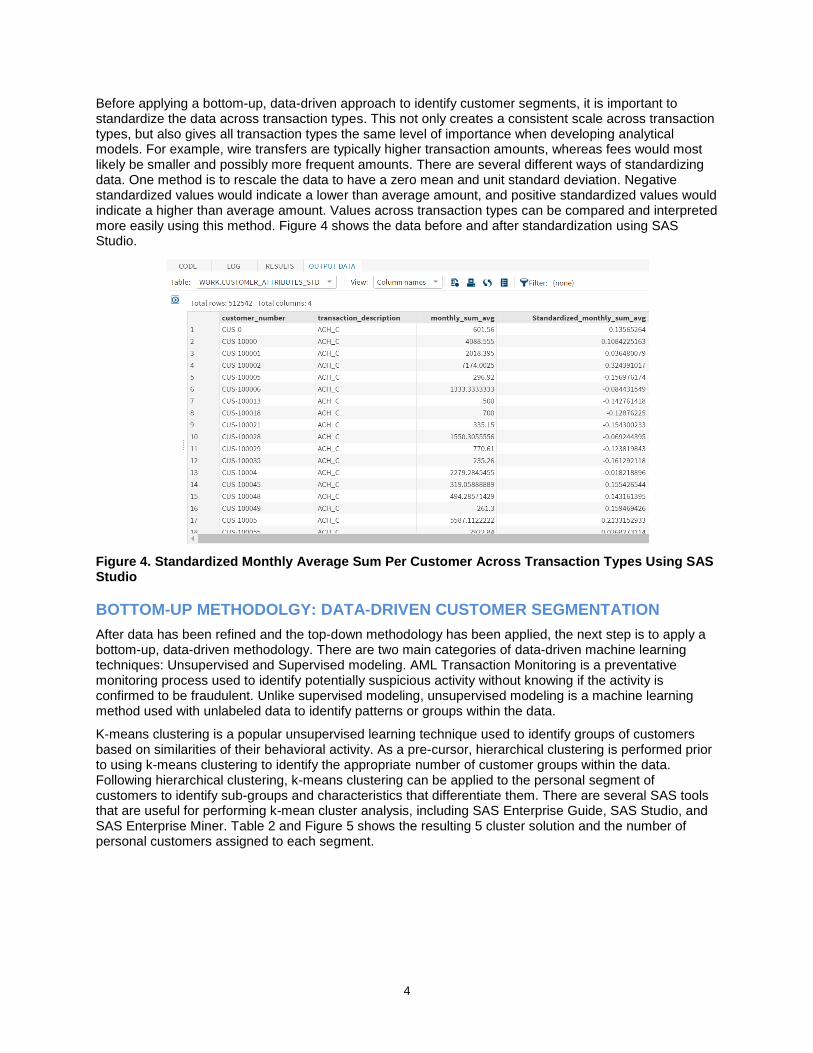
Following initial variable cleaning and exploration, apply top-down segmentation of the customer base to divide the population into pre-characterized groups. This requires an understanding of known attributes based on business logic. Many financial institutions have multiple Lines of Business (LOBs), including Deposit, Auto, and Mortgage lines of business. Customers within each LOB are expected to exhibit different behavior, have different payment cycles, and therefore need to be assessed for suspicious activity using different criteria. In this customer base of 150,000 customers, customers are initially classified as commercial or personal customers. As shown in Figure 3, the majority of customers are personal customers. For the remainder of the analysis, only the subset of personal customers will be used. This is an example of how to divide the data based on top-down methodology. Once the customers are divided into groups using top-down methodology, each group can be analyzed separately using a bottom-up methodology. This process is fluid, in that both top-down and bottom-up methodology can be applied at various stages within the data analysis process and can lead to different results.
Figure 3. Top-Down Classification of Customer by Customer Type
4
Before applying a bottom-up, data-driven approach to identify customer segments, it is important to standardize the data across transaction types. This not only creates a consistent scale across transaction types, but also gives all transaction types the same level of importance when developing analytical models. For example, wire transfers are typically higher transaction amounts, whereas fees would most likely be smaller and possibly more frequent amounts. There are several different ways of standardizing data. One method is to rescale the data to have a zero mean and unit standard deviation. Negative standardized values would indicate a lower than average amount, and positive standardized values would indicate a higher than average amount. Values across transaction types can be compared and interpreted more easily using this method. Figure 4 shows the data before and after standardization using SAS Studio.
Figure 4. Standardized Monthly Average Sum Per Customer Across Transaction Types Using SAS Studio
BOTTOM-UP METHODOLGY: DATA-DRIVEN CUSTOMER SEGMENTATION
After data has been refined and the top-down methodology has been applied, the next step is to apply a bottom-up, data-driven methodology. There are two main categories of data-driven machine learning techniques: Unsupervised and Supervised modeling. AML Transaction Monitoring is a preventative monitoring process used to identify potentially suspicious activity without knowing if the activity is confirmed to be fraudulent. Unlike supervised modeling, unsupervised modeling is a machine learning method used with unlabeled data to identify patterns or groups within the data.
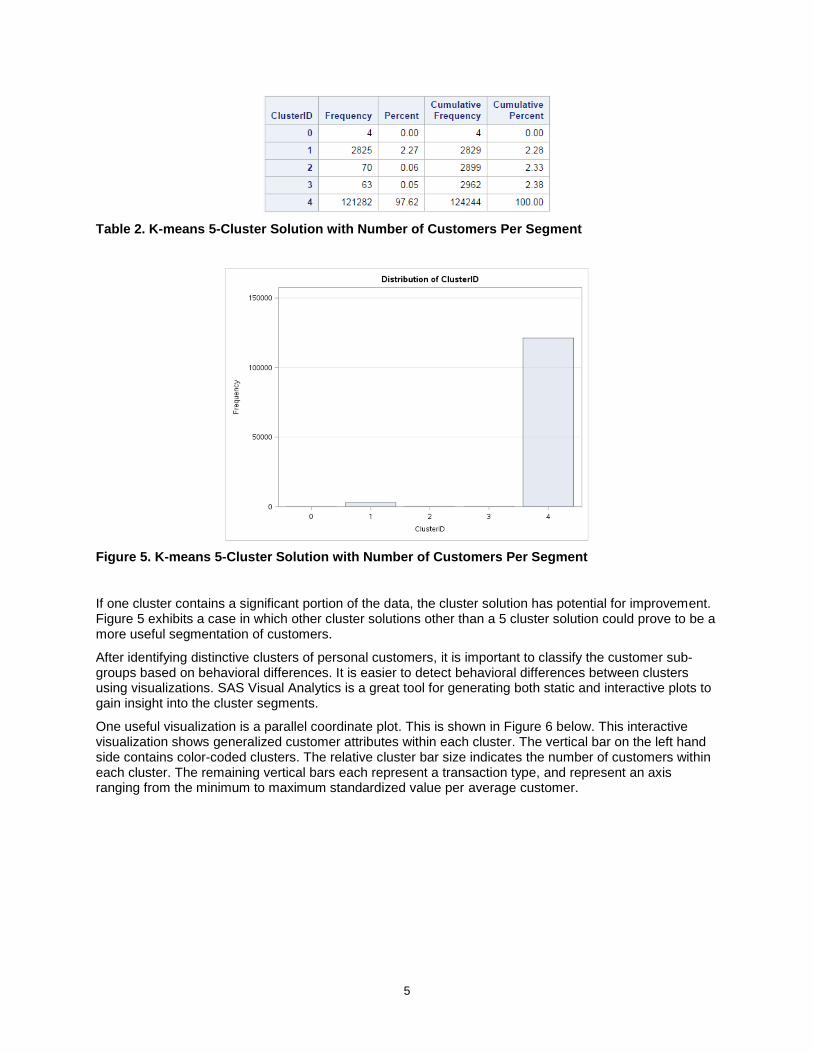
K-means clustering is a popular unsupervised learning technique used to identify groups of customers based on similarities of their behavioral activity. As a pre-cursor, hierarchical clustering is performed prior to using k-means clustering to identify the appropriate number of customer groups within the data. Following hierarchical clustering, k-means clustering can be applied to the personal segment of customers to identify sub-groups and characteristics that differentiate them. There are several SAS tools that are useful for performing k-mean cluster analysis, including SAS Enterprise Guide, SAS Studio, and SAS Enterprise Miner. Table 2 and Figure 5 shows the resulting 5 cluster solution and the number of personal customers assigned to each segment.
5
Table 2. K-means 5-Cluster Solution with Number of Customers Per Segment
Figure 5. K-means 5-Cluster Solution with Number of Customers Per Segment
If one cluster contains a significant portion of the data, the cluster solution has potential for improvement. Figure 5 exhibits a case in which other cluster solutions other than a 5 cluster solution could prove to be a more useful segmentation of customers.
After identifying distinctive clusters of personal customers, it is important to classify the customer sub-groups based on behavioral differences. It is easier to detect behavioral differences between clusters using visualizations. SAS Visual Analytics is a great tool for generating both static and interactive plots to gain insight into the cluster segments.
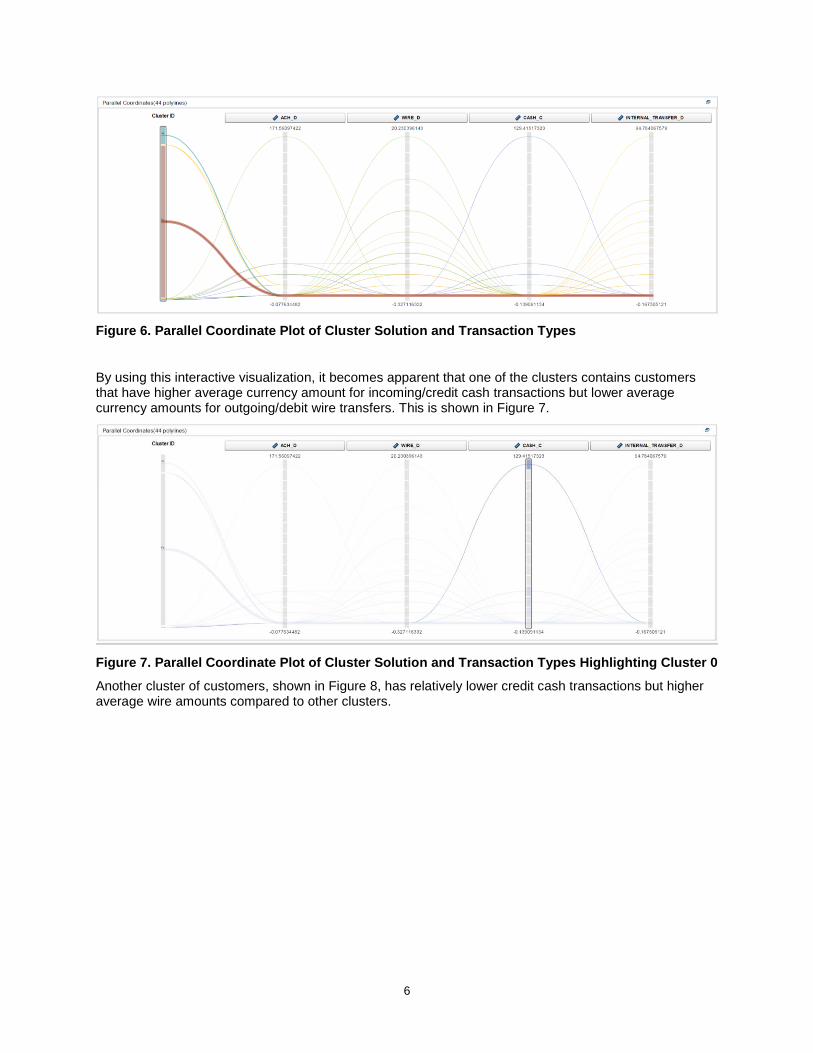
One useful visualization is a parallel coordinate plot. This is shown in Figure 6 below. This interactive visualization shows generalized customer attributes within each cluster. The vertical bar on the left hand side contains color-coded clusters. The relative cluster bar size indicates the number of customers within each cluster. The remaining vertical bars each represent a transaction type, and represent an axis ranging from the minimum to maximum standardized value per average customer.
6
Figure 6. Parallel Coordinate Plot of Cluster Solution and Transaction Types
By using this interactive visualization, it becomes apparent that one of the clusters contains customers that have higher average currency amount for incoming/credit cash transactions but lower average currency amounts for outgoing/debit wire transfers. This is shown in Figure 7.
Figure 7. Parallel Coordinate Plot of Cluster Solution and Transaction Types Highlighting Cluster 0
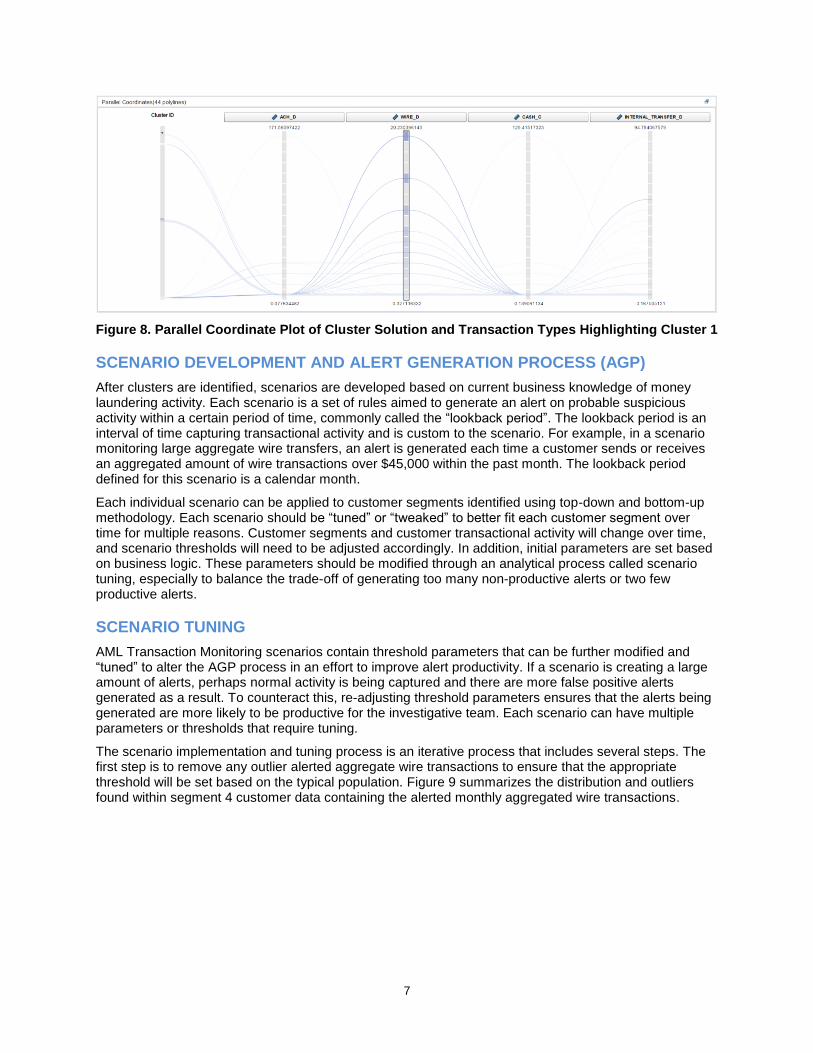
Another cluster of customers, shown in Figure 8, has relatively lower credit cash transactions but higher average wire amounts compared to other clusters.
7
Figure 8. Parallel Coordinate Plot of Cluster Solution and Transaction Types Highlighting Cluster 1
SCENARIO DEVELOPMENT AND ALERT GENERATION PROCESS (AGP)
After clusters are identified, scenarios are developed based on current business knowledge of money laundering activity. Each scenario is a set of rules aimed to generate an alert on probable suspicious activity within a certain period of time, commonly called the “lookback period”. The lookback period is an interval of time capturing transactional activity and is custom to the scenario. For example, in a scenario monitoring large aggregate wire transfers, an alert is generated each time a customer sends or receives an aggregated amount of wire transactions over $45,000 within the past month. The lookback period defined for this scenario is a calendar month.
Each individual scenario can be applied to customer segments identified using top-down and bottom-up methodology. Each scenario should be “tuned” or “tweaked” to better fit each customer segment over time for multiple reasons. Customer segments and customer transactional activity will change over time, and scenario thresholds will need to be adjusted accordingly. In addition, initial parameters are set based on business logic. These parameters should be modified through an analytical process called scenario tuning, especially to balance the trade-off of generating too many non-productive alerts or two few productive alerts.
SCENARIO TUNING
AML Transaction Monitoring scenarios contain threshold parameters that can be further modified and “tuned” to alter the AGP process in an effort to improve alert productivity. If a scenario is creating a large amount of alerts, perhaps normal activity is being captured and there are more false positive alerts generated as a result. To counteract this, re-adjusting threshold parameters ensures that the alerts being generated are more likely to be productive for the investigative team. Each scenario can have multiple parameters or thresholds that require tuning.
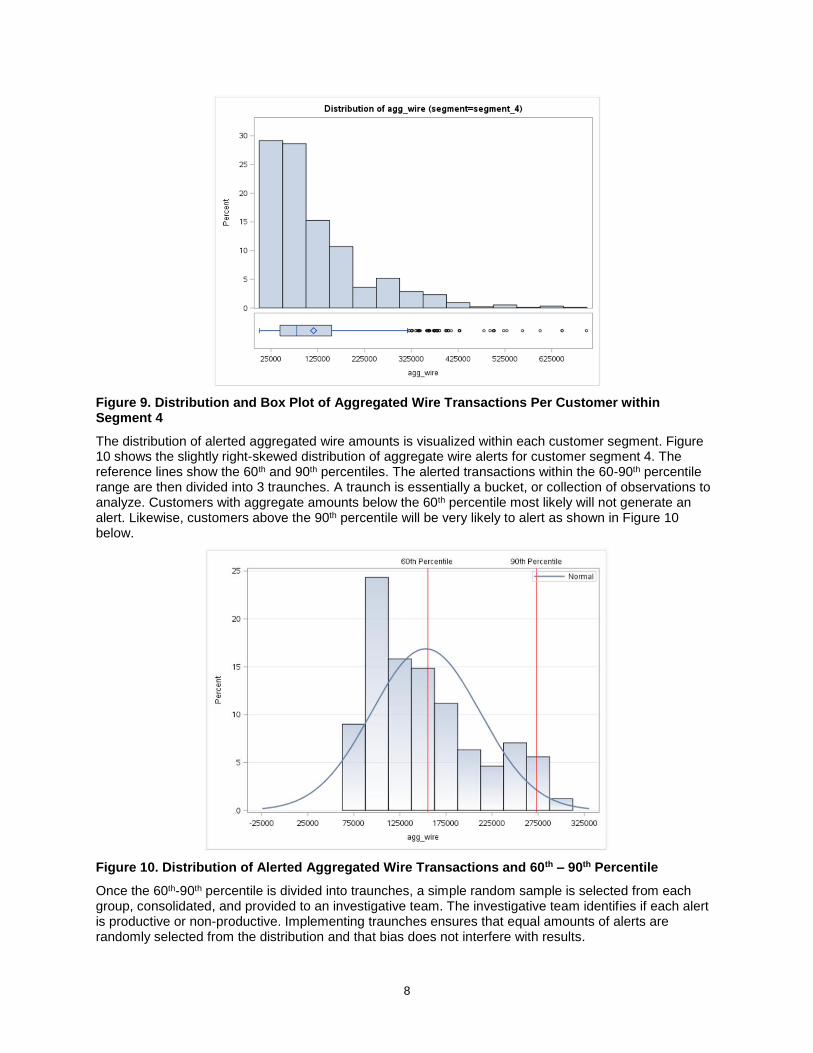
The scenario implementation and tuning process is an iterative process that includes several steps. The first step is to remove any outlier alerted aggregate wire transactions to ensure that the appropriate threshold will be set based on the typical population. Figure 9 summarizes the distribution and outliers found within segment 4 customer data containing the alerted monthly aggregated wire transactions.
8
Figure 9. Distribution and Box Plot of Aggregated Wire Transactions Per Customer within Segment 4
The distribution of alerted aggregated wire amounts is visualized within each customer segment. Figure 10 shows the slightly right-skewed distribution of aggregate wire alerts for customer segment 4. The reference lines show the 60th and 90th percentiles. The alerted transactions within the 60-90th percentile range are then divided into 3 traunches. A traunch is essentially a bucket, or collection of observations to analyze. Customers with aggregate amounts below the 60th percentile most likely will not generate an alert. Likewise, customers above the 90th percentile will be very likely to alert as shown in Figure 10 below.
Figure 10. Distribution of Alerted Aggregated Wire Transactions and 60th – 90th Percentile
Once the 60th-90th percentile is divided into traunches, a simple random sample is selected from each group, consolidated, and provided to an investigative team. The investigative team identifies if each alert is productive or non-productive. Implementing traunches ensures that equal amounts of alerts are randomly selected from the distribution and that bias does not interfere with results.
9
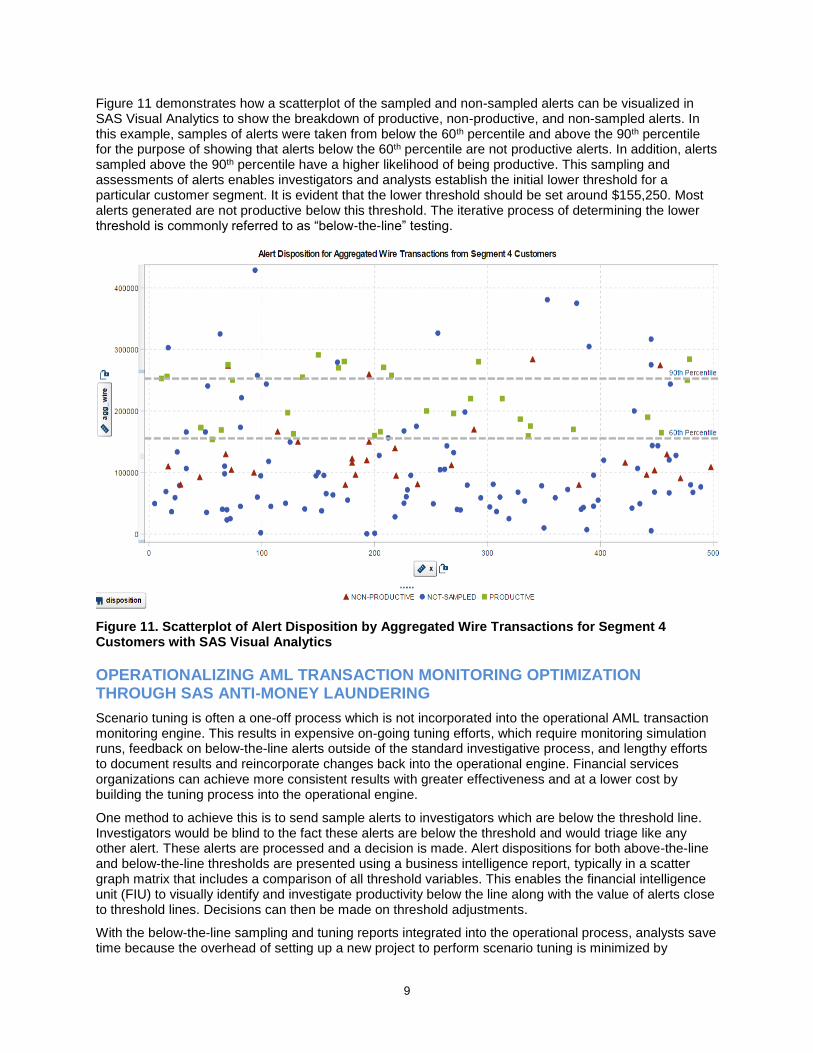
Figure 11 demonstrates how a scatterplot of the sampled and non-sampled alerts can be visualized in SAS Visual Analytics to show the breakdown of productive, non-productive, and non-sampled alerts. In this example, samples of alerts were taken from below the 60th percentile and above the 90th percentile for the purpose of showing that alerts below the 60th percentile are not productive alerts. In addition, alerts sampled above the 90th percentile have a higher likelihood of being productive. This sampling and assessments of alerts enables investigators and analysts establish the initial lower threshold for a particular customer segment. It is evident that the lower threshold should be set around $155,250. Most alerts generated are not productive below this threshold. The iterative process of determining the lower threshold is commonly referred to as “below-the-line” testing.
Figure 11. Scatterplot of Alert Disposition by Aggregated Wire Transactions for Segment 4 Customers with SAS Visual Analytics
OPERATIONALIZING AML TRANSACTION MONITORING OPTIMIZATION THROUGH SAS ANTI-MONEY LAUNDERING
Scenario tuning is often a one-off process which is not incorporated into the operational AML transaction monitoring engine. This results in expensive on-going tuning efforts, which require monitoring simulation runs, feedback on below-the-line alerts outside of the standard investigative process, and lengthy efforts to document results and reincorporate changes back into the operational engine. Financial services organizations can achieve more consistent results with greater effectiveness and at a lower cost by building the tuning process into the operational engine.
One method to achieve this is to send sample alerts to investigators which are below the threshold line. Investigators would be blind to the fact these alerts are below the threshold and would triage like any other alert. These alerts are processed and a decision is made. Alert dispositions for both above-the-line and below-the-line thresholds are presented using a business intelligence report, typically in a scatter graph matrix that includes a comparison of all threshold variables. This enables the financial intelligence unit (FIU) to visually identify and investigate productivity below the line along with the value of alerts close to threshold lines. Decisions can then be made on threshold adjustments.
With the below-the-line sampling and tuning reports integrated into the operational process, analysts save time because the overhead of setting up a new project to perform scenario tuning is minimized by
10
automating the documentation process though scenario tuning reports. Not all AML transaction monitoring engines allow for this approach. Selecting an engine that provides custom scenario tuning flexibility should be a factor considered in AML technology vendor selection. The SAS Anti-Money Laundering solution provides an open approach that lends itself to the operationalization of the scenario tuning process.
CONCLUSION
Financial institutions commonly face challenges with the overwhelming task of maintaining an effective AML monitoring program within tight budgetary guidelines. In order to effectively monitor and mitigate money laundering risk, business analysts can use SAS products such as SAS Enterprise Guide ©, SAS Studio ©, SAS Visual Analytics ©, and SAS Enterprise Miner © to apply top-down and bottom-up methodologies coupled with scenario development and tuning approaches to establish a more targeted approach to AML Transaction Monitoring. By implementing the methodologies outlined within this paper, financial institutions can drastically improve the productivity of their investigative teams to effectively identify and report financial crime.
CONTACT INFORMATION
Your comments and questions are valued and encouraged. Contact the authors at:
Leigh Ann Herhold Zencos Consulting (919) 237-9079 [email protected] Stephen Overton Zencos Consulting (919) 341-9667 http://stephenoverton.net [email protected] Eric Hale Zencos Consulting (919) 619-6000 [email protected]
SAS and all other SAS Institute Inc. product or service names are registered trademarks or trademarks of SAS Institute Inc. in the USA and other countries. ® indicates USA registration.
Other brand and product names are trademarks of their respective companies.