Embed Size (px)
DESCRIPTION
Optimized Air Intake for a Turbocharged EngineTaking into Account Water-Cooled Charge AirCooler Reflective Properties for Acoustic Tuning
Citation preview

ABSTRACTUnsteady intake wave dynamics have a first order influenceon an engine's performance and fuel economy. There is anabundant literature particularly for naturally aspirated SIengines on the subject of intake manifolds and primaryrunner lengths aimed to achieve a tuned intake air line. Amore demanding design for today's engines is to increaseefficiency to meet the requirements of lower fuelconsumption and CO2 emissions. Today's tendencies aredownsizing the engine to meet these demands. And fordrivability purposes, the engine is combined with aturbocharger coupled with a charge air cooler. However,when the engine's displacement is reduced, it will be verydependent on its boosting system. A particularly interestingpoint to address corresponds to the engine's operation in thelow speed range and during transients where the engine haslarge pumping losses and poor boost pressure. This operationpoint can be optimized using acoustic supercharging
techniques. The proposed solution for a turbocharged engineis through an optimized air intake system from thecompressor outlet to the intake valves. In this paper such adedicated line is experimentally proposed on a four cylinderDiesel engine. First the reflective properties of a water-cooledcharge air cooler are highlighted and compared to atraditional air charge cooler. This was done experimentallyon an engine test bench using wave decomposition techniquesthrough forward and backward components. Secondly thisreflection is put to use by employing an adequate pipe lengthbetween the intake manifold and the charge air cooler aimedto improve low end torque and transient response. A series ofpipe lengths were investigated and a final one is shown togive the greatest pressure wave amplitudes upstream of theintake valves for a low rpm range where the compressorprovides little work. As a result it is shown that acoustictuning is still possible on a turbocharged engine with areduced plenum volume thus keeping costs low. Finally aGT-Power model of the engine is built where the exhaust andintake lines were correctly modeled. Then, the dynamics of
Optimized Air Intake for a Turbocharged EngineTaking into Account Water-Cooled Charge AirCooler Reflective Properties for Acoustic Tuning
2013-01-0575Published
04/08/2013
Haitham MezherMann + Hummel - Ecole Centrale de Nantes
Jerome Migaud, Vincent Raimbault and Jean-Gabriel LelongMann + Hummel
David Chalet and Nicolas PerrotEcole Centrale De Nantes
Alexandre HunaultMann + Hummel
Pascal ChesseEcole Centrale De Nantes
Bernhard HuurdemanMann + Hummel
Copyright © 2013 SAE International
doi:10.4271/2013-01-0575
Downloaded from SAE International by Automotive Research Association of India, Friday, August 01, 2014

intake system were replaced by an artificial excitationboundary which can be controlled independently and wouldcorrectly interact with the intake valves. Thus the optimizedpressure waves obtained from the experimentalmeasurements are fed directly into the intake of the model.The latter calculates the mean value of pressure only.Therefore rendering possible the prediction of the CO2 gainobtained from such an optimized line.
INTRODUCTIONThe automotive business has always been shaped by nationaland global political and economic conditions. These includefurther reduction in the traditional exhaust emissioncomponents such as NOx, CO, HC and participates for Dieselengines, with the addition of a relatively new limit to the list:CO2 emissions. It is interesting to note that the CO2 emissionlegislations are in the process of converging for the differentregions of the world. The proposed carbon dioxide emissionsfor the EU for 2015 is 130 g/Km [1], a value expected todecline even more in the coming years. The severe newemission regulations along with the major focus on carbondioxide, combined with the emergence of a real world testcycle impact the development and technological trends oftoday's internal combustion engines. The response of theautomotive community to this set of new challenges isthrough downsizing using direct injection and turbocharging.The so-called ‘extreme downsized’ engines are today'ssolution to combat the CO2 emissions and consumptiondemands.
An additional consumer preference, which remains constant,will always be dynamic responsiveness depicted by low andmid-speed torque with low fuel consumption. One of themain areas in engine development that allows addressingthese demands is through manifold tuning and wave actiontechniques [2]. The idea behind the air intake design is toprovide a high pressure at the intake valve so that the massflow into the cylinders is increased at a given engine speed.This is particularly true when timed correctly in such a wayto have maximum pressure just before intake valve closing[3] thus benefiting of the ‘inertia ram effect’.
This effect of acoustic tuning and influence of wave action onthe volumetric efficiency of an engine was largely studied bymany authors. Desmet [4] established a relationship betweenthe mass flow aspirated by the engine, the instantaneouspressure upstream of the intake valve and the piston stroke.This relationship enabled the calculation of the volumetricefficiency and highlighted the influence of the resonantfrequency of the intake system on the emptying and filling ofthe cylinders. Engelman [5] found that the exact correlationbetween the engine speed and the natural frequency of theresonating system is dependent on the engine valve timing.Matsumoto et al. [6] and Ohata et al. [7] employed one-dimensional acoustic modeling of the resonant frequencies of
a naturally aspirated four cylinder engine. Another frequencymodeling based on a transfer function approach wasemployed by Chalet et al. [8]. This model linked pressurefluctuations to the mass flow excitation created by the intakevalve. The effect of mean flow was taken into considerationusing dedicated damping parameters and the transfer functionwas measured on a ‘dynamic flow bench’ at Mann+Hummel[9]. Furthermore, the multi-frequency aspect of the pressureoscillations at the intake is taken into consideration byincorporating the resonant frequencies identified on thebench. The final model enabled an engine simulation bycoupling the transfer function in a Simulink environment toGT-Power [10]. The frequency based engine modeling wasused to predict volumetric efficiency curves and highlightmanifold tuning properties such as self induction versusinterference effects and primary runner lengths. In downsizedturbocharged engines, this effect of ‘acoustic tuning’ isusually passed aside in the favor of simpler techniques thanwave action calculations. This is because the components ofthe turbocharger act as filters to the waves, and ‘force’ thegas into the cylinders. Therefore it was thought that suchengines are less susceptible to wave effects [11] [12], wherethe desired pressure level is essentially produced by thecompressor. Although this facilitates the downsizing ofengines, there are some characteristics that fall short ofmeeting the required performance targets. One of these isperformance at low engine speeds where turbochargedengines produce less torque than a naturally aspirated enginewith comparable power. This is due to the fact that theavailable exhaust enthalpy is insufficient to meet the needs ofthe compressor and prevent stalling. Also, the transientresponse of a turbocharged engine is slower than that of anaturally aspirated engine due to the time the turbine requiresto reach sufficient rotational speed thus contributing toturbocharger inertia. The result is that such engines rapidlybecome highly dependent on their matched boosting system.Banisoleiman et al. [13] indicated that matching theturbocharger for full load efficiency often leads to inadequateboost pressures at low engine speeds. This aspect isdetrimental to transient response and increases fuelconsumption, it is therefore worth investigating more closely.
This amounts to improving the volumetric efficiency at lowspeed where any increase in volumetric efficiency is directlyrecuperated as low end torque improvement. In theirinvestigation of the acoustics of a racing engine intakesystem, Harrison et al. [14] have shown that inertia rameffects make a strong contribution to the intake process athigh engine speeds whereas acoustic resonance effects aremore important at low engine speeds. This means that thislow end torque (usually below 1500 rpm) requires tuning to awave reflection that is far enough for it to induce acousticsupercharging at these speeds. This wouldn't be the case ofprimary runners with a large manifold volume for it wouldrequire extremely long runners [15] especially with theincreased air density at the compressor's outlet. On the other
Downloaded from SAE International by Automotive Research Association of India, Friday, August 01, 2014

hand, Watson [16] and Sato et al. [17] showed that is thuspossible to tune the intake air line for the case of aturbocharged Diesel engine. In fact, the first discontinuityafter the plenum where a wave reflection can be considered isat the charge air cooler (CAC). The charge air cooler reducesthe temperature of the air entering the engine, and henceincreases its density; it introduces a pressure dropdownstream of the compressor [18]. From a dynamic point ofview, the CAC restricts the passage of pressure waves fromthe engine to the compressor, so in a way it isolates thecompressor from the rest of the manifold. This property ofthe charge air cooler is dependent on the geometry of thelatter. A technique based on wave decomposition methods[19] is presented which enabled the measurement of thepropagation properties of the CAC by means of the reflectioncoefficient [20]. This enables the quantification of thereflection of waves emitted by the intake valves at theboundary with the intercooler. This was done experimentallyon an engine test rig, where a four-cylinder turbocharged1.5L engine is driven without combustion with an electricmotor. The boost pressure is controlled by an independentsystem that provides the sufficient pressure and temperatureto turn the turbine wheel. The engine thus acts as a pulsegenerator.
Once the existence of an important reflection is validated forthe case of a traditional air to air charge cooler, the latter wasreplaced by a water cooled charge air cooler often referred toas indirect charge air cooler. Water cooled CAC are more andmore considered in today's engine intake architectures thanksto their improved packaging and efficient low temperaturecooling.
It is shown that such intercoolers also have important wavereflection properties similar to their air to air counterparts.The reflection comparison with a traditional air to air CACwas done in a way to have the same average chargetemperature downstream of the CAC. This way the geometryof the two systems would be only considered. After that, it isshown that is possible to make use of gas dynamic tuningeffects by varying the lengths between the CAC outlet andthe intake valves. A series of experimental tests were done at1250 RPM where this length was modified and a finaloptimal length is chosen. The original plenum was keptunchanged. This was done for both charge air coolers.
A current design consideration is the integration of the watercooled charge air cooler in the intake manifold. The idea isreducing the pressure drop between the compressor outlet andthe engine intake valves. A similar configuration was testedexperimentally where the indirect CAC is mounted very closeto the engine's manifold. For each of the experimental test,pressure measurements in the plenum are recorded and animproved volumetric efficiency is correlated to increasedpressure amplitudes.
On the other hand, the pressure traces are then recovered andimplemented to a GT-Power model of the engine. In thismodel, the exhaust is correctly modeled and calibrated andthe pressure signals at the intake are replaced with thoseexperimentally measured using a virtual GT-power boundary.
A GT-Power model is then used to simulate a transientresponse of a vehicle from 1000 rpm to 2000rpm under fullload conditions. The effect of the different geometries ofCAC as well as the length between the intercooler exit andthe intake manifold on engine transient response and low endtorque is studied and explained.
EXPERIMENTAL SETUPThe experimental setup consists of using a four cylinderengine as pulse generator in order to track the propagation ofwaves across the intake system. The air intake comprises ofan air filter, turbocharger unit, a charge air cooler CAC andthe associated connecting tubes. The 1.5L engine has an 8valves arrangement and a compression ratio of 18.8: 1. Itsrotational speed is controlled via an electric motor coupledvia a transmission line to the engine's crankshaft. Because theengine is run without combustion, it is necessary to operateand control the turbocharger independently. This was done byregulating the input variables on the turbine side. In otherwords, the turbine is run separately from the exhaust as if itwas on a traditional gas stand. A high power industrialcompressor and an electric heater provided the pressure andtemperature levels required to simulate normal operatingconditions. A full load situation was considered, thus thepressure and temperature at the inlet of the turbine wereclosely controlled in a way to satisfy these demands. Theoriginal intake system from the compressor outlet to theplenum inlet was replaced with a series of tubes and bends.These tubes are interchangeable and thus permit to changethe length upstream L1 and downstream L2 of the charge aircooler respectively. This will highlight the effect of theselengths on engine performance. Figure 1 gives a schematicrepresentation of the engine test rig. The intake system wasequipped with seven piezoresistive Kistler 4043 dynamicpressure sensors. Two sensors p1 and p2 are located in therelatively reduced intake plenum volume, whereas the otherfive are distributed upstream and downstream of the CAC.The first cylinder was also equipped with a Kistler 601pressure sensor. The in-cylinder pressure measurement wasused to locate TDC. The TDC point is used as a starting pointfor the data acquisition thanks to an incremental encoderfitted to the engine's crankshaft. The sampling frequency wasfixed at 25KHz.
A hot wire anemometer downstream of the filter air boxenables a mean measurement of the mass flow Qm.Thermocouples fitted at the inlet and outlet of the intercoolermeasure temperature. The combination of mean mass flow,temperature and pressure will allow the calculation of the
Downloaded from SAE International by Automotive Research Association of India, Friday, August 01, 2014

corresponding Mach number for each test case. The air to aircharge cooler was cooled by a system of spiral watersprinklers, whereas the indirect charge air cooler was cooledusing its own water paths. The temperature gradient acrossthe intercoolers is maintained constant for the different testcases and geometries of charge air coolers by regulating thewater flow rate in both cases. Since low end torque is ofinterest, seven operating speeds were chosen ranging from1000 rpm to 2250 rpm.
Figure 1. Schematic representation of the experimentalengine rig
The corresponding boost pressure Pboost is given in Table 1.This value of boost pressure is reached by regulating the inletpressure on the turbine side, i.e. the intake pressure wasmonitored while changing the turbine inlet pressure using anindustrial air compressor. An inlet turbine temperature ofaround 220°C was maintained to prevent icing conditions atthe turbine exit. The turbine has a wastegate control that waskept closed throughout the tests. The goal here is to study theintake and its influence on engine performance. As statedbefore, the turbine was separated from the engine. This isbecause this particular bench employs different engines aspulse generators and enables a quick characterization ofintake wave dynamics.
For this Diesel engine with no valve overlap, exhaustbackpressure has little influence on intake pressure dynamicsor dynamic component, the latter being mainly influenced bythe valve action itself and the operating speed. On the otherhand, by decoupling the exhaust line from the engine, theinfluence of exhaust backpressure on mean pumping work isnot adequately taken into account in this experiment.However it will be sufficiently modeled in the subsequentGT-Power simulation. This is because the mean intakepressure will be correctly modeled in GT-Power as it will beexplained later on. That being said, this experimental setuponly serves as a characterization of the dynamic intakecomponents. The temperature of the ambient air is around
25°C. The water flow through the indirect cooler wascontrolled in way to achieve similar exit temperatures to theones recorded with the air to air cooler. This way the effect oftemperature on wave propagation is minimized and the effectof the geometry is highlighted.
Table 1. Engine speed and corresponding boost pressure
The internal diameter of L1 and L2 is equal to 28mm. Thedistance between sensors p3 and p4 is equal to d34 = 125mm,whereas the distance between p4 and p5 is equal to d45 =95mm. On the hot air side, the distance between sensors p6and p7 is 220mm.
Influence Of L1
This series of length investigation was done using bothcharge coolers. L2 was kept at a constant length of 0.9m,whereas L1 was changed. The shortest length for L1 in thecase of the air to air charge cooler is 0.9m because of thenecessity to keep the intercooler leveled for cooling purposes:the sprinkler system would only be efficient when leveled.On the other hand, for the indirect cooler it was possible tomount it close to the plenum (L1 = 0.2m). This way it waspossible to emulate an integrated charge air cooler design.The proposed test lengths for L1 are: 0.9m, 1.3m, 1.5m, 1.6m,1.7m, 1.9m and 2.9m as the longest length. The added lengthsare set up in vertically as shown in Figure 2.
The influence of the length on the volumetric efficiency isinterpreted via GT-Power from the instantaneous pressurerecordings from pressure sensor p1 located in the tubularplenum. It is clear that the optimal length of L1 for acoustictuning is dependent on engine speed. As stated before, themain goal here is to improve low end torque where thecompressor does little or no work. For high speeds, thecontrol of the wastegate or turbine geometry in the case of avariable geometry turbocharger would insure the requireboost pressure, the enthalpy in the exhaust gases being highenough. An operating speed is particularly chosen, it is that of1250 rpm. Improving the volumetric efficiency at this speedwould yield acceptable results over the low end rangeroughly from idle to around 1750 rpm. The required boostpressure at this speed is 1.504 bar, the series of pipe lengthswere investigated and for each case a comparison was madefor the pressure p1 at the intake plenum. Figure 3 shows theeffect of pipe length on the dynamic pressure recordings forthe air to air charge cooler.
Downloaded from SAE International by Automotive Research Association of India, Friday, August 01, 2014
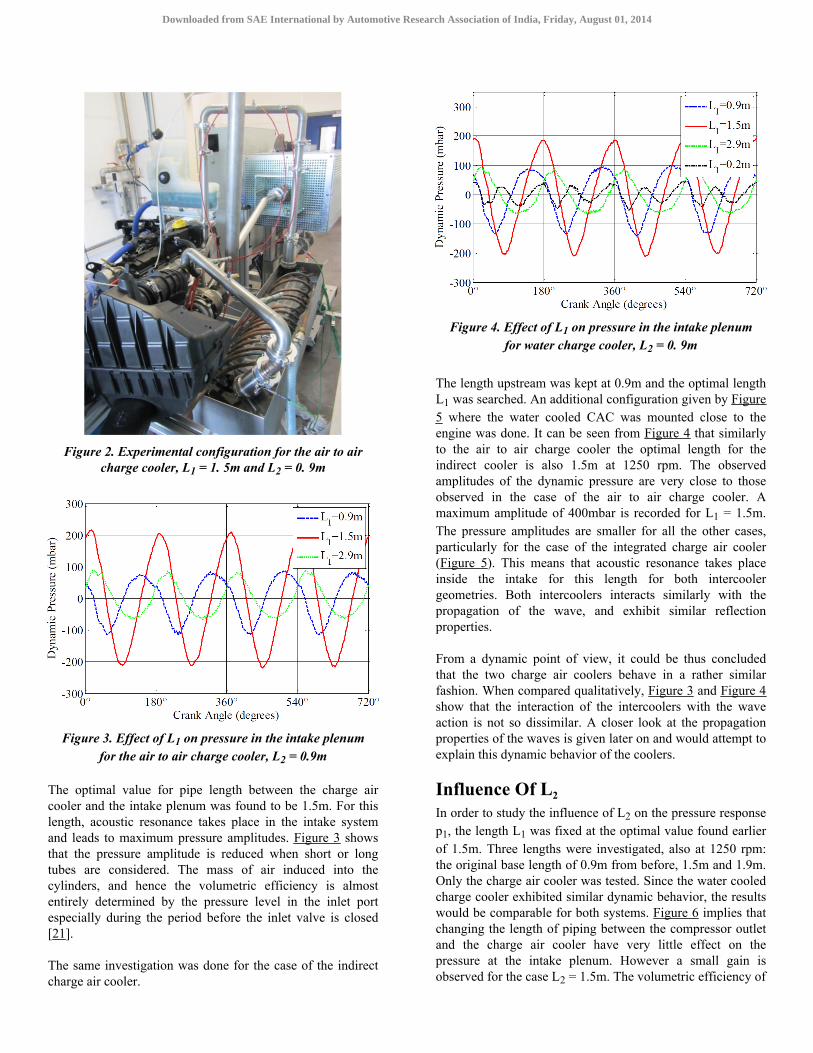
Figure 2. Experimental configuration for the air to aircharge cooler, L1 = 1. 5m and L2 = 0. 9m
Figure 3. Effect of L1 on pressure in the intake plenumfor the air to air charge cooler, L2 = 0.9m
The optimal value for pipe length between the charge aircooler and the intake plenum was found to be 1.5m. For thislength, acoustic resonance takes place in the intake systemand leads to maximum pressure amplitudes. Figure 3 showsthat the pressure amplitude is reduced when short or longtubes are considered. The mass of air induced into thecylinders, and hence the volumetric efficiency is almostentirely determined by the pressure level in the inlet portespecially during the period before the inlet valve is closed[21].
The same investigation was done for the case of the indirectcharge air cooler.
Figure 4. Effect of L1 on pressure in the intake plenumfor water charge cooler, L2 = 0. 9m
The length upstream was kept at 0.9m and the optimal lengthL1 was searched. An additional configuration given by Figure5 where the water cooled CAC was mounted close to theengine was done. It can be seen from Figure 4 that similarlyto the air to air charge cooler the optimal length for theindirect cooler is also 1.5m at 1250 rpm. The observedamplitudes of the dynamic pressure are very close to thoseobserved in the case of the air to air charge cooler. Amaximum amplitude of 400mbar is recorded for L1 = 1.5m.The pressure amplitudes are smaller for all the other cases,particularly for the case of the integrated charge air cooler(Figure 5). This means that acoustic resonance takes placeinside the intake for this length for both intercoolergeometries. Both intercoolers interacts similarly with thepropagation of the wave, and exhibit similar reflectionproperties.
From a dynamic point of view, it could be thus concludedthat the two charge air coolers behave in a rather similarfashion. When compared qualitatively, Figure 3 and Figure 4show that the interaction of the intercoolers with the waveaction is not so dissimilar. A closer look at the propagationproperties of the waves is given later on and would attempt toexplain this dynamic behavior of the coolers.
Influence Of L2
In order to study the influence of L2 on the pressure responsep1, the length L1 was fixed at the optimal value found earlierof 1.5m. Three lengths were investigated, also at 1250 rpm:the original base length of 0.9m from before, 1.5m and 1.9m.Only the charge air cooler was tested. Since the water cooledcharge cooler exhibited similar dynamic behavior, the resultswould be comparable for both systems. Figure 6 implies thatchanging the length of piping between the compressor outletand the charge air cooler have very little effect on thepressure at the intake plenum. However a small gain isobserved for the case L2 = 1.5m. The volumetric efficiency of
Downloaded from SAE International by Automotive Research Association of India, Friday, August 01, 2014

the engine would be minimally affected when L2 is changed.In fact, the charge air cooler presents a discontinuity for thesystem of standing waves that takes place at any given enginespeed.
Figure 5. Experimental configuration for the integratedwater charge cooler design L1 = 0.2m
Figure 6. Effect of L2 on pressure in the intake plenumfor the air to air charge cooler, L1 = 1. 5m
The CAC prevents the transmission of the wave action, thisphenomena will be highlighted with the calculation of thereflection coefficient.
REFLECTION COEFFICIENTEVALUATIONThis section will attempt to explain using reflectioncoefficient measurements the observed behavior of thepressure at the plenum after changing the lengths upstreamand downstream of the charge air coolers. When sufficientlysmall cross dimensions are considered in such a way toremain below the first cutoff frequency of the tube [22],pressure waves travel as plane waves. The system of standingwaves that is established in the intake of a reciprocatingengine can be described as the superposition of forward andbackward sinusoidal components. The pressure p(x, ω) at anygiven abscissa x is given by equation (1) in the frequencydomain [23]. Pressure sensor p3 of Figure 1 is chosen as theorigin of abscissa x with the positive direction from right toleft, i.e. from the intake valves to the charge air coolers.
(1)
ω = 2π f is the angular velocity, f the frequency vector. P+
and P− are complex values of the pressure amplitudes for theforward and backward waves respectively. β+ and β− arerespectively the direct and reverse complex wave numbers[23], they are given by equation (2) where k is the wavenumber given by equation (3); c0 being the speed of soundcalculated from the local temperature Tout.
(2)
(3)
α is known as the visco-thermal attenuation coefficient,Davies [24] gives a widely acceptable value for thiscoefficient. M is the Mach number calculated from equation(4) using the mean mass flow information Qm given by thehot wire anemometer, the measured temperature Tout, theinternal diameter d = 28mm and the mean value of boostpressure Pboost given from Table 1. r being the ideal gasconstant and γ the ratio of specific heats.
(4)
Writing equation (1) for pressure at points 3 and 4 forinstance using the autospectra S(x, ω) of p3 and p4respectively with x3 as the origin of abscissa yields equations(5) and (6).
Downloaded from SAE International by Automotive Research Association of India, Friday, August 01, 2014

(5)
(6)
Cross calibration of the different sensors enables amplitudeand phase correction thus improving coherence between thesignals. Solving the previous equations simultaneously yieldsthe pressure reflection coefficient R at point 3 defined as theratio of reverse and direct wave amplitudes, it is given byequation (7).
(7)
Equations (5) and (6) can also be written for two other pairsof pressure sensors downstream of the CAC: p3, p5 and p4,p5. For each pair of sensors the reflection coefficient iscalculated at point 3 for a given frequency range. The finalreflection coefficient is obtained by averaging the resultsfrom the three pairs of sensors. This yields a more robustcalculation for the reflection coefficient notably for the lowfrequency range which is the region of interest for enginefilling purposes. For both systems, the engine was run from1000 rpm to 3500 rpm with 100 rpm steps. For each speedthe reflection coefficient was measured using the calculationprocedure explained above. To gain more insight of the effectof the charge air cooler on the acoustics of the intake it isuseful to plot the energy reflection coefficient RE. Peters etal. [25] define the energy reflection coefficient given byequation (8).
(8)
Figure 7 shows the measured energy reflection coefficient forboth intercoolers. The frequency bandwidth is limited to 120Hz, this value is more than enough to study engine fillingcharacteristics. In fact the second order harmonics for thisengine take place below the 120 Hz frequency.
It can be seen from Figure 7 that both systems haveextremely close values of reflection coefficients. Thisexplains why the length L1 = 1.5m gave the same order ofmagnitude of pressure amplitudes at 1250 rpm for bothsystems, the optimal length for acoustic tuning being not sofar from this value. Values for the reflection coefficient aregreater than 0.65 for the entire engine speed range. And whencompared to measurements made to an open pipe in thepresence of mean flow [26] it can be concluded that thecharge air coolers termination behaves very much like a tubewith a section change to a bigger volume. Figure 7 alsoshows that the water cooled charge cooler which offers morepermeability and better heat transfer on one hand does not
degrade the reflection properties on the other. The possibilityfor acoustic tuning exists for this system as well. It is alsoimportant to notice that the measured reflection wascalculated for a similar exit temperature for both systems.This was done in order to investigate solely the effect of thegeometry on the wave action. In a real scenario the indirectcooler is expected to achieve a bigger temperature gradientand cool the compressed gases further. Such a discontinuitycould induce larger values for the reflection coefficientbecause of the impedance discontinuity created by such atemperature gradient [22].
Figure 7. Energy reflection coefficient measurement forboth systems
SIMULATIONGT-Power was used to perform an engine simulation andgain more insight into the effect of the intake architecture of aturbocharged engine on low end torque response andconsumption. Normally charge air coolers are modeled inGT-Power with a series of parallel tubes and ‘flowsplits’.Flowsplits and pipes are capable of accurately predicting thewave action, however they absolutely need to be calibratedagainst experimental data for a given intake system; i.e. whenchanging the lengths upstream and downstream of the CAC itis often necessary to re-calibrate the model for the CAC, andthis is often required for the different speeds. The CACmodel in GT-Power would be more accurate for a givenengine speed (closest to the calibration conditions) and lessaccurate otherwise. The goal in this paper was not toelaborate an accurate GT-Power of the charge air coolersusing experimental techniques but rather to precisely studythe effect of wave action on a Diesel turbocharged engine ifthe mean boost pressure maps were correctly maintained atthe desired levels using VTG control. This is why the choicewas made to model the pressure drop (mean levels) of theintake only for the different cases and to utilize the dynamicpressure from the experimental measurements. This way thewave action in GT-Power is correctly represented. Theexhaust system was kept unchanged from the original one.Thus exhaust influence such as exhaust backpressure and
Downloaded from SAE International by Automotive Research Association of India, Friday, August 01, 2014

temperature would be represented. This gives good bases forcomparison. This methodology consists of using the realexperimental pressure data measured at point 3 of Figure 1 asan input to the GT-Power model.
First a representative 1D model of the original engine withthe corresponding intake and exhaust systems was created.For this particular engine, the turbine is controlled using awastegate. For the GT-Power model, the turbine is modeledas a VTG to help the mean pressure control with theadjustment of the rack position. The fact that it is not thesame device that controls the mean pressure betweensimulation and testing is not an issue, as the purpose of thestudy is to show improvement in volumetric efficiency thanksto dynamic effects. The turbine model was implemented intoGT-Power with an active control that continuously adjusts therack position in order to maintain the desired boost pressurethat is set by the user and given by Table 1. This 1D model ofthe original engine was validated against experimental enginemeasurements.
GT-Power is used to calculate the mean boost pressureassured by the turbocharger for the different operatingspeeds. The dynamic component of the pressure is thenremoved, thus leaving the mean boost pressure which is givenby Table 1. An additional pressure source is then introduced;this source feeds the dynamic pressure signals experimentallyrecorded to GT-Power. The result is a simulation that utilizesthe experimental data of the different configurations andcharge air coolers. The simulation overcomes then thedifficulty of correctly modeling the dynamics of a charge aircooler geometry.
The transient simulation of the engine was done using theGT-Suite software. The recorded dynamic pressure traceswere fed in to the GT-Power model as explained earlier. Themean pressure value was taken from the intake side andsuperimposed to the dynamic pressure component whichcomes from experimental data. This was done for eachoperating engine speed. For each speed and each system, theGT-Power model generated BMEP, FMEP and BSFC results.These results are then used as input data to a GT-Suite modelof the vehicle. Additional data comprises of vehicle specs anddesired acceleration profile. The vehicle transientacceleration takes places during 3 stages: experimentalpressure recording on the electrically driven bench, GT-Power simulation for the different speeds and CACs, GT-Suite transient simulation using BMEP, FMEP and BSFCmaps. The transient behavior of the turbocharger or delaytime is not taken into account in this paper. However, at lowoperating speeds, the turbocharger provides no overpressureand an increase in volumetric efficiency at these speedswould lead to higher exhaust enthalpy and therefore a betterperformance of the turbocharger for the consequent operationat higher speeds.
Four cases were compared, the optimized cases (L1 = 1.5m)for the two intercoolers, the short intake for the air cooler (L1= 0.9m) and the forth case is the integrated water cooler (L1 =0.2m). For each case a simulation was run and break meaneffective pressure, friction and brake specific consumptionmaps were recovered as a function of engine speed.Mechanical components of a macro engine model, clutch andtransmission are added, calibrated and configured usingexisting commercial vehicle data such as vehicle curb weight,wheel diameter and drag coefficient. The engine model wasparameterized using the recovered maps.
The simulation consists of setting up a transient response ofthe engine using the following scenario: from a rolling speedof 17 Km/h at 1000 rpm zero initial charge at t = 0, the driverrequests full load at third gear. The simulation is interruptedfor a terminal speed of 34 Km/h or 2000 rpm, this is done tostudy the impact on low end torque and response time for theturbocharged Diesel engine.
Figure 8 shows the vehicle speed after the tip in from 1000rpm for the case of the air to air cooler. The final time isslightly better for the case of the optimized pipe for acousticresonance at 1250 rpm (L1 = 1.5m). However the differenceis not flagrant between the long pipe L1 = 1.5m and the shortone L1 = 0.9m. This can be explained by looking at thetorque response and engine volumetric efficiency curves.Figure 9 represents the low end torque of the engine duringthe tip in and Figure 10 gives the volumetric efficiency of theengine. The improvement in low end torque below 1500 rpmis correlated to the higher volumetric efficiency for the lowspeed region. This higher efficiency is due to the fact that theintake system length was optimized for 1250 rpm. Theshorter length L1 = 0.9m enables acoustic resonance at ahigher operating speed. This explains the higher volumetricefficiency for engine speeds greater than 1500 rpm where thecombination of acoustic tuning and high boost pressure givesan improvement in torque.
Figure 8. Vehicle speed with the air to air cooler
Downloaded from SAE International by Automotive Research Association of India, Friday, August 01, 2014

Two conclusions can be drawn, the first is that acoustictuning and wave action effects remain significant for aturbocharged engine and affect the volumetric efficiency.
The second is that an optimal length to achieve low endtorque has been established, it is that of L1 = 1.5m. And inorder to compensate for the torque deterioration after1500rpm in this case due to higher resonance modes, thevariable geometry of the turbine can be controlled to up theboost pressure. This strategy of turbine control wouldcompensate for this torque decrease while keeping a longtube to benefit from acoustic tuning at low engine speedswhere the turbocharger is mainly inactive.
Figure 9. Low end torque with the air to air chargecooler
Figure 10. Volumetric Efficiency for the air chargecooler
The second system is the indirect charge air cooler. The samesimulation was run and the acoustic effects of this geometryare highlighted. Figure 11 shows the time-to-torque plot forthe water charge cooler for the two setups: long pipe andintegrated cooler.
Figure 11 shows that when integrating the charge air cooler inthe plenum any acoustic effects are suppressed. For a given
boost pressure this gravely affects the low end region anddeteriorates the transient time response. When the long tubeis considered, low end torque is improved thanks to acoustictuning effects that become more prominent especially withthe poor boost pressure. The time to achieve 90% of the peaktorque is reduced by 21%, a significant increase in vehicleresponse time and drivability. Vehicle speed is plotted inFigure 12, the time to reach 2000rpm is reduced by almost6%.
Figure 13 shows the volumetric efficiency of the engine forthe two configurations of the water charge cooler. By keepingthe same boost pressure for both configurations, theimprovement of the engine filling for L1 = 1.5m is solely dueto acoustic effects.
Figure 11. Low end torque with the water charge cooler
Figure 12. Vehicle speed with the indirect cooler
This higher torque potential can be exploited by allowinglonger gear ratios which lead to lower engine operationspeeds through downspeeding. The application ofdownspeeding in a Diesel vehicle, in conjunction withoptimizing transmission gear ratios delivers improvement infuel economy that can reach 6.6% over the engine baseline[27]. Recent simulations [28] indicated a decrease in fuelconsumption between 7% and 8% for a steady state NEDC
Downloaded from SAE International by Automotive Research Association of India, Friday, August 01, 2014

simulation and between 3.1% and 3.7% for a detailedtransient NEDC model by applying downspeeding andoptimized gear change techniques to a supercharged andturbocharged engine. Thus extending the gear ratios for theoptimized intake for acoustic tuning would enable lower CO2emissions over the NEDC cycle.
Figure 13. Volumetric efficiency for the water chargecooler
SUMMARY/CONCLUSIONSThe intake system of a modern turbocharged engine wasinvestigated. This was firstly done using an experimental testbench at Mann+Hummel, this unique bench enabled thecontrol of intake boost pressure and charge temperature fortwo charge air cooler geometries: a standard air to air coolerand a new water cooled system. The experimental studyfocused on understanding the dynamic behavior of thepressure waves at the intake, notably the acoustic reflectionthat takes place at the interface of the charge air coolers.Different lengths were investigated and an optimal length wasobtained, this length enabled better volumetric efficiencyusing wave action phenomena. By making use of thisacoustic supercharging, a significant increase of low endtorque is observed. This was evaluated using a newmethodology developed in-house at Mann+Hummel wherethe experimental pressure data is recovered and used for theengine and vehicle simulation. The transient simulationenabled to quantify the gain obtained in the form of a reducedtime-to-torque and better low end response. Acoustic tuningenabled a higher volumetric efficiency of 6.7% at 1500rpm.This gave an improvement of 21% in the time-to-torqueresponse compared to the case where this tuning is not ideal.Such gain is crucial for drivability proposes especially for adownsized turbocharged engine that usually suffers fromturbo lag and poor tip in response at low engine speeds wherethe turbocharged is not sufficiently solicited by the exhaustgases. Indirect charge air coolers offer better permeabilityand lower charge temperatures, meaning higher air densities.And when coupled to an acoustically tuned air intake system,the result is huge benefits in terms of low end torque
improvement, lower fuel consumption and CO2 emissions.The gain could be exploited with dowspeeding and shiftingstrategies.
Future engine tests are planned and will also serve asadditional validation of the methodology, thus showing thepotential of acoustic tuning applied to a water-cooled chargeair cooler in terms of an optimized volumetric efficiency overthe entire speed range.
REFERENCES1. MOCK P. - “European Commission consultation onReducing CO2 emissions from road vehicles - Additionalcomments” - International Council on Clean Transportation,Washington DC, December 9, 2011.
2. WINTERBONE D.E. - “The theory of wave actionapproaches applied to reciprocating engines” - Internalcombustion engineering: science & technology, Science E.A., Ed., London, Weaving JH, 1990, p. 445-500.
3. BROOME D. - “Induction ram. Part 1, the inertia andwaves effects”, Automobile engineer, pp. 130-133, April1969.
4. DESMET B. - “Contribution à l'étude de l'influence ducircuit d'aspiration sur le remplissage d'un moteur diesel”.PhD Thesis, L'Université des Sciences et Techniques deLille, 1977.
5. ENGELMAN H. - “Design of a tuned intake manifold” -Proceedings of the ASME conference on Diesel and GasPower, ASME paper 73-WA/DGP-2, 1973.
6. Matsumoto, I. and Ohata, A., “Variable Induction Systemsto Improve Volumetric Efficiency at Low and/or MediumEngine Speeds,” SAE Technical Paper 860100, 1986, doi:10.4271/860100.
7. Ohata, A. and Ishida, Y., “Dynamic Inlet Pressure andVolumetric Efficiency of Four Cycle Four Cylinder Engine,”SAE Technical Paper 820407, 1982, doi: 10.4271/820407.
8. CHALET, D., MAHE, A., HETET, J.F. and MIGAUD, J.- “A new modeling approach of pressure waves at the inlet ofinternal combustion engines”. - Journal of Thermal Science,Vol. 20(n°2), pp. 181-188. DOI: 10.1007/s11630-011-0455-8, 2011.
9. CHALET, D., MAHE, A., MIGAUD, J. and HETET, J.F.- “A frequency modeling of the pressure waves in the inletmanifold of internal combustion”. - Applied Energy, Vol.88(n°9), pp. 2988-2994. ISSN 0306-2619, DOI: 10.1016/j.apenergy.2011.03.036, 2011.
10. CHALET, D., MAHE, A., MIGAUD, J. and HETET,J.F. - “Multi-frequency modeling of unsteady flow in the inletmanifold of an internal combustion engine” - Proc. IMechEPart D: J. Automobile Engineering, vol. 226, pp. 648-658,DOI: 10.1177/0954407011423745, 2012.
Downloaded from SAE International by Automotive Research Association of India, Friday, August 01, 2014

11. DZUNG L. - “Pressure pulsation at the intake of asupercharged internal combustion engine” - Brown BoveriRev, vol. 39, pp. 295-305, 1952.
12. RYTI M. - “Pulsation in the air intake systems ofturbocharged diesel engines” -Brown Boveri Rev., vol. 52,pp. 90-203, 1965.
13. BANISOLEIMAN K., SMITH L. and FRENCH B. -“The interaction of diesel engine turbocharging and tunedinlet manifold systems under steady state and transientoperation” -IMechE, Part A: Journal of Power and Energy,Vols. 0957-6509/91, pp. 269-281, 1991.
14. HARRISON M. and DUNKLEY A. - “The acoustics ofracing engine intake systems” - Journal of Sound andVibration, no. 271, pp. 959-984, 2004.
15. CSER G. - “Double Resonance System - a new way toimprove the low-speed operation of supercharged engines” -IMechE, no. C405/013, 1990.
16. WATSON N. - “Resonant intake and variable geometryturbocharging systems for a V-8 diesel engine” - J. PowerEnergy, vol. 197, no. Proc. Instn Mech. Engrs., Part A, pp.27-36, 1983.
17. Sato, A., Suenaga, K., Noda, M., and Maeda, Y.,“Advanced Boost-up in Hino EP100-11 Turbocharged andCharge-Cooled Diesel Engine,” SAE Technical Paper870298, 1987, doi: 10.4271/870298.
18. WINTERBONE D.E. and PEARSON R.J. - “Theory ofEngine Manifold Design: Wave Action Methods for ICEngines”. - Professional Engineering Publishing, 2000.
19. HARRISON M.F. and STANEV P. - “Measuring wavedynamics in IC engine intake systems” - Journal of Soundand Vibration, vol. 269, pp. 389-408, 2004.
20. BRUNEAU M. - “Manuel d'acoustique fondamentale” -ISBN 2-86601-712-9 ISSN 1264-4692, Paris: Hermes, 1998.
21. HEYWOOD J. B. - “Internal combustion EngineFundamentals” - Singapore: Mcgraw-Hill, 1988.
22. BOREL M. - “Les phénomènes d'ondes dans lesmoteurs” - Publications de l'IFP, Editions TECHNIP, 2000.
23. MUNJAL M. L. - “Acoustics of ducts and mufflers withapplication to exhaust and ventilation system design” - s.l.:John Wiley & Sons, 1987.
24. DAVIES P.O.A.L. - “Practical flow duct acoustic” -Journal of Sound and Vibration, Vol. 124(1), pp. 91-115,1988.
25. HISCHBERG P. M.C.A.M A., WIJNANDS A. andREIHNEN A.P.J. - “Damping and reflection coefficientmeasurements for an open pipe at low mach and Helmholtznumbers” - Journal of Fluid Mechanics, vol. 256, pp.499-534, 1993.
26. MUNT R. - “Acoustic transmission properties of a jetpipe with subsonic jet flow: I. the cold jet reflection
coefficient” - Journal of Sound and Vibration, vol. 142(3),pp. 413-436, 1990.
27. Ostrowski, G., Neely, G., Chadwell, C., Mehta, D. et al.,“Downspeeding and Supercharging a Diesel Passenger Carfor Increased Fuel Economy,” SAE Technical Paper2012-01-0704, 2012, doi: 10.4271/2012-01-0704.
28. BIRCKETT A., TOMAZIC D., BOWYER S., WETZELP., BEVAN K. and Keidel S. - “Engine and VehicleSimulations of a 1.6L Light Duty Diesel Engine withSupercharger-Turbocharger and Twin Turbocharger BoostingSystems” - 17th Supercharging Conference, Dresden, 13th/14th September 2012.
CONTACT INFORMATIONMezher, HaithamMechanical Engineer, PhDMANN+HUMMEL France [email protected] Centrale de [email protected]
ACKNOWLEDGMENTSThe author would like to thank the Internal CombustionEngine team at École Centrale de Nantes and the Engine andAcoustic departments in the advanced development at Mann+ Hummel France. The authors would also like to thankOSEO innovation and the Region des Pays de la Loire fortheir financial contributions in the research programOcsygene 6.
DEFINITIONS/ABBREVIATIONSα - Visco-thermal attenuation coefficient
β+ - Complex forward wave number
β− - Complex backward wave numberγ - Ratio of specific heatsω - Angular velocity (rad/s)c0 - Local speed of sound (m/s)
d - Internal diameter (m)d34 - Distance between sensor 3 and 4 (m)
d35 - Distance between sensor 3 and 5 (m)
d45 - Distance between sensor 4 and 5 (m)
j - Complex constant (j2 = −1)k - Wave numberL - Length (m)M - Mach numberp - Pressure (Pa)Pboost - Boost pressure at the intake (Pa)
Downloaded from SAE International by Automotive Research Association of India, Friday, August 01, 2014

P+ - Complex pressure amplitude in the positive direction(Pa)
P− - Complex pressure amplitude in the negative direction(Pa)Qm - Mass flow rate (Kg/s)
r - Ideal gas constantR - Pressure reflection coefficientRE - Energy reflection coefficient
S - AutospectraTin - Temperature at the inlet (k)
Tout - Temperature at the outlet (k)
x - Abscissa (m)
The Engineering Meetings Board has approved this paper for publication. It hassuccessfully completed SAE's peer review process under the supervision of the sessionorganizer. This process requires a minimum of three (3) reviews by industry experts.
All rights reserved. No part of this publication may be reproduced, stored in aretrieval system, or transmitted, in any form or by any means, electronic, mechanical,photocopying, recording, or otherwise, without the prior written permission of SAE.
ISSN 0148-7191
Positions and opinions advanced in this paper are those of the author(s) and notnecessarily those of SAE. The author is solely responsible for the content of the paper.
SAE Customer Service:Tel: 877-606-7323 (inside USA and Canada)Tel: 724-776-4970 (outside USA)Fax: 724-776-0790Email: [email protected] Web Address: http://www.sae.orgPrinted in USA
Downloaded from SAE International by Automotive Research Association of India, Friday, August 01, 2014