Embed Size (px)
Citation preview

OPTIMIZE
Senegal Report

ii OPTIMIZE
This report was commissioned by Optimize: Immunization Systems and Technologies for Tomorrow, a collaboration between the World Health Organization (WHO) and PATH. The report was authored by Optimize team members from PATH and WHO, with input from members of the Senegalese Ministry of Health. Contact information: Emmanuel Cour Technical Officer, PATH [email protected] Modibo Dicko Expanded Programme on Immunization Technical Officer, WHO [email protected] PATH addresses: Mail PO Box 900922 Seattle, WA 98109 USA Street 2201 Westlake Avenue, Suite 200 Seattle, WA 98121 USA www.path.org Suggested citation World Health Organization, PATH. Optimize: Senegal Report. Seattle: PATH; 2013. This work was funded in whole or part by a grant from the Bill & Melinda Gates Foundation. The views expressed herein are solely those of the authors and do not necessarily reflect the views of the Foundation. Copyright © 2013 World Health Organization (WHO), Program for Appropriate Technology in Health (PATH). All rights reserved. The material in this document may be freely used for educational or noncommercial purposes, provided that the material is accompanied by an acknowledgment. Cover photo: PATH\Mariama Guèye.

Senegal Report
OPTIMIZE
Senegal Report February 2013

iv OPTIMIZE
CONTENTS
Acknowledgments ..................................................................................................................... vi
Acronyms ................................................................................................................................. vii
1. Introduction ............................................................................................................................ 1 1.1. Overview ................................................................................................................... 1 1.2. About project Optimize ............................................................................................. 1 1.3. Finding more information .......................................................................................... 2
2. Senegal in context ................................................................................................................. 3 2.1. The immunization system ......................................................................................... 3 2.2. The vaccine supply chain ......................................................................................... 4 2.3. Other supply chains .................................................................................................. 4 2.4. Effective Vaccine Management assessment ........................................................... 5 2.5. Challenges and opportunities ................................................................................... 6
3. Supply chain integration ........................................................................................................ 8 3.1. Goal .......................................................................................................................... 8 3.2. Rationale ................................................................................................................... 8 3.3. System overview ..................................................................................................... 10 3.4. Implementation ....................................................................................................... 11 3.5. Results .................................................................................................................... 12 3.6. Acceptability and feasibility ..................................................................................... 14 3.7. Investment costs ..................................................................................................... 17 3.8. Challenges .............................................................................................................. 17 3.9. Lessons learned ..................................................................................................... 19 3.10. Next steps ............................................................................................................. 20
4. The Moving warehouse ....................................................................................................... 21 4.1. Goal ........................................................................................................................ 21 4.2. Rationale ................................................................................................................. 21 4.3. System overview ..................................................................................................... 22 4.4. Implementation ....................................................................................................... 24 4.5. Results .................................................................................................................... 26 4.6. Acceptability and feasibility ..................................................................................... 30 4.7. Investment costs ..................................................................................................... 32 4.8. Challenges .............................................................................................................. 33 4.9. Lessons learned ..................................................................................................... 35 4.10. Next steps ............................................................................................................. 35
5. Vision and scale-up ............................................................................................................. 37 5.1. Overview ................................................................................................................. 37 5.2. Implementation ....................................................................................................... 37 5.3. Results .................................................................................................................... 38
Senegal Report v
5.4. Next steps ............................................................................................................... 38
6. Modeling the costs of Senegal’s vaccine supply chain ....................................................... 40 6.1. Overview ................................................................................................................. 40 6.2. Methodology ........................................................................................................... 41 6.3. Conceptual model for costing methods .................................................................. 42 6.4. HERMES supply chain modeling ........................................................................... 46 6.5. Evaluating potential changes to the vaccine supply chain ..................................... 51
7. Conclusion ........................................................................................................................... 55
Appendix .................................................................................................................................. 56 A. Investment costs ....................................................................................................... 56 B. Acceptability and feasibility assessment ................................................................... 57

vi OPTIMIZE
ACKNOWLEDGMENTS
The World Health Organization and PATH would like to thank the Ministry of Health in Senegal and its national and international partners for the support and encouragement provided to project Optimize.
We are grateful for the support and active collaboration received from our national counterparts in the following organizations.
• The Department of Preventive Medicine.
• The National Supply Pharmacy.
• The Department for Infrastructure, Equipment, and Maintenance.
• The National Education and Information Service for the Promotion of Health.
• The General Department of Health (including the Department of Reproductive Health and Child Survival, the National Tuberculosis Program, AIDS Control Division, and Primary Health Care Division).
• National Malaria Control Program.
• The Micronutrient Initiative.
• The Senegal Urban Reproductive Health Initiative.
• The Office of the Saint-Louis Regional Medical Officer.
• The Saint-Louis Regional Supply Pharmacy.
• The health management teams from the five districts of Saint-Louis and the staff of the 110 health posts of Saint-Louis.
We would also like to thank the Senegalese and international consultants who have contributed to the success of the project, particularly those from the University of Pittsburgh Vaccine Modeling Initiative.

Senegal Report vii
ACRONYMS
BCG bacillus Calmette-Guérin
DAGE Department of General Administration and Equipment
DIEM Department for Infrastructure, Equipment, and Maintenance
DP Department of Preventive Medicine
DPM Department of Pharmacy and Medicine
DSRE Department of Reproductive Health and Child Survival
DTwP diphtheria, tetanus, whole-cell pertussis vaccine
DTP diphtheria, tetanus, pertussis vaccine
EPI Expanded Programme on Immunization
EVM Effective Vaccine Management
HERMES Highly Extensible Resource for Modeling Supply Chains
HepB hepatitis B
Hib Haemophilus influenza type B
MCR PRA regional store
MOH Ministry of Health
OPV oral polio vaccine
PATH Program for Appropriate Technology in Health
PCM phase change material
PNA National Supply Pharmacy
PNT National Tuberculosis Program
PRA Regional Supply Pharmacy
RH reproductive health
SMS short message service
TB tuberculosis
TT tetanus toxoid
VISAP 2020 Vision of Pharmaceutical Health Supply Systems in Senegal by 2020
WHO World Health Organization


Senegal Report
1. INTRODUCTION
1.1. Overview This report presents the results of demonstration projects and other activities undertaken in Senegal as part of a partnership between project Optimize and the Senegalese Ministry of Health (MOH).
Between 2009 and 2012, Optimize collaborated with the MOH to demonstrate innovations in the supply chain that can help the national immunization program to meet the demands of an increasingly large and costly portfolio of vaccines. This report describes the following demonstration projects undertaken in Senegal as part of the collaboration:
1. Supply chain integration (chapter 3).
The integration of public-sector vaccine, drug, and other health product supply chains.
2. The moving warehouse (chapter 4).
Streamlining the vaccine supply chain from the regional level to health posts and health centers by deploying specially equipped trucks.
In addition, the following project activities are also described:
• Vision and scale-up (chapter 5).
Defining a vision of what health supply systems in Senegal will look like by 2020, as well as a strategic plan to promote the scale-up of successful Optimize interventions.
• Modeling the cost of Senegal’s vaccine supply chain (chapter 6).
Modeling Senegal’s vaccine supply chain to evaluate the cost of potential changes to Senegal’s vaccine logistics system.
1.2. About project Optimize Project Optimize is a five-year partnership between the World Health Organization (WHO) and PATH to identify ways in which supply chains can be optimized to meet the demands of an increasingly large and costly portfolio of vaccines.
Optimize works directly with national governments and other institutions to identify problems in the supply chain and test innovative solutions. We also work with vaccine manufacturers and policymakers to help ensure that new products and policies enable supply chain systems to function effectively. Our goal is to help define an ideal vaccine supply chain that can be used to develop stronger, more adaptable, and more efficient logistics systems, extending the reach of lifesaving health technologies to people around the world.
For more information, please visit the Optimize website:
PATH: www.path.org/projects/project-optimize WHO: www.who.int/immunization_delivery/optimize

2 OPTIMIZE
1.3. Finding more information In 2013, Optimize will publish comprehensive information on the demonstration projects and other initiatives it has been involved in. To view a full list of the resources that Optimize has published to document its work in Senegal, please refer to the Senegal resources page of the Optimize website. This is available on both PATH’s and WHO’s website.
PATH: www.path.org/projects/project-optimize-resources-country.php#senegal WHO: www.who.int/immunization_delivery/optimize/senegal
You can also find these documents, as well as detailed information on other innovations relating to vaccine supply and logistics systems, on the TechNet-21.org website.
www.technet-21.org

Senegal Report 3
2. SENEGAL IN CONTEXT
2.1. The immunization system The Senegalese health system is organized around the country’s administrative structure. It has a national level, an intermediate level composed of 14 medical regions, and a peripheral level composed of 74 health districts covering over 1,000 health care delivery points (“health centers” at district headquarters and “health posts” below).
At the national level, in addition to the Cabinet of the Minister of Health and the Secretary General, there are two general departments (Health, Social Action), as well as several departments, public health programs and attached services. Medical regions report directly to the Cabinet of the Minister and oversee the implementation of all health activities promoted in their respective regions by the various departments, public health programs, and attached services.
The Expanded Programme on Immunization (EPI) in Senegal is managed by the MOH and follows the same structure as the country’s health system. It is implemented at the national level by the Department of Preventive Medicine (DP), by the 14 medical regions, and by the 74 health districts. The administrative structure of the national immunization program in Senegal is illustrated in more detail in Figure 1. The DP and medical regions are shown in bold.
Figure 1. Administrative structure of the national immunization program in Senegal
The program has successfully increased vaccine coverage for DTP-3 (diphtheria, tetanus, pertussis vaccine, third dose)i from 60 percent in 2002 to 83 percent in 2008.ii
i Now penta-3 (pentavalent, third dose) after the introduction of hepatitis B and Haemophilus influenza type B vaccines. ii World Health Organization (WHO). Senegal. In: WHO Vaccine Preventable Diseases Monitoring System 2012 Global Summary [database online]. Geneva: WHO; 2012. Available at:

4 OPTIMIZE
2.2. The vaccine supply chain Each vaccination point (either a health center or a health post) identifies its target population and informs the health district management team of its needs for vaccines and consumables. The health district then approves those needs and sends a compilation to the medical region management team. The medical region compiles the needs of its districts and sends them to the DP.
For several years, the system has been complicated by a long-running strike in which health workers have withheld information concerning the number of children and women vaccinated. This has made it difficult for district and regional EPI supervisors to assess the accuracy of vaccine orders received from health posts and districts.
Transport from the national level to the six furthest medical regions is managed by the DP, while the other eight regions collect their vaccines at the central depot of the PNA. The medical regions have warehouses for keeping vaccines and consumables, and health districts organize regular trips to the region to collect their vaccines. Likewise, health posts organize regular trips to collect supplies from the health districts. These trips occur each month, irrespective of the distance between health post and health district. This distribution system mobilizes a significant amount of human and financial resources but has been unable to guarantee the availability and quality of vaccines.
2.3. Other supply chains In Senegal, a donor-driven focus on quick and measurable results has resulted in numerous independent disease control programs, such as the malaria, tuberculosis, AIDS, and reproductive health programs. Each of these programs maintains separate supply and logistics systems even though they perform essentially the same functions (for example, sourcing, procurement, storage, and distribution) and reach the same target populations. This has led to the coexistence of a multitude of supply chains (Figure 2), which involves 13 sources of funding, 12 procurement agencies, and 8 different medical stores at the national level. The eight central-level medical stores supply the same regional stores without coordination or collaboration.
http://apps.who.int/immunization_monitoring/en/globalsummary/countryprofileselect.cfm. Accessed January 1, 2013.

Senegal Report 5
Figure 2. Duplicate health supply chains in Senegal
Although these vertical programs simplify the donor reporting process, they present unnecessary cost and complication at all health system levels. At the national level, a lack of coordination between the MOH, public health programs, central medical stores, and their numerous partners often results in huge quantities of products being imported, leading to overstocking, expiration, and wastage of valuable health supplies. At lower levels (provinces, districts, and health facilities), uncoordinated operations can lead to disruptions, duplication of efforts, and inefficient use of resources.
2.4. Effective Vaccine Management assessment An Effective Vaccine Management (EVM) assessment was conducted in 2009 to establish a baseline for demonstration projects supported by Optimize. The assessment measures supply chain performance in nine areas, with a target score of 80 percent for each. The EVM assessment in Senegal highlighted several shortcomings in the country’s vaccine supply system, including insufficient cold chain capacity (E3) particularly at the regional and district levels and weaknesses in the distribution system (E7) at all levels. Maintenance (E5) and stock management (E6) were also found to be weak at the regional, district, and peripheral levels. Figure 3 lists the assessment results for each level of the supply chain. The target score of 80 percent is highlighted.

6 OPTIMIZE
Figure 3. Effective Vaccine Management 2009 assessment results by level
2.5. Challenges and opportunities The introduction of new vaccines such as pneumococcal and rotavirus into Senegal’s vaccine supply chain risks overwhelming an already stressed system. Due to their volume, these new vaccines require more space than traditional vaccines, which will further challenge the system, as will pressure from other health products also needing a place in the logistics chain, both for storage and transport.
To help address these challenges, Optimize worked with the Senegalese MOH to design and implement a logistics chain that will meet the increasing demands of the national immunization program and other public health programs. The first phase of this work involved evaluating opportunities for improving logistics systems (2009), and the second phase was to demonstrate the advantages of a vaccine supply chain that:
• Is integrated with the supply chains of other public-sector health products.
• Benefits from a “moving warehouse” that can streamline the supply of vaccines at the local and regional levels.
• Is effectively managed using a Logistics Management Information System (LMIS).
• Applies environmentally sound methods such as solar and other new technologies.
The first phase of the project was conducted from September 2009 to January 2010. This established a shared understanding of the status of immunization logistics in Senegal and created a knowledge base, which led to the identification of technology systems and interventions that could improve the immunization logistics chain in the immediate future.

Senegal Report 7
The second phase was conducted from February 2010 to December 2012 at the national level (Dakar) and in the five districts of the Saint-Louis medical region.
8 OPTIMIZE
3. SUPPLY CHAIN INTEGRATION
3.1. Goal The goal of the integration demonstration was to create an integrated health supply chain for public-sector vaccines, drugs, and other health products from the national level to the regional level.
• At the national level, the National Supply Pharmacy (PNA) would take responsibility for receiving and storing vaccines, in addition to the public-sector drugs and health products that it already receives and stores.
• In all medical regions except Saint-Louis, the PNA would take responsibility for distributing vaccines to the DP regional stores (a responsibility previously held by the DP).
• In the pilot region of Saint-Louis, vaccines would be distributed along with public health drugs and health products from the PNA directly to the Regional Supply Pharmacy (PRA), rather than to the DP regional store.
3.2. Rationale In Senegal, the supply chains of disease-control programs are often managed independently of each other. However, without collaboration or even coordination between programs, these parallel supply chains put pressure on the health system. For example, at the national level vaccines are distributed by the Department of Preventive Medicine (DP), contraceptives by the Department of Reproductive Health and Child Survival (DSRE), tuberculosis drugs by the National Tuberculosis Program (PNT), and other public health drugs and products by the National Supply Pharmacy (PNA). Figure 4 illustrates some of these parallel supply chains.

Senegal Report 9
Figure 4. Parallel supply chains in Senegal
Although these parallel programs simplify the donor reporting process, they increase overall costs and cause complications at all levels of the health system. At the national level, a lack of coordination between the MOH, public health programs, central medical stores, and their numerous partners has resulted in cases of excessive quantities of products being imported, leading to overstocking, expiration, and wastage of valuable health supplies.iii At lower levels (provinces, districts, and health facilities), uncoordinated operations can lead to disruption of supplies, duplication of efforts, and inefficient use of resources.
By moving away from vertically managed supply systems towards a more integrated solution, public health programs can avoid many of these problems. However, collaboration between various public health programs is easier at peripheral and subnational levels than at the national level, where bottlenecks linked to the way various programs are funded by donors can create problems.
To alleviate these problems, the Senegalese Ministry of Health, in collaboration with project Optimize, worked to create an integrated health supply chain for all public-sector vaccines, drugs, and other health products. This unified chain would distribute vaccines with other drugs and health products from the national to the regional level. In the pilot region of Saint-Louis, this required transferring the regional vaccine store from the DP to the PRA, where the cold store was completely refurbished with new, long hold-over time, ice-lined refrigerators and solar-powered freezers.
iii Babaley M. Les défis dans les systèmes d'approvisionnement et de distribution des médicaments, Presented at: The Séminaire sur les Politiques Pharmaceutiques Nationales, June 14 to 18, 2010; Geneva, Switzerland.

10 OPTIMIZE
3.3. System overview
3.3.1. National-level integration
Figure 5 shows the way that vaccines and public health drugs and products were distributed before the integration.
Figure 5. Distribution of vaccines and other public health drugs and products
Figure 6 shows the way that these products were distributed once the integration was completed.
Figure 6. Integrated distribution of vaccines and other public health drugs and products
At the national level, the PNA has taken responsibility—previously held by the DP—for receiving and storing vaccines. The PNA has also taken responsibility for distributing vaccines to the DP regional stores (previously the responsibility of the DP).
To support the PNA’s additional responsibilities, Optimize installed Libero temperature monitors, LogTag data recorders, and the BeyondWireless alert system in the PNA’s national store to monitor the temperature of vaccine storage. With the BeyondWireless system, cold store staff are alerted by a short message service (SMS) text message and email of any variation in temperature outside the normal range lasting more than ten minutes. Staff can also access temperature data at any time by using the web interface.

Senegal Report 11
3.3.2. Integration in the Saint-Louis region
In the pilot region of Saint-Louis, the integration has been taken further. In Saint-Louis, the PNA is responsible for distributing vaccines to PRA regional stores, in addition to the public-sector drugs and health products that it already distributes to the PRA regional stores. Figure 7 illustrates this integration.
Figure 7. Integrated supply chains in Saint-Louis
In Saint-Louis, Optimize implemented another demonstration project. This was intended to streamline the vaccine supply chain from the regional level to health posts and health centers by deploying specially equipped trucks known as the “moving warehouse.” This is described in chapter 4.
To support the PRA’s additional responsibilities in Saint-Louis, Optimize installed Libero temperature monitors and LogTag data recorders in the PRA regional store to monitor the temperature of vaccine storage. Optimize also installed an Internet-based temperature monitoring and alarm system (supplied by a South African company called BeyondWireless) in the PRA regional store and in 15 health posts.
3.4. Implementation This section describes how the integration was implemented. Table 1 describes the project timeline and major milestones.
Table 1. Supply chain integration timeline
Year Month Milestone
2009 October to December
Feasibility studies for integration carried out.
“Collaboration Agreement” signed between Optimize and the MOH.
2010 May Central-level National Planning and Needs Forecasting Committee created in Dakar.
October The Ministry of Health and the PNA signed the “Agreement for the Integration of Vaccines in the PNA Supply System.”
November PNA started delivering vaccines and consumables to the 14 medical regions.
2011 January PNA staff trained on standard operating procedures for vaccine management.

12 OPTIMIZE
Year Month Milestone
March Management of central vaccine store transferred from DP to PNA.
July Transferred the regional vaccine store from the DPM regional store to the PRA regional store in Saint-Louis.
Began delivery of vaccines and immunization consumables to the PRA regional store in Saint-Louis.
Meeting held with members of the National Assembly Health Commission to inform them of the financing of integration activities (including the mobile warehouse).
2012 January to February
Conducted awareness raising and guidance for management teams in the regions and districts, for health post managers, and for health committees.
June The “Agreement for the Integration of Vaccines in the PNA Supply System” between the MOH and the PNA was renewed. PNA took responsibility for the entire logistics of the EPI vaccines, including customs clearance.
Acronyms: DP = Department of Preventive Medicine; DPM = Department of Pharmacy and Medicine; EPI = Expanded Programme on Immunization; MOH = Ministry of Health; PNA = National Supply Pharmacy; PRA = Regional Supply Pharmacy.
3.5. Results The effect of the supply chain integration can be measured by:
• Comparing the 2009 and 2012 EVM assessments in Senegal.
• The increased coordination between departments.
• The number of stockouts recorded at the PNA national store and regional stores.
• The quality of vaccine storage at the PNA national store and at the Saint-Louis regional store.
Each of these measurements is described in the following sections.
Note: In light of the ongoing strike by health workers and the subsequent withholding of immunization data (described in section 2.2 on page 4), the impact of this demonstration project in many areas has been difficult to measure.
3.5.1. Comparison of 2009 and 2012 EVM assessments
It may be possible to assess the impact of integrating the health supply chain by comparing the EVM assessment conducted in 2009 with the EVM assessment conducted in 2012. This is shown in Figure 8. The target score of 80 percent is highlighted.

Senegal Report 13
Figure 8. Comparative EVM evaluation scores of 2009 and 2012 at the national level
At the national level, the 2012 EVM assessment results show improvements in every category compared with 2009. The largest performance increases occurred in the following categories:
• E2 Temperature monitoring (37 percent).
• E6 Stock management (41 percent).
• E7 Distribution (48 percent).
• E8 Vaccine management (25 percent).
The training sessions on vaccine and cold chain management conducted with PNA staff as well as on the Internet-based temperature monitoring installed at the PNA national store could be behind these improvements.
Hardware criteria linked to storage capacity (E3), buildings, equipment, and transport (E4), and maintenance (E5) also improved significantly between the 2009 and the 2012 EVM assessments. This can be attributed to the improved vaccine storage and maintenance capacity of the PNA national store, which took responsibility for receiving and storing vaccines during the integration.
Overall, it can be said that the supply chain integration contributed significantly to the improvements in the 2012 EVM assessment result. Despite a marked increase compared to 2009, the results of the 2012 EVM assessment at the national level reveal that several criteria still remain below the target score of 80 percent. This constitutes a challenge that needs to be met before new vaccines are introduced.
3.5.2. Coordination between departments
An important benefit of the supply chain integration was the creation of the National Planning and Needs Forecasting Committee in May 2010. For the first time in Senegal, a means of coordination was established to bring together supply chain managers from various departments and public health programs to discuss issues related to supply chain integration. At committee meetings, the relevant people began to coordinate their forecasting and ordering activities with
14 OPTIMIZE
PNA officers and to discuss their problems with them. Conclusions and recommendations from the meetings were reported directly to the Minister himself.
The creation of the National Planning and Needs Forecasting Committee is the first step toward institutionalizing supply chain integration in Senegal.
3.5.3. Stockout frequency
The “Agreement for the Integration of Vaccines in the PNA Supply System” between the MOH and PNA was signed in October 2010. Since then, the PNA has stored and distributed vaccines to medical regions using their own infrastructure and equipment. During this time, no stockouts have been recorded at the national or regional level. This can be compared to the 56 cases of vaccine stockouts reported at the DP national store in 2009 (as reported by the DP’s Stock Management Tool).
3.5.4. Quality of vaccine storage
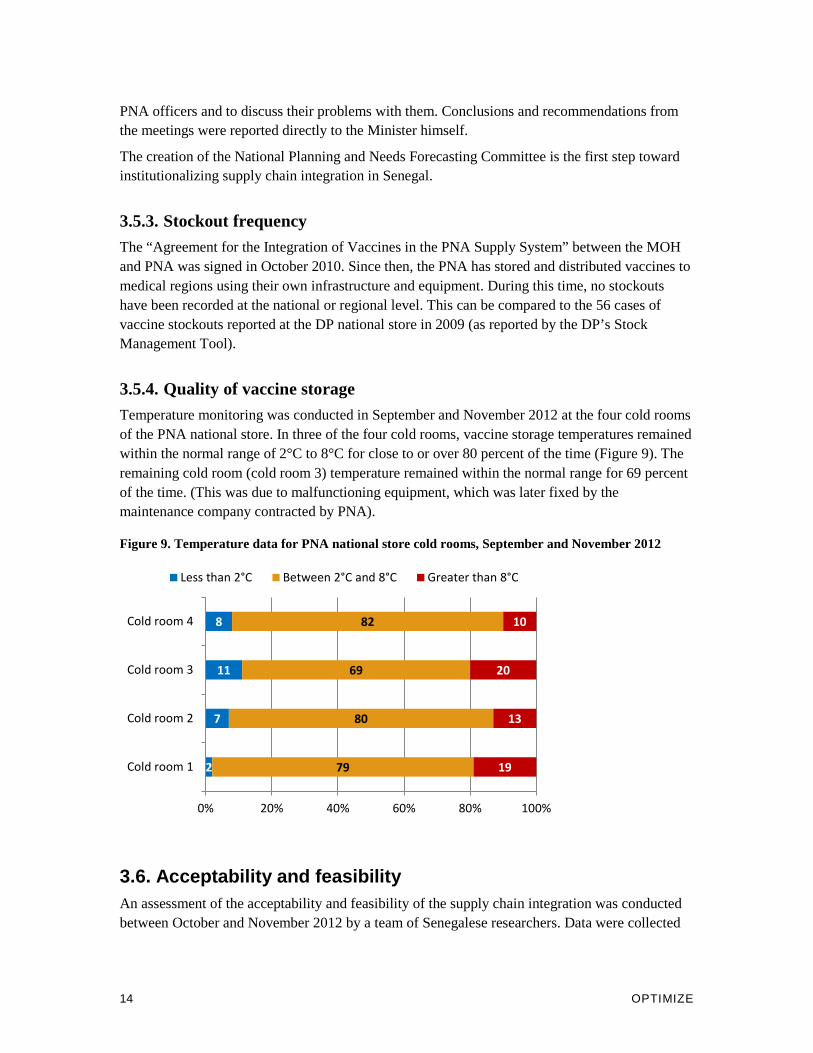
Temperature monitoring was conducted in September and November 2012 at the four cold rooms of the PNA national store. In three of the four cold rooms, vaccine storage temperatures remained within the normal range of 2°C to 8°C for close to or over 80 percent of the time (Figure 9). The remaining cold room (cold room 3) temperature remained within the normal range for 69 percent of the time. (This was due to malfunctioning equipment, which was later fixed by the maintenance company contracted by PNA).
Figure 9. Temperature data for PNA national store cold rooms, September and November 2012
3.6. Acceptability and feasibility An assessment of the acceptability and feasibility of the supply chain integration was conducted between October and November 2012 by a team of Senegalese researchers. Data were collected
2
7
11
8
79
80
69
82
19
13
20
10
0% 20% 40% 60% 80% 100%
Cold room 1
Cold room 2
Cold room 3
Cold room 4
Less than 2°C Between 2°C and 8°C Greater than 8°C
Senegal Report 15
through semi-structured interviews with 59 participants. To read more about the methodology of the assessment, please refer to Appendix B.
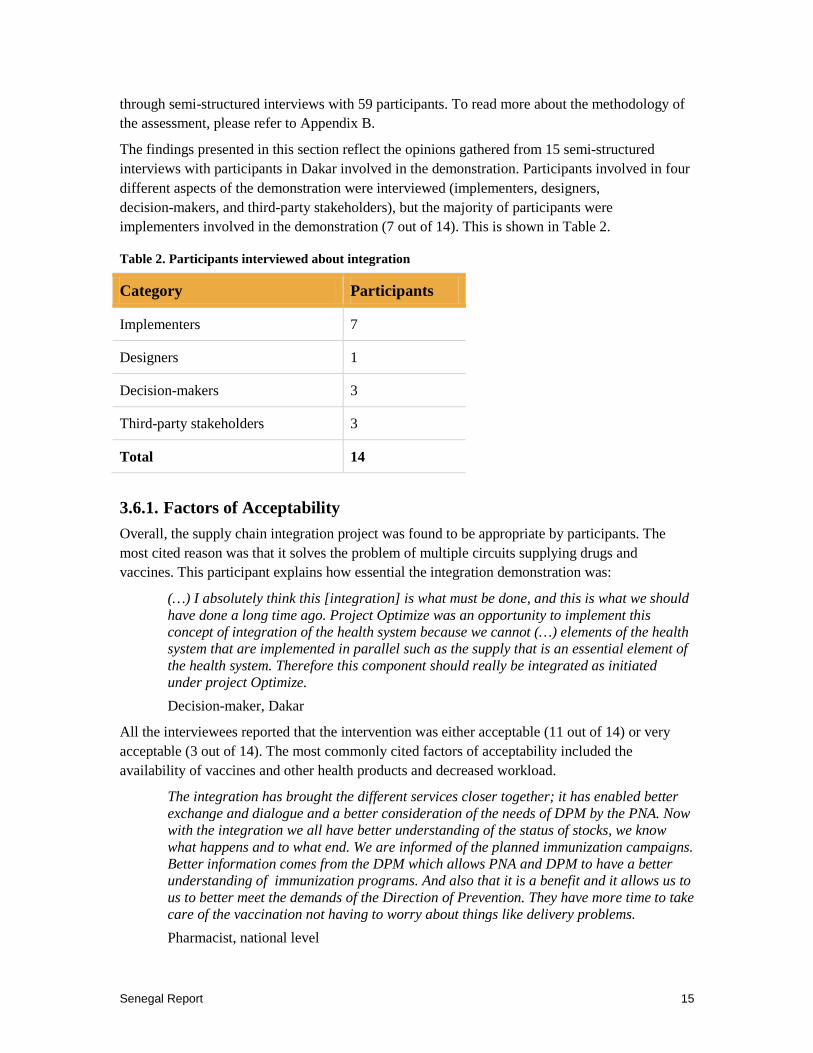
The findings presented in this section reflect the opinions gathered from 15 semi-structured interviews with participants in Dakar involved in the demonstration. Participants involved in four different aspects of the demonstration were interviewed (implementers, designers, decision-makers, and third-party stakeholders), but the majority of participants were implementers involved in the demonstration (7 out of 14). This is shown in Table 2.
Table 2. Participants interviewed about integration
Category Participants
Implementers 7
Designers 1
Decision-makers 3
Third-party stakeholders 3
Total 14
3.6.1. Factors of Acceptability
Overall, the supply chain integration project was found to be appropriate by participants. The most cited reason was that it solves the problem of multiple circuits supplying drugs and vaccines. This participant explains how essential the integration demonstration was:
(…) I absolutely think this [integration] is what must be done, and this is what we should have done a long time ago. Project Optimize was an opportunity to implement this concept of integration of the health system because we cannot (…) elements of the health system that are implemented in parallel such as the supply that is an essential element of the health system. Therefore this component should really be integrated as initiated under project Optimize.
Decision-maker, Dakar
All the interviewees reported that the intervention was either acceptable (11 out of 14) or very acceptable (3 out of 14). The most commonly cited factors of acceptability included the availability of vaccines and other health products and decreased workload.
The integration has brought the different services closer together; it has enabled better exchange and dialogue and a better consideration of the needs of DPM by the PNA. Now with the integration we all have better understanding of the status of stocks, we know what happens and to what end. We are informed of the planned immunization campaigns. Better information comes from the DPM which allows PNA and DPM to have a better understanding of immunization programs. And also that it is a benefit and it allows us to us to better meet the demands of the Direction of Prevention. They have more time to take care of the vaccination not having to worry about things like delivery problems.
Pharmacist, national level
16 OPTIMIZE
Despite the overwhelmingly positive response regarding the acceptability of the intervention, factors of unacceptability were still listed such as the lack of information sharing among the parties on the distribution of the vaccines and the unsustainability of the model from an economic perspective.
3.6.2. Factors of feasibility
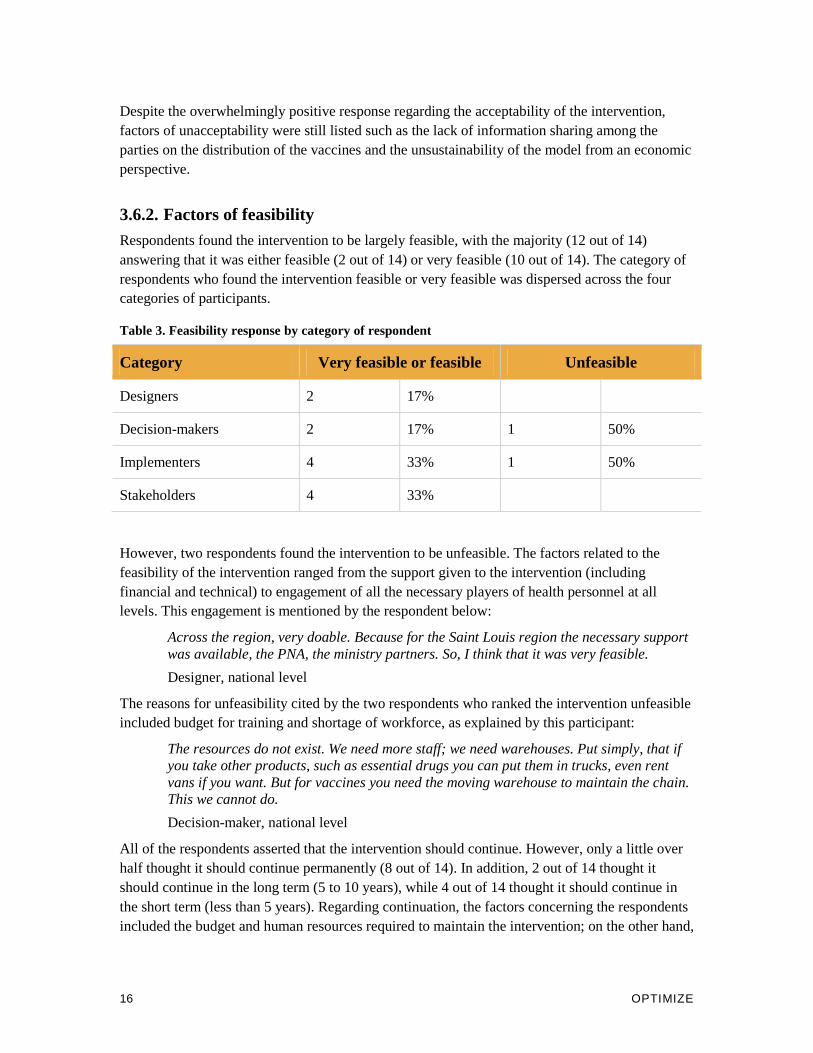
Respondents found the intervention to be largely feasible, with the majority (12 out of 14) answering that it was either feasible (2 out of 14) or very feasible (10 out of 14). The category of respondents who found the intervention feasible or very feasible was dispersed across the four categories of participants.
Table 3. Feasibility response by category of respondent
Category Very feasible or feasible Unfeasible
Designers 2 17%
Decision-makers 2 17% 1 50%
Implementers 4 33% 1 50%
Stakeholders 4 33%
However, two respondents found the intervention to be unfeasible. The factors related to the feasibility of the intervention ranged from the support given to the intervention (including financial and technical) to engagement of all the necessary players of health personnel at all levels. This engagement is mentioned by the respondent below:
Across the region, very doable. Because for the Saint Louis region the necessary support was available, the PNA, the ministry partners. So, I think that it was very feasible.
Designer, national level
The reasons for unfeasibility cited by the two respondents who ranked the intervention unfeasible included budget for training and shortage of workforce, as explained by this participant:
The resources do not exist. We need more staff; we need warehouses. Put simply, that if you take other products, such as essential drugs you can put them in trucks, even rent vans if you want. But for vaccines you need the moving warehouse to maintain the chain. This we cannot do.
Decision-maker, national level
All of the respondents asserted that the intervention should continue. However, only a little over half thought it should continue permanently (8 out of 14). In addition, 2 out of 14 thought it should continue in the long term (5 to 10 years), while 4 out of 14 thought it should continue in the short term (less than 5 years). Regarding continuation, the factors concerning the respondents included the budget and human resources required to maintain the intervention; on the other hand,

Senegal Report 17
the respondents thought it would continue because of the political will supporting it and the reduction in workload. This respondent states further:
At this stage in terms of cost, and I do not know what it is, but in terms of reducing the workload I think, at least for DPM and field staff it has significantly reduced their workload. So for them, it’s very interesting, and it allows them, as I said earlier, to focus on other issues, such as quality assurance of the immunization service.
Physician, national level
The supply chain integration was found both acceptable and feasible by most of the respondents. The feedback offered included concerns regarding the budget and human resources required to continue the demonstration.
3.7. Investment costs The investment cost for the intervention was estimated at $119,000. This included equipment purchases, formative assessments, planning, training, advocacy, and awareness raising. Figure 10 provides a break-down of these cost categories.
Figure 10. Investment costs for supply chain integration
Up to 49 percent of the up-front investments were for formative assessments, while planning accounted for 19 percent, and training for 16 percent.
Table 25 on page 56 compares the estimated investment costs for the intervention and the investment cost per dose delivered.
3.8. Challenges
3.8.1. Overcoming resistance to change
At the outset of the intervention, key players at the national level were enthusiastic in their support of the integration of supply and distribution systems. All partners agreed to provide
13%
49%
19%
2%
16% Equipment
Formative assessments
Planning
Advocacy and awareness raising
Training

18 OPTIMIZE
technical assistance if required and that an entity should be established to coordinate the input of partners.
However, supply chain integration necessitates changes to practices that have been in place for more than three decades and involves a transformation of institutional and technical roles and responsibilities. Since the mid-1970s, the EPI has managed its own logistics supply chain for vaccines and consumables, operating in parallel to—and completely independent of—other health service supply chains. As a result, other health programs have expressed doubts that the EPI is fully committed to integration.
These doubts existed at the outset of the project and persisted throughout the integration. In particular, concerns focused on the sustainability of the project, equipment, logistics and the maintenance of refrigeration equipment, the risk of stockouts, the complexity of medical ordering, the coordination and management of supply and distribution, and finally, the role of departments and public health programs (who often felt that the integration would be too focused on vaccines).
To effectively address the reservations of stakeholders, it was necessary to create an advocacy and communication plan. This plan would alleviate the apprehensions and concerns of partners, as well as mobilize and channel the efforts of stakeholders to implement the project. The plan is described in more detail in section 3.9.1 on page 19.
3.8.2. Ministry of Health payment problems
Despite an “agreement to pay” signed by the Minister of Health, the MOH has not been able to pay the PNA its fees for 2013, as well as for the previous two years. It is crucial that the Ministry pay their fees and thus prevent the cancellation of the “Agreement for the Integration of Vaccines in the PNA Supply System” signed in October 2010 by the MOH and the PNA.
3.8.3. Insufficient PNA capacity in vaccine and cold chain management
After the transfer of vaccine cold chain management to the PNA, the DP was tasked with coaching and training PNA staff for one year before the DP’s complete withdrawal. However, the PNA assigned this responsibility to members of staff already in charge of drug supply chain management. These staff members (two store managers and one pharmacist) were already extremely busy with drug supply chain management. As a result, DP logistics officers remained skeptical about the ability of PNA staff to devote sufficient time and care to vaccine cold chain management. They continued to provide coaching and training to PNA staff beyond the one-year period originally specified, rather than transfer complete responsibility to them for vaccine and cold chain management.
The PNA needs to overcome this challenge before it can convince its partners that it has the capacity required to manage vaccine storage and transport. This is particularly relevant when considering the possible scale-up of these responsibilities.

Senegal Report 19
3.8.4. Supporting the National Planning and Needs Forecasting Committee
Many stakeholders still view the National Planning and Needs Forecasting Committee as something solely related to Optimize. Therefore, keeping it active once project Optimize ends is another challenge. Its role is crucial in maintaining regular communication and coordination between logisticians from different public health programs and PNA officers.
3.9. Lessons learned
3.9.1. The importance of advocacy and communication
The success of the supply chain integration could not have been achieved without the engagement of all stakeholders. As described earlier in section 3.8.1 (page 17), there was resistance to the integration among stakeholders that had to be overcome. To achieve this, it was necessary to develop and implement an advocacy and communication plan, on the one hand to alleviate any apprehensions and concerns held by partners, and on the other hand to mobilize and channel the efforts of all stakeholders to implement the project. By identifying the concerns, positions, and capabilities of key players, both on a decision-making level (central and regional) and an operational level (district and peripheral), resistance to the intervention could be minimized and a clearer path towards its realization could be followed.
This work helped make possible the signing of the “Agreement for the Integration of Vaccines in the PNA Supply System” in October 2010. The endorsement of this document by all stakeholders, in particular the PNA, the DP, the Department of General Administration and Equipment (DAGE), and the minister’s office, was supported by an intense advocacy and communications push to overcome reluctance and avoid bottlenecks. The signing of the agreement was the culmination of this effort. The renewal of the agreement by the Minister on June 21, 2012, confirmed the acceptance of the project by the Ministry and the PNA. This could bode well for its future sustainability.
Obtaining high-level political support is crucial to ensure the success of a project such as this, but it is not enough to overcome all resistance. In Senegal, Optimize had the support of the Minister of Health himself, as well as all high-ranking officers in the MOH. Despite this, it took an entire year of advocacy and intense negotiations before the “Agreement for the Integration of Vaccines in the PNA Supply System” between the MOH and the PNA was signed.
3.9.2. Building human capacity takes time
Institutional capacity can be increased by strengthening the competencies of existing staff members as well as by recruiting new staff members. Both methods are challenging and require planning, resources, and sufficient time for training and follow-up.
As part of the supply chain integration, the PNA took the additional responsibility of receiving and storing vaccines. However, despite conducting various training sessions on vaccine and cold chain management, it was still necessary to support PNA staff with coaching from DP logistics officers for over a year.

20 OPTIMIZE
Expanding the human capacity of national institutions can also take a long time. Financial and technical partners are often keen to support strengthening infrastructure and equipment but often regard human capacity-building as a government responsibility. However, funding constraints on governments and parastatal institutions such as the PNA often make it problematic for them to pay extra salaries. This can result in resistance to recruiting additional staff.
3.10. Next steps During a workshop held in November 2012 with Optimize and the MOH to finalize the project report, participants recommended that the MOH should:
• Evaluate the benefits of national-level integration, as outlined in the “Agreement for the Integration of Vaccines in the PNA Supply System” between the MOH and the PNA. Participants of the workshop did not doubt the importance of integration, but they did feel its benefits needed to be more clearly assessed.
• Strengthen the human resources of the PNA in vaccine management.
o Recruit at least one pharmacist with skills in supply chain management to be devoted solely to vaccine management.
o Continue training PNA staff members.
• Extend the integration to encompass the whole in-country supply chain from the national to the peripheral level and include regional distribution with the moving warehouse in the “Agreement for the Integration of Vaccines in the PNA Supply System” between the MOH and PNA.
• Promote regular communication between the PNA and DP by organizing monthly meetings between them to review implementation indicators and undertake timely corrective actions.
Senegal Report 21
4. THE MOVING WAREHOUSE
4.1. Goal The goal of the moving warehouse demonstration was to streamline the vaccine supply chain from the regional level to health posts and health centers by deploying specially equipped trucks known collectively as the “moving warehouse.” In the pilot region of Saint-Louis, the moving warehouse would replace the existing collection-based system and regularly deliver vaccines and other public health drugs and products from the PRA regional store directly to over 100 health centers and posts.
4.2. Rationale In Senegal, quickly and efficiently transporting vaccines from the regional level to health posts and health centers is complicated by the following problems:
• Lack of storage space at regional and district vaccine stores The 2009 EVM assessment (described on page 5) showed that the indicators linked to storage capacity, maintenance, stock management, distribution, and vaccine management were low for regions, and particularly low for districts. These low scores reveal the problems that exist in finding available space to store vaccines at regional and district vaccine stores. This problem is likely to increase as newer and more expensive vaccines (such as rotavirus, pneumococcal, and meningitis vaccines) are introduced.
• Unreliable grid electricity Frequent power cuts at regional and district vaccine stores put vaccines at risk. This is especially true at the district level, where back-up generators are not always available or in working order.
• Inefficient vaccine collection systems For some nurses in village health posts, collecting vaccine supplies from district stores can take an entire day and must be performed at least once every month. Sometimes, these long and often arduous journeys are made in vain, as district stores frequently experience stockouts of vaccines and supplies. This obliges the nurse to return to the health post empty-handed and to repeat the journey at a later date. While these nurses are traveling, their health posts must be closed, denying local people the health services they require.
• Unreliable vaccine collection systems Transporting vaccine supplies from district stores to health posts can take many hours and poses a risk to the quality of vaccines being collected when specific temperatures cannot be guaranteed during transport. This problem also applies to district store managers who are responsible for collecting vaccines from regional stores for the health posts in their district. Many district stores do not have dedicated vehicles for these trips, and without them district managers are obliged to use alternative collection methods, such as borrowing district ambulances or traveling by public transport.

22 OPTIMIZE
• Lack of data on vaccine stock at district stores and health posts Accurate and up-to-date information on vaccine stock levels at the district and health post level is not available at the national level. Without the ability to monitor stock levels, vaccine procurement and replenishment is complex and inefficient.
A mobile warehouse that can safely and reliably transport vaccines directly from the regional store to health posts has the potential to alleviate these problems. By taking responsibility for collecting and then delivering vaccines, it removes the need for additional storage requirements at regional and district vaccine stores and saves nurses in village health posts from having to collect vaccines themselves. By utilizing new vaccine storage technologies, it can ensure that vaccines are stored at the appropriate temperature during delivery circuits. And by recording the number of vaccines distributed to each health post, along with existing stock levels, and sharing this information with regional and district vaccine store managers, it can improve the efficiency of vaccine stock management and procurement.
4.3. System overview
4.3.1. Main responsibilities
The moving warehouse was established to deliver the following products to all health centers and health posts in the Saint-Louis region:
• Vaccines and immunization consumables.
• Essential medicines.
• Reproductive health products.
• AIDS, malaria, and tuberculosis (TB) program drugs and health products.
The moving warehouse was also established to help improve stock management by recording stock levels at all health centers and health posts, as well as recording the quantities of all products delivered.
The responsibilities of the moving warehouse are shown in Figure 11.
Figure 11. The moving warehouse in Saint-Louis

Senegal Report 23
4.3.2. Additional responsibilities
In addition to its main responsibilities, the moving warehouse undertook the following additional tasks:
• Collecting full safety boxes from health centers and transporting them to district stores for incineration.
• Delivering vaccines and immunization consumables during polio and measles immunization campaigns and redeploying surplus stock as needed.
• Distributing management tools (monitoring forms, records, etc.) to health centers and health posts.
• Transporting primary health care supervisors from regional stores and district health centers to village health centers and health posts for supportive supervision rounds.
• Transporting cold chain equipment, such as vaccine refrigerators, from the PRA regional store to health centers and from health centers to the district store when repairs are needed.
4.3.3. Delivery circuits
Made up of two vehicles (one large truck and one pickup truck), the moving warehouse began delivering vaccines and consumables from the PRA regional store to health posts in February 2011. Each month, the trucks embark on three separate delivery circuits. These are described in Table 4.
Table 4. Moving warehouse delivery circuits
Delivery circuit Destination Duration
1 Saint-Louis and Richard Toll districts Up to two days
2 Dagana district Up to three days
3 Podor and Pété districts Up to a week
Note: At the beginning of the project, essential medicines were delivered to just one district (Pété). This was because the district pharmacy managers of the other four districts were unsure of the feasibility of the moving warehouse model given their remoteness from Saint-Louis. After a year of moving warehouse operations, the district pharmacy managers gained confidence in the system and the service was expanded to all districts. The delivery of reproductive health products was also limited to Dagana and Pété districts only on request of the Reproductive Health Division. It is planned to extend this to other districts later on.
4.3.4. Vaccine storage
The moving warehouse demonstration project utilizes new vaccine storage technologies to ensure that vaccines are stored at the appropriate temperature during delivery circuits. During the first

24 OPTIMIZE
and second delivery circuits, vaccines are stored in a 170-liter Aircontainer Bigbox storage container that can keep vaccines at the appropriate temperature for up to 2.5 days. With such a large storage capacity, the Bigbox container is equivalent to eight long-range traditional cold boxes such as the Dometic RCW25. This saves space and makes it easier to handle larger volumes of bulky single-dose vaccines.
The third delivery circuit covers the more remote districts of Podor and Pété, and can take up to a week. In addition to the Bigbox storage container, on the longer third delivery circuit a Dometic RCW 4/30 vaccine carrier is used to keep vaccines within the correct temperature range for up to 4.5 days.
Both containers are cooled by phase change materials (PCMs) that have been chilled in a refrigerator at safe temperatures for a specified time period. PCM panels are placed in the container, and vaccines can be loaded in direct contact with the panels without risk of freezing.
To check that the cold chain is maintained throughout the journey, moving warehouse trucks have been equipped with Libero temperature monitors and LogTag data recorders to constantly monitor vaccine temperatures.
4.3.5. Vaccine stock management
The moving warehouse demonstration project tested a new LMIS that links moving warehouse trucks to other health information systems, enabling fast and accurate data flow on vaccine stock and other health products distributed by the moving warehouse.
Moving warehouse trucks were equipped with laptop computers and a wireless Internet connection, enabling staff to access the new LMIS and update information on vaccine stock. By doing so, they can share data with district management teams and regional and national storage facilities. With each monthly delivery, moving warehouse staff record in the LMIS the health center’s current vaccine stock levels as well as the number of vaccines administered that month. They then top up the health center’s vaccine stock to the required level.
4.4. Implementation This section describes how the moving warehouse was implemented. Table 5 describes the project timeline and major milestones.
Table 5. Moving warehouse demonstration timeline
Year Month Milestone
2009 June to July Moving warehouse feasibility study was conducted for Optimize by VillageReach in Tambacounda region.
November to December
Adaption of the feasibility study to the Saint-Louis region by Optimize was completed.

Senegal Report 25
Year Month Milestone
December Consensus workshop on moving warehouse activities with stakeholders was held.
2010 January to October
Installation activities were completed prior to startup: vehicles and other equipment acquired, PRA cold store refurbished, necessary staff recruited, etc.
October Official launch of the moving warehouse was held by the Minister of Health.
2011 January to February
Moving warehouse staff and district, PRA, and national-level supervisors were trained.
February The moving warehouse began delivery tests to 22 health posts and 5 district stores in Saint-Louis.
March to June
The moving warehouse began delivering vaccines and consumables to 55 health posts in Saint-Louis, Richard Toll, and Dagana districts. This was increased to 110 health posts when training was completed in Podor and Pété districts.
December Vaccine management training was conducted for all health post managers and EPI supervisors in the Saint-Louis region.
2012 January Orientation was held for management teams on the introduction of reproductive health (RH) products to moving warehouse deliveries. At this meeting, a distribution test phase was proposed for the Pété and Dagana districts.
February Orientation was held for service providers on the introduction of RH products in the Dagana and Pété districts.
March Test delivery of RH products was made to the Dagana and Pété districts.
May Evaluation of the RH product delivery test phase was conducted.
May to June Orientation was held for users in other districts on the introduction of RH products.
June Began delivery of vaccines and products from other programs (RH, AIDS, malaria, and TB) to all health posts and centers in the Saint-Louis region.
August LMIS training was provided to moving warehouse staff members, PNA store managers, and district EPI supervisors.

26 OPTIMIZE
Year Month Milestone
August Cold chain maintenance training provided to PNA and PRA technicians, district handymen, DP logistics officers, and maintenance technicians from Saint-Louis and Dioum hospitals.
Acronyms: DP = Department of Preventive Medicine; EPI = Expanded Programme on Immunization; LMIS = logistics management information systems; MOH = Ministry of Health; PNA = National Supply Pharmacy; PRA = Regional Supply Pharmacy; RH = reproductive health.
4.5. Results The impact of the moving warehouse can be measured by analyzing:
• Logistics costs in the Saint-Louis region.
• The quality of vaccine storage during delivery by the moving warehouse.
• Reliability of vaccine deliveries by the moving warehouse.
• Availability of vaccine stock at health posts
Each of these measurements is described in the following sections.
4.5.1. Logistics costs
It is possible to better understand the financial impact of the moving warehouse by comparing the vaccine supply chain costs in Saint-Louis before and after the implementation of the moving house. To do so, Optimize created a costing and modeling tool that is described in more detail in chapter 6 (page 40).
Table 6 provides a comparison of the estimated costs of the vaccine supply chain in Saint-Louis before the implementation of the moving warehouse (the baseline) and after. Vaccine cost per dose is calculated by dividing the annual supply chain costs by the number of doses delivered, and it estimates the logistics cost incurred to deliver one vaccine dose. (Cost metrics are defined in more detail in Table 13 on page 44.)
Table 6. Estimated costs of the vaccine supply chain in Saint-Louis before and after the implementation of the moving warehouse
Baseline Moving warehouse
Annual supply chain cost $130,429 $140,904
Vaccine doses delivered 371,400 398,594
Units of RH products delivered N/A 87,850
Vaccine cost per dose $0.35 $0.35
Vaccine and RH product cost per unit N/A $0.29
Senegal Report 27
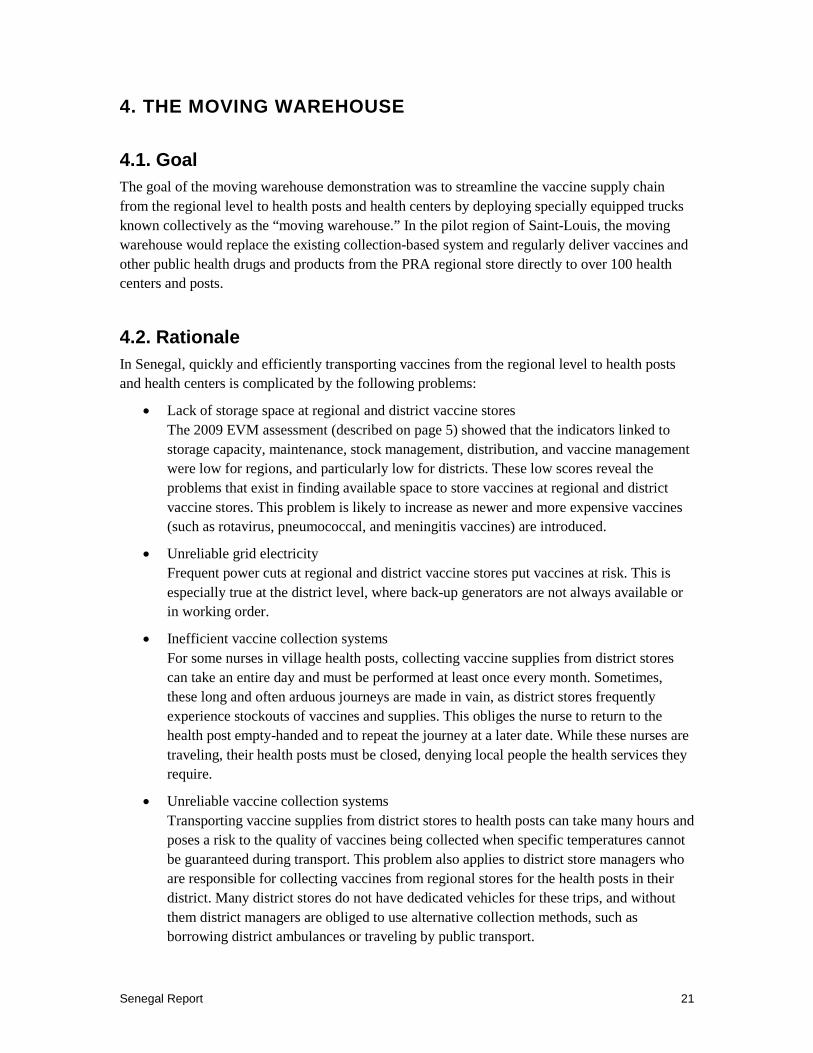
Baseline Moving warehouse
Logistics cost as percentage of vaccine value 36% 38%
Logistics cost as percentage of vaccine and reproductive health product value
N/A 37%
Acronym: RH=reproductive health.
When the moving warehouse delivers only vaccines, the cost per dose remains the same as the baseline ($0.35). However, if the moving warehouse delivers reproductive health products as well as vaccines, the cost per unit drops to $0.29. This represents a cost reduction of 17 percent compared to the baseline, due to increased efficiency in the use of transportation resources resulting from the integration of the transport function between immunization and reproductive health programs. Since the moving warehouse has the capacity to transport additional goods (in addition to vaccines and reproductive health products), there are additional efficiencies that could be exploited by using the available space to transport other health program commodities.
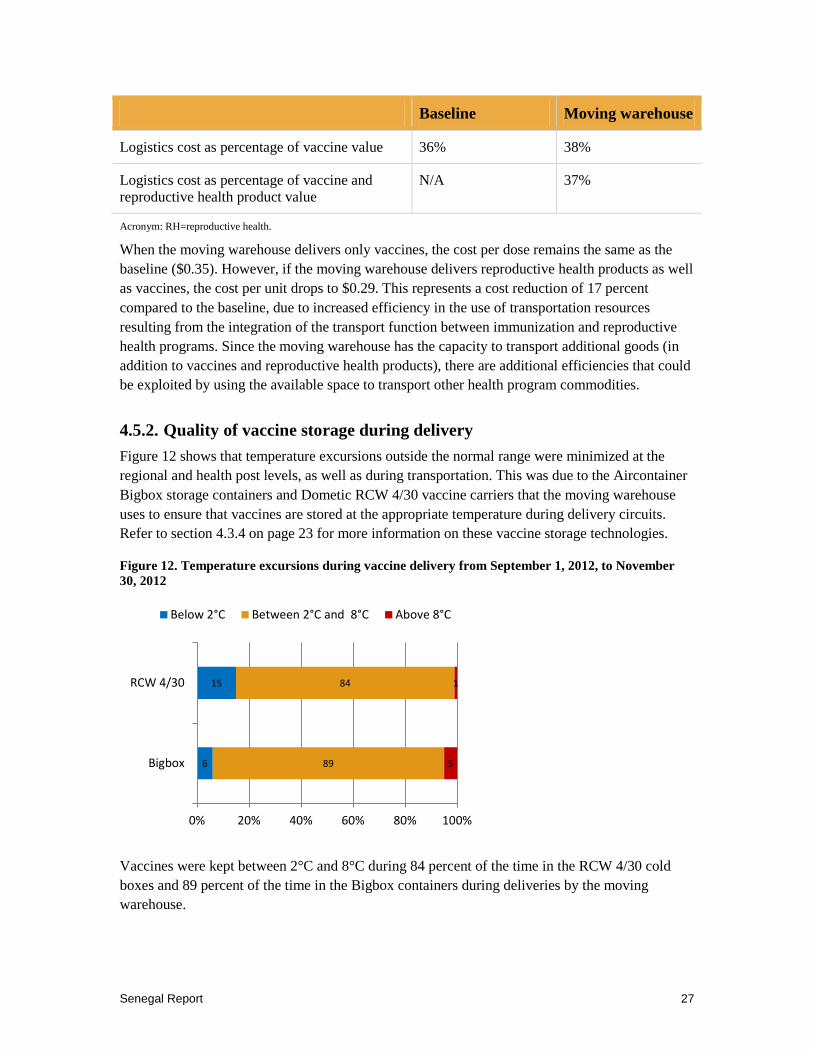
4.5.2. Quality of vaccine storage during delivery
Figure 12 shows that temperature excursions outside the normal range were minimized at the regional and health post levels, as well as during transportation. This was due to the Aircontainer Bigbox storage containers and Dometic RCW 4/30 vaccine carriers that the moving warehouse uses to ensure that vaccines are stored at the appropriate temperature during delivery circuits. Refer to section 4.3.4 on page 23 for more information on these vaccine storage technologies.
Figure 12. Temperature excursions during vaccine delivery from September 1, 2012, to November 30, 2012
Vaccines were kept between 2°C and 8°C during 84 percent of the time in the RCW 4/30 cold boxes and 89 percent of the time in the Bigbox containers during deliveries by the moving warehouse.
6
15
89
84
5
1
0% 20% 40% 60% 80% 100%
Bigbox
RCW 4/30
Below 2°C Between 2°C and 8°C Above 8°C

28 OPTIMIZE
4.5.3. Reliability of vaccine delivery
The reliability of the moving warehouse in completing its delivery schedule has steadily increased from 2011 and is now approaching 100 percent in all five districts of Saint-Louis (Figure 13). The decrease observed in Pété and Podor districts during Q3 2012 can be attributed to:
• Absence of head nurses from the health posts at the moment of the visits.
• Difficulties accessing remote health posts during the rainy season, which makes some roads impassable.
• Broken or malfunctioning refrigerators at health posts (in which case vaccines were delivered either to neighboring health posts or to district stores).
Figure 13. Moving warehouse compliance with the delivery schedule
4.5.4. Availability of vaccine stock
Vaccine availability at the health post level (represented in this case by the ratio of existing stock to quantity delivered) was measured throughout the demonstration. With a buffer stock level of 25 percent, the quantity of new stock delivered should represent 75 percent of the maximum level agreed upon with the district health management teams for each health post. Hence, vaccine availability for all antigens should be 33 percent, indicating the buffer stocks have not started to be utilized. Thanks to the reliable vaccine delivery of the moving warehouse (see section 4.5.3 on page 28) general vaccine availability was above 33 percent in four of the five districts (Figure 14).
Senegal Report 29
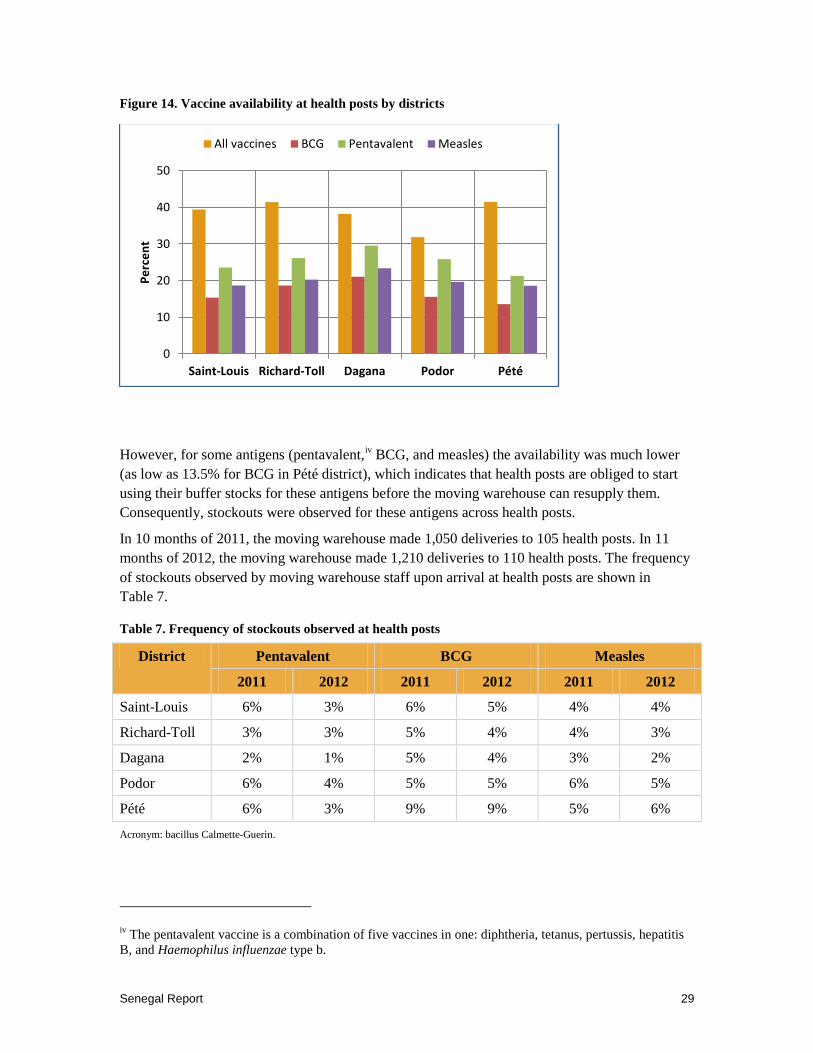
Figure 14. Vaccine availability at health posts by districts
However, for some antigens (pentavalent,iv BCG, and measles) the availability was much lower (as low as 13.5% for BCG in Pété district), which indicates that health posts are obliged to start using their buffer stocks for these antigens before the moving warehouse can resupply them. Consequently, stockouts were observed for these antigens across health posts.
In 10 months of 2011, the moving warehouse made 1,050 deliveries to 105 health posts. In 11 months of 2012, the moving warehouse made 1,210 deliveries to 110 health posts. The frequency of stockouts observed by moving warehouse staff upon arrival at health posts are shown in Table 7.
Table 7. Frequency of stockouts observed at health posts
District Pentavalent BCG Measles
2011 2012 2011 2012 2011 2012
Saint-Louis 6% 3% 6% 5% 4% 4%
Richard-Toll 3% 3% 5% 4% 4% 3%
Dagana 2% 1% 5% 4% 3% 2%
Podor 6% 4% 5% 5% 6% 5%
Pété 6% 3% 9% 9% 5% 6%
Acronym: bacillus Calmette-Guerin.
iv The pentavalent vaccine is a combination of five vaccines in one: diphtheria, tetanus, pertussis, hepatitis B, and Haemophilus influenzae type b.
0
10
20
30
40
50
Saint-Louis Richard-Toll Dagana Podor Pété
Perc
ent
All vaccines BCG Pentavalent Measles
30 OPTIMIZE
Frequency of stockouts ranged from 1 percent to 9 percent. Unsurprisingly, the highest frequency of stockouts was observed in the most remote district (Pété), where difficulties accessing remote health posts were encountered during the rainy season.
A slight reduction in stockout frequency was observed between 2011 and 2012. One explanation for the reduction not being greater could be due to poor population estimates on which minimum and maximum stock levels are based. However, if that was the case it would have been easy to solve by adjusting maximum levels. The fact that such a simple solution was never implemented leads us to think the real reason was linked to the long-running strike in which health workers have withheld important information concerning the number of children and women vaccinated. This has left moving warehouse staff and district health management teams with no data on immunization coverage and the duration of stockouts. However, because of the strike, district health management teams could not discuss this issue with health workers and so no solution could be found.
4.5.5. Other results
In addition to the effects described in the previous section, the moving warehouse has:
• Eliminated the need for village health center nurses and district store managers to collect vaccines and supplies from district and regional stores, respectively.
• Collected safety boxes filled with used syringes from health posts and transferred them to districts for safe disposal.
• Conducted inventories and top-ups of vaccines, drugs, and other health products at delivery points regularly every month.
Although we lack the data to measure the precise impact of these accomplishments, it is likely that they have helped to increase health workers’ presence at their respective health posts, improved health care waste management, and improved the availability of vaccines at the health post level.
4.6. Acceptability and feasibility An assessment of the acceptability and feasibility of the moving warehouse was conducted between October and November 2012 by a team of Senegalese researchers. The assessment was conducted in Dakar and the regions of Saint-Louis, Podor, Dagana, Richard-Toll, and Pété. To read more about the methodology of the assessment, please refer to Appendix B.
The findings presented in this section reflect the opinions gathered from 38 interviews and two focus groups on the opinions of the participants of the acceptability and feasibility of the moving warehouse demonstration. Participants involved in four different aspects of the demonstration were interviewed (implementers, designers, decision-makers, and third-party stakeholders). This is shown in Table 8.

Senegal Report 31
Table 8. Participants interviewed about the moving warehouse
Category Interviews Focus groups
Implementers 34 12
Designers 1
Decision-makers 1
Third-party stakeholders 2
Total 38 12
An overwhelming percentage of those interviewed believed the intervention to be appropriate (95%), while the remaining respondents reported that they did not know. Similarly, 98 percent of those interviewed reported that the intervention was either acceptable (54%) or very acceptable (44%). The most reported factors of acceptability include the availability of vaccines and commodities and saving time and money. One focus group participant explains the difference having the vaccines on hand can make in service delivery:
I'll again speak about the problem of stockouts because before the implementation of the warehouse, we had children who could not complete the vaccination schedule. Each time their mothers came to the health center, they were told that the vaccine was not available and when this occurred two or three times, they would not come back. This is no longer the case. Now anyone coming to the health center can be vaccinated…vaccines are available all the time.
Focus-group participant
Other respondents mentioned some remaining factors of unacceptability that held them back from choosing that the intervention was “very acceptable.” As this respondent mentions, a factor of unacceptability is the lack of other products in the current delivery schedule:
Other products should be added. The problem of the EPI is currently resolved. Today I'm missing a lot of products. If you go to Dagana district there are many shortages. I stayed one week with a lot stockouts. So if you add many other products, we would be in a much better position.
Nurse, rural area
Other factors of acceptability mentioned by respondents were calculation of the vaccine needs, incorrect estimates of stock leading to insufficient stock, as well as the lack of involvement of the facility-level staff in making decisions about the moving warehouse including vaccine stock orders.
4.6.1. Factors of Feasibility
All respondents found the moving warehouse feasible, 54 percent (n = 20) found it very feasible and 46 percent (n = 17) feasible. Factors of feasibility cited include the quality and availability of vaccines and the engagement of stakeholders. Conversely, the lack of engagement from stakeholders was listed as the main factor of unfeasibility of the intervention, along with

32 OPTIMIZE
inadequate supply in some areas (mainly due to the seasonal flooding that occurs). These respondents illustrate some factors of feasibility that they encountered:
For me it is very doable. What you need to do is take vaccines and bring them to well identified locations while maintaining targets. I think it is doable. Everyone can do it cheaply. Just have a good organization, a precise timetable. If this is the case, at my level it should not be a problem. Having a set schedule is much more difficult but with a little determination you can achieve this schedule. So, now as it is acceptable, it should not be a problem.
Implementer, rural area
It makes it easier for people to do their job properly. The products are always available. Before you would go and you were told there is no vaccine and you go back, now this has substantially reduced the stockouts.
Implementer, rural area
The majority of respondents believed that the intervention should be continued (95%), while over three-quarters (77%) believed that the intervention should continue permanently (2 out of 39 thought it should continue for less than 5 years, 5 out of 39 thought it should continue for 5 to 10 years, and 2 did not know). This respondent thought the intervention should be continued based on the good results:
But it is acceptable, and it is a success. It gave good results. When experimentation gives good results there’s no reason not to continue it. Now what remains to be seen is that all the conditions are right for the continuation of this intervention.
Physician, national level
Another respondent mentioned that it would be considered a great regret if the intervention did not continue:
The only comment I can make is that it would be a pity and a setback for the Expanded Program on Immunization if the Optimize project withdraws. It would be really unfortunate. A pity because it will be a setback for the performance of the district. It would be a great pity if project Optimize stopped its activities today. Because thanks to the uninterrupted vaccine supply we are hopeful to achieve good results.
Nurse, rural area
The moving warehouse intervention has been considered a success by a large sample of interview and focus group participants in the areas of acceptability and feasibility. While the respondents did offer several helpful suggestions for improvement and scale-up, they listed more concerns about the intervention not continuing than needed improvements.
4.7. Investment costs The investment cost of the moving warehouse demonstration was estimated at $336,000. This included equipment, transportation, fuel and maintenance, personnel, formative assessments, planning, advocacy, awareness raising, training, and communication. The largest share of the investment cost was for equipment, which accounted for 63 percent of the investment, as shown in Figure 15.

Senegal Report 33
Figure 15. Investment costs for moving warehouse intervention
Personnel, formative assessments, and network costs each accounted for about 8 to 9 percent of the investment costs. Direct project personnel may be underestimated, as it omits continuous planning, supervision, and other key activities that contributed to the implementation and operation of the moving warehouse.
Table 25 on page 56 compares the estimated investment costs for the intervention and the investment cost per dose delivered.
4.8. Challenges
4.8.1. Strikes affecting data collection
A major problem that affected the project was the long-running strike by health workers in which they withheld from their supervisors important information concerning the number of people vaccinated. As discussed in section 4.5.4, this has left moving warehouse staff and district health management teams with no data on immunization coverage or stockout duration.
The withholding of data affects not only the EPI but all public health programs. It leaves the programs with access only to input and process indicators (such as the number of syringes or vaccine doses delivered) and hence, prevents them from assessing the effect of their interventions. For example, Optimize could not assess the impact of the moving warehouse on vaccine coverage and on the incidence of vaccine-preventable diseases.
4.8.2. Gaining acceptance
An initial challenge for the moving warehouse demonstration was to make the concept acceptable to all stakeholders at regional, district, and health-facility levels and also to all public health
63%
3%
8%
9%
4%
2% 1% 8%
2% Equipment
Transportation Fuel and Maintenance
Personnel
Formative assessments
Planning
Advocacy and awareness raising
Training
Network/communication
Other

34 OPTIMIZE
programs. This same challenge was also faced by the supply chain integration demonstration project, and is described in section 3.8.1 on page 17.
Apprehensions and concerns were centered on the potential consequences associated with the disappearance of the district store, which was perceived as posing a threat to the district’s income (the drug cost-recovery program is an important source of finance). As a result, during a workshop held in Saint-Louis in December 2009 the decision was made for the moving warehouse to restrict itself to the distribution of vaccines and immunization consumables, contraceptives, and other free products. Essential medicines would not be included, as they were sold to clients, and the flow of funds would have been complicated if they were distributed by the moving warehouse.
Thanks to both the proven success of the moving warehouse deliveries and an intensive advocacy and communication effort, resistance to the moving warehouse was reduced. During conferences held from July 27 to 30, 2011, health committees from the five districts expressed their wish to contribute to the financial costs of the moving warehouse as much as possible and showed significant support for the integration of essential drugs in moving warehouse deliveries. This was a strong indication of acceptability, as the same integration was refused during the moving warehouse consensus workshop in December 2009.
From early 2012, all district health committees and most public health programs (namely reproductive health, AIDS, malaria, and TB programs) have supported distribution of essential medicines and public health drugs and health products by the moving warehouse. Now the challenge is to design and implement an operational model that will enable these programs and stakeholders to contribute to the expenses of the moving warehouse.
4.8.3. Taking advantage of improved stock data
Although the moving warehouse is now supported by the region’s medical management teams and district health management teams, the latter have not taken advantage of data provided by the moving warehouse team on existing stock levels and quantities of vaccines, drugs, and other public health products distributed to health posts. Taking advantage of these data would have enabled them to more closely monitor stock levels and movements at the district and regional level.
District and regional health management teams have been more interested in data on coverage and disease incidence because this information is requested from them by their supervisors to assess their performance. But because of the ongoing strike by health workers, the data have been unavailable. The lack of outcome and impact data that interests EPI supervisors the most is likely the cause of their lack of interest in input and process data, including vaccine management data. Consequently, their scheduling, monitoring, and supervision responsibilities received a lower priority, leaving the moving warehouse without proper oversight and supervision.
Senegal Report 35
4.9. Lessons learned
4.9.1. The importance of a participatory approach
The moving warehouse intervention necessitated changes to practices that have been in place for more than three decades and involved a dramatic institutional and technical transformation of the supply system. As described in section 4.8.2 on page 33, there was understandable resistance to such change. As a result, the concept of the moving warehouse and each step of its implementation needed to be thoroughly discussed with administrative authorities and with health committees at regional and district levels in order to obtain their support. The participative approach adopted from the start of the collaboration with Optimize (consensus workshop, orientation sessions for managers at various levels, health committee conferences, etc.) promoted stakeholder acceptability and appreciation of the moving warehouse.
4.9.2. Data are essential
Potential stakeholders are convinced by facts and data providing evidence of success and often wait for such evidence before fully engaging in a new system. It was only after evidence of successful vaccine deliveries by the moving warehouse for nearly one year that other public health programs (reproductive health, AIDS, malaria, and TB) started to include their products. Similarly, district health committees who initially did not want the moving warehouse to deliver drugs intended to be sold to clients only started including these drugs in the moving warehouse after seeing one year of moving warehouse implementation.
4.10. Next steps Optimize recommends that the MOH takes the following steps.
4.10.1. Establish a working group to assess funding opportunities for the moving warehouse
A working group should conduct a study to prepare a business case on financing the moving warehouse in Saint-Louis. This study should clarify the impact of the distribution of free products by the public health and essential medicine programs on the profitability of the moving warehouse and the reduction of distribution costs. This clarification of responsibilities and financial contributions from public health programs and health committees will allow the institutional and financial aspects of the moving warehouse to be formalized in the framework of the updated “Agreement for the Integration of Vaccines in the PNA Supply System” between the MOH and PNA. Until now, these aspects have been of secondary importance because Optimize has covered all costs relating to the moving warehouse demonstration.
4.10.2. Draw up a budget for the moving warehouse scale-up plan
This task should be managed by the group established by the Minister of Health to scale up successful Optimize demonstration projects. It should include a section on mobilizing resources
36 OPTIMIZE
to target partners (USAID, in particular) who have expressed an interest in funding the moving warehouse or who are active in other regions and wish to expand the moving warehouse to their areas.
4.10.3. Conduct a study on pooling moving warehouses between regions
A study on pooling moving warehouses between regions (rather than each region having its own moving warehouse system) could help to convince health regions to accept this pooling if it is shown to be cost-effective. It could also address related issues such as how to share costs and coordinate PRAs, how to implement the program in a way that satisfies each region, and how to optimize delivery routes across regions. This may require changes to established rules (for instance, supplying the most remote health posts on a quarterly rather than monthly basis or working across administrative borders where it is more efficient to do so).

Senegal Report 37
5. VISION AND SCALE-UP
5.1. Overview The Senegalese MOH’s National Health Development Plan for 2009 to 2018 sets out ambitious targets for public health care programs, including immunization. To help meet these challenges, Optimize worked with stakeholders in Senegal’s health care system to:
• Define a vision of what Senegal’s pharmaceutical health supply systems will look like in the future. To this end, the “Vision of Pharmaceutical Health Supply Systems in Senegal by 2020” (VISAP 2020) was agreed to by stakeholders during a workshop in May 2012.
• Develop a strategic plan to promote the scale-up of successful Optimize interventions. To this end, several workshops were conducted in 2011 and 2012 to create a plan that was supported by stakeholders to scale up successful Optimize interventions.
5.2. Implementation The process for drawing up a strategic scale-up plan was based on the ExpandNet methodology detailed in “Nine steps for developing a scaling-up strategy” and required the preparation, implementation, and follow-up of various activities.v Table 9 describes the activities that were conducted.
Table 9. Vision and scale-up timeline
Year Month Milestone
2011 May to September
Prepared for the workshop to draft the scale-up plan.
Established contact with GEXCOM, the group set up by the MOH to promote and supervise scale-up efforts.
October Conducted a workshop to draft the scale-up plan. A training workshop on ExpandNet’s scale-up strategy also took place.
2012
November 2011 to April 2012
Circulated the draft scale-up plan to partners and ExpandNet for review.
May 2 to 3 A second workshop to adopt the revised draft scale-up plan took place.
May 7 to 8 A workshop to adopt a long-term vision for the development of pharmaceutical supply systems (VISAP 2020) took place.
v This document is available on the ExpandNet website: http://www.expandnet.net/PDFs/ExpandNet-WHO%20Nine%20Step%20Guide%20published.pdf

38 OPTIMIZE
Year Month Milestone
May 8 to 9 Training of relevant stakeholders and partners on the HERMES modeling tool of the University of Pittsburgh and its use as a visioning tool was conducted.
August 31 Official note was signed by the Minister of Health and Social Action creating the Vision and Scale-up Support Group.
Acronyms: HERMES = Highly Extensible Resource for Modeling Supply Chains; MOH = Ministry of Health; VISAP 2020 = Vision of Pharmaceutical Health Supply Systems in Senegal by 2020.
5.3. Results VISAP 2020 and a strategic scale-up plan have been created. These two documents which were drafted by the multipartner working groups must now be finalized and submitted to the Minister of Health and Social Action for adoption. In addition, a draft scale-up plan for the expansion of the moving warehouse to the Djourbel, Louga, and Matam medical regions has also been elaborated.
The creation of these documents during workshops conducted with stakeholders has stimulated a debate on the optimization of the pharmaceutical supply chain within the country. Ideas such as interregional stores (or hubs) and the pooling of logistic resources between multiple medical regions are now being discussed between the PNA, multiple public health projects, and other partners such as USAID.
The Vision and Scale-up Support Group was officially established on August 31, 2012, by the Minister of Health and Social Action. This high-level political commitment send a strong signal and gives hope that the group will be able to successfully finalize the scaling up plan and VISAP 2020 documents, validate them, and that resources will be dedicated to support and monitor their implementation.
5.4. Next steps The “Vision and Scale-up Support Group” established by the Minister of Health should undertake the following activities to enable the country to benefit from successful Optimize interventions:
• Finalize the VISAP 2020 document and scale-up strategic plan and share them with stakeholders; this could entail the prioritization of interventions among regions, depending on the MOH health sector development plan.
• Submit the finalized scale-up plan to GEXCOM to obtain their authorization and backing before submitting it to the Minister. It is hoped the Minister will officially adopt and endorse both the VISAP 2020 document and the scale-up plan.
• Mobilize the resources necessary for the implementation of the VISAP 2020 document and the scale-up plan.

Senegal Report 39
The implementation of the scale-up strategic plan must fit into the PNA development strategy. This could be achieved via a gradual, two-stage approach:
1. A two-year scale-up project for maintaining the moving warehouse and PRA system in Saint-Louis and extending the same system to five additional regions.
2. Preparation of a national supply system reinforcement plan with the PNA to cover all remaining regions.
A concept note based on the above-listed two steps has been prepared and is being discussed with various partners in order to mobilize necessary resources for its implementation.

40 OPTIMIZE
6. MODELING THE COSTS OF SENEGAL’S VACCINE SUPPLY CHAIN
6.1. Overview To investigate potential changes to Senegal’s vaccine logistics system that can enable it to meet its future immunization needs, Optimize created a model of Senegal’s vaccine supply chain. The specific objectives were to:
• Estimate the baseline costs of the current vaccine supply chain logistic system.
• Estimate the costs associated with specific demonstration country interventions.
• Estimate the costs associated with potential future scenarios that demonstration countries may consider.
• Generate cost estimates that will be used as input into measuring efficiency of the proposed changes to the vaccine supply chain logistic system.
The model is composed of two different tools:
1. A costing tool created by Optimize that provides an overview of the cost and efficiency of Senegal’s vaccine supply chain system and includes information on:
o Baseline costs for the current vaccine supply chain.
o Changes to costs and other supply chain metrics associated with the moving warehouse intervention.
o Costs associated with new vaccine introductions and also changing the structure of the supply chain based on possible scenarios suggested by the Senegalese EPI program.
2. A modeling tool created by the University of Pittsburg’s Vaccine Modeling Initiative called HERMES, the Highly Extensible Resource for Modeling Supply Chains. It can provide simulations of scenarios suggested by the Senegalese EPI program and can produce the following key outcomes for each scenario:
o Vaccine availability: Percentage of vaccine available to meet projected demand.
o Storage capacity utilization: Percentage of available storage capacity used by vaccines.
o Transport capacity utilization: Percentage of available transport capacity used by vaccines.
This chapter provides a summary of the methodology used and the results of the simulations and costing exercises done on the various scenarios.

Senegal Report 41
6.2. Methodology
6.2.1. Costing tool structure
In order to model Senegal’s vaccine supply chain logistic system, project Optimize developed an Excel-based costing tool to capture the structure, resource use, and costs of the supply chain. The costing tool consists of a series of modules including the transport, cold chain, storage, human resources, and vaccine modules of the national supply chain. Each module was designed so that:
• Baseline and scenario information can be entered.
• Each component of the logistics system is included, such as transportation and cold storage.
• Each level of the supply chain is included within each component.
The tool was designed for EPI vaccines in the routine system, including BCG, DTwP, Hib, HepB, OPV, measles, yellow fever, and TT. Costs are estimated for a fully immunized child receiving ten doses of the routine EPI vaccines and pregnant women receiving two doses of TT.
6.2.2. Data sources
In order to populate the costing tool, we used a micro-costing approach to collect primary data from each level of the EPI system on all resources, such as capital equipment costs, personnel costs, supply costs, and other running costs related to different modes of transport and storage.
Complementary secondary data were collected on the EPI schedule, vaccine type, quantity and prices, salaries, distances between supply points at each level of the vaccine supply chain logistic system, and other administrative-type data. Primary data were collected from a sample of facilities, as described below.
6.2.3. Data collection sites
A convenience sample of facilities was included in the analysis. These sites include facilities where project Optimize interventions were taking place. Data were collected in January 2011 at selected facilities in the Saint-Louis region (where the moving warehouse intervention was implemented).
Data for the PNA national store and PRA regional store (MCR) in Saint-Louis were collected in November 2009 and updated and augmented during field visits in August 2011 and May 2012. The list of facilities included in the Phase 2 data collection is shown in Table 10.
Table 10. Costing data collection sites in the Saint-Louis region
District Health centers
Saint-Louis Diamaguene
Mpal

42 OPTIMIZE
District Health centers
Dagana Diagle
Santhiaba
Richard-Toll Ndiattene
Taouey
Podor Demette
Ndioum
Sinthiou Ndande
6.3. Conceptual model for costing methods
6.3.1. Supply chain cost functions
The two main functions that we consider for costing are the storage function and the distribution/transportation function. Not all levels of the supply chain perform these two functions. For the storage function, typically, the national vaccine store is responsible for the procurement of vaccines and dry goods supplies for the entire country and hence may also be the first in-country storage point for the vaccines and supplies coming from suppliers. At the lower levels of the supply chain, such as the service delivery points, they may not perform the storage function because the facilities do not necessarily have cold chain equipment required to perform this function.
The distribution/transportation function can occur through a collection system or a delivery system. Before the implementation of the moving warehouse, the facilities in Saint-Louis region were operating on a collection system, where the lower-level facilities collected vaccines and consumables from the higher-level facilities.
6.3.2. Main cost components in the tool
The main cost categories for storage and distribution functions are shown in Table 11.
Table 11. Supply chain costs by function
Dry goods transportation
Dry goods storage Vaccine storage Vaccine transportation
Vehicle depreciation
Infrastructure Equipment depreciation
Vehicle depreciation
Fuel Energy Fuel
Insurance Infrastructure Insurance
Maintenance Equipment maintenance
Maintenance

Senegal Report 43
Dry goods transportation
Dry goods storage Vaccine storage Vaccine transportation
Labor Labor Labor Labor
Storage costs include the annual depreciated value of the cold chain equipment and the cold chain energy costs; the labor costs attributed to procuring, ordering, and managing vaccine and dry goods stocks; costs for infrastructure; and maintenance for the cold chain equipment. Distribution costs include the direct labor time spent on transporting commodities and per diems; the depreciation of vehicles attributed to logistics; fuel, maintenance, and insurance costs for the vehicles attributed to logistics; and contracts for using third-party logistics companies or public transport for the trips. These costs by function were calculated separately for vaccines and dry goods, where dry goods included injection and reconstitution syringes and safety boxes.
The costs for staff time for vaccinating children were excluded because the focus of the analysis was on the costs of the supply chain. Other than electricity costs for running the cold chain, the analysis did not include any other indirect overhead costs, such as electricity for the office space, water, or telecommunications. Supervision time may be underestimated.
6.3.3. Throughput
The throughput was the annual number of doses of vaccines distributed to each level. When available, these data were obtained from stock-ledger data at each warehouse or facility during data collection and from vaccine arrival reports at the national vaccine store. When stock-ledger data were not available, we used the population data, coverage data, and wastage rates to estimate expected demand. In addition to doses delivered, another throughput measure is the corresponding volume of vaccines distributed using the packed volume of each dose of vaccine and the value of the vaccines distributed using the vaccines prices.
6.3.4. Cost measures and supply chain metrics
Several cost measures and supply chain metrics can be calculated from the costing tool that captures total and unit costs and provides different ways of capturing the efficiency of Senegal’s supply chain system (Table 12 and Table 13). The building blocks of the cost analysis are the total and cost per dose at each level of Senegal’s system; however, costs can also be estimated by function or by input type. The aggregate supply chain logistic cost per dose from the national level origin to the final health center destination is defined as:
Cost per dose at the national store + Cost per dose at the region + Cost per dose at the district + Cost per dose at the health center

44 OPTIMIZE
Other metrics include the cost per volume and logistics cost as a percentage of the value of the vaccines.vi These estimates can help evaluate the performance of the vaccine supply chain system and capture the efficiencies of the system in storing and transporting vaccines and immunization supplies through the system. The latter estimate can be useful to inform reasonable rates for handling fees based on the value of the commodities.vii
Table 12. Cost measures estimated from the tool
Cost Description
Total annual supply costs
Annual total storage and transportation costs for the facility.
Total costs by function Total storage costs for the facility.
Total transport costs for the facility.
Total cost by input Labor costs.
Cold chain equipment depreciation costs.
Cold chain maintenance costs.
Cold chain energy costs.
Vehicle depreciation costs.
Transport recurrent costs.
Infrastructure costs.
Cost drivers per tier The cost inputs or cost functions that account for the largest share of the supply chain costs.
Average supply chain costs
The average supply chain costs for each tier or for a subgroup of facilities in the same tier.
Table 13. Supply chain metrics
Cost measure Notes Formula
Cost per dose at the facility
Calculated at each facility. Total annual supply chain costs divided by the annual number of doses of vaccines distributed.
Cost per dose The core indicator for the model aggregated across tiers. It measures the cost of moving a single dose of vaccine from the national store to the commune health center.
Sum across facilities (cost per dose at the national store, regional store, provincial store, district store, and health center).
vi DELIVER. Monitoring and Evaluation Indicators for Assessing Logistics Systems Performance. Arlington: DELIVER; 2006. vii Baruwa E, Tien M, Sarley D. Zambia ARV Supply Chain Costs: A Pilot of the Supply Chain Costing Tool. Arlington: USAID | DELIVER PROJECT; 2010. Available at: http://tinyurl.com/b46qac6.

Senegal Report 45
Cost measure Notes Formula
Cost per cm3 of vaccines
Calculated for each facility and for vaccines only.
Vaccine supply chain costs divided by the volume of vaccines distributed to the facility.
Logistic costs as a percentage of vaccine values
Calculated for each facility and for vaccines only. This is a ratio of the measure above on the cost per $1,000 worth of vaccines.
Vaccine supply chain costs multiplied by 100 divided by the value of vaccines distributed to the facility.
6.3.5. Estimating total costs for Saint-Louis region
Our objective of the Phase 2 analysis was to estimate the supply chain costs for the Saint-Louis region before and after implementation of the moving warehouse intervention. We estimated the total logistics costs for the districts and health centers by multiplying their respective estimated average costs by the corresponding number of facilities in each tier. We also apportioned part of the logistics costs at the national level to the region. The national store delivers vaccines to six regions using a rented vehicle, while eight regions, including the Saint-Louis region, collect vaccines from the national store. So, we did not allocate any of the national transport costs to the Saint-Louis region. We multiplied the estimated national store logistics costs (which included human resources, cold chain storage costs, and buildings) by 7%, which is the proportion of national vaccines that go to the Saint-Louis region. Thus estimated baseline total costs for the regions were estimated as follows:
Total logistics costs for MCR—Saint-Louis = (7% x national logistics costs) + costs for MCR—Saint-Louis + (5 x district average costs) + (101 x health post average costs)
With the implementation of the moving warehouse, the storage and management function of vaccines was shifted to PRA—Saint-Louis. Therefore, we only included the human resource costs for MCR—Saint-Louis which were estimated based on the reported amount of time that the personnel were now spending on logistics given the restructuring. PRA—Saint-Louis performed all the supply chain functions including storage and distribution and so all the relevant costs associated with those functions were included. We also assumed that the districts only kept one refrigerator for storing buffer stock. The role of the districts with the moving warehouse was mainly supervision of the logistics system.
The costs for PRA Saint-Louis were estimated as follows:
Total logistics costs for PRA—Saint-Louis = (7% x national logistics costs) + adjusted human resource costs for MCR—Saint-Louis + costs for PRA—Saint-Louis + (5 x adjusted district average costs) + (101 x health post average costs)

46 OPTIMIZE
6.4. HERMES supply chain modeling
6.4.1. Model description
HERMES, the Highly Extensible Resource for Modeling Supply Chains, can generate detailed discrete event simulation models of each supply chain, explicitly representing every location, device, vehicle, person, and process to identify complex dynamic relationships and effects.viii Comprehensive input data for Senegal’s supply chain for the Saint-Louis region was used to generate a detailed dynamic simulation model of that supply chain. For Saint-Louis, the model represented for each of the sampled storage location’s storage devices (e.g., refrigerator, freezer, cold room, cold box, and vaccine carrier), vehicles, immunization locations, personnel, vaccines, and diluents. The other locations in the supply chain in Saint-Louis are represented in the baseline model as a bundle of health centers that have the vaccine demand based on the total population for all other health centers. When modeling the mobile warehouse scenario, a standard refrigerator was assumed to be at each health post with the labor force assumed to be the average of the sampled health posts. A computational entity represents each vaccine vial in the system, complete with a set of characteristics such as antigen type, doses per vial, vial type, and packaging size. Millions of vaccine vial entities flow through the system simultaneously. At each immunization location, immunization sessions occur according to a schedule based on both country data and policy.
At each immunization session, virtual patients arrive at that immunization location for specific vaccines indicated for their ages. To determine the number of children and pregnant women that would arrive at each location, we used the 2010 populations gathered from the questionnaire and extrapolated them to the 2011 populations by multiplying by a growth rate of 2.5%.ix Infant mortality rate (5.6%)ix was applied when estimating the number of surviving children 0 to 12 months old. For the current Senegal EPI vaccines, we used the following coverage rates for the baseline.
Table 14. EPI vaccine coverage rates for baseline
Vaccine Coverage rate (percentage of target population)
BCG 90%
DTP-HepB-Hib 90%
Measles 80%
Tetanus toxoid 80%
Oral polio vaccine 80%
Acronyms: BCG = bacillus Calmette-Guerin; DTP = diphtheria-tetanus-pertussis; HepB = hepatitis B; Hib = Haemophilus influenzae type B.
viii Lee BY, Assi TM, Rookkapan K, et al. Maintaining vaccine delivery following the introduction of the rotavirus and pneumococcal vaccines in Thailand. PLoS One. 2011;6(9):e24673. ix The World Factbook 2009. Washington, DC: Central Intelligence Agency; 2009. Available at: https://www.cia.gov/library/publications/the-world-factbook/index.html

Senegal Report 47
The targeted coverage rates for the vaccines to be introduced by 2015 are Pneumococcal-13 at 80 percent and rotavirus at 80 percent.
Each simulation run can continue for any number of virtual days specified by the user (a year was used in this model). The model can track a wide variety of statistics each virtual day for each storage device, immunization location, and transport vehicle, such as the available storage and transport capacity and its current utilization, vaccine wastage, inventory, and vaccine doses delivered at each facility. Additionally, at each immunization location, each session's vaccine availability is calculated by taking the number of individuals successfully vaccinated and dividing by the number of individuals arriving to be vaccinated.
The key outcomes measured for this analysis are:
• Vaccine availability: Percent of vaccine demand successfully fulfilled.
• Storage capacity utilization: Percent of available storage capacity used by vaccines.
• Transport capacity utilization: Percent of available transport capacity used by vaccines.
6.4.2. HERMES with costing: methods and outputs
HERMES generated models of the baseline and each scenario. The estimated vaccine availability and number of doses administered were generated from each analysis. In addition, the HERMES model also output the corresponding number of trips that had to be taken to collect or deliver vaccines under each scenario, based on the available transport capacity and volume of vaccines needed by facilities per supply interval.
Transport costs, human resource costs, and storage costs were estimated for each scenario using the costing tool previously described, with some costing inputs changed to match the output from the HERMES model. For example, the number of trips between delivery points that was simulated by the HERMES model was input into the costing tool to estimate the corresponding transport costs for each scenario.
Also, the round-trip distance traveled was used to estimate the amount of time health workers would spend on each trip, and this was used to estimate staff costs for vaccine logistics and also to assign per diem payments per trip. Based on communication with EPI staff, we assumed that staff at the national and regional stores were paid a per diem of 15,000 FCFA (~US$30) per day for trips to deliver vaccines.
For the scenarios where a transport or storage constraint was driving vaccine availability down, the additional capacity required to alleviate the bottlenecks was estimated. The corresponding cold chain or transport resources needed were added to the current resources included in the costing tool to estimate the new economic costs associated with alleviating the bottlenecks.
The main metric for HERMES with costing analyses was the supply chain cost per dose administered, which was estimated by dividing the logistics costs estimated for each scenario by the tabulated number of doses administered.

48 OPTIMIZE
6.4.3. Description of scenarios
Table 15 includes a description of the scenarios that were modeled for the Saint-Louis region.
Table 15. Scenarios modeled for the Saint-Louis region
Model Description
Baseline The system before the implementation of the moving warehouse, where the lower-level facilities from the regional level down collect vaccine from the upper-level facilities.
Scenario 1 The moving warehouse demonstration project, where vaccines are delivered from the PRA regional store to 115 health posts. The same route plan and delivery circuits used by the moving warehouse were included in the model.
Scenario 2 A modification of the baseline model, assuming that:
• The PNA national store delivers vaccines directly to the district stores, bypassing the regional store.
• Health posts continue to collect vaccines from the district stores.
This analysis presents the results for the Saint-Louis region only.
Scenario 3 A modification of the baseline model, where the PRA regional store delivers vaccines to the district stores (rather than the district stores collecting vaccines from the PRA regional store). Health posts would continue to collect vaccines from the districts.
Scenario 4 A modification of the baseline model, where the PNA delivers vaccines to all the regions using a rented refrigerated vehicle.
Acronyms: PNA = National Supply Pharmacy; PRA = Regional Supply Pharmacy.
Each of these scenarios was evaluated for the current EPI schedule for the current baseline system and for a schedule that included the introduction of pneumococcal and rotavirus vaccines, assuming no new investments in supply chain infrastructure (a constrained system).
Lastly, we evaluated the baseline and moving warehouse scenario (scenario 2) for the introduction of new vaccines (pneumococcal and rotavirus) when the system is unconstrained—that is, investing in required cold chain equipment to alleviate any storage bottlenecks.
6.4.4. Baseline costing model results
Table 16 shows the estimated total costs for each level of the vaccine supply chain in the Saint-Louis region before the implementation of the moving warehouse. Average costs per facility were lowest at the heath posts, but the total costs attributed to this level were 70 percent of the costs because of the large number of facilities. The estimated annual supply chain cost for the entire region was $130,429.

Senegal Report 49
Table 16. Baseline estimated annual logistics costs for the Saint-Louis region (US$)
Cold chain equipment
Labor and per diems
Transport Buildings Total % of total
PNA† $3,286 $633 ‡ $172 $4,091 3%
Saint-Louis medical region
$3,265 $9,420 $4,359 $17,044 13%
Districts (n=5) $5,693 $9,204 $3,682 $18,579 14%
Health posts (n=101)
$47,635 $33,962 $9,118 $90,715 70%
Total $59,879 $53,219 $17,159 $172 $130,429
† Only includes the share of storage, transport, and building costs allocated to the Saint-Louis region.
‡ The national store delivers vaccines to 9 of the 14 regions. However, Saint-Louis is not one of those regions, so no transport costs were allocated.
Acronyms: PNA = National Supply Pharmacy.
There are 371,400 doses delivered to the region, resulting in an estimated cost per dose of $0.35, as shown in Table 17. Logistics costs were 36% of the value of vaccines, with diseconomies of scale at the lower-level tiers as expected. The logistics cost per fully immunized target group was $4.21.
Table 17. Cost metrics for the Saint-Louis region
Cost per dose Cost per cm3 Logistics costs as % of value of vaccines
PNA† $0.01 $0.002 1%
Saint-Louis medical region $0.05 $0.01 5%
Districts $0.05 $0.01 5%
Health posts $0.24 $0.04 25%
Total $0.35 $0.05 36%
† Only includes the share of storage, transport, and building costs allocated to the Saint-Louis region.
Acronyms: PNA = National Supply Pharmacy.
Figure 16 presents the cost profile by input type. Cold chain equipment costs represented the largest share of cost, accounting for 46 percent of the total. Labor and per diems accounted for 41 percent.

50 OPTIMIZE
Figure 16. Cost profile by input type
6.4.5. Moving warehouse baseline costing model results
Table 18 shows the estimated total costs for each level of the vaccine supply chain in the Saint-Louis region during the implementation of the moving warehouse.
Table 18. Estimated logistics costs (US$) for the Saint-Louis region with the moving warehouse
Cold chain equipment
Labor and per diems
Transport Buildings Total % of total
PNA $3,286 $633 $1,440 $172 $5,531 4%
Saint-Louis medical region
0 $1,104 $1,104 1%
PRA regional store
$11,970 $29,544 $17,210 $58,724 42%
Districts (n=5) $3,154 $6,528 $9,682 7%
Health posts (n=101)
$48,548 $17,317 $65,865 47%
Total $66,958 $55,126 $18,650 $172 $140,906
% of costs by function
48% 39% 13% 0.1%
Acronyms: PNA = National Supply Pharmacy; PRA = Regional Supply Pharmacy.
The moving warehouse transport cost was estimated at $17,210, which includes the fuel, maintenance, and vehicle depreciation costs. Note that this does not include labor and per diems for staff operating the moving warehouse. The total annual logistics cost was estimated at approximately $141,000, and approximately 398,594 doses of vaccines were transported for the 12-month period starting August 2011, resulting in the estimated logistics cost per dose of $0.35.
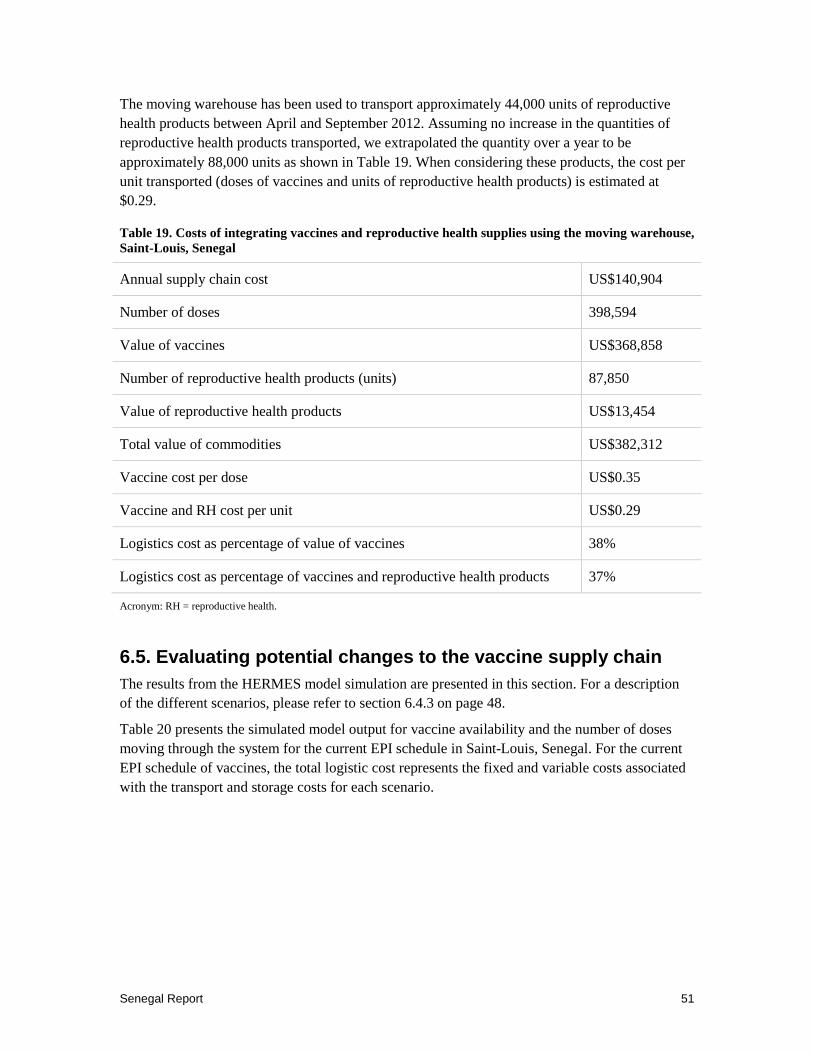
Senegal Report 51
The moving warehouse has been used to transport approximately 44,000 units of reproductive health products between April and September 2012. Assuming no increase in the quantities of reproductive health products transported, we extrapolated the quantity over a year to be approximately 88,000 units as shown in Table 19. When considering these products, the cost per unit transported (doses of vaccines and units of reproductive health products) is estimated at $0.29.
Table 19. Costs of integrating vaccines and reproductive health supplies using the moving warehouse, Saint-Louis, Senegal
Annual supply chain cost US$140,904
Number of doses 398,594
Value of vaccines US$368,858
Number of reproductive health products (units) 87,850
Value of reproductive health products US$13,454
Total value of commodities US$382,312
Vaccine cost per dose US$0.35
Vaccine and RH cost per unit US$0.29
Logistics cost as percentage of value of vaccines 38%
Logistics cost as percentage of vaccines and reproductive health products 37%
Acronym: RH = reproductive health.
6.5. Evaluating potential changes to the vaccine supply chain The results from the HERMES model simulation are presented in this section. For a description of the different scenarios, please refer to section 6.4.3 on page 48.
Table 20 presents the simulated model output for vaccine availability and the number of doses moving through the system for the current EPI schedule in Saint-Louis, Senegal. For the current EPI schedule of vaccines, the total logistic cost represents the fixed and variable costs associated with the transport and storage costs for each scenario.
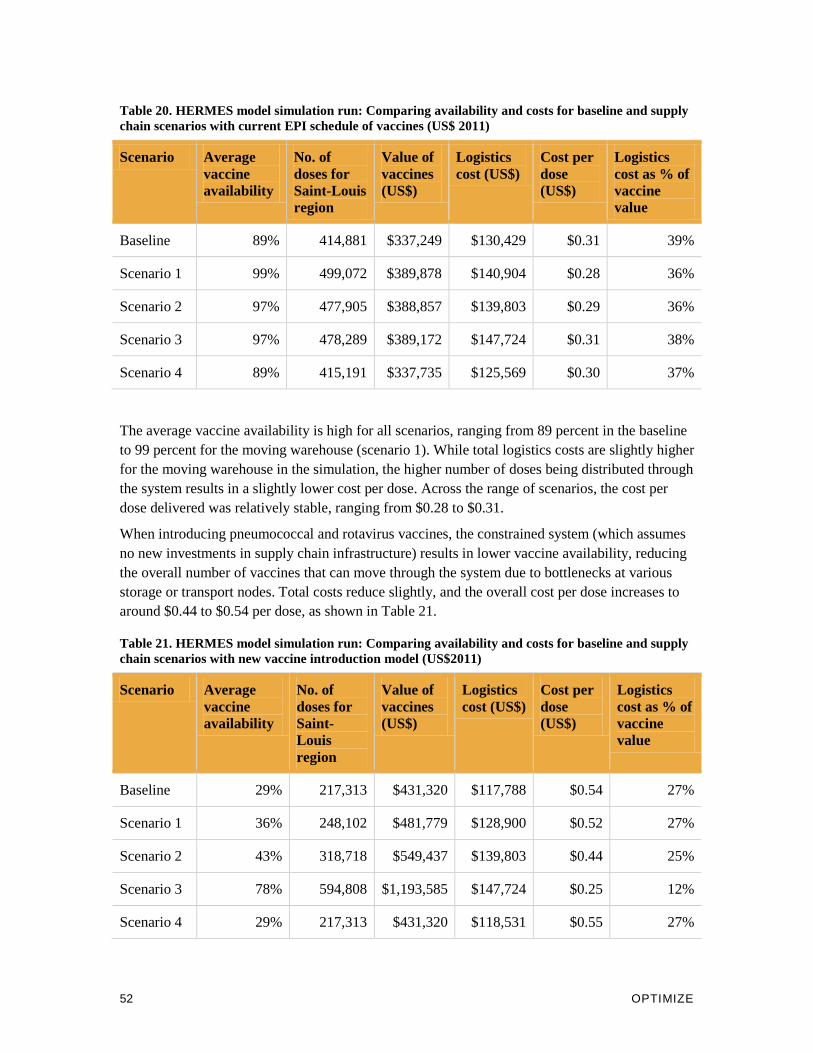
52 OPTIMIZE
Table 20. HERMES model simulation run: Comparing availability and costs for baseline and supply chain scenarios with current EPI schedule of vaccines (US$ 2011)
Scenario Average vaccine availability
No. of doses for Saint-Louis region
Value of vaccines (US$)
Logistics cost (US$)
Cost per dose (US$)
Logistics cost as % of vaccine value
Baseline 89% 414,881 $337,249 $130,429 $0.31 39%
Scenario 1 99% 499,072 $389,878 $140,904 $0.28 36%
Scenario 2 97% 477,905 $388,857 $139,803 $0.29 36%
Scenario 3 97% 478,289 $389,172 $147,724 $0.31 38%
Scenario 4 89% 415,191 $337,735 $125,569 $0.30 37%
The average vaccine availability is high for all scenarios, ranging from 89 percent in the baseline to 99 percent for the moving warehouse (scenario 1). While total logistics costs are slightly higher for the moving warehouse in the simulation, the higher number of doses being distributed through the system results in a slightly lower cost per dose. Across the range of scenarios, the cost per dose delivered was relatively stable, ranging from $0.28 to $0.31.
When introducing pneumococcal and rotavirus vaccines, the constrained system (which assumes no new investments in supply chain infrastructure) results in lower vaccine availability, reducing the overall number of vaccines that can move through the system due to bottlenecks at various storage or transport nodes. Total costs reduce slightly, and the overall cost per dose increases to around $0.44 to $0.54 per dose, as shown in Table 21.
Table 21. HERMES model simulation run: Comparing availability and costs for baseline and supply chain scenarios with new vaccine introduction model (US$2011)
Scenario Average vaccine availability
No. of doses for Saint-Louis region
Value of vaccines (US$)
Logistics cost (US$)
Cost per dose (US$)
Logistics cost as % of vaccine value
Baseline 29% 217,313 $431,320 $117,788 $0.54 27%
Scenario 1 36% 248,102 $481,779 $128,900 $0.52 27%
Scenario 2 43% 318,718 $549,437 $139,803 $0.44 25%
Scenario 3 78% 594,808 $1,193,585 $147,724 $0.25 12%
Scenario 4 29% 217,313 $431,320 $118,531 $0.55 27%
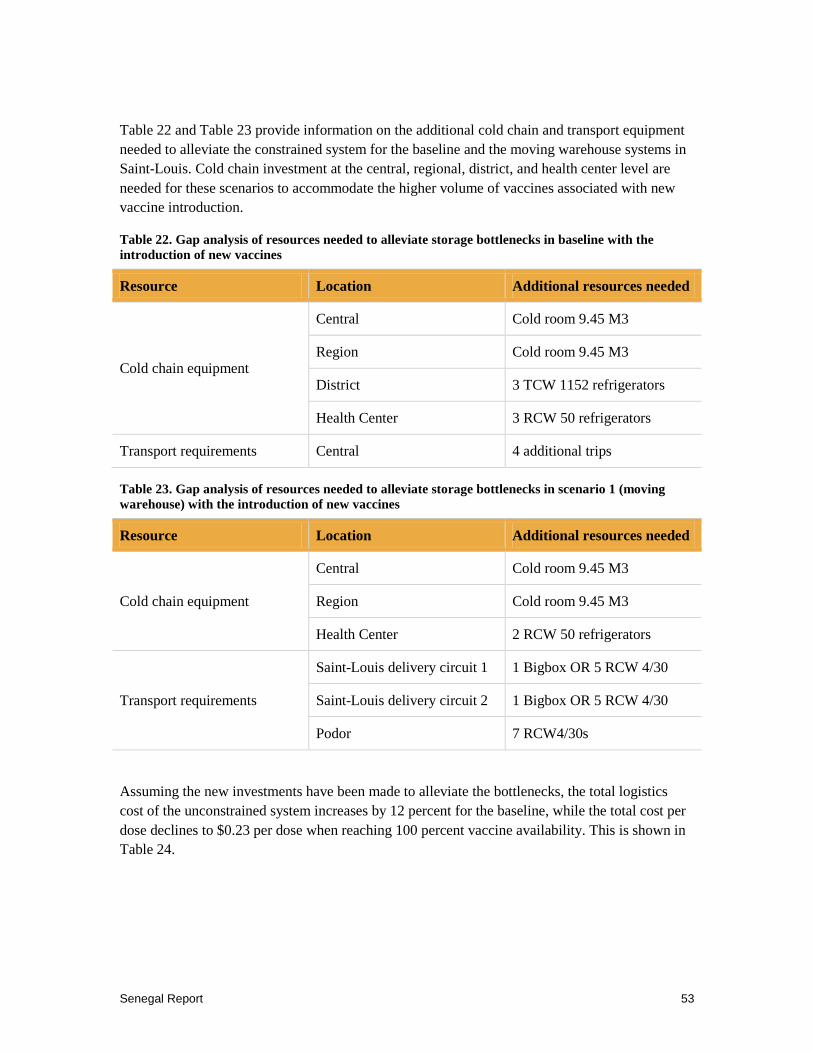
Senegal Report 53
Table 22 and Table 23 provide information on the additional cold chain and transport equipment needed to alleviate the constrained system for the baseline and the moving warehouse systems in Saint-Louis. Cold chain investment at the central, regional, district, and health center level are needed for these scenarios to accommodate the higher volume of vaccines associated with new vaccine introduction.
Table 22. Gap analysis of resources needed to alleviate storage bottlenecks in baseline with the introduction of new vaccines
Resource Location Additional resources needed
Cold chain equipment
Central Cold room 9.45 M3
Region Cold room 9.45 M3
District 3 TCW 1152 refrigerators
Health Center 3 RCW 50 refrigerators
Transport requirements Central 4 additional trips
Table 23. Gap analysis of resources needed to alleviate storage bottlenecks in scenario 1 (moving warehouse) with the introduction of new vaccines
Resource Location Additional resources needed
Cold chain equipment
Central Cold room 9.45 M3
Region Cold room 9.45 M3
Health Center 2 RCW 50 refrigerators
Transport requirements
Saint-Louis delivery circuit 1 1 Bigbox OR 5 RCW 4/30
Saint-Louis delivery circuit 2 1 Bigbox OR 5 RCW 4/30
Podor 7 RCW4/30s
Assuming the new investments have been made to alleviate the bottlenecks, the total logistics cost of the unconstrained system increases by 12 percent for the baseline, while the total cost per dose declines to $0.23 per dose when reaching 100 percent vaccine availability. This is shown in Table 24.

54 OPTIMIZE
Table 24. HERMES model simulation run: Comparing availability and costs for baseline and moving warehouse scenarios with new cold chain and transport investments to accommodate new vaccine introduction (US$ 2011)
Scenario Average vaccine availability
No. of doses for Saint-Louis region
Value of vaccines (US$)
Logistics cost (US$)
Cost per dose (US$)
Logistics costs as % of vaccine value
Baseline 100% 646,120 $1,296,861 $146,421 0.23 11%
Scenario 1 99% 664,363 $1,298,657 $142,102 0.21 11%
Using the moving warehouse, the total logistic supply chain cost increases by an additional 1% to accommodate the introduction of new vaccines, resulting in a lower cost of $0.21 per dose. Comparing this to the cost per dose of the unconstrained baseline ($0.23), the scenario using the moving warehouse would produce a cost saving of 9 percent. Note that the HERMES model simulation does not account for integration of vaccines and other drugs and health products (e.g., reproductive health supplies, etc.). When these products are included in calculations, a more significant cost reduction can be achieved.

Senegal Report 55
7. CONCLUSION
Optimize and the Senegalese MOH worked together to demonstrate several innovations in the vaccine supply chain. In addition, the collaboration established mechanisms for coordination and decision-making at both the national and regional levels that can help the national immunization program meet the demands of an increasingly large and costly portfolio of vaccines. It is important that these mechanisms are supported once project Optimize ends.
• The National Planning and Needs Forecasting Committee created in May 2010 brings together for the first time supply chain managers from various departments and public health programs to discuss issues related to supply chain integration. Its creation is the first step toward institutionalizing supply chain integration in Senegal.
• The regional coordination committee brings together the key players in the Saint-Louis region to coordinate the successful implementation of the activities described in the scaling up and vision plans.
• The “Scaling up and Vision Support Group” established within the cabinet of the Minister of Health evaluates and supports successful demonstration projects, with a view to scale up and implement them in other regions of Senegal. The dynamism of this group, which can be measured by the frequency of its meetings, will be decisive in implementing the strategic scale-up plan.
Optimize also developed a model of Senegal’s vaccine supply chain which can help assess the benefits of changes to Senegal’s vaccine supply system (described in chapter 5). This modeling tool can support the planning, scale-up, and optimization of Senegal’s supply chain. The Department of Planning is best placed to take responsibility for this.
The lessons learned during the implementation of the demonstration projects described in this report, as well as the new technologies evaluated as part of the demonstrations, can substantially contribute to the strengthening of the health system in Senegal and serve as an example to other countries in the region. The MOH should continue its work with health programs and their partners to promote the action plans elaborated by the “Scaling up and Vision Support Group.”
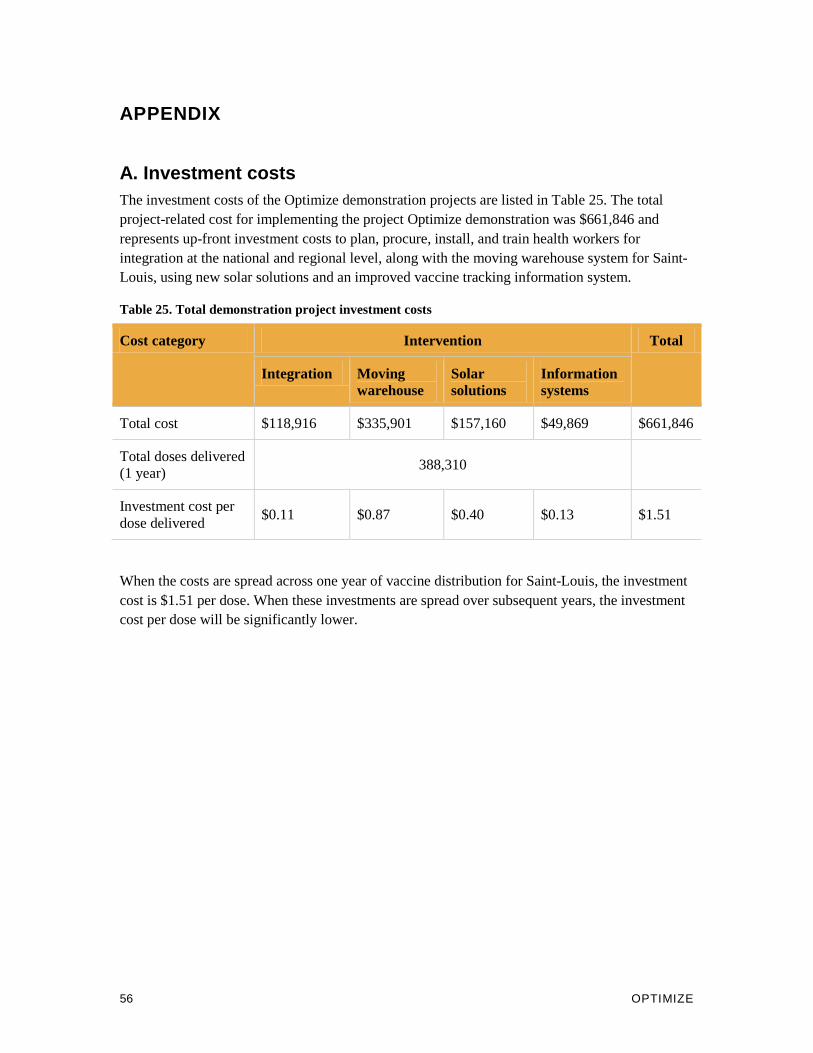
56 OPTIMIZE
APPENDIX
A. Investment costs The investment costs of the Optimize demonstration projects are listed in Table 25. The total project-related cost for implementing the project Optimize demonstration was $661,846 and represents up-front investment costs to plan, procure, install, and train health workers for integration at the national and regional level, along with the moving warehouse system for Saint-Louis, using new solar solutions and an improved vaccine tracking information system.
Table 25. Total demonstration project investment costs
Cost category Intervention Total
Integration Moving warehouse
Solar solutions
Information systems
Total cost $118,916 $335,901 $157,160 $49,869 $661,846
Total doses delivered (1 year)
388,310
Investment cost per dose delivered
$0.11 $0.87 $0.40 $0.13 $1.51
When the costs are spread across one year of vaccine distribution for Saint-Louis, the investment cost is $1.51 per dose. When these investments are spread over subsequent years, the investment cost per dose will be significantly lower.

Senegal Report 57
B. Acceptability and feasibility assessment This component provided for external assessment of the factors that made the interventions acceptable or unacceptable and also feasible and how the interventions affected the health system. The overall purpose of this assessmentx was to identify key advantages and challenges associated with the project Optimize interventions in Senegal within the global project Optimize monitoring and evaluation framework. To accomplish this, the assessment explored the perceptions of stakeholders engaged in the development and implementation of the project Optimize demonstrations in Senegal.xi
This study sought to measure stakeholder perceptions of the acceptability and feasibility of the integration and moving warehouse demonstrations in Senegal (as well as the individual main components of each). The terms “acceptability” and “feasibility” can often overlap. For the purpose of this research, the two terms were defined as follows to help keep them as distinct as possible.
• Acceptability: Acceptability refers to what the stakeholder likes and dislikes about an intervention. An acceptable intervention is desirable and satisfactory.
Examples: An intervention might be considered acceptable because of benefits to mothers and infants with better access to immunization or because of benefits to the MOH immunization staff through reduced workload. An intervention might be considered unacceptable if it has a small benefit for mothers and infants or low benefits to MOH immunization staff through added workload.
• Feasibility: Feasibility refers to the difficulty, or ease, with which the stakeholder can implement required intervention activities. If an intervention is feasible, it is practical and easy to carry out and achieve.
Examples: A feasible intervention is practical to achieve with the available time, staff, and resources. Think about the introduction of a new vaccine. A feasible scenario would be the introduction of a new vaccine that comes in vials similar to existing vaccines and that is handled in the same cold chain conditions as existing vaccines. An unfeasible intervention is not practical to achieve with the available time, staff, and resources. An unfeasible scenario would be the introduction of a new vaccine with packaging so large that you cannot fit enough doses in the district refrigerator, it requires dry ice to be transported, and the shelf life is only a few weeks long.
Regarding general study design and overview of methods, this was a qualitative methods study to provide descriptive findings. A Senegalese research team of consultants used a variety of locally adapted methods to collect and analyze qualitative data obtained from intervention stakeholders. The methods used in completing this evaluation included: semi-structured interviews, focus group discussions, site visits, and stakeholder meetings. The data collection phase took place October to November 2012.
x This assessment was deemed “non-research” in accordance with PATH’s Research Determination Committee’s policies. xi As required by PATH’s Research Ethics Committee for the protection of human research subjects, PATH employees were not included as stakeholders in this research.

58 OPTIMIZE
The team conducted interviews with implementers and decision-makers/stakeholders from key intervention partners, including the pertinent national government ministries, and other implementing partners, including health workers. Each respondent gave verbal consent and was asked to be recorded. Recordings were transcribed and translated and then responses were analyzed using Atlas.ti qualitative software; results were triangulated with the monitoring data.
In addition to the 59 semi-structured interviews, this study conducted four focus group discussions with implementers and stakeholders in order to explore acceptability and feasibility issues from a different perspective in greater detail. Each focus group discussion consisted of an average of six participants and lasted approximately two hours. The final analysis triangulated the interview and focus group data. The findings from the acceptability and feasibility assessment contributed to the five components of the project Optimize global monitoring and evaluation framework.