Embed Size (px)
Citation preview
IEEE TRANSACTIONS ON INSTRUMENTATION AND MEASUREMENT, VOL. 50, NO. 3, JUNE 2001 839
Optimization Study of a Microwave DifferentialTechnique for Humidity Measurement in Gases
J. F. Rouleau, Student Member, IEEE, Jacques Goyette, Tapan K. Bose, Member, IEEE, andM. F. Fréchette, Senior Member, IEEE
Abstract—We present a simulation study of precision humiditysensing in gases by a microwave differential technique. We investi-gate the conditions for the optimization of the system capabilities.The small quantity at the parts per million (ppm) level of watervapor in gases is determined by measuring a shift of the resonantfrequency of a measuring resonator relative to a reference one. Be-cause of some unavoidable differences in the physical dimensionsand electrical characteristics of the setup components, we studiedthe variation of the circuit parameters that could significantly havean impact on the sensitivity of the method. We also considered pos-sible asymmetries between each branch of the circuit. It is con-cluded that our circuit design can tolerate imperfect symmetry ofthe components and still provide good sensitivity, as shown by ourexperimental results.
Index Terms—Cavity, humidity, microwave, moisture content,resonator.
I. INTRODUCTION
ON-LINE monitoring of humidity in some industrialprocess gases and in the food industry in order to prevent
irreversible damage, or to ensure low-cost production, has at-tracted much attention in recent years. From the semiconductorindustry [1] to the agricultural sector [2], on-line moisturesensors are critical to avoid the downgrade of the quality ofchips and microprocessors and to avert microbial degradation.Several conventional sensor-based methods, like the chilledmirror, electrolytic, vibrating quartz, and capacitive hygrome-ters [3], have advantages and limitations and are dependent onspecific applications. On the other hand, microwave techniquesoffer flexibility because of their sensitivity to moisture fromsolid-like materials to gases. Several microwave methodscan be properly adapted for the determination of physicalproperties for material characterization; those methods areoften based on the measurement of the dielectric constant ofthe material under test. While the cavity perturbation techniqueand the open-ended coaxial probe represent practical ways todetermine moisture content for bulk, powdered or particulatesamples [4]–[6], the dielectric cavity resonator is particularlywell suited for humidity determination in gases.
Manuscript received September 7, 1999; revised March 12, 2001. This workwas sponsored by Hydro-Québec. J. F. Rouleau was suppored by the NaturalSciences and Engineering Research Council of Canada and by Le Fonds pourla Formation de Chercheurs et l’Aide à la Recherche.
J. F. Rouleau, J. Goyette, and T. K. Bose are with the Institut de Recherche surl’Hydrogène, Département de Physique, Université du Québec à Trois-Rivières,Trois-Rivières, QC, Canada.
M. F. Fréchette is with the Institut de Recherche d’Hydro-Québec, Varennes,QC, Canada.
Publisher Item Identifier S 0018-9456(01)04686-1.
We have recently reported on a resonant-cavity, microwave-differential model [7] to measure low water vapor content ingases down to the parts per million (ppm) level. The presenceof a contaminant at some concentration of the gaseous mixtureresults in the variation of the permittivity, which is related tothe change of the resonant frequency of a measuring resonatorcompared to a reference one. Preliminary results [8] show a de-tection limit of around 6 ppm, while the estimated detectionthreshold turns out to be about 2 ppm. This detection limit corre-sponds to the quantity of water vapor one can measure when theoutput signal is equal to the noise signal of the setup. The sensi-tivity of this technique is dependent on geometrical differencesbetween both resonators, as well as the electrical characteristicsof the setup devices. In this paper, we present a numerical sim-ulation aimed at demonstrating a sensitivity analysis by varyingphysical parameters relative to the setup which might influenceits performance. We then briefly compare experimental resultsbefore and after considering some observations based on thesimulation.
II. M ICROWAVE DIFFERENTIAL MODEL
A. Differential Setup
The principle of operation of the microwave differential tech-nique is essentially based upon the difference of the reflectedsignal coming out of a measuring resonator with respect to a ref-erence one (see Fig. 1). More specifically, the amplified outputmodulated signal coming from a hybrid junction is mixedwith a carrier signal and is then filtered and detected by alock-in amplifier, so we have [8]
(1)
where is a constant depending on the initial amplitudes of thesignals generated by the microwave synthesizer and the lock-inamplifier, and and are, respectively, the differencesof the real and imaginary parts of the reflection coefficients ofboth resonators. The phase variation where
arises from the phase difference of the signalscoming out of the power divider and going to both double-bal-anced mixers. The adjustable phase comes from the signalreference of the lock-in amplifier. For the sake of the demon-stration, we shall consider . If we assume identicalresonators, the imaginary part of the reflected coefficient at res-onance varies as
(2)
0018–9456/01$10.00 ©2001 IEEE

840 IEEE TRANSACTIONS ON INSTRUMENTATION AND MEASUREMENT, VOL. 50, NO. 3, JUNE 2001
Fig. 1. Experimental setup of the cavity resonator microwave differentialtechnique for contaminant (humidity) detection in gases.
where is the real part of the permittivity of a lossless gas andthe quality factor of a resonator. If we consider ,
(1) reduces to
(3)
B. Cavity Resonator Design
In principle, the differential technique requires that both res-onators have similar resonant frequencies and high-valuesfor optimal sensitivity. From the vector wave equation for themagnetic field in a charge-free region [9], one can compute thefield components (i.e., , , , , , and ) of thetransverse electric (TE) modes of a cavity resonator where it issupposed that conduction currents exist only on the inner wallsurfaces. For a cylindrical cavity resonator of diameterandlength , the modes are interesting because of their highunloaded -values. Furthermore, the resonant frequencies asso-ciated with those particular modes are easy to shift by inserting amovable shorting plate, i.e., the absence of conduction currentsbetween the side wall and the movable plate avoids bad ohmiccontacts. For the mode, only the azimuthal componentis considered [10] and the quality factor is computedfrom the peak value of and is given by
(4)
where is the skin depth at , , and . Thisfunction is maximum for , so that for a silver-platedresonator with m and GHz, one shouldexpect a theoretical -value of about 35 000.
III. SIMULATION OF THE DIFFERENTIAL TECHNIQUE
The differential technique presented above assumes that achange in the reflection coefficients arises only from a varia-tion in the resonance frequency or a change in the permittivityof the gas of the measuring cavity. In fact, many of the compo-nents of the setup possess specific tolerances that may impact,in a significant way, the sensitivity of the method. Furthermore,both resonators do not have identical geometry, and the coaxial
lines connected to each of them are not of the same length. Amore generalized version of (3) may be written in the form
(5)
where , , , and are the differences betweenthe resonant frequencies of the two cavities not originating from
, the quality factor of cavities, the resistance at resonance,and the inductances of the antennas, respectively. Also,isthe difference between the length of the lines joining each res-onator to the hybrid junction. Finally, is the relative ampli-tude of the signals transmitted through the branches ABD andACD (see Fig. 1) of the hybrid circuit ,while is the relative phase shift of the signals in both branches
. In this section, we investigate the importanceof those parameters on the performance of the system based ona numerical simulation.
A. System Modeling
The input impedance of an ideal RLC circuit near reso-nance can be written as [11]
(6)
The cavity resonator is aperture coupled to a rectangular wave-guide operating in the dominant mode so that it is con-verted to a TE cavity mode. The series impedance of thecavity-resonator system is then
(7)
wherewaveguide characteristic impedance;waveguide length;velocity of light in the guide.
The impedance at the end of the waveguide including theantenna is
(8)
The total impedance at the input of the hybrid junction is
(9)
where is the characteristic impedance of the linejoining the waveguide to the hybrid junction. The reflection co-efficient at ports B and C of the hybrid junction is
(10)
where or C. Assuming that the hybrid junction is excitedat port A with a signal , the output signal at port D will be
(11)
ROULEAU et al.: OPTIMIZATION STUDY OF A MICROWAVE DIFFERENTIAL TECHNIQUE 841
TABLE IINITIAL VALUES OF THE PARAMETERS OF
(6) – (12) USED IN THE SIMULATION
where and are the incident signal amplitudes at ports Band C, respectively. Finally, if and are respectively thereal and imaginary parts of , the signal at the output of thephase shifter is
(12)
where is the phase shift. The first part of the simulationconsists of varying the parameters of (6)–(12) with the valuesreported in Table I. For a given set of parameters,is com-puted as a function of frequency for specific values of
. The sensitivity data are then reported from theslope of as a function of at three frequencies, one of whichis the resonant frequency of the reference resonator. The othertwo frequencies should be closely located on both sides of theresonance because, in practice, it might prove difficult to esti-mate precisely the resonant frequency. This resonant frequencyis set at 7.8 GHz, which would correspond to the dimensions ofa cylindrical resonator of about 5 cm in height5 cm in diam-eter.
B. Simulation of an Ideal System
The first part of the simulation considers an ideal system,which is composed of similar resonators, a perfect hybrid junc-tion, and identical transmission lines. Only one parameter at atime is varied, and the optimum value is thus found for bestsystem operation.
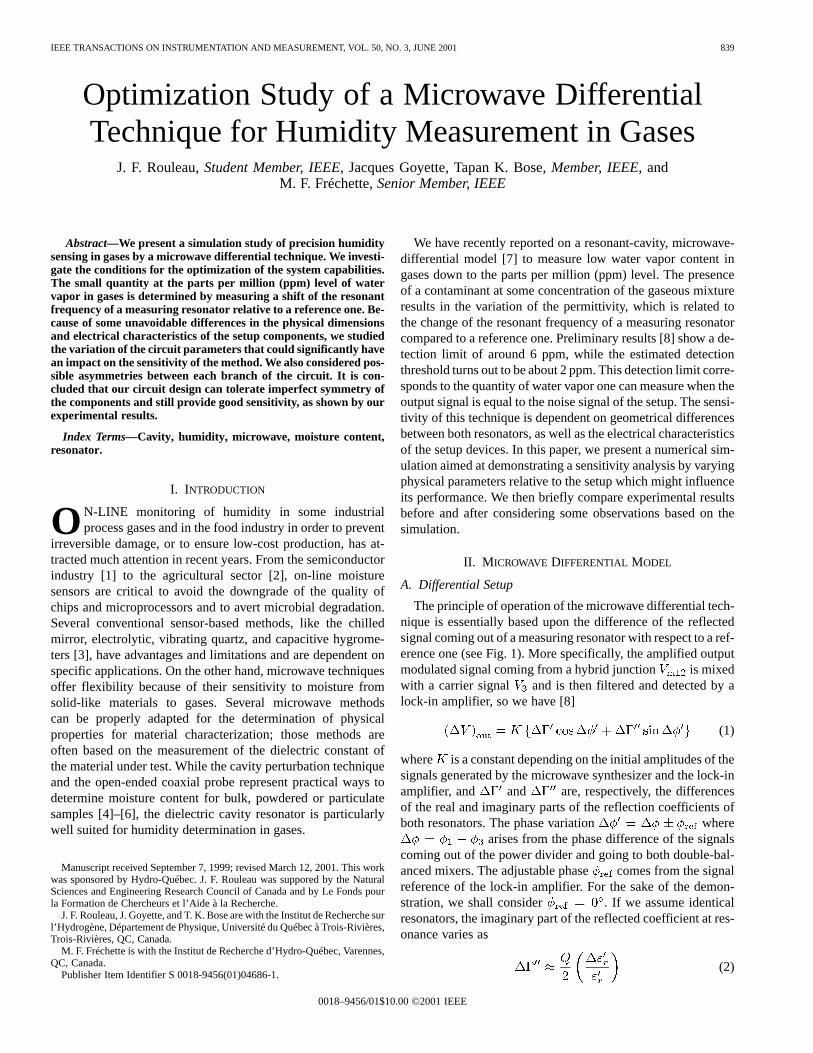
We first vary the length of the lines around 10.89 cm. Thiscorresponds to 12 half-wavelengths minus the waveguidelength, since the speed of light in the line is cm/s.Figs. 2 and 4 show the signals as a function of frequencythat we should expect at the output of the hybrid junc-tion when and , respectively, for
m. Figs. 3 and 5 show the signals asa function of at three frequencies for the same line lengthwhen and . Table II reports the sensitivitydata computed from the slopes of Figs. 3 and 5 for different linelengths. We observe that we obtain maximum sensitivity when
at , since the signal is proportional to ,which varies linearly with , while for , the signal
Fig. 2. Hybrid coupler output voltage as a function of frequency at�� = 90
for three values of�": circle: �" = 0; plus:�" = 6 � 10 ; lozenge:�" = 2 � 10 .
Fig. 3. Hybrid coupler output voltage as a function of�" at �� = 90
for three frequencies: circle: 7.799 96 GHz; square: 7.800 00 GHz; triangle:7.800 04 GHz.
Fig. 4. Hybrid coupler output voltage as a function of frequency at�� = 0
for three values of�" : circle: �" = 0; plus:�" = 6 � 10 ; lozenge:�" = 2 � 10 .
is proportional to , a quantity that varies only quadraticallywith . This is also found in the relative error which is higherat , endorsing the quadratical behavior. On the other
842 IEEE TRANSACTIONS ON INSTRUMENTATION AND MEASUREMENT, VOL. 50, NO. 3, JUNE 2001
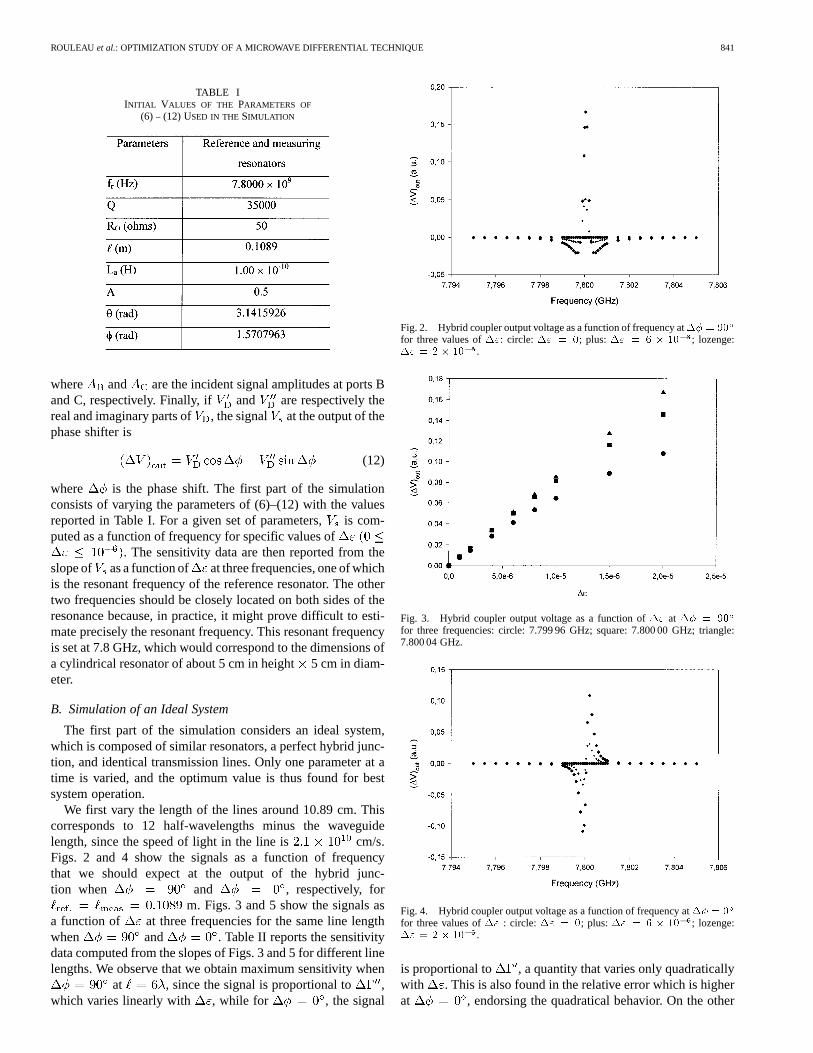
Fig. 5. Hybrid coupler output voltage as a function of�" at �� = 0for three frequencies: circle: 7.799 96 GHz; square: 7.800 00 GHz; triangle:7.800 04 GHz.
TABLE IIVALUES OF THESENSIBILITIES WITH RELATIVE ERROR ATTHREEMEASURING
FREQUENCIES FORDIFFERENTLINE LENGTHS ANDPHASES
hand, the sensitivity is constant when the line length changesby with a phase shift of , or when the linelength changes by by keeping the phase constant. Thisis an interesting characteristic since it would be possible toadjust the phase without taking into account the line lengthin order to keep the output signal proportional to wherethe sensitivity is maximum. Nevertheless, one needs to makesure that both lines have the same length. Furthermore, thesensitivity is less dependent on the measuring frequency whenthe signal is proportional to , and the maximum value isachieved if one measures slightly above the resonant frequency( GHz).
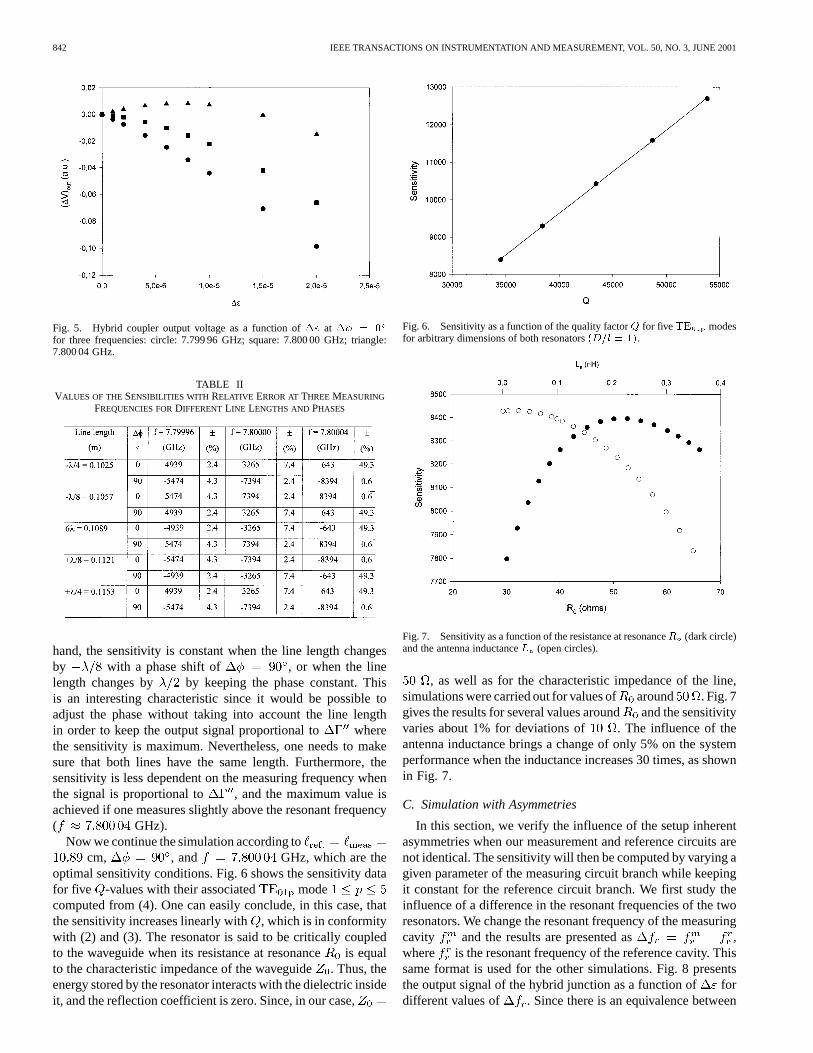
Now we continue the simulation according tocm, , and GHz, which are the
optimal sensitivity conditions. Fig. 6 shows the sensitivity datafor five -values with their associated modecomputed from (4). One can easily conclude, in this case, thatthe sensitivity increases linearly with, which is in conformitywith (2) and (3). The resonator is said to be critically coupledto the waveguide when its resistance at resonanceis equalto the characteristic impedance of the waveguide. Thus, theenergy stored by the resonator interacts with the dielectric insideit, and the reflection coefficient is zero. Since, in our case,
Fig. 6. Sensitivity as a function of the quality factorQ for five TE modesfor arbitrary dimensions of both resonators(D=l = 1).
Fig. 7. Sensitivity as a function of the resistance at resonanceR (dark circle)and the antenna inductanceL (open circles).
, as well as for the characteristic impedance of the line,simulations were carried out for values of around . Fig. 7gives the results for several values aroundand the sensitivityvaries about 1% for deviations of . The influence of theantenna inductance brings a change of only 5% on the systemperformance when the inductance increases 30 times, as shownin Fig. 7.
C. Simulation with Asymmetries
In this section, we verify the influence of the setup inherentasymmetries when our measurement and reference circuits arenot identical. The sensitivity will then be computed by varying agiven parameter of the measuring circuit branch while keepingit constant for the reference circuit branch. We first study theinfluence of a difference in the resonant frequencies of the tworesonators. We change the resonant frequency of the measuringcavity and the results are presented as ,where is the resonant frequency of the reference cavity. Thissame format is used for the other simulations. Fig. 8 presentsthe output signal of the hybrid junction as a function of fordifferent values of . Since there is an equivalence between

ROULEAU et al.: OPTIMIZATION STUDY OF A MICROWAVE DIFFERENTIAL TECHNIQUE 843
Fig. 8. Hybrid coupler output voltage as a function of�" for�f = �75 kHz (bottom curve) to�f = +75 kHz (top curve).
Fig. 9. Sensitivity as a function of�f for three frequencies: circle: 7.800 04GHz; square: 7.800 00 GHz; triangle: 7.799 96 GHz.
Fig. 10. Sensitivity as a function of�` (dark circle) atf = 7:80004 GHzand variation of the signal amplitude as a function of�� (open circle) at�" =2 � 10 .
Fig. 11. Sensitivity as a function of�Q (dark circle) and�A (open circle)at f = 7:80004 GHz.
and , one could have foreseen the fact that when, the signal is not zero even for . Also, there are
situations when even if , but we still have alinear relation between and so that
(13)
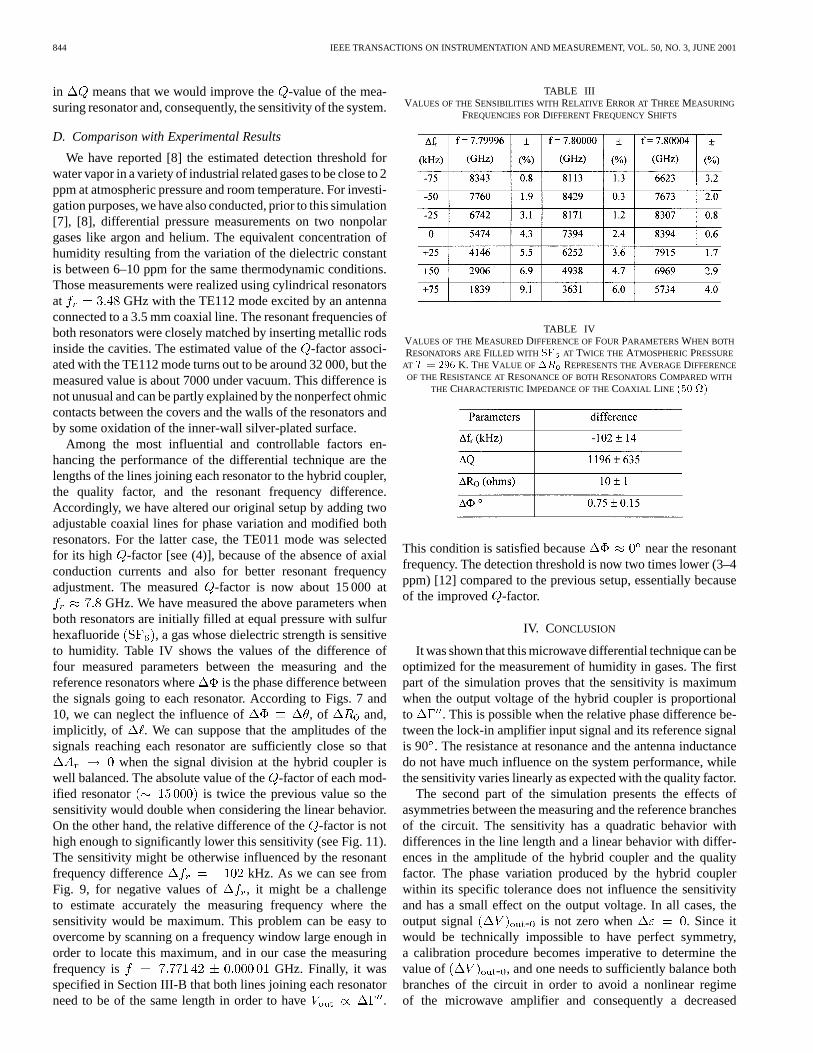
where is the output signal when . Table IIIshows that the sensitivity varies much less at GHzcompared to lower frequencies around . Fig. 9 shows clearlythat the sensitivity varies quadratically with and reaches amaximum near when GHz. For the vari-ation of the length of the line of the measuring cavity relativeto the reference cavity, as well as for the phase shift producedby the hybrid junction, where , the sen-sitivity varies once again quadratically with (see Fig. 10).For that case, when is not zero, the signal for
. The relative change of the amplitude of the signaldue to a possible phase shift by the hybrid coupler induces amaximum variation of only 0.57%. Interestingly, this changein the signal-to-noise ratio has no effect on the sensitivity ofthe system. According to the specifications of the hybrid junc-tion, an amplitude imbalance of dB is possible duringsignal division. This means the signal reaching the measuringcircuit branch can have values ranging from 0.485 to 0.515 timesthe value of the input signal, the signal in the reference cir-cuit branch having the complementary value. Once again, when
then for . Fig. 11 shows that thesensitivity varies linearly with . Conversely, increasing thesignal amplitude up to could raise the signal to a levelwhere saturation of the microwave amplifier is likely, thus re-ducing the system sensitivity. Finally, bringing a change in thequality factor of the measuring cavity would give a linear be-havior of the sensitivity as a function of the , in conformityto (3) (see also Fig. 11). This is not surprising since an increase
844 IEEE TRANSACTIONS ON INSTRUMENTATION AND MEASUREMENT, VOL. 50, NO. 3, JUNE 2001
in means that we would improve the-value of the mea-suring resonator and, consequently, the sensitivity of the system.
D. Comparison with Experimental Results
We have reported [8] the estimated detection threshold forwater vapor in a variety of industrial related gases to be close to 2ppm at atmospheric pressure and room temperature. For investi-gation purposes, we have also conducted, prior to this simulation[7], [8], differential pressure measurements on two nonpolargases like argon and helium. The equivalent concentration ofhumidity resulting from the variation of the dielectric constantis between 6–10 ppm for the same thermodynamic conditions.Those measurements were realized using cylindrical resonatorsat GHz with the TE112 mode excited by an antennaconnected to a 3.5 mm coaxial line. The resonant frequencies ofboth resonators were closely matched by inserting metallic rodsinside the cavities. The estimated value of the-factor associ-ated with the TE112 mode turns out to be around 32 000, but themeasured value is about 7000 under vacuum. This difference isnot unusual and can be partly explained by the nonperfect ohmiccontacts between the covers and the walls of the resonators andby some oxidation of the inner-wall silver-plated surface.
Among the most influential and controllable factors en-hancing the performance of the differential technique are thelengths of the lines joining each resonator to the hybrid coupler,the quality factor, and the resonant frequency difference.Accordingly, we have altered our original setup by adding twoadjustable coaxial lines for phase variation and modified bothresonators. For the latter case, the TE011 mode was selectedfor its high -factor [see (4)], because of the absence of axialconduction currents and also for better resonant frequencyadjustment. The measured-factor is now about 15 000 at
GHz. We have measured the above parameters whenboth resonators are initially filled at equal pressure with sulfurhexafluoride , a gas whose dielectric strength is sensitiveto humidity. Table IV shows the values of the difference offour measured parameters between the measuring and thereference resonators where is the phase difference betweenthe signals going to each resonator. According to Figs. 7 and10, we can neglect the influence of , of and,implicitly, of . We can suppose that the amplitudes of thesignals reaching each resonator are sufficiently close so that
when the signal division at the hybrid coupler iswell balanced. The absolute value of the-factor of each mod-ified resonator is twice the previous value so thesensitivity would double when considering the linear behavior.On the other hand, the relative difference of the-factor is nothigh enough to significantly lower this sensitivity (see Fig. 11).The sensitivity might be otherwise influenced by the resonantfrequency difference kHz. As we can see fromFig. 9, for negative values of , it might be a challengeto estimate accurately the measuring frequency where thesensitivity would be maximum. This problem can be easy toovercome by scanning on a frequency window large enough inorder to locate this maximum, and in our case the measuringfrequency is GHz. Finally, it wasspecified in Section III-B that both lines joining each resonatorneed to be of the same length in order to have .
TABLE IIIVALUES OF THESENSIBILITIES WITH RELATIVE ERROR AT THREEMEASURING
FREQUENCIES FORDIFFERENTFREQUENCYSHIFTS
TABLE IVVALUES OF THEMEASUREDDIFFERENCE OFFOUR PARAMETERSWHEN BOTH
RESONATORS AREFILLED WITH SF AT TWICE THE ATMOSPHERICPRESSURE
AT T = 296 K. THE VALUE OF�R REPRESENTS THEAVERAGE DIFFERENCE
OF THE RESISTANCE ATRESONANCE OF BOTHRESONATORSCOMPARED WITH
THE CHARACTERISTIC IMPEDANCE OF THECOAXIAL LINE (50 )
This condition is satisfied because near the resonantfrequency. The detection threshold is now two times lower (3–4ppm) [12] compared to the previous setup, essentially becauseof the improved -factor.
IV. CONCLUSION
It was shown that this microwave differential technique can beoptimized for the measurement of humidity in gases. The firstpart of the simulation proves that the sensitivity is maximumwhen the output voltage of the hybrid coupler is proportionalto . This is possible when the relative phase difference be-tween the lock-in amplifier input signal and its reference signalis 90 . The resistance at resonance and the antenna inductancedo not have much influence on the system performance, whilethe sensitivity varies linearly as expected with the quality factor.
The second part of the simulation presents the effects ofasymmetries between the measuring and the reference branchesof the circuit. The sensitivity has a quadratic behavior withdifferences in the line length and a linear behavior with differ-ences in the amplitude of the hybrid coupler and the qualityfactor. The phase variation produced by the hybrid couplerwithin its specific tolerance does not influence the sensitivityand has a small effect on the output voltage. In all cases, theoutput signal - is not zero when . Since itwould be technically impossible to have perfect symmetry,a calibration procedure becomes imperative to determine thevalue of - , and one needs to sufficiently balance bothbranches of the circuit in order to avoid a nonlinear regimeof the microwave amplifier and consequently a decreased
ROULEAU et al.: OPTIMIZATION STUDY OF A MICROWAVE DIFFERENTIAL TECHNIQUE 845
sensitivity. Comparison of the experimental data with thesimulation results shows good agreement with the improveddetection threshold while the asymmetries do not influencesignificantly the performance of the system.
REFERENCES
[1] T. K. Mehrhoff, “Comparison of continuous moisture monitors in therange 1 to 15 ppm,”Rev. Sci. Instrum., vol. 56, pp. 1930–1933, 1985.
[2] R. J. King, “On-line moisture and density measurement of foods withmicrowave sensors,”Appl. Eng. Agric., vol. 13, pp. 361–371, 1997.
[3] S. Soloman,Sensors Handbook. New York: McGraw-Hill, 1998.[4] J. F. Rouleau, J. Goyette, T. K. Bose, S. Yagihara, and N. Shinyashiki,
“Dielectric study on dynamical structure of water in moist materialsusing dielectric resonator,” inProc. Third Workshop Electromagn. WaveInteraction Water Moist Substances, Athens, GA, Apr. 11–13, 1999, pp.97–101.
[5] S. Trabelsi, A. W. Kraszewski, and S. O. Nelson, “A microwave methodfor on-line determination of bulk density and moisture content of par-ticulate materials,”IEEE Trans. Instrum. Meas., vol. 47, pp. 127–132,1998.
[6] S. O. Nelson and P. G. Bartley Jr, “Open-ended coaxial-line permittivitymeasurement on pulverized materials,”IEEE Trans. Instrum. Meas., vol.47, pp. 133–137, 1998.
[7] J. F. Rouleau, J. Goyette, T. K. Bose, and M. F. Fréchette, “Microwavemethods to measure traces of contaminants in gases,” inProc. 10th Int.Symp. High Voltage Eng., Montreal, QC, Canada, Aug. 25–29, 1997, pp.311–314.
[8] J. F. Rouleau, J. Goyette, T. K. Bose, and M. F. Fréchette, “Investigationof a microwave differential cavity resonator device for the measurementof humidity in gases,”Rev. Sci. Instrum., vol. 70, 1999.
[9] P. R. Karmel, G. D. Colef, and R. L. Camisa,Introduction to Electro-magnetic and Microwave Eng.. New York: Wiley, 1998.
[10] D. M. Pozar,Microwave Eng., 2 ed. New York: Wiley, 1998.[11] R. A. Chipman,Transmission Lines. New York: McGraw-Hill, 1968.[12] J. F. Rouleau, J. Goyette, T. K. Bose, and M. F. Fréchette, “Performance
of a microwave sensor for the precise measurement of water vapor ingases,”IEEE Trans. Dielect. Electr. Insul., vol. 7, pp. 825–831, 2000.
J. F. Rouleau(S’00) was born in Montréal, QC, Canada, on March 18, 1969.He received the M.Sc. degree in physics in 1995 from the Université duQuébec,Trois-Rivières, and he is currently pursuing the Ph.D. degree in energyand materials sciences from the Institut National de la Recherche Scientifique(INRS), Varennes, QC, and the Hydrogen Research Institute, Trois-Rivières.
His interests are microwave measurements and development of RF and mi-crowave techniques for dielectric characterization of materials.
Dr. Rouleau was the recipient of NSERC postgraduate scholarships from1992 to 1996 and of the IEEE Microwave Theory and Techniques Society Fel-lowship in 1998.
Jacques Goyettewas born in Cap-de-la-Madeleine, QC, Canada, on April 13.1952. He received the B.S. degree in physics from Université du Québec àTrois-Rivières (UQTR) in 1975 and the Ph.D. degree in physics from HarvardUniversity, Cambridge, MA, in 1986.
He has held different positions at UQTR. From 1986 to 1991, he was a post-doctoral fellow and a research fellow with the Dielectric Research Group ofthe physics department of UQTR. Since then, he has been a Professor with thesame department. He is presently associated with the Institut de Recherche surl’Hydrogène of UQTR. His current research interests include the study of thedielectric properties of materials, the storing of hydrogen in metal hydrides, andthe development of ultrasonic, nondestructive evaluation methods that can beused to inspect hydrogen reservoirs.
Tapan K. Bose(M’78) received the Ph.D. in physics from the University ofLouvain, Belgium, and did his post-doctoral studies at Brown University, Prov-idence, RI.
Presently, he is a Professor of physics and Director of the Hydrogen Re-search Institute at the University of Québec, Trois-Rivières, Canada. He is alsoChairman of ISO/TC 197 for hydrogen technologies and President of the Cana-dian Hydrogen Association. Currently, he is a member of the Hydrogen Tech-nical Advisory Group of the government of Canada and a member of the Boardof Directors of the National Hydrogen Association in the United States. He isauthor and co-author of more than 125 publications and four books. He is alsoauthor of 14 patents and numerous technical reports. He has delivered more than90 invited lectures.
Dr. Bose has received the following awards: Medal of the Governor Generalof Canada for services rendered to Canada on the occasion of the 125th anniver-sary of the Confederation on April 23, 1993; Laureate of Research and Devel-opment, Fifth Energia Gala, Association of québécoise pour la maîtrise de l’én-ergie (AQME) on October 1994; Medal of Merit from the Université du Quèbecà Trois-Rivières for his scholarly achievements on March 26, 1994; MeritoriusService Award from the National Hydrogen Association (Washington, DC) forhis outstanding leadership for both ISO\TC 197 (for hydrogen technologies) andthe Canadian Hydrogen Association on March 8, 2001.
M. F. Fréchette (SM’95) has a graduate background in physics.He joined the Institut de recherche d’Hydro-Québec, Varennes, QC, Canada,
in 1981. Since then, he has performed applied basic research in various fieldsrelated to electrical insulation and insulating materials. His major contributionsconcern discharge physics and dielectric phenomena.