Embed Size (px)
Citation preview

Soldagem & Inspeção. 2015;20(2):238-252http://dx.doi.org/10.1590/0104-9224/SI2002.11
Technical Papers
This is an Open Access article distributed under the terms of the Creative Commons Attribution Non-Commercial License which permits unrestricted non-commercial use, distribution, and reproduction in any medium provided the original work is properly cited.
Received: 28 May, 2015 Accepted: 27 July, 2015
E-mails: [email protected] (GBS), [email protected] (AGMP), [email protected] (RFV), [email protected] (RSCP)
Abstract: HVOF thermal spray process produces coatings with low porosity and low oxide content, as well as high substrate adhesion. Small variations on the parameters of the HVOF process can generate coatings with different characteristics and properties, which also is chemical composition depended of the alloy. FeMnCrSi alloy is a cavitation resistant class of material with a great potential for HVOF deposition use. The main goal of this article is to study the influence of some HVOF parameters deposition, as standoff distance, powder feed rate and carrier gas pressure on three different alloys. FeMnCrSi experimental alloys with some variations in nickel and boron content were studied. Taguchi experimental design with L9 orthogonal array was used in this work. Porosity, oxide content, tensile adhesion strength and microhardness of the coatings were evaluated. The results indicated that all factors have significant influence on these properties. Chemical composition of the alloys was the most important factor, followed by the carrier gas pressure, standoff distance and powder feed rate. The addition of Ni, produces coatings with lower levels of oxide content and porosity. An experiment with improved parameters was conducted, and a great improvement on the coating properties was observed.
Key-words: Thermal Spray; HVOF; Taguchi experimental design; FeCrMnSiNiB.
1. Introduction
Thermal spraying process consists of a group of processes used to deposit different materials, like metallic or non-metallic materials on a prepared surface, with intend to modify the surface properties, like corrosion, abrasion resistance [1-4].
Most of the thermal spray process consist of the material heating in a molten or superheated state, and these particles are accelerated to the substrate surface by a carrier gas. However, thermally sprayed coatings have some imperfections such as pores and oxides. The main mechanism of adhesion and cohesion of the coating is mechanical anchoring of the splats [5, 6].
Several studies have been conducted with thermally sprayed coatings with the objective to analyze its cavitation erosion resistance and mass loss mechanisms. It was observed that the cavitation erosion resistance of thermally sprayed coatings can be improved when these alloys are deposited by high speed process (HVOF, high velocity oxygen fuel). The better performance has been attributed to the higher kinetic energy of the particles, providing greater adhesion and cohesion between the splats [7-13].
Taguchi experimental design is a method that allows to evaluate how different parameters affect the deposition process and their properties. The design proposed by Taguchi involves the use of orthogonal array, with intend to organize different parameters that can affect the process, and their subsequent levels. The main goal of the Taguchi method is to determine which factors most affect the quality and the properties of the coating with a minimum experiments, saving time and resources [14-16].
The objective of this paper is to study the influence of some parameters on the morphology, adhesion and microhardness of thermally sprayed coatings deposited by High Velocity Oxygen-Fuel thermal spray (HVOF) process. The parameters analyzed in this work were: chemical composition of the alloy, standoff distance; powder feed rate and carrier gas pressure. It was implemented the Taguchi experimental design with an L9
Optimization of the Deposition Parameters of HVOF FeMnCrSi+Ni+B Thermally Sprayed CoatingsGustavo Bavaresco Sucharski1, Anderson Geraldo Marenda Pukasiewicz2, Rodolpho Fernando Váz3, Ramón Sigifredo Cortés Paredes1
1 Universidade Federal do Paraná – UFPR, Curitiba, PR, Brazil.2 Universidade Tecnológica Federal do Paraná – UTFPR, Ponta Grossa, PR, Brazil.3 Institutos Lactec, Curitiba, PR, Brazil.

Soldagem & Inspeção. 2015;20(2):238-252 239
Optimization of the Deposition Parameters of HVOF FeMnCrSi+Ni+B Thermally Sprayed Coatings
orthogonal array, which allows to study the interactions of 4 factors (process parameters) with 3 levels (different levels of the parameters). Three FeMnCrSi alloys were studied, with Nickel, Boron and Nickel+Boron addition.
The experimental design was carried out in two steps, initially a study was carried out to analyze the influence of the selected parameters on the properties of the coating, such as porosity, oxidation, adhesion and hardness. Afterwards, an additional experiment was performed with optimized parameters to confirm the results from the experimental design.
2. Experimental Procedure
The alloys were manufactured by inert gas atomizing process (argon). Before the HVOF deposition process, the powders were sieved and particles with diameters up to 63μm (230 mesh) were used . Figure 1 shows the morphology of the powders. The specific chemical composition of these alloys is not presented due to patent rights that are not completed yet.
Figure 1. SEM of atomized powders alloys: (a) alloy1: FeMnCrSi+Ni; (b) alloy2: FeMnCrSi+Ni+B; and (c) alloy3: FeMnCrSi+B.
Table 1. Set of factors and levels used in this study.
FactorLevel
1 2 3
Alloy FeMnCrSi+Ni FeMnCrSi+Ni+B FeMnCrSi+BStandoff distance (mm) 200 275 350Powder feed rate (g.min1) 25 35 45Carrier gas pressure (MPa) 0.758 0.896 1.034
SAE 1020 carbon steel substrate with 150 × 35 × 3,2 mm were used in this work. The surface was sand blasted with white aluminum oxide (36 mesh).
Table 1 shows the selected parameters, and their different levels,. These data were used in the L9 orthogonal array.
Standoff distance, powder feed rate and carrier gas pressure are factors that directly affect the oxidation and porosity of the coatings, with different levels for similar alloys. The levels defined in this experiment are based on the values recommended by manufacturers [17], as well as articles where similar alloys deposited by HVOF were studied [18-27].
Table 2 shows the L9 orthogonal array with the factors and levels used in this article.
Analyses of variance were performed for all the factors (parameters), testing the following hypotheses:
• H0: Factor is not significant;• H1: Factor is significant.

240 Soldagem & Inspeção. 2015;20(2):238-252
Sucharski et al.
Statistical software Minitab16 was used to generate the p-value, which is an indicative of the acceptability of the hypothesis, and a p-value less than 0.10 reject the hypothesis H0 (considering the significance level of 90%).
The deposition equipment used was a DiamondJet 2700 gun from Sulzer Metco. The parameters maintained constant for these depositions are described in Table 3, and also are based on the values recommended for similar alloys [17].
Table 2. Orthogonal array Taguchi L9 for parameter validation study.
Experiment Alloy Standoff distance (mm)
Powder feed rate (g.min–1)
Carrier gas pressure (MPa)
1 FeMnCrSi+Ni 200 25 0.7582 FeMnCrSi+Ni 275 35 0.8963 FeMnCrSi+Ni 350 45 1.0344 FeMnCrSi+Ni+B 200 35 1.0345 FeMnCrSi+Ni+B 275 45 0.7586 FeMnCrSi+Ni+B 350 25 0.8967 FeMnCrSi+B 200 45 0.8968 FeMnCrSi+B 275 25 1.0349 FeMnCrSi+B 350 35 0.758
Table 3. Process parameters set for the depositions.
Parameters Values
Oxygen Pressure 1.034 MPaOxygen Flow 265.4 l.min–1
Propylene Pressure 0.689 MPaPropylene Flow 71.4 l.min–1
Air Pressure 0.517 MPaAir flow 317.0 l.min–1
Carrier gas flow N2 60 l.min–1
The metallographic preparation of the deposited coatings was conducted by cutting the samples, followed by mounting, grinding and polishing. Oxide morphology and distribution was conducted by EDS mapping, where each alloying element distribution on the microstructure can be visualized.
Porosity and oxide content measurement was carried out by grayscale threshold in SEM images of the microstructure. After the definition of each micro constituent, a correspondent gray scale level was selected, characterized by the limits of the gray level for pore, oxide and metallic phase, the area fraction of each phase is calculated. In this technique, 8 images of the cross section with magnifications of 500x were used to analyze area fraction oxide, and 2000x for the identification of pores on the microstructure. The Analysis software was used for this procedure.
Figure 2 shows an example of the application of image analysis for porosity and oxide content measurement in experimental coating 3 (Table 2).The yellow areas in Figure 2b are the metallic phase, green areas emphasized by dotted lines are oxides, and red points are pores.
The tensile adhesion strength measurements were carried out in accordance with ASTM C633-01/2008 [28] (Standard test method for adhesion or cohesion strength of thermal spray coatings). It was tested three samples for each condition, all of them with 250 µm of coating thickness. The glue used was the HTK Ultra Bond 100.
The microhardness measurements were made in an EMCOTEST/Durascan hardness tester with 300 gf of load and indentation time of 15 seconds. The measurements were carried out on the cross section of the coatings. Three indentations were realized in eight different regions for each sample.

Soldagem & Inspeção. 2015;20(2):238-252 241
Optimization of the Deposition Parameters of HVOF FeMnCrSi+Ni+B Thermally Sprayed Coatings
3. Results and Discussion
3.1. Coating morphology
Figure 3 shows the SEM images of the experiments 1, 4 and 7. It is possible to identify the formation of small pores between the splats, indicated by arrows, the morphology of the oxides is indicated by dotted lines. The presence of semi-molten particles indicates that the temperature of the particles was not high enough to improve the wettability of the larger particles.
It was observed that the addition of Boron in FeMnCrSi+Ni+B and FeMnCrSi+B caused a small increase in splats deformation observed by the splats thickness reduction. This is evident by the reduction on the quantity of large particles. Boron provides a reduction of the melting point of the alloy, and this contributes to the increase on the deformation of the particles. Melting temperature reduction even by small additions of boron in iron alloys was observed by Amushahi [29].
Figure 2. Example technique for measuring porosity and oxide content. (a) before image treatment, and (b) after treatment.
Figure 3. Coating morphology of cross section, comparing the alloys deposited with different parameters. (a) Experiment 1 (FeMnCrSi+Ni); (b) experiment 4 (FeMnCrSi+Ni+B); (c) Experiment 7 (FeMnCrSi+B).

242 Soldagem & Inspeção. 2015;20(2):238-252
Sucharski et al.
It was also observed, comparing experiment 1 (FeMnCrSi+Ni) with the experiment 7 (FeMnCrSi+B), that the alloy without Ni presents higher oxide content, indicating that Ni reduce the oxide content on the microstructure of the coatings. The Ni influence on the oxide content reduction, probably occurred by the Ni enrichment near the oxide film formation [30]. Ni content reduction on the oxide was observed in work of Syed et al. also suggest this explanation [31]. This Ni enrichment reduces the oxide layer growth and consequently the thickness of the oxide, this behavior was observed in work of Rossi and Elsener [32].
The great influence of the process parameters variation on the HVOF coatings morphology can be observed in Figure 4. In this Figure the same alloy (FeMnCrSi+Ni) shows different porosity and oxide content levels for distinct sets of experiments. The coatings showed great differences in morphology mainly due to the higher presence of oxides in experiment 2.
Figure 4. Comparison of the morphology of the coatings with FeMnCrSi+Ni using two different process parameters. In (a) experiment 2 and (b) experiment 3.
When two sets of experiments are compared, it can be observed the influence of the parameters on the microstructure. In this case, the increase of the parameters values (standoff distance, carrier gas pressure and powder feed rate) reduce the oxide content of the FeMnCrSi+Ni alloy. The coating of the experiment 2 also shows less deformed particles, this behavior probably occurs by the higher oxide content, which reduce the splats deformation, these results are in accordance with the work of Sobolev and Guilemany [33].
Figure 5 shows, for the same region in Figure 4, the chemical composition maps of the coating. In this Figure the distribution of each alloying element can be observed. It can be observed that in oxides shows higher concentration of the elements Mn and Si. These elements have great affinity with the oxigen. In experiment 3, it can be observed a lower presence of oxides.
3.2. Porosity and oxide content analysis
Figures 6 and 7 show the results of the porosity and oxide content of the samples, respectively. The FeMnCrSi+Ni alloy (experiments 1, 2 and 3) showed a lower porosity and oxide content, regardless of the parameters used, indicating that the addition of Ni is really effective to reduce the porosity.

Soldagem & Inspeção. 2015;20(2):238-252 243
Optimization of the Deposition Parameters of HVOF FeMnCrSi+Ni+B Thermally Sprayed Coatings
The Taguchi analysis, presented in Table 4, shows the porosity variance for each factor.
According to the analysis of the variance, all factors showed p-value less than 0.10 rejecting the hypotheses H0, demonstrating that all factors influence the porosity of the coatings.
With intend to identify which factor affects more the coating porosity, Taguchi experimental design [15] describes how to create a ranking for each factor, based on the delta value. Higher values of delta indicates higher influence of this factor on the measured propertie. Table 5 shows the ranking of the most influent parameters on the porosity of the coatings (rank = 1, means that this is the most influential factor for the porosity reduction).
Figure 5. Chemical composition maps by EDS for FeMnCrSi+Ni, deposited under two different sets of parameters.
Figure 6. Porosity results.

244 Soldagem & Inspeção. 2015;20(2):238-252
Sucharski et al.
The factor ‘Alloy’ showed higher delta value, indicating that parameter was more influential, followed by the ‘Carrier gas pressure ‘, ‘Powder feed rate’ and finally the ‘Standoff distance’. In this case the alloy influence on the porosity can be explain by the improvement on the splats deformation and oxide content reduction. Splats deformation increase contact area between the splats, reducing the porosity. The oxide content reduction can also improve the splats deformation reducing the porosity of the coating, this behavior was discussed in work of Sobolev and Guilemany [33].
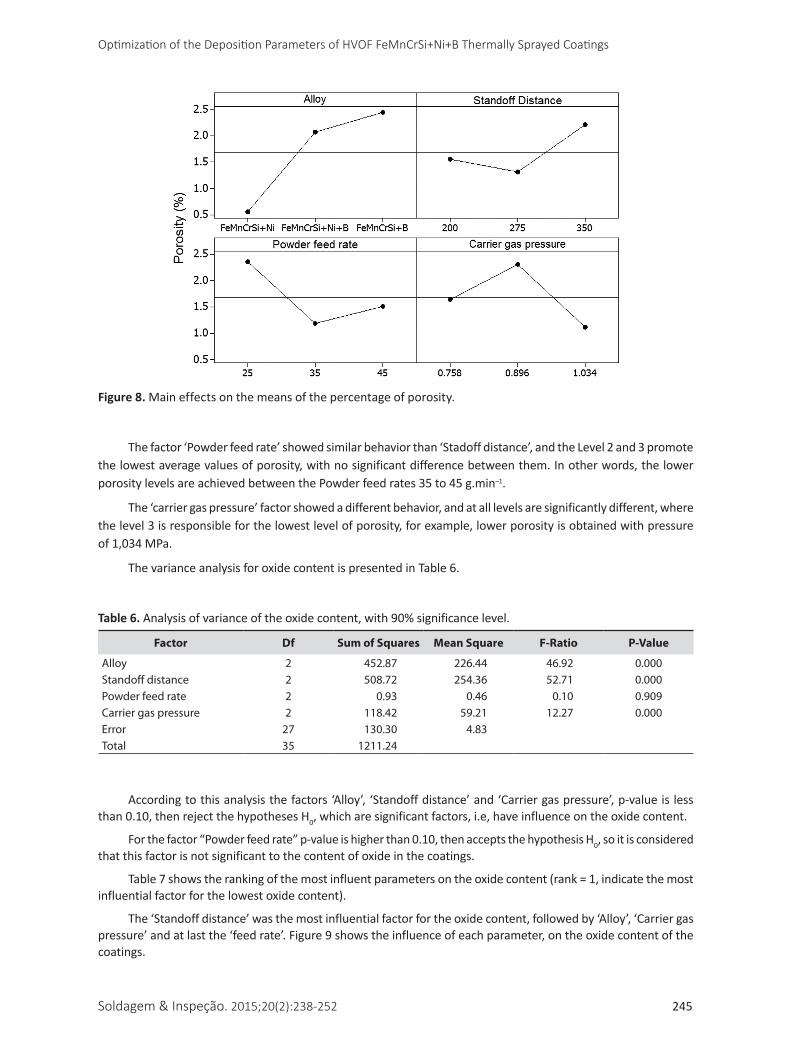
Figure 8 shows the influence of each parameter, ie, the effect for each level and factor on the porosity of the coatings.
Tukey test method was accomplished considering a 90% of confidence level. This test determines if the levels is significant. In the case of ‘alloy’ factor it was observed that the (FeMnCrSi+Ni) alloy showed the lowest porosity, the other alloys showed similar behavior.
For the factor ‘Standoff distance’ levels 1 and 2 were not significantly different and promotes the lowest level of porosity. This indicates that there is no statistically significant difference between these two levels, on the interval between 200 and 275 mm, the standoff distance did not significantly affect the porosity.
Figure 7. Oxide content results.
Table 4. Analysis of variance for porosity, with 90% significance level.
Factor Df Sum of Squares Mean Square F-Ratio P-Value
Alloy 2 23.9940 11.9970 40.08 0.000Standoff distance 2 5.1185 2.5593 8.55 0.001Powder feed rate 2 8.8456 4.4228 14.78 0.000Carrier gas pressure 2 8.5410 4.2705 14.27 0.000Error 27 8.0815 0.2993Total 35 54.5806
Table 5. Rankings of influence of the factors for the mean porosity, condition ‘lower porosity is better’.
Level Alloy Standoff distance Powder feed rate Carrier gas pressure
1 0.5500 1.5425 2.3592 1.64082 2.0592 1.3083 1.1842 2.30003 2.4408 2.1992 1.5067 1.1092
Delta 1.8908 0.8908 1.1750 1.1908Rank 1 4 3 2
Soldagem & Inspeção. 2015;20(2):238-252 245
Optimization of the Deposition Parameters of HVOF FeMnCrSi+Ni+B Thermally Sprayed Coatings
The factor ‘Powder feed rate’ showed similar behavior than ‘Stadoff distance’, and the Level 2 and 3 promote the lowest average values of porosity, with no significant difference between them. In other words, the lower porosity levels are achieved between the Powder feed rates 35 to 45 g.min–1.
The ‘carrier gas pressure’ factor showed a different behavior, and at all levels are significantly different, where the level 3 is responsible for the lowest level of porosity, for example, lower porosity is obtained with pressure of 1,034 MPa.
The variance analysis for oxide content is presented in Table 6.
Figure 8. Main effects on the means of the percentage of porosity.
Table 6. Analysis of variance of the oxide content, with 90% significance level.
Factor Df Sum of Squares Mean Square F-Ratio P-Value
Alloy 2 452.87 226.44 46.92 0.000Standoff distance 2 508.72 254.36 52.71 0.000Powder feed rate 2 0.93 0.46 0.10 0.909Carrier gas pressure 2 118.42 59.21 12.27 0.000Error 27 130.30 4.83Total 35 1211.24
According to this analysis the factors ‘Alloy’, ‘Standoff distance’ and ‘Carrier gas pressure’, p-value is less than 0.10, then reject the hypotheses H0, which are significant factors, i.e, have influence on the oxide content.
For the factor “Powder feed rate” p-value is higher than 0.10, then accepts the hypothesis H0, so it is considered that this factor is not significant to the content of oxide in the coatings.
Table 7 shows the ranking of the most influent parameters on the oxide content (rank = 1, indicate the most influential factor for the lowest oxide content).
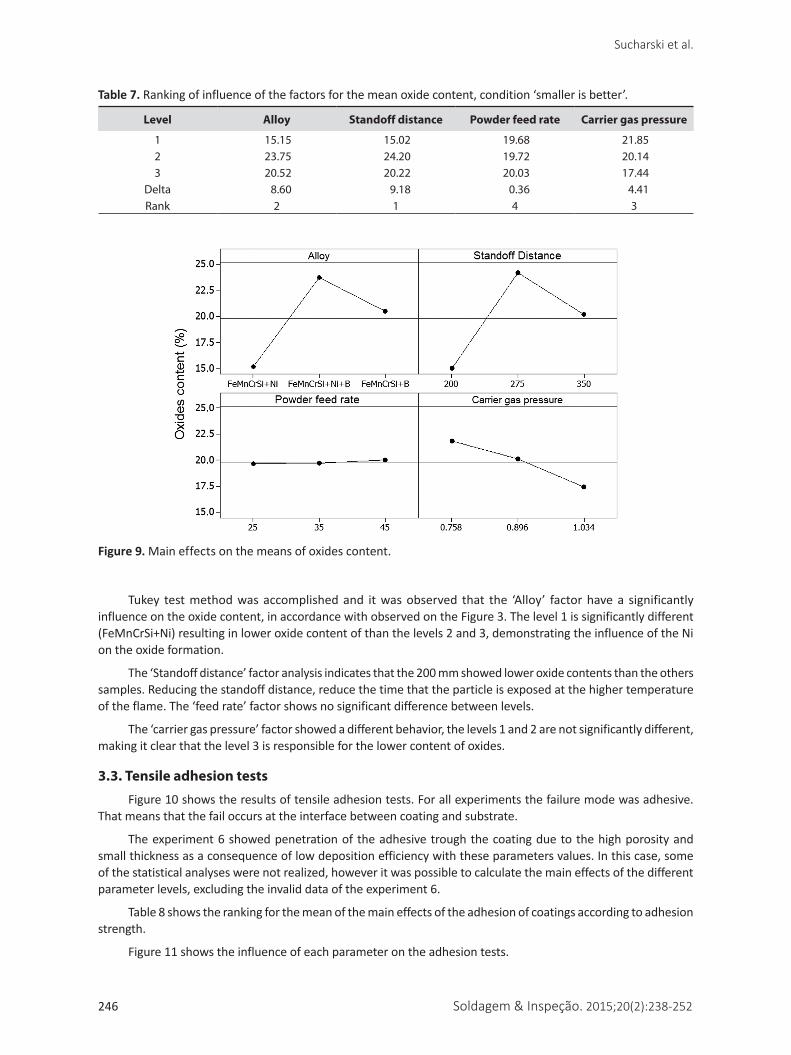
The ‘Standoff distance’ was the most influential factor for the oxide content, followed by ‘Alloy’, ‘Carrier gas pressure’ and at last the ‘feed rate’. Figure 9 shows the influence of each parameter, on the oxide content of the coatings.
246 Soldagem & Inspeção. 2015;20(2):238-252
Sucharski et al.
Tukey test method was accomplished and it was observed that the ‘Alloy’ factor have a significantly influence on the oxide content, in accordance with observed on the Figure 3. The level 1 is significantly different (FeMnCrSi+Ni) resulting in lower oxide content of than the levels 2 and 3, demonstrating the influence of the Ni on the oxide formation.
The ‘Standoff distance’ factor analysis indicates that the 200 mm showed lower oxide contents than the others samples. Reducing the standoff distance, reduce the time that the particle is exposed at the higher temperature of the flame. The ‘feed rate’ factor shows no significant difference between levels.
The ‘carrier gas pressure’ factor showed a different behavior, the levels 1 and 2 are not significantly different, making it clear that the level 3 is responsible for the lower content of oxides.
3.3. Tensile adhesion tests
Figure 10 shows the results of tensile adhesion tests. For all experiments the failure mode was adhesive. That means that the fail occurs at the interface between coating and substrate.
The experiment 6 showed penetration of the adhesive trough the coating due to the high porosity and small thickness as a consequence of low deposition efficiency with these parameters values. In this case, some of the statistical analyses were not realized, however it was possible to calculate the main effects of the different parameter levels, excluding the invalid data of the experiment 6.
Table 8 shows the ranking for the mean of the main effects of the adhesion of coatings according to adhesion strength.
Figure 11 shows the influence of each parameter on the adhesion tests.
Table 7. Ranking of influence of the factors for the mean oxide content, condition ‘smaller is better’.
Level Alloy Standoff distance Powder feed rate Carrier gas pressure
1 15.15 15.02 19.68 21.852 23.75 24.20 19.72 20.143 20.52 20.22 20.03 17.44
Delta 8.60 9.18 0.36 4.41Rank 2 1 4 3
Figure 9. Main effects on the means of oxides content.

Soldagem & Inspeção. 2015;20(2):238-252 247
Optimization of the Deposition Parameters of HVOF FeMnCrSi+Ni+B Thermally Sprayed Coatings
Considering the results for tensile adhesion tests, the influence of the alloy composition and the processes parameters on the porosity and oxide content significantly affects the tensile adhesion behavior of the coatings. In this case, the parameters optimization for higher adhesion strength must to be conducted with intend to reduce the porosity and oxide content of the coating.
3.4. Microhardness
Figure 12 shows the results of microhardness measurements. The results are the average and standard deviation values of 24 indentations in the transversal section of each sample.
Figure 10. Results of the adhesion test.
Table 8. Ranking of influence of the factors for the mean adhesion strength, condition ‘higher is better’.
Level Alloy Standoff distance Powder feed rate Carrier gas pressure
1 39.32 34.62 35.03 31.792 24.55 30.57 33.95 33.173 32.22 39.12 33.74 38.74
Delta 14.76 8.54 1.28 6.95Rank 1 2 4 3
Figure 11. Main effects on the adhesion strength of the coatings.

248 Soldagem & Inspeção. 2015;20(2):238-252
Sucharski et al.
The analysis of the variance for the microhardness is shown in Table 9.
According to analysis of variance, all factors showed p-value less than 0.10, rejecting the hypotheses H0. Thus all factors are influence on the microhardness of the coatings. Table 10 shows the ranking of the parameters influence on the microhardness.
The ‘Carrier gas pressure’ is the most influential factor, followed by ‘Powder feed rate’ and ‘Alloy’. Finally the ‘Standoff distance’, showed less influence on the microhardness. Figure 13 shows a graph of the influence of each parameter on the microhardness of the coatings.
Tukey test method showed that the level 1(FeMnCrSi+Ni) of the ‘Alloy’ factor promote the lowest hardness value, this occurs because of this alloy do not have Boron on the formulation, which can promote a hardness increase by interstitial solid solution. In this case, the levels 2 and 3 have higher microhardness values, indicating that the addition of Boron is effective for the microhardness increase of the coatings.
Figure 12. Vickers microhardness of the coatings.
Table 9. Analysis of variance of the microhardness, with 90% significance level.
Factor Df Sum of Squares Mean Square F-Ratio P-Value
Alloy 2 30667 15333 12.54 0.000Standoff distance 2 14060 7030 5.75 0.008Powder feed rate 2 74220 37110 30.35 0.000Carrier gas pressure 2 90457 45229 36.99 0.000Error 27 33009 1223Total 35 242413
Table 10. Ranking of the influence of the parameters on the microhardness, condition ‘higher is better’.
Level Alloy Standoff distance Powder feed rate Carrier gas pressure
1 276.0 344.5 253.0 343.52 330.1 303.2 356.4 246.33 343.5 302.0 340.2 359.8
Delta 67.5 42.5 103.4 113.6Rank 3 4 2 1

Soldagem & Inspeção. 2015;20(2):238-252 249
Optimization of the Deposition Parameters of HVOF FeMnCrSi+Ni+B Thermally Sprayed Coatings
Level 3 of the ‘Standoff distance’ factor, showed the highest microhardness value. This result indicates that the distance of 200 mm coatings promoted higher microhardness values for these coatings. The increase in microhardness with shorter standoff distance is explained by the lower porosity of this sample and, consequently better splats cohesion.
For the ‘Powder feed rate’ factor, the level 1 showed the lowest microhardness values. Levels 2 and 3 (35 and 45 g.min–1) are responsible for the highest microhardness values, this behavior can be explained by the higher porosity of the samples with 25 g.min–1 powder feed rate level.
The ‘carrier gas pressure’ factor did not showed a clear influence on the hardness. It was observed a microhardness increase on the samples deposited with the lower and higher levels of carrier gas pressure.
3.5. Optimized parameters and confirmation experiments
Considering the results obtained previously, the most influential factor was the “Alloy”, and the best results of porosity and oxide content were obtained with the ‘FeMnCrSi+Ni’ alloy.
The “Carrier gas pressure” was the second most influential factor, and it is evident that the pressure of 1.034MPa provides the best results for all analyzed properties. The “Standoff distance” is the third most influential factor, 200 mm of standoff distance produces the coatings with lower porosity and oxide content, improving the tensile adhesion strength.
The less influential factor observed in this study was the “Powder feed rate” where the highest value, 45g. min-1, produces an improvement on the coating porosity and microhardness.
A confirmation experiment was performed using the optimal combination of these parameters as shown in Table 11.
The morphology obtained with optimized parameters showed a significant microstructure improvement, with a more dense coating, improving the particles deformation, with thinner oxide interlayer formation, and lower porosity, compared with the samples deposited with the first set of parameters. Figure 14 shows SEM images of this coating.
The results of the sample deposited with the optimized parameter indicates a lower porosity and oxide content compared to the coatings obtained with the first set of parameters. The result of tensile adhesion tests was near the best results observed previously. The results of Vickers microhardness values are intermediate to those observed in coatings deposited during the analysis of parameters, because of the lower oxide contents, reducing the hardness of the sprayed coatings.
Figure 13. Main effects on the mean microhardness.

250 Soldagem & Inspeção. 2015;20(2):238-252
Sucharski et al.
Table 12 shows the coatings properties of the sample deposited with the optimized parameter, compared with the best result obtained previously.
These results confirm the improvement on the properties (porosity, oxide content, tensile adhesion). In this case the porosity and oxide content reduction showed the improvement of the coating quality with the correct parameter optimization.
Table 11. Parameters used in the confirmation experiment.
Experiment Alloy Standoff distance Powder feed rate Carrier gas pressure
Confirmation FeMnCrSi+Ni 200 mm 45 g.min–1 1.034 MPa
Figure 14. SEM images of the coating obtained with the optimized parameters. In (a) overview of the coating; (b) same area of the coating with 2000x magnification.
Table 12. Performance of the confirmation coating.
Property Mean Standard deviation
Best previous result
Percentage reduction
Porosity 0.05 0.02 0.31 83%Oxide content 8.94 1.70 12.27 27%Tensile Adhesion Strength 40.29 4.71 45.24 11%Microhardness 366 22 441 17%
4. Conclusions
The use of the Taguchi experimental design proved to be a great tool for analyzing the HVOF deposition process used in this work. After first experimental design, were selected the optimum level for each parameter. Resulting in a coating properties improvement.
Morphological analysis of the coatings, which involves porosity and oxide content analysis, showed a significant influence of the chemical composition of the alloy, spraying distance and carrier gas pressure on these properties.

Soldagem & Inspeção. 2015;20(2):238-252 251
Optimization of the Deposition Parameters of HVOF FeMnCrSi+Ni+B Thermally Sprayed Coatings
Nickel addition reduces the oxide content and porosity, meanwhile the Boron addition improves the hardness of the coatings. The alloys with Nickel, in general, showed lower porosity and oxide content.
Carrier gas pressure and Standoff distance had a strong influence on the properties of the coatings, where the pressure of 1.034 MPa, for the carrier gas, and 200 mm distance deposition, were considered the optimized values. Feed rate showed less influence on the coatings properties, and the results are slight better for higher powder feed rate level, 45 g/min.
References[1] Lima CRC, Trevisan RE. Ensaios de adesão em revestimentos
metal-cerâmicos obtidos por Aspersão Térmica a Plasma. Ciência & Tecnologia. 1999;13:51-62.
[2] Takimi AS. Obtenção de superligas de NiCrAlY nanoestruturadas por moagem de alta energia e sua aplicação por aspersão térmica hipersônica (HVOF) [masters dissertation]. Porto Alegre: Universidade Federal do Rio Grande do Sul; 2004.
[3] Pukasiewicz AGM. Desenvolvimento de revestimentos Fe-Mn-Cr-Si-Ni resistentes à cavitação depositados por Aspersão ASP [doctor thesis]. Curitiba: Universidade Federal do Paraná; 2008.
[4] Mariano C, Paredes RSC, Frare AF Jr. Desenvolvimento de revestimentos de nióbio resistentes a elevadas temperaturas depositados por Aspersão Térmica. In: Associação Brasileira de Psicoterapia Reencarnacionista. Proceedings of 4º Congresso Brasileiro de P&D em Petróleo e Gás – PDPETRO; 2007 Oct. 21-24; Campinas. Campinas: ABPR; 2007. p. 1-8.
[5] Thorpe ML. Thermal spray - industry in transition. Advanced Materials & Processes. 1993;5:50-61.
[6] Paredes RSC. Estudo de revestimentos de alumínio depositados por três processos de aspersão térmica para a proteção do aço contra a corrosão marinha [doctor thesis]. Florianópolis: Universidade Federal de Santa Catarina; 1998.
[7] Factor M, Roman I. Vickers microindentationof WC-12%Co thermal spray coating Part1: statistical analysis of microhardness data. Surface and Coatings Technology. 2000;132(2-3):181-193. http://dx.doi.org/10.1016/S0257-8972(00)00738-6.
[8] Lima MM, Godoy C, Modenesi PJ, Avelar-Batista JC, Davison A, Matthews A. Coating fracture toughness determined by Vickers indentation: an important parameter in cavitation erosion resistance of WC–Co thermally sprayed coatings. Surface & Coatings Technology. 2004;177-178:489-496.
[9] Yuping W, Pinghua L, Chenglin C, Zehua W, Ming C, Junhua H. Cavitation erosion characteristics of a Fe–Cr–Si–B–Mn coating fabricated by high velocity oxy-fuel (HVOF) thermal spray. Materials Letters. 2007;61(8-9):1867-1872. http://dx.doi.org/10.1016/j.matlet.2006.07.147.
[10] March, P, e Hubble, J.. Evaluation of relative cavitation erosion rates for base materials, weld overlays, and coatings. Norris: Tennessee Valley Authority Engineering Laboratory; 1996. Report Nº WR28-1-900-282.
[11] Boccanera L, Barra SR, Buschinelli AJA, Schwetzke R, Kreye H. Cavitation erosion resistanse of Co-alloyed stainless steel weld cladding as compared to thermal sprayed coatings. In: Associação Brasileira Soldagem. Anais do XXV Encontro Nacional de Tecnologia da Soldagem; 1999 Sep. 8-10; Belo Horizonte. Belo Horizonte: ABS; 1999.
[12] Kreye H, Schwetzke R, Buschinelli A, Boccanera L. Cavitation erosion resistant coatings produced by thermal spraying and by weld cladding. In: ASM International the Materials Information Society. Proceedings of the 15th International Thermal Spray Conference; 1998 May 25-29; Nice. Nice: ASM International; 1998.
[13] Schwetzke R, Kreye H. Cavitation erosion of HVOF coatings. In: ASM International the Materials Information Society. Proceedings of the 9th National Thermal Spray Conference; 1996 Oct. 7-11; Ohio. Ohio: ASM International; 1996; p. 153-158.
[14] Lopes AC. Avaliação da soldabilidade dos aços inoxidáveis ferriticos extra baixo instersticiais EBI/p444 [masters dissertation]. Curitiba: Universidade Federal do Paraná; 2005.
[15] Taguchi G. Engenharia da qualidade em sistemas de produção. São Paulo: McGraw-Hill; 1990.
[16] Roy RK. Design of experiments using the Taguchi Approach: 16 steps to product and process improvement. New York: John Wiley & Sons; 2001.
[17] Sulzer Metco. Diamalloy 1003 austenitic stainless steel. Jundiaí: Sulzer Metco; 2000. Technical Bulletin #10-402.
[18] Yuping W, Pinghua L, Chenglin C, Zehua W, Ming C, Junhua H. Cavitation erosion characteristics of a Fe–Cr–Si–B–Mn coating fabricated by high velocity oxy-fuel (HVOF) thermal spray. Materials Letters. 2007;61(8-9):1867-1872. http://dx.doi.org/10.1016/j.matlet.2006.07.147.
[19] Jones M, Horlock AJ, Shipway PH, McCartney DG, Wood JV, Horlock AJ et al. A comparison of the abrasive wear behaviour of HVOF sprayed titanium carbide- and titanium boride-based cermet coatings. Wear. 2001;251(1-12):1009-1016. http://dx.doi.org/10.1016/S0043-1648(01)00702-5.
[20] Bolelli G, Bonferroni B, Laurila J, Lusvarghi L, Milantia A, Niemib K. et al. Micromechanical propertie sandsliding wear behavior of HVOF-sprayed Fe-based alloy coatings. Wear. 2012;276–277:29-47. http://dx.doi.org/10.1016/j.wear.2011.12.001.
[21] Lee CH, Min KO. Effects of heat treatment on the microstructure and properties of HVOF-sprayed Ni-Cr-W-Mo-B alloy coatings. Surface and Coatings Technology. 2000;132:p.49-57.
[22] Carrasquero EJ, Lesage J, Puchi-Cabrera ES, Staia MH. Fretting wear of HVOF Ni–Cr based alloy deposited on SAE 1045 steel. Surface and Coatings Technology. 2008;202(18):4544-4551. http://dx.doi.org/10.1016/j.surfcoat.2008.04.040.
[23] Wu Y, Hong S, Zhang J, He Z, Guo W, Wang Q. et al. Microstructure and cavitation erosion behavior of WC–Co–Cr coating on 1Cr18Ni9Ti stainless steel by HVOF thermal spraying. Journal of Refractory Metals and Hard Materials. 2012;32:21-26. http://dx.doi.org/10.1016/j.ijrmhm.2012.01.002.
[24] Wu Y, Lin P, Xie G, Hu J, Cao M. Formation of amorphous and nanocrystalline phases in high velocity oxy-fuel thermally sprayed a Fe–Cr–Si–B–Mn alloy. Materials Science and Engineering. 2006;430(1-2):34-39. http://dx.doi.org/10.1016/j.msea.2006.05.095.
[25] Zhang C, Liu L, Chan KC, Chen Q, Tang CY. Wear behavior of HVOF-sprayed Fe-based amorphous coatings. Intermetallics. 2012;29:80-85. http://dx.doi.org/10.1016/j.intermet.2012.05.004.
[26] Kim H, Grossi S, Kweon Y. Characterization of Fe-Cr-B based coatings produced by HVOF and PTA processes. Metals and Materials. 1999;5(1):63-72. http://dx.doi.org/10.1007/BF03026006.

252 Soldagem & Inspeção. 2015;20(2):238-252
Sucharski et al.
[27] Zhou Z, Wang L, He DY, Wang FC, Liu YB. Microstructure and wear resistance of fe-based amorphous metallic coatings prepared by HVOF thermal spraying. Journal of Thermal Spray Technology. 2010;19(6):1287-1293. http://dx.doi.org/10.1007/s11666-010-9556-2.
[28] American Society for Testing and Materials – ASTM. ASTM C633-01: Standard test method for adhesion or cohesion strength of thermal spray coatings. Pennsylvania: ASTM International; 2008.
[29] Amushahi MH, Ashrafizadeh F, Shamanian M. Characterization of boride-rich hardfacing on carbon steel by arc spray and GMAW processes. Surface and Coatings Technology. 2010;204(16-17):2723-2728. http://dx.doi.org/10.1016/j.surfcoat.2010.02.028.
[30] Fredriksson W, Malmgren S, Gustafsson T, Gorgoi M, Edström K. Full depth profile of passive films on 316L stainless steel
based on high resolution HAXPES in combination with ARXPS. Applied Surface Science. 2012;258(15):5790-5797. http://dx.doi.org/10.1016/j.apsusc.2012.02.099.
[31] Syed AA, Denoirjean A, Denoirjean P, Labbe JC, Fauchais P. In-flight oxidation of stainless steel particles in plasma spraying. Journal of Thermal Spray Technology. 2005;14(1):117-124. http://dx.doi.org/10.1361/10599630522675.
[32] Rossi A, Elsener B. Role of the interface oxide film/alloy composition and stability of stainless steels. Materials and Corrosion. 2012;63(12):1188-1193.
[33] Sobolev VV, Guilemany JM. Effect of oxidation on droplet flattening and splat-substrate interaction in thermal spray. Journal of Thermal Spray Technology. 1999;8(4):523-530. http://dx.doi.org/10.1361/105996399770350205.


![Influence of Nozzle Material and Spray Parameters on Pure ...€¦ · Thermal Spray Processes ..... 12 2.3.1. Plasma Spraying ... Schematic of HVOF process [5] ..... 17 Figure 2.8:](https://img.pdfslide.us/doc/110x75/60281ce421b6423e85751c8f/influence-of-nozzle-material-and-spray-parameters-on-pure-thermal-spray-processes.jpg)

![PulsedLaserDepositionofBaTiO3 ThinFilmson …Pulsed laser deposition or PLD is a reliable method to fabricate oxide thin films [1, 2]. Deposition parameters play an important role](https://img.pdfslide.us/doc/110x75/5f73454cb3efcd4ad464ea77/pulsedlaserdepositionofbatio3-thinfilmson-pulsed-laser-deposition-or-pld-is-a-reliable.jpg)