Embed Size (px)
Citation preview

Optimization of Settling Tank Designto Remove Particles and Metals
Yingxia Li1; Joo-Hyon Kang2; Sim-Lin Lau3; Masoud Kayhanian, M.ASCE4; andMichael K. Stenstrom, F.ASCE5
Abstract: Mass reduction rates of particles and metals were simulated for a two-compartment settling tank composed of a storagecompartment and a continuous flow compartment. Particle-size distribution, rainfall, and flow data from 16 storm events measured at threehighway sites were used. The volume ratio �i.e., ratio of surface areas for a given depth� between storage and continuous flow compart-ment was optimized for a given design storm size to maximize total mass reduction rates of particles and heavy metals. Measured settlingvelocity profiles of runoff samples were used in the simulation. Simulation results showed that in a given total design storm, larger storagecompartment fractions ��0.95� enhanced the removal of smaller particles �2–104 �m� and particulate phase metals, and even a smallfraction ��0.05� of continuous flow compartment effectively removed larger particles �104–1,000 �m�. A volume fraction of 0.75 for thestorage compartment is suggested to optimize annual reductions of particles and associated heavy metals.
DOI: 10.1061/�ASCE�0733-9372�2008�134:11�885�
CE Database subject headings: Stormwater management; Highways and roads; Runoff; Particle size distribution; Best ManagementPractice; Settling velocity; Heavy metals; Pollution; Optimization.
Introduction
Nonpoint source pollution has become the leading cause of thedeterioration of water bodies in the United States because of con-tinuing urbanization and the reductions from point sources due towastewater treatment plant construction. Heavy metals, hydrocar-bons, and fuel additives in roadway runoff, including highways,can be serious threats to the quality of receiving waters �Colwillet al. 1984; Driscoll et al. 1990; Young et al. 1996; Barrett et al.1998a�. Due to the nondegradable, accumulative, and toxic char-acter of heavy metals, highway runoff treatment has become in-creasingly important. In addition, because of the episodic natureof storm-water discharges, large variability in pollutant concen-trations, and the implementation of more stringent water qualityregulations, such as total maximum daily loads, special attentionis being given to mitigate pollutants from highway runoff.
Various treatment methods have been utilized to treat stormwater, including detention basins �Jacopin et al. 1999�, sedimen-
1Assistant Professor, School of Environment, Beijing Normal Univ.,Beijing, 100875, P.R. China.
2Postdoctoral Associate, St. Anthony Falls Laboratory, Univ. of Min-nesota, Minneapolis, MN 55414.
3Research Engineer, Dept. of Civil and Environmental Engineering,Univ. of California, Los Angeles, Los Angeles, CA 90095-1593.
4Associate Director, Center for Environmental and Water ResourcesEngineering, Dept. of Civil and Environmental Engineering, Univ. ofCalifornia, Davis, Davis, CA 95616.
5Distinguished Professor, Dept. of Civil and Environmental Engineer-ing, Univ. of California, Los Angeles, Los Angeles, CA 90095-1593.
Note. Discussion open until April 1, 2009. Separate discussions mustbe submitted for individual papers. The manuscript for this paper wassubmitted for review and possible publication on March 5, 2007; ap-proved on March 18, 2008. This paper is part of the Journal of Environ-mental Engineering, Vol. 134, No. 11, November 1, 2008. ©ASCE,
ISSN 0733-9372/2008/11-885–894/$25.00.JOURNAL OF E
Downloaded 24 Mar 2009 to 129.101.53.198. Redistribution subject to
tation tanks �Aldheimer and Bennerstedt 2003�, ponds �Hvitved-Jacobsen et al. 1994�, wetlands �Birch et al. 2004�, biofiltration,such as grassy swales and strips �Barrett et al. 1998b; Bäckström2003�, vortex or swirl concentrators �Lee et al. 2003�, and slowsand filters �Barrett 2003�. The California Dept. of Transportation�Caltrans� has undertaken pilot studies with a variety of methods,including extended detention basins, infiltration basins andtrenches, wet basins, media filters, biofiltration, drain inlet inserts,continuous deflection separators, oil/water separators, multicham-bered treatment trains, and silt traps �Caltrans 2004�. The perfor-mance of each treatment method strongly depends on particlesize, shape, and density, and associated settling velocity. Severalresearchers have investigated particle settling velocities in stormwater with different methodologies and obtained different results�Aiguier et al. 1996; Michelbach and Weiß 1996; Krishnappanet al. 1999; Bäckström 2002�. However, a common finding ofthese studies was that larger particles are removed more easilythan smaller particles as intuitively conjectured.
A number of factors influence treatment efficiency, includinginfluent pollutant concentrations, runoff magnitude, and facilitysize. As shown in Table 1, removal efficiencies highly vary de-pending on the pollutant type and treatment and analysis methods,from negative to 98%. The use of simple treatment efficiency asan indicator of performance has been questioned by Strecker et al.�2001�, who believe that comparing effluent concentrations is amore robust way of estimating performance.
Some of the treatment systems, such as sedimentation tanks�Sonstrom et al. 2002; Aldheimer and Bennerstedt 2003� and drydetention ponds �Stanley 1996� are designed to capture the firstflush of runoff and bypass the following, greater flow. The effi-ciency calculation is often based only on the treated portion, andbypassed pollutant mass may not be considered, which overesti-mates pollutant reduction rate. In addition, the dynamic behaviorof flow and pollutant concentrations throughout a storm as well as
seasonal changes should be considered when evaluating the per-NVIRONMENTAL ENGINEERING © ASCE / NOVEMBER 2008 / 885
ASCE license or copyright; see http://pubs.asce.org/copyright

T B G � C � S � S � C � O � S F N N a
886 / JOURNAL OF ENVIRONMENTAL ENGINEERING © ASCE / NOVEMBE
Downloaded 24 Mar 2009 to 129.101.53.198. Redistribution subject to
formance of treatment facilities �Whipple and Hunter 1981;Characklis and Wiesner 1997; Lee et al. 2004�. Removal effi-ciency is usually greater for higher influent pollutant concentra-tions �Strecker et al. 2001; Lau et al. 2001�. Because pollutantconcentrations tend to decrease as rainfall or runoff progresses�Sansalone and Buchberger 1997; Larsen et al. 1998; Krebs et al.1999; Li et al. 2005�, enhancing initial runoff �i.e., first flush�treatment can improve overall performance of a treatment facility.
Partitioning of metals between dissolved and particulatephases is important to evaluate removal efficiencies because mosttreatment methods remove particles as opposed to removingsoluble species. The partitioning information can be conveyed bythe dissolved fraction value, fd, which is defined as the proportionof dissolved mass of a metal element divided by the total mass ofthe metal element or the sum of dissolved and particle-boundmass �Sansalone and Buchberger 1997�. Large fd values indicatethat the metals are mainly in dissolved form. Table 2 shows se-lected fd values reported by different researchers. Although thereexists some variation in fd values from different references, alu-minum �Al�, chromium �Cr�, iron �Fe�, and lead �Pb� are mainlyin particulate form in highway runoff. Lower pH and higher av-erage pavement residence time are associated with higher dis-solved metal fraction �Sansalone and Buchberger 1997�. At thesame time, metal element dissolution/adsorption kinetics plays animportant role in their partitioning. Sample holding time also hasa significant influence on the partitioning of some metal elementssuch as copper �Cu�, Pb, and nickel �Ni�, with particle-phase con-centrations increasing with increasing holding time.
In this study, particle and metal removals in a two-compartment settling tank were simulated using measuredparticle-size distribution �PSD�, particle settling velocity profiles,and wet particle specific gravity, complemented with literaturedata on solid phase concentrations of metals. The settling tank hastwo compartments—one compartment �storage compartment� tocapture and retain the initial runoff �i.e., first flush� and the othercompartment �continuous flow compartment� that functions as acontinuous flow clarifier for treating the remaining runoff. Theoptimum fraction between the two compartments for various de-sign storm sizes �DSs� is obtained using the simulation results.The results can be used to optimize settling tank design.
Methodology
Storm Events for Settling Tank PerformanceSimulation
To simulate performance of the two-compartment settling tank,precipitations, flows, and PSDs of grab samples for 16 stormevents �1.5–71.4 mm total event rainfall� measured during 2002–2003 wet season at three highway runoff sites in west Los Ange-les were used. PSDs were measured using a Nicomp ParticleSizing Systems AccuSizer 780 optical particle sizer module�Santa Barbara, Calif.�, which quantifies the number of particlesin 512 intervals over the size range of 2–1,000 �m. The Accu-Sizer 780 utilizes light scattering or obscuration to detect particlespassing through the sensing zone. The detected pulses by thesensor have different pulse height and detect frequency dependingon the mean particle diameter and particle numbers, which aredirectly converted to PSD using a calibration curve previouslyprepared.
Annual precipitation for the year 2002–2003 was about the
able1.R
emov
alE
ffici
ency
�%�
ofD
iffe
rent
Tre
atm
ent
Met
hods
MP
type
s�r
efer
ence
s�T
SST
urbi
dity
CO
DTo
tal
PTo
tal
NT
KN
Cd
Cu
Cr
FeN
iPb
Zn
Feca
lco
lifor
mT
PHO
Ga
rass
ysw
ales
Bar
rett,
etal
.19
98b;
Bäc
kstr
öm20
03�
−85
–75
85–8
769
–78
61–6
334
–44
33–4
475
–79
17–4
175
–91
−47
7–
192
onst
ruct
edw
etla
nds
and
wet
pond
sU
SEPA
1993
;B
irch
etal
.20
04�
60–8
025
–65
20–5
520
–60
−98
–46
1216
965
64−
8422
6552
76
edim
enta
tion
tank
Ald
heim
eran
dB
enne
rste
dt20
03�
66–9
926
–95
−26
–40
0–92
18–9
637
–98
0–94
50–9
9.8
30–9
7−
35–
87
edim
enta
tion
cham
ber
Sons
trom
,et
al.
2002
�77
–88
6718
85−
716
ontin
uous
flow
clar
ifier
Cla
usen
etal
.20
02;
Was
chbu
sch
1999
�21
–34
2017
–29
3227
2524
17–6
0−
1512
il-gr
itse
para
tor
Cla
usen
etal
.20
02;
Wes
tet
al.
2001
�49
7444
4599
37
wir
lco
ncen
trat
or�L
eeet
al.
2003
�65
–70
iltra
tion
�Pap
iri
etal
.20
03�
9898
9895
ote:
BM
P�be
stm
anag
emen
tpr
actic
e;T
SS�
tota
lsu
spen
ded
solid
s;C
OD
�ch
emic
alox
ygen
dem
and;
Tota
lP�
tota
lph
ospo
rous
;T
KN
�to
tal
Kje
ldah
lni
trog
en;
Cd�
cadm
ium
;C
r�ch
rom
uim
;Fe
�ir
on;
i�ni
ckel
;Pb
�le
ad;
Zn�
zinc
;T
PH�
tota
lpe
trol
eum
hydr
ocar
bon.
Oil
and
grea
se.
average historical annual precipitations in the Los Angeles area,
R 2008
ASCE license or copyright; see http://pubs.asce.org/copyright

which corresponds to approximately 60% probability �i.e., 60% ofannual precipitations will be less than the 2002–2003 precipita-tion�. More details on site descriptions, the 16 storm events, andsample collection procedures have been discussed previously �Liet al. 2005�.
Wet Particle Specific Gravity
No consensus-based definition and methodology for wet particlespecific gravity �WPSG� exist in the literature. Particles are usu-ally dried in an oven to measure specific gravity �SG�. However,the drying step may significantly change particles’ physicochemi-cal characteristics �i.e., size�, modifying settling behavior of par-ticles �Krein and Schorer 2000�. The WPSG may be a morereasonable parameter to represent the particle density determiningvirtual settling velocity in storm water.
Direct Measurement
Stored highway runoff samples were filtered through 0.45 �mmembranes. A 10 mL volumetric flask was filled with 9 mLdeionized water by a pipette and weighed. Wet solids on themembranes were carefully taken into the flask until the watersurface reached the 10 mL line. As the solids were taken from themembranes, minor changes in shape or texture of the wet solidsmight occur but chemical properties and mixing ratio of solid andwater absorbed in the solids are conserved. The flask wasweighed immediately after adding wet solids. The weight increaseas the unit of 10−1 g was defined as the wet particle specificgravity.
Indirect Estimation
As an alternative method for estimating WPSG, total suspendedsolids �TSS� mass and total particle volume measured in the samerunoff sample can be compared �measured within 6 h after col-lection�. Our measurements of highway runoff particles showedthat the contribution of particles between 0.5 and 2 �m to thetotal particle volume concentration is less than 4% and was ne-glected, and therefore TSS �mg/L� mass can be directly related tototal volume concentration ��m3 /mL� of particles between 2 and
Table 2. Dissolved Fraction fd Values for Metals
Al Cd Cr Cu Fe
Embedded sediments from highway runoff
0.04�0.003–0.31�
0.54�0.45–0.96�
0.62�0.31–0.71�
0.03�0.01–0.13�
Suspended solids in highway runoff
0.29 0.008 0.18 0.01
0.2�0.03–0.49�
0.28�0.07–0.53�
0.11–0.44
0.2�0.17–0.33�
0.22�0.13–0.24�
0.79 0.21 0.59
Suspended solids in urban runoff
0.78 0.16 0.63 0.03
Note: Data in parentheses show the range of observation.
1,000 �m as follows:
JOURNAL OF E
Downloaded 24 Mar 2009 to 129.101.53.198. Redistribution subject to
WPSG =�p
�w=
Vs�s + �Vp − Vs��w
�wVp= f� �s
�w− 1� + 1 �1�
f �106 � TSS
�s�i
ni
�Dp,i3
6
�2�
where �p=wet particle density �g /cm3�; �s=particle density�g /cm3�; �w=water density �g /cm3�; Vs=solid volume of wet par-ticles ��m3�; Vp=total volume of wet particles ��m3�; f=fraction is fraction of solids volume to total volume of wetparticles �=Vs /Vp�; TSS=total suspended solids concentration�mg/L�; ni=number concentration of particles in size range i�number/mL�; and Dp,i=diameter of particles in size rangei ��m�.
Particle Setting Velocity Profile
Sedimentation experiments were conducted using the stored high-way runoff samples that had stable particle-size distribution. Liet al. �2005� showed that particles may grow rapidly in the firstfew hours after collection followed by decreased growth rate.Therefore, in the real situation, particles will grow in a settlingbasin, increasing their settling velocities. For simple and moreconservative calculation of particle settling efficiency, it is as-sumed that no change in PSD occurs during the settling processand thereby particles settle discretely �Type I settling�. Eight set-tling tests were performed with four different stored samples toobtain settling velocity profiles. First, a highway runoff samplestored in a 1 L plastic column was completely mixed by gentlyinverting the column five to six times and then a small volume ofsample from 0.5 to 5 mL, depending on the particle number con-centration, was removed from the 1 L column for initial PSDmeasurement. Next, the particles were allowed to settle undis-turbed over 48 h. During this period, 0.5–5 mL volumes ofsamples for PSD measurement were removed from 17 cm belowthe water surface �about 50% of the depth� of the column using awide bore pipette at various time intervals. Great care was takento insert the pipette into the water column and remove the fluidvery slowly to avoid disturbing the liquid. The sampling height�17 cm� was divided by each sampling time to obtain particlesettling velocities. The number of removed particles was calcu-
Pb Zn Reference
0.21�0.18–0.45�
0.85�0.54–0.96�
Sansalone and Buchberger 1997
0.05 0.53 Pitt et al. 1995
0.03�0–0.17�
0.25�0.04–0.56�
Gromaire-Mertz et al. 1999
0.04–0.21 0.11–0.45 Furumai et al. 2002
0.2�0.03
�0–0.03�0.26
�0.22–0.32�Westerlund et al. 2003
0.07 0.72 Our data, seasonal average
0.18 0.28 Morquecho and Pitt 2003
Ni
0.12�0.09–
0.61
lated by subtracting PSD at each sampling time from the PSD at
NVIRONMENTAL ENGINEERING © ASCE / NOVEMBER 2008 / 887
ASCE license or copyright; see http://pubs.asce.org/copyright
the initial time. Measured particle settling velocities were com-pared with settling velocities calculated with Newton’s law.
Event Removal Efficiency and Total Reduction Rateof Particles
Using data from each storm event and the settling velocity profileof different size particles obtained from the sedimentation experi-ments, PSD in the water column after settling were obtained forspecific size fractions corresponding to the compartments in thetwo-compartment settling tank simulation. The particle numbersfor each particle size range were converted to the particle massesand summed to obtain total particle mass, assuming sphericalshape and uniform density of particles within each size fraction.The removal efficiencies calculated for each of the 16 stormevents were used to calculate the total particle mass reduction andwas always based on the total particle mass generated by the 16storm events �i.e., sum of particle mass entering settling tank andbypassed particle mass�. Throughout this paper, the terms “par-ticle removal �or reduction�” or “metal removal �or reduction�”refer to the calculated mass of particles or metal mass sorbed tothe particles that are removed.
Event Removal Efficiency in the StorageCompartment
To simplify the particle removal calculation, particle removal thatmight occur in the storage compartment during filling time wasignored; this is reasonable because there will be turbulence duringfilling and as the storage compartment is capturing the first flush,the filling time will be short. Particle removal rate is a function ofcritical settling velocity, vc �m/day�, which was a single value of3 m /day, assuming a tank depth of 3 m and holding time of 24 h�vc=3 m /24 h� in this study. The removal efficiency of particlecan be calculated using the classic relationship developed forideal discrete settling �Metcalf and Eddy Inc. 2003�
E = 1 − fc +1
vc�
0
fc
vpdf �3�
where E=particle removal efficiency; fc=fraction of particleswith settling velocity vc or less; and vp=settling velocities ofspecific size particles.
Event Removal Efficiency in the Continuous FlowCompartment
Practically, the continuous flow compartment should be operatedthrough three steps: fill, flow through, and drain. The time fortank filling was ignored to simplify the calculation. Because par-ticle removal in an ideal continuous settling is only a function ofoverflow rate �vc�, which is the ratio of flow rate to tank surfacearea, removal efficiency is independent of tank volume or reten-tion time. Tank depth or volume will determine tank filling anddraining time when the initial operation is based on initially drytank, which is assumed here. That is, as the tank depth or volumedecreases, tank filling and draining times decrease and vice versa.With these assumptions, Eq. �3� can be utilized to calculate theremoval efficiency of particles in the continuous flow compart-ment. The overflow rate of the continuous flow compartment
changes over time and, therefore, time-varying values of vc were888 / JOURNAL OF ENVIRONMENTAL ENGINEERING © ASCE / NOVEMBE
Downloaded 24 Mar 2009 to 129.101.53.198. Redistribution subject to
used �i.e., instant flow rate/tank surface area�. The use of time-varying flow and PSD during the storm measured by grabsamples, the particle removal efficiency for the two-compartmentsettling tank can be calculated.
Metal Removal Efficiency
Particulate metal removal efficiency was calculated by Eq. �4�using the concentrations for different particle size ranges shownin Table 2. Assuming no dissolved metal removal by sedimenta-tion, total metals removal efficiencies were calculated from par-ticulate metal removal efficiencies using Eq. �5�. Table 2 showsthe dissolved metal fractions measured by different researchersand our observations from the 16 storm events
particulate metal removal efficiency =�icimi
r
�icimi�4�
total metal removal efficiency =�icimi
r
�icimifp =
�icimir
�icimi�1 − fd�
�5�
where ci=particulate metal concentration in particle size range i;mi
r=removed particle mass in size range i; mi=initial particlemass in size range i; f p=particulate metal fraction; and fd
=dissolved metal fraction. Our averaged 2002–2003 dissolvedmetal fraction fd values were used to calculate total metal re-moval efficiency for individual metal species, except for Fe, forwhich we used the average value in Table 2 �i.e., fd=0.03 for Fe�.
Optimum Tank Design to Maximize Total ReductionRate
Our preliminary finding �Li et al. 2006� is that a two-compartmentsettling tank effectively removes both large and small particleswith one compartment dedicated to storing the first flush and theother compartment as continuous flow clarifier to treat the laterpart of runoff. Due to the long holding period �24 h�, the storagecompartment is more efficient in removing the small particles.Depending on storm size, the continuous flow compartment isprimarily responsible for removing large particles.
The following analysis investigates the relative size of the twocompartments for a fixed total tank size �storage+continuous flowcompartment�. Assume a fixed total tank size is realistic becausethe total budget and site availability for treatment facilities islimited, especially in urban areas. The optimum volume fraction�i.e., surface area fraction given a fixed depth of 3 m� of storageand continuous volumes in the two-compartment settling tankwas determined by maximizing the total reduction rate of par-ticles or metals for the 16 storm events using
total reduction rate =�i=1
16 Mrem�PSD,flow,�,VT,r�i
�i=116 Mrunoff�PSD,flow�i
�6�
where Mrem,i=total mass removed for the ith storm event;Mrunoff,i=total mass generated in the ith storm event; PSD=particle-size distributions; flow=runoff flow rate; =particlesettling velocity profile; VT=total volume of the two-compartment settling tank; and r=fraction of storage compart-ment in a given VT. The VT value can be calculated by multiplyingthe design storm size �1.6–52 mm� by the catchment area �0.39,1.69, and 1.28 ha for the three sites, respectively� and runoff co-
efficient �0.95�. The maximum total reduction rate can be esti-R 2008
ASCE license or copyright; see http://pubs.asce.org/copyright

mated by evaluating Eq. �6� using small, incremental values of rfrom 0 to 1.0.
Results and Discussion
Wet Particle Specific Gravity
Wet particle specific gravity measurements were conducted threetimes with stored runoff samples. The WPSG ranged from 1.30 to1.42 with an average of 1.35. Fig. 1 shows the frequency histo-gram of WPSGs calculated by Eqs. �1� and �2� using a total 180grab samples from the 16 storm events. Approximately 75% oftotal grab samples have WPSGs less than 1.6. Variation inWPSGs among grab samples is relatively small �SD=0.38�. Meanand median of WPSGs are 1.36 and 1.44, respectively, which areclose to the measured range of WPSGs �1.30–1.42�.
Particle Settling Velocity Distribution
Fig. 2 shows the averaged particle settling efficiency from eightsettling tests compared with several cases of ideal discrete settlingwith different particle densities and shapes. The horizontal axisrepresents settling velocity and the vertical axis represents theremaining particle mass fraction �2–400 �m�, which is the re-maining suspended particle mass divided by initial mass. Particlemass in the sedimentation experiment was calculated from several
Fig. 1. Frequency histogram of wet particle specific gravity �180grab samples from the 16 storm events during the 2002–2003 wetseason�
Fig. 2. Comparison of experimental and calculated particle�2–400 �m� settling characteristics
JOURNAL OF E
Downloaded 24 Mar 2009 to 129.101.53.198. Redistribution subject to
PSD measurements at different settling times assuming sphericalparticles and uniform density for all particle size ranges �i.e.,particle volume removal fraction=particle mass removal frac-tion�. The number for individual particle size ranges were con-verted to volumes assuming spherical shape of particles and thenintegrated to obtain the total mass of the remaining particles andnormalized by initial masses to obtain remaining mass fraction.As shown in Fig. 2, the sedimentation experiment revealed muchlower settling efficiency than calculated with Newton’s law. Theassumption of uniform particle density and spherical shape over-estimated particle settling efficiency. For example, from the sedi-mentation experiment, 21% of the particle mass had settlingvelocity less than 4.1 m /day. When applying Newton’s law andassuming cylindrical shape and 1.35 of SG for the particles, only12% of the particle mass had settling velocities of less than4.1 m /day. The difference in settling velocity between calculatedand measured values may be caused by nonuniform specificgravities, irregular shapes, runoff characteristics, and total sus-pended solid concentrations in the runoff �Aiguier et al. 1996�.
Fig. 3 shows the probability of settling velocity for differentparticle diameters �Dp� from the sedimentation experiments. Thehorizontal axis is the standard normal quartile for the particlefraction with less than stated settling velocity and the vertical axisis settling velocity using a log scale. Because the data plots arewell correlated with linear regression as displayed in Fig. 3, set-tling velocity of particles with a certain value of Dp can be as-sumed log-normally distributed. Log-normal probabilitydistribution of settling velocity for each value of Dp is a functionof the corresponding mean and standard deviation, which can beobtained from the regression lines in Fig. 3. Therefore, settlingvelocity analysis curves for each particle size can be obtainedfrom cumulative density function �cdf� of log-normal distributionas follows:
cdf�vp� =1
2+
1
2erf� ln�vp� − �
2, vp � 0 �7�
where �=mean of log-transformed particle settling velocity and=standard deviation of log-transformed particle settling veloc-ity. The cumulative density functions fitted with measured settlingvelocity profiles for several different values of Dp are illustratedin Fig. 4. Fig. 5 shows � and as functions of Dp. As shown, thevalue of � is proportionally related to the value of Dp in the rangeof 0–60 �m. The linear relationship between � and Dp was used
Fig. 3. Log-normal probability plot showing frequency distributionof particle settling velocity
to obtain cdf for a given Dp. The relationship between and Dp
NVIRONMENTAL ENGINEERING © ASCE / NOVEMBER 2008 / 889
ASCE license or copyright; see http://pubs.asce.org/copyright

was curvilinear within 1.4–3.0 SG, which may be due to the dif-ficulty in experimentally observing values of � and for theparticles larger than 60 �m. Most particles larger than 60 �m�Dp�60 �m� were completely removed before the first or secondmeasurement, providing too few data points to obtain a reliableregression line of log-normal distribution.
Maximum Removal Efficiency and Optimum TankDesign
Particle Removal EfficiencyThe removal efficiency of each particle size range was calculatedusing the corresponding cdf, which is a function of � and . Thevalues of � and for the particle size ranges between 2 and60 �m were obtained using the regression line for � and interpo-lated line for in Fig. 4. For the particles larger than 60 �m,values of � were obtained by extrapolating the regression line,whereas values of were assumed to be 2.2, which is the value atDp=60 �m.
For the storage compartment or the continuous flow compart-ment with critical settling velocity or overflow rate vc �m/day�,the removal efficiency of each particle size range can be calcu-lated by substituting Eq. �7� into Eq. �3�, which becomes
E = 1 −1
vc�
0
vc
cdf�vp�dvp �8�
Eq. �8� can be solved numerically or analytically. The analyticalsolution of Eq. �8� is obtained by solving the integration term onthe right-hand side of Eq. �8�, resulting in
Fig. 4. Log-normal cumulative distribution function fitted with ex-perimental settling velocity profile for different particle sizes
Fig. 5. Mean and standard deviation of log-transformed velocity fordifferent particle sizes
890 / JOURNAL OF ENVIRONMENTAL ENGINEERING © ASCE / NOVEMBE
Downloaded 24 Mar 2009 to 129.101.53.198. Redistribution subject to
E =1
2−
e�
2vc�ez erf� ln�vc� − �
2�
+ e2/2�erf�
2−
ln�vc� − �
2� − 1� �9�
Using Eq. �9� along with flow and PSD information for the 16storm events, particle reduction rates were calculated for two-compartment settling tank. Fig. 6 shows the total particle reduc-tion rate in the individual and combined compartments for twodifferent DSs as a function of the fraction of storage compartment�r�. For example, r=0 indicates that the storage compartment vol-ume is zero and the entire volume is used for the continuous flowcompartment. The vertical axis represents total particle reductionrate calculated using the 16 storm events. Fig. 6 demonstrates thatwhen the DS is 1.6 mm �i.e., a small settling tank�, total particlereduction rate changes little as r increases. This is because mostof the particle removal occurs in the continuous flow compart-ment and the storage compartment is too small to capture a mea-surable fraction of total runoff volume. At DS=26 mm, totalparticle removal increases slightly �5%� as r increases from 0 to0.95. The storage compartment removes more particles than thecontinuous flow compartment when r is larger than 0.25. Forlarge storage compartment volume such as DS=26 mm, the entireflow from smaller storms is captured in the storage compartmentand the continuous flow compartment functions only for stormslarger than 26 mm. Fig. 6 suggests that only a small volume ofcontinuous flow compartment is needed to maintain high effi-ciency, especially when the design storm size is small.
Fig. 7 shows the total particle reduction rates of the two-compartment settling tank as the DS size is increased. The totalparticle reduction rate always increases with increasing r as longas a small fraction of continuous flow compartment exists. Fig. 8shows the changes in particle reduction rate for particles in sixdifferent size ranges from 2–10 to 249–1,000 �m. Larger stor-age compartments provide greater removal of smaller particles,whereas even a small volume of continuous flow compartment
Fig. 6. Total particle reduction rate in individual compartments atdesign storm size=1.6 and 26 mm
completely removes particles larger than 104 �m. To maximize
R 2008
ASCE license or copyright; see http://pubs.asce.org/copyright

overall particle reduction in a given DS, a designer can allocateminimum surface area for the continuous flow compartment tar-geting large particle removal ��60–100 �m� and use the remain-ing surface area �or volume� for storage compartment to removesmall particles. The simulations show that only a small continu-ous flow compartment can provide essentially complete removalof particles larger than 104 �m. We suggest a fraction of 0.25�i.e., r=0.75� for the optimum size of the continuous compart-ment because the enhancement in particle removal by increasing rfrom 0.75 to upper value �e.g., 0.95� is very small for a given DS.Volume and depth of the continuous flow compartment should belarge enough to mitigate turbulence and prevent short-circuiting.In this paper, the reduction rate at r=0.75 will be referred to asthe optimized reduction rate.
Fig. 9 shows the optimized total particle reduction rate as a
Fig. 7. Total particle reduction rate for different design storm size
Fig. 8. Particle reduction rates for differen
JOURNAL OF E
Downloaded 24 Mar 2009 to 129.101.53.198. Redistribution subject to
function of design storm size. Rainfall probability is also shownfor reference. Rainfall probability is calculated from the eventrainfall data obtained from the three highway runoff sites duringthe 1999–2003 monitoring seasons. Optimized particle reductionrate increases rapidly as DS increases up to 13 mm. At DS=13 mm, 80% of the particle mass from the entire season of2002–2003 can be removed by the two-compartment tank. Whenthe tank size is doubled �i.e., DS=26 mm�, the total particle re-duction rate increases by only 5%.
Metal Removal EfficiencyPollutant distribution on different size particles is one of the keyfactors that determine pollutant removal efficiency. Fig. 10 illus-trates the particulate zinc �Zn� reduction rate. The simulation used
particles under different design storm sizes
Fig. 9. Optimized particle reduction rate and rainfall probability withrespect to design storm �rainfall probability means the probability ofan event rainfall to be less than a stated design storm�
t size
NVIRONMENTAL ENGINEERING © ASCE / NOVEMBER 2008 / 891
ASCE license or copyright; see http://pubs.asce.org/copyright

the Zn concentrations for different particle size ranges reported byMorquecho and Pitt �2003� as shown in Table 3. Particulate Znreduction rate showed a similar pattern with particle reductionrate �Fig. 7� but the particulate Zn reduction rate is consistentlylower than the particle removal efficiency. This occurs becausethe smaller particles with higher Zn concentrations are removedless efficiently than larger particles with lower Zn concentrations.Larger storage compartments provide greater particle removal andmetal removal, with proportionally larger increases in metal re-moval, as the storage compartment improves removal of smallparticles. For example, at DS=13 mm, particulate Zn reduction
Table 3. Metal Concentrations for Different Particle Size Ranges
Sizeranges��m�
Heavy metal concentration ��g /g�
Al Cd Cr Cu Fe Ni Pb Zn
0.45–2 2,894 29,267 199 13,5
2–10 4,668 18,508 868 13,6
10–45 735 26,221 229 1,55
45–106 1,312 14,615 226 2,07
106–250 2,137 21,730 375 3,48
�250 50 28,604 117 26
25–38 16.8 364 265 1,18
38–45 17.2 353 236 99
45–63 17.3 364 266 1,02
63–75 16.3 333 258 1,05
75–150 15 312 248 1,01
150–250 9.2 204 195 57
250–425 8 78 65 32
425–850 9.5 48 53 31
850–2,000 9.7 45 37 25
�50 60,000 350 420 230 1,570 4,37
50–100 45,000 400 250 250 1,480 1,70
100–200 38,000 410 200 220 1,550 1,10
200–500 35,500 150 100 220 850 93
500–1,000 37,500 140 50 220 460 93
�43 5 46 220 65 350 96
43–100 5 58 230 50 300 80
100–250 2 38 230 40 210 50
250–841 NA 12 240 5 44 15
Average 1 28 238 25 142 36
Fig. 10. Particulate zinc reduction rate at different design stormsize using Morquecho’s zinc concentration distribution on differentparticle sizes
892 / JOURNAL OF ENVIRONMENTAL ENGINEERING © ASCE / NOVEMBE
Downloaded 24 Mar 2009 to 129.101.53.198. Redistribution subject to
rate increases from 50 to 57% �7% increase�, whereas particlereduction rate increases from 76 to 80% �4% increase� with in-creasing r from 0 to 0.75. This results because the Zn concentra-tion on smaller particles �13,641 �g /g for particles 2–10 �m� ismuch greater than on larger particles �266 �g /g for particleslarger than 250 �m�.
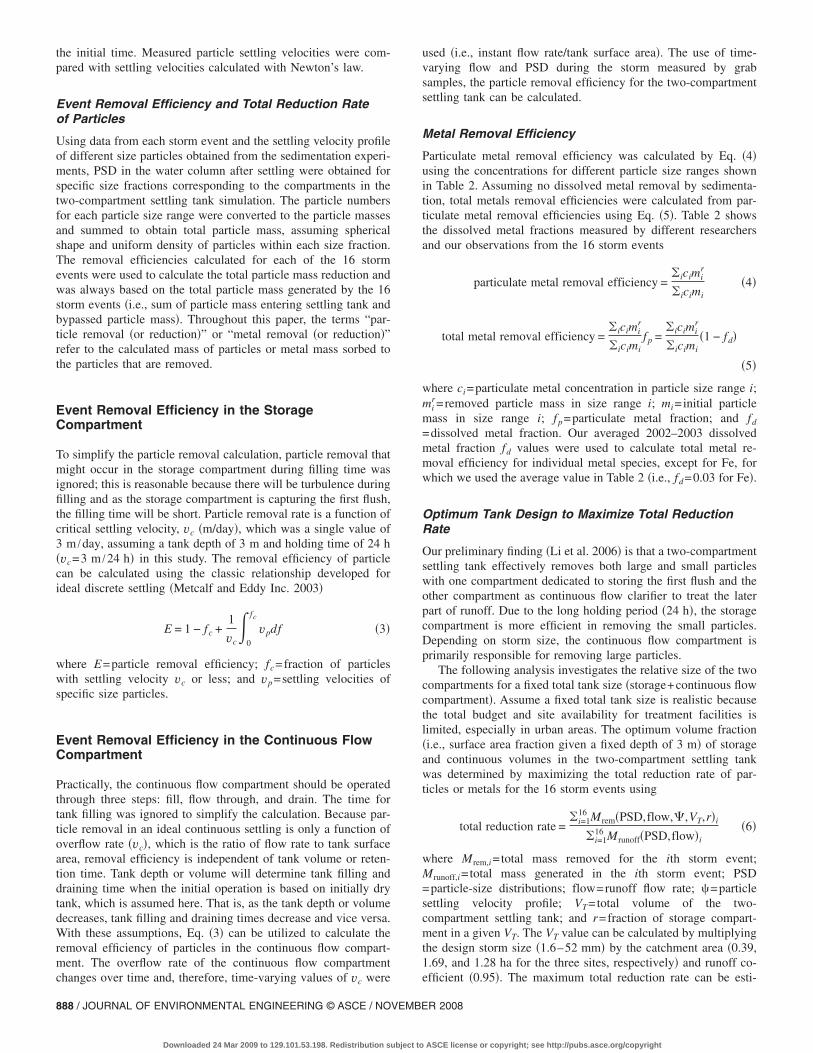
Fig. 11 shows the optimized total metal reduction rates�r=0.75� for different values of DS using the metal concentrationdata reported by different researchers �Table 3�. No dissolvedmetal removal is assumed and the difference in removal ratesamong metals is a function of the dissolved metal fraction, fd,with lower values of fd providing greater efficiency. Fig. 11shows that reduction rates of Cr, Fe, and Pb �fd values of Cr, Fe,and Pb are 0.21, 0.03, and 0.07, respectively� may approach 50–70%, whereas Cd and Zn are less, closer to 20%. Each referencefound different metal concentrations on particles, resulting in dif-ferent removal efficiencies for the same metals. Improved metalremoval will occur when the particulate phase concentrations aregreater.
Effect of First Flush on Settling Tank PerformanceParticles showed a first flush and the particle number first flushratio �PNFF20� at 20% of total runoff volume averaged 2.0 �Liet al. 2005�. This means that 40% of the particle numbers werecontained in the first 20% of the runoff volume. The particle firstflush increases the removal efficiency because the storage tankalways captures at least a portion of the first flush, even for thelargest storms. To investigate the difference between particle re-duction rates with and without first flush phenomena, simulations
Remarks References
Urban storm-water suspension Morquecho and Pitt 2003;Birmingham and Tuscaloosa, Ala.
ighway runoff, embedded sediment Sansalone and Buchberger 1997,Cincinnati
ighway runoff, embedded sediment Roger et al. 1998,Hérault region, France
Street vacuuming Lau and Stenstrom 2005,Los Angeles
40
41
9
6
6
6
9 H
6
7
7
4
4
5
4
9
0 H
0
0
0
0
0
5
0
0
0
R 2008
ASCE license or copyright; see http://pubs.asce.org/copyright
using the actual PSD and the event mean PSD for the entire stormwere compared. The simulation showed that at DS=13 mm,the existence of the first flush increased the optimized particlemass reduction by 5, 9, and 16% for the particle size rangesof 2–10, 10–25, and 25–41 �m, respectively. Larger particles�Dp�60 �m� are removed well regardless of the first flush be-cause larger particles are efficiently removed by even a smallcontinuous flow compartment. The overall increase in particleremoval due to the existence of first flush was approximately 5%.
Conclusions
Particles in highway runoff from three sites with high annualaverage daily traffic � 300,000 vehicles /day� were characterizedby particle size, density, and settling velocity. Particles with thesame diameter exhibited a range of settling velocities and theoverall particle settling efficiency was much lower than calculatedwith Newton’s law.
Simulations using data from 16 storm events from three high-way sites were used to estimate particle mass reductions for atwo-compartment settling tank. One compartment was used tostore the initial runoff to prolong the period of settling and thesecond compartment was used as a continuous flow clarifier.Particle reduction rate was optimized by adjusting the fraction ofstorage compartment over a range of design storm sizes, rangingfrom 1.6 to 26 mm total rainfall. Generally a 3:1 ratio of storageto continuous flow compartment surface areas optimized re-movals. Overall particle mass removal increased from 70 to 80%as the design storm increased from 1.6 to 13 mm. Larger storagecompartment surface areas increased removals of particles withdiameters 25–41 �m by as much as 26% depending on the de-sign storm size. Particles larger than 100 �m were generallywell removed regardless of compartment volumes. The existenceof a particle first flush increased small particle reduction ratefrom 5 to 16% for particles ranging from 2 to 41 �m. Totalchromium, iron, and lead, which are more associated withparticles �fd=0.21, 0.03, and 0.07, respectively�, had removals
Fig. 11. Optimized reduction rate for total metal species using di
of 50–70%, depending on specific conditions, whereas cad-
JOURNAL OF E
Downloaded 24 Mar 2009 to 129.101.53.198. Redistribution subject to
mium and zinc �fd=0.79, 0.72 respectively� had less than 20%removals.
This paper has used scientific and quantitative methods to es-timate particle and particulate phase metal removals by sedimen-tation using Type I sedimentation analysis. It is an example ofhow unit operations and processes principles can be applied tobest management practice analysis to improve their evaluationbeyond simple rules of thumb, such as detention time. The simu-lated removals likely represent the maximum achievable removalsusing sedimentation, and if greater removals are needed, thenfiltration or chemical coagulation/flocculation �Kang et al. 2007�will likely be needed.
Acknowledgments
This study was supported in part by the California Department ofTransportation �Caltrans�, Division of Environmental Analysis.The writers are grateful for their continuous support.
References
Aiguier, E., Chebbo, G., Bertrand-Krajewski, J.-L., Hedges, P., andTyack, N. �1996�. “Methods for determining the settling velocity pro-files of solids in storm sewage.” Water Sci. Technol., 33�9�, 117–125.
Aldheimer, G., and Bennerstedt, K. �2003�. “Facilities for treatmentof stormwater runoff from highways.” Water Sci. Technol., 48�9�,113–121.
Bäckström, M. �2002�. “Sediment transport in grassed swales duringsimulated runoff events.” Water Sci. Technol., 45�7�, 41–49.
Bäckström, M. �2003�. “Grassed swales for stormwater pollution controlduring rain and snowmelt.” Water Sci. Technol., 48�9�, 123–132.
Barrett, M. E. �2003�. “Performance, cost, and maintenance requirementsof Austin sand filters.” J. Hydrol. Eng., 129�3�, 234–242.
Barrett, M. E., Irish, L. B., Jr., Malina, J. F., Jr., and Charbeneau, R. J.�1998a�. “Characterization of highway runoff in Austin, Texas area.”J. Environ. Eng., 124�2�, 131–137.
Barrett, M. E., Walsh, P. M., Malina, J. F., Jr., and Charbeneau, R. J.
ce data sources for metal concentration on different particle sizes
fferen�1998b�. “Performance of vegetative controls for treating highway
NVIRONMENTAL ENGINEERING © ASCE / NOVEMBER 2008 / 893
ASCE license or copyright; see http://pubs.asce.org/copyright

runoff.” J. Environ. Eng., 124�11�, 1121–1128.Birch, G. F., Matthai, C., Fazeli, M. S., and Suh, J. Y. �2004�. “Efficiency
of a constructed wetland in removing contaminants from stormwater.”Wetlands, 24�2�, 459–466.
Caltrans. �2004�. “Storm water monitoring and BMP development statusreport.” Final rep. SW-04-069.04.01, California Dept. of Transporta-tion, Division of Environmental Analysis, Sacramento, Calif.
Characklis, G. W., and Wiesner, M. R. �1997�. “Particles, metals, andwater quality in runoff from large urban watershed.” J. Environ. Eng.,123�8�, 753–759.
Clausen, J. C., et al. �2002�. “Stormwater treatment devices section 319project.” Final Rep., Connecticut Dept. of Environmental Protection,Hartford, Conn.
Colwill, D. M., Peters, C. J., and Perry, R. �1984�. “Water quality ofmotorway runoff.” TRRL Supplemental Rep. No. 823, Transport andRoad Research Lavoratory, Crowthorne, Bershire, U.K.
Driscoll, E., Shelley, P., and Strecker, E. �1990�. “Pollutant loadings andimpacts from highway stormwater runoff. IV: Research data appen-dix.” FHWA-RD-88-009, Federal Highway Administration, DOT,Washington, D.C., 1–139.
Furumai, H., Balmer, H., and Boller, M. �2002�. “Dynamic behavior ofsuspended pollutants and particle size distribution in highway runoff.”Water Sci. Technol., 46�11–12�, 413–418.
Gromaire-Mertz, M. C., Garnaud, S., Gonzalez, A., and Chebbo, G.�1999�. “Characterization of urban runoff pollution in Paris.” WaterSci. Technol., 39�2�, 1–8.
Hvitved-Jacobsen, T., Johansen, N. B., and Yousef, Y. A. �1994�. “Treat-ment system for urban and highway run-off in Denmark.” Tech. Dig.Ser.-Opt. Soc. Am., 146/147, 499–506.
Jacopin, Ch., Bertrand-Krajewski, J. L., and Desbordes, M. �1999�.“Characterization and settling of solids in an open, grassed, storm-water sewer network detention basin.” Water Sci. Technol., 39�2�,135–144.
Kang, J.-H., Li, Y., Lau, S.-L., Kayhanian, M., and Stenstrom, M. K.�2007�. “Particle destabilization in highway runoff to optimize pollut-ant removal.” J. Environ. Eng., 133�4�, 426–434.
Krebs, P., Holzer, P., Huisman, J. L., and Rauch, W. �1999�. “First flushof dissolved compounds.” Water Sci. Technol., 39�9�, 55–62.
Krein, A., and Schorer, M. �2000�. “Road runoff pollution by polycyclicaromatic hydrocarbons and its contribution to river sediments.” WaterResour., 34�16�, 4110–4115.
Krishnappan, B. G., Marsalek, J., Watt, W. E., and Anderson, B. C.�1999�. “Seasonal size distributions of suspended solids in a stormwa-ter management pond.” Water Sci. Technol., 39�2�, 127–134.
Larsen, T., Broch, K., and Andersen, M. R. �1998�. “First flush effectsin urban catchment area in Aalborg.” Water Sci. Technol., 37�1�,251–257.
Lau, S.-L., Khan, E., and Stenstrom, M. K. �2001�. “Catch basin inserts toreduce pollution from stormwater.” Water Sci. Technol., 44�7�, 23–34.
Lau, S.-L., and Stenstrom, M. K. �2005�. “Metals and PAHs adsorbed tostreet particles.” Water Res., 39�17�, 4083–4092.
Lee, H., Lau, S.-L., Kayhanian, M., and Stenstrom, M. K. �2004�. “Sea-sonal first flush phenomenon of urban stormwater discharges.” WaterRes., 38�19�, 4153–4163.
Lee, J., Bang, K., Choi, J., Ketchum, L. H., Jr., and Cho, Y. �2003�. “Thevortex concentrator for suspended solids treatment.” Water Sci. Tech-nol., 47�9�, 335–341.
Li, Y., Lau, S.-L., Kayhanian, M., and Stenstrom, M. K. �2005�. “Particle
894 / JOURNAL OF ENVIRONMENTAL ENGINEERING © ASCE / NOVEMBE
Downloaded 24 Mar 2009 to 129.101.53.198. Redistribution subject to
size distribution in highway runoff.” J. Environ. Eng., 131�9�, 1267–1276.
Li, Y., Lau, S.-L., Kayhanian, M., and Stenstrom, M. K. �2006�.“Dynamic characteristics of particles size distribution in highway run-off: Implications for settling tank design.” J. Environ. Eng., 132�8�,852–861.
Metcalf & Eddy, Inc. �2003�. Wastewater engineering: Treatment, dis-posal, and reuse, 4th Ed., McGraw-Hill, New York.
Michelbach, S., and Weiß, G. J. �1996�. “Settleable sewer solids at storm-water tanks with clarifier for combined sewage.” Water Sci. Technol.,33�9�, 261–267.
Morquecho, R., and Pitt, R. �2003�. “Stormwater heavy metal particulateassociations.” Proc., Water Environment Federation’s Annual Exhibi-tion and Conf. (WEFTEC), Los Angeles, Calif., Water EnvironmentFederation, Alexandria, Va.
Papiri, S., et al. �2003�. “Field monitoring and evaluation of innovativesolutions for cleaning storm water runoff.” Water Sci. Technol., 47�7–8�, 327–334.
Pitt, R., Field, R., Lalor, M., and Brown, M. �1995�. “Urban stormwatertoxic pollutants: Assessment, sources, and treatability.” Water Envi-ron. Res., 67�3�, 260–275.
Roger, S., Montréjaud-Vignoles, M., Andral, M. C., Herremans, L., andFortuné, J. P. �1998�. “Mineral, physical and chemical analysis of thesolid matter carried by motorway runoff water.” Water Res., 32�4�,1119–1125.
Sansalone, J. J., and Buchberger, S. G. �1997�. “Partitioning and firstflush of metals in urban roadway storm water.” J. Environ. Eng.,123�2�, 134–143.
Sonstrom, R. S., Clausen, J. C., and Askew, D. R. �2002�. “Treatment ofparking lot stormwater using a StormTreat system.” Environ. Sci.Technol., 36�20�, 4441–4446.
Stanley, D. W. �1996�. “Pollutant removal by a stormwater dry detentionpond.” Water Environ. Res., 68�6�, 1076–1083.
Strecker, E. W., Quigley, M. M., Urbonas, B. R., Jones, J. E., and Clary,J. K. �2001�. “Determining urban storm water BMP effectiveness.” J.Hydrol. Eng., 127�3�, 144–149.
USEPA. �1993�. “Guidance specifying management measures for sourcesof nonpoint pollution in coastal waters.” EPA 840-B-92-002, Govern-ment Printing Office, Washington, D.C.
Waschbusch, R. J. �1999�. “Evaluation of the effectiveness of an urbanstormwater treatment unit in Madison, Wisconsin, 1996–1997.” USGSWater Resources Investigations Rep. No. 99–4195, USGS, Middleton,Wis.
West, T. A., Sutherland, J. W., Bloomfield, J. A., and Lake, D. W., Jr.�2001�. “A study of the effectiveness of a Vortechs stormwater treat-ment system for removal of total suspended solids and other pollut-ants in the Marine Village watershed, Village of Lake George, NewYork.” N.Y. State Dept. of Environmental Conservation, Division ofWater, Albany, N.Y.
Westerlund, C., Viklander, M., and Bäckström, M. �2003�. “Seasonalvariations in road runoff quality in Luleä, Sweden.” Water Sci. Tech-nol., 48�9�, 93–101.
Whipple, W., and Hunter, J. V. �1981�. “Settleability of urban runoffpollution.” J. Alloys Compd., 53�12�, 1726–1731.
Young, G. K., et al. �1996�. “Evaluation and management of highwayrunoff water quality.” FHWA-PD-96–032, Office of Environment ofPlanning, Federal Highway Administration, Washington, D.C.
R 2008
ASCE license or copyright; see http://pubs.asce.org/copyright


![Vision_2025[1] Copy ASCE.pdf](https://img.pdfslide.us/doc/110x75/55cf94b5550346f57ba3e14e/vision20251-copy-ascepdf.jpg)