Embed Size (px)
Citation preview
This study will demonstrate how the GC instrumental parameters are optimized so that VOCs, in addition to semi-volatile organic compounds (SVOCs), can be analyzed on the same instrumentation enabling enhanced throughput and laboratory efficiency. It will also discuss the number of samples required by each refinery depending on its size, in addition to the distribution of sampling sites around the refinery.
Sampling RequirementsThere are approximately 140 active petroleum and oil refineries operating in the U.S., which have to comply with the new regulations. Method 325A describes two options for determining the passive sampling locations of the TD tubes around the facility, which will mainly be influenced by the overall shape and size of the refinery (3).
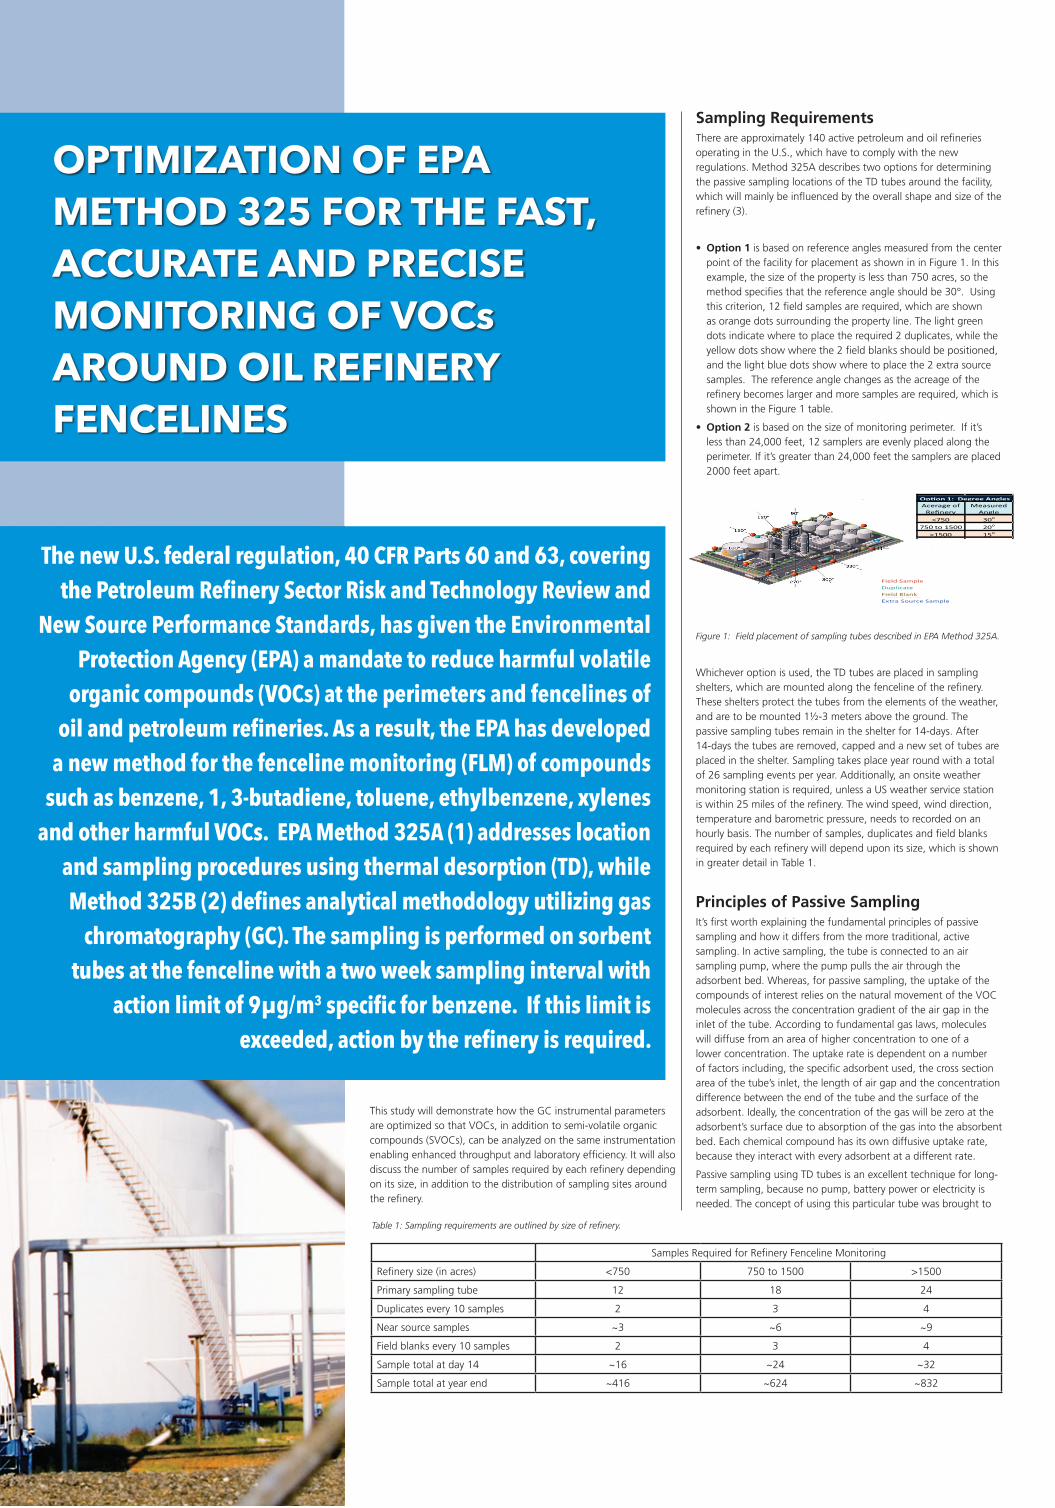
• Option 1 is based on reference angles measured from the center point of the facility for placement as shown in in Figure 1. In this example, the size of the property is less than 750 acres, so the method specifies that the reference angle should be 30°. Using this criterion, 12 field samples are required, which are shown as orange dots surrounding the property line. The light green dots indicate where to place the required 2 duplicates, while the yellow dots show where the 2 field blanks should be positioned, and the light blue dots show where to place the 2 extra source samples. The reference angle changes as the acreage of the refinery becomes larger and more samples are required, which is shown in the Figure 1 table.
• Option 2 is based on the size of monitoring perimeter. If it’s less than 24,000 feet, 12 samplers are evenly placed along the perimeter. If it’s greater than 24,000 feet the samplers are placed 2000 feet apart.
Figure 1: Field placement of sampling tubes described in EPA Method 325A.
Whichever option is used, the TD tubes are placed in sampling shelters, which are mounted along the fenceline of the refinery. These shelters protect the tubes from the elements of the weather, and are to be mounted 1½-3 meters above the ground. The passive sampling tubes remain in the shelter for 14-days. After 14-days the tubes are removed, capped and a new set of tubes are placed in the shelter. Sampling takes place year round with a total of 26 sampling events per year. Additionally, an onsite weather monitoring station is required, unless a US weather service station is within 25 miles of the refinery. The wind speed, wind direction, temperature and barometric pressure, needs to recorded on an hourly basis. The number of samples, duplicates and field blanks required by each refinery will depend upon its size, which is shown in greater detail in Table 1.
Principles of Passive Sampling It’s first worth explaining the fundamental principles of passive sampling and how it differs from the more traditional, active sampling. In active sampling, the tube is connected to an air sampling pump, where the pump pulls the air through the adsorbent bed. Whereas, for passive sampling, the uptake of the compounds of interest relies on the natural movement of the VOC molecules across the concentration gradient of the air gap in the inlet of the tube. According to fundamental gas laws, molecules will diffuse from an area of higher concentration to one of a lower concentration. The uptake rate is dependent on a number of factors including, the specific adsorbent used, the cross section area of the tube’s inlet, the length of air gap and the concentration difference between the end of the tube and the surface of the adsorbent. Ideally, the concentration of the gas will be zero at the adsorbent’s surface due to absorption of the gas into the absorbent bed. Each chemical compound has its own diffusive uptake rate, because they interact with every adsorbent at a different rate.
Passive sampling using TD tubes is an excellent technique for long-term sampling, because no pump, battery power or electricity is needed. The concept of using this particular tube was brought to
OptimizatiOn Of Epa mEthOd 325 fOr thE fast, accuratE and prEcisE mOnitOring Of VOcs arOund Oil rEfinEry fEncElinEs
The new U.S. federal regulation, 40 CFR Parts 60 and 63, covering the Petroleum Refinery Sector Risk and Technology Review and
New Source Performance Standards, has given the Environmental Protection Agency (EPA) a mandate to reduce harmful volatile
organic compounds (VOCs) at the perimeters and fencelines of oil and petroleum refineries. As a result, the EPA has developed
a new method for the fenceline monitoring (FLM) of compounds such as benzene, 1, 3-butadiene, toluene, ethylbenzene, xylenes
and other harmful VOCs. EPA Method 325A (1) addresses location and sampling procedures using thermal desorption (TD), while Method 325B (2) defines analytical methodology utilizing gas
chromatography (GC). The sampling is performed on sorbent tubes at the fenceline with a two week sampling interval with
action limit of 9µg/m3 specific for benzene. If this limit is exceeded, action by the refinery is required.
Samples Required for Refinery Fenceline Monitoring
Refinery size (in acres) <750 750 to 1500 >1500
Primary sampling tube 12 18 24
Duplicates every 10 samples 2 3 4
Near source samples ~3 ~6 ~9
Field blanks every 10 samples 2 3 4
Sample total at day 14 ~16 ~24 ~32
Sample total at year end ~416 ~624 ~832
Acerage of Refinery
Measured Angle
<750 30o
750 to 1500 20o
>1500 15o
Op�on 1: Degree Angles
Field SampleDuplicateField BlankExtra Source Sample
Table 1: Sampling requirements are outlined by size of refinery.
21
AUGUST / SEPTEMBER • WWW.PETRO-ONLINE.COM
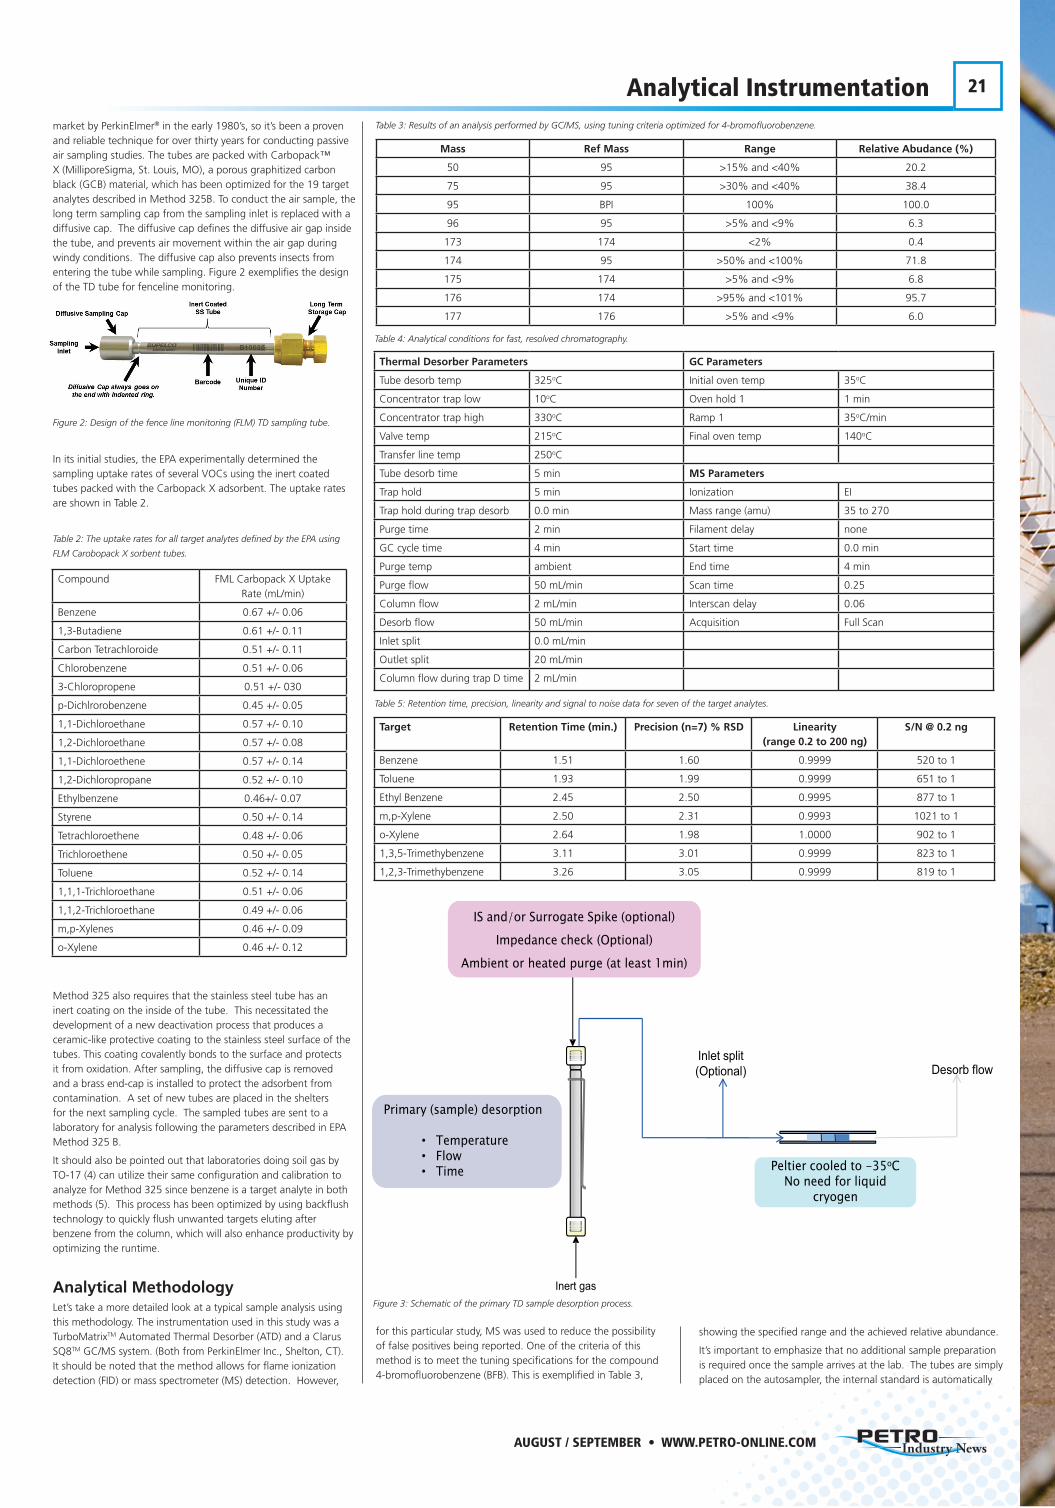
Analytical Instrumentationmarket by PerkinElmer® in the early 1980’s, so it’s been a proven and reliable technique for over thirty years for conducting passive air sampling studies. The tubes are packed with Carbopack™ X (MilliporeSigma, St. Louis, MO), a porous graphitized carbon black (GCB) material, which has been optimized for the 19 target analytes described in Method 325B. To conduct the air sample, the long term sampling cap from the sampling inlet is replaced with a diffusive cap. The diffusive cap defines the diffusive air gap inside the tube, and prevents air movement within the air gap during windy conditions. The diffusive cap also prevents insects from entering the tube while sampling. Figure 2 exemplifies the design of the TD tube for fenceline monitoring.
Figure 2: Design of the fence line monitoring (FLM) TD sampling tube.
In its initial studies, the EPA experimentally determined the sampling uptake rates of several VOCs using the inert coated tubes packed with the Carbopack X adsorbent. The uptake rates are shown in Table 2.
Table 2: The uptake rates for all target analytes defined by the EPA using
FLM Carobopack X sorbent tubes.
Method 325 also requires that the stainless steel tube has an inert coating on the inside of the tube. This necessitated the development of a new deactivation process that produces a ceramic-like protective coating to the stainless steel surface of the tubes. This coating covalently bonds to the surface and protects it from oxidation. After sampling, the diffusive cap is removed and a brass end-cap is installed to protect the adsorbent from contamination. A set of new tubes are placed in the shelters for the next sampling cycle. The sampled tubes are sent to a laboratory for analysis following the parameters described in EPA Method 325 B.
It should also be pointed out that laboratories doing soil gas by TO-17 (4) can utilize their same configuration and calibration to analyze for Method 325 since benzene is a target analyte in both methods (5). This process has been optimized by using backflush technology to quickly flush unwanted targets eluting after benzene from the column, which will also enhance productivity by optimizing the runtime.
Analytical MethodologyLet’s take a more detailed look at a typical sample analysis using this methodology. The instrumentation used in this study was a TurboMatrixTM Automated Thermal Desorber (ATD) and a Clarus SQ8TM GC/MS system. (Both from PerkinElmer Inc., Shelton, CT). It should be noted that the method allows for flame ionization detection (FID) or mass spectrometer (MS) detection. However,
for this particular study, MS was used to reduce the possibility of false positives being reported. One of the criteria of this method is to meet the tuning specifications for the compound 4-bromofluorobenzene (BFB). This is exemplified in Table 3,
showing the specified range and the achieved relative abundance.
It’s important to emphasize that no additional sample preparation is required once the sample arrives at the lab. The tubes are simply placed on the autosampler, the internal standard is automatically
Thermal Desorber Parameters GC Parameters
Tube desorb temp 325oC Initial oven temp 35oC
Concentrator trap low 10oC Oven hold 1 1 min
Concentrator trap high 330oC Ramp 1 35oC/min
Valve temp 215oC Final oven temp 140oC
Transfer line temp 250oC
Tube desorb time 5 min MS Parameters
Trap hold 5 min Ionization EI
Trap hold during trap desorb 0.0 min Mass range (amu) 35 to 270
Purge time 2 min Filament delay none
GC cycle time 4 min Start time 0.0 min
Purge temp ambient End time 4 min
Purge flow 50 mL/min Scan time 0.25
Column flow 2 mL/min Interscan delay 0.06
Desorb flow 50 mL/min Acquisition Full Scan
Inlet split 0.0 mL/min
Outlet split 20 mL/min
Column flow during trap D time 2 mL/min
Compound FML Carbopack X Uptake Rate (mL/min)
Benzene 0.67 +/- 0.06
1,3-Butadiene 0.61 +/- 0.11
Carbon Tetrachloroide 0.51 +/- 0.11
Chlorobenzene 0.51 +/- 0.06
3-Chloropropene 0.51 +/- 030
p-Dichlrorobenzene 0.45 +/- 0.05
1,1-Dichloroethane 0.57 +/- 0.10
1,2-Dichloroethane 0.57 +/- 0.08
1,1-Dichloroethene 0.57 +/- 0.14
1,2-Dichloropropane 0.52 +/- 0.10
Ethylbenzene 0.46+/- 0.07
Styrene 0.50 +/- 0.14
Tetrachloroethene 0.48 +/- 0.06
Trichloroethene 0.50 +/- 0.05
Toluene 0.52 +/- 0.14
1,1,1-Trichloroethane 0.51 +/- 0.06
1,1,2-Trichloroethane 0.49 +/- 0.06
m,p-Xylenes 0.46 +/- 0.09
o-Xylene 0.46 +/- 0.12
Mass Ref Mass Range Relative Abudance (%)
50 95 >15% and <40% 20.2
75 95 >30% and <40% 38.4
95 BPI 100% 100.0
96 95 >5% and <9% 6.3
173 174 <2% 0.4
174 95 >50% and <100% 71.8
175 174 >5% and <9% 6.8
176 174 >95% and <101% 95.7
177 176 >5% and <9% 6.0
Target Retention Time (min.) Precision (n=7) % RSD Linearity (range 0.2 to 200 ng)
S/N @ 0.2 ng
Benzene 1.51 1.60 0.9999 520 to 1
Toluene 1.93 1.99 0.9999 651 to 1
Ethyl Benzene 2.45 2.50 0.9995 877 to 1
m,p-Xylene 2.50 2.31 0.9993 1021 to 1
o-Xylene 2.64 1.98 1.0000 902 to 1
1,3,5-Trimethybenzene 3.11 3.01 0.9999 823 to 1
1,2,3-Trimethybenzene 3.26 3.05 0.9999 819 to 1
Table 3: Results of an analysis performed by GC/MS, using tuning criteria optimized for 4-bromofluorobenzene.
Table 4: Analytical conditions for fast, resolved chromatography.
Table 5: Retention time, precision, linearity and signal to noise data for seven of the target analytes.
Inlet split (Optional) Desorb flow
Inert gas
Peltier cooled to -35oCNo need for liquid
cryogen
IS and/or Surrogate Spike (optional)
Impedance check (Optional)
Ambient or heated purge (at least 1min)
Primary (sample) desorption
• Temperature• Flow• Time
Figure 3: Schematic of the primary TD sample desorption process.
22 Analytical Instrumentation
AUGUST / SEPTEMBER • WWW.PETRO-ONLINE.COM
spiked and the tubes analyzed. After starting the thermal desorber, the instrument automates the process of desorbing the analytes from the tube onto a Peltier cooled trap and injecting the sample into the analytical column for detection and analysis by GC/MS. No further intervention by the operator is required. The serial number from a barcode on the tube can be scanned directly into the chromatographic sequence software, which allows for rapid data entry and reduces transcription errors. A schematic of the primary sample desorption process is shown in Figure 3, while the secondary desorption from the trap is exemplified in Figure 4.
Before we describe the operating conditions used for this study, it should be pointed out that sampling tubes are reusable. The method states the tubes need to repacked or replaced at least every 2 years or 50 analytical runs, whichever comes first. We have found that the most efficient way to re-condition tubes is
by using an off-line tube conditioner according to the following procedure:
•Conditioningtemperatureof350°Corbelow.
•UsehighpurityN2
•Gasflow(50-100mL/min)shouldenterthroughthebackofthetube and exist through the sample inlet.
•Maintainthegasflowuntilthetubescoolstoambient.
•Re-conditioningtimeistypically15minutesto2hours,depending on use.
So the objective of this study was to optimize sample throughput and instrument uptime by using fast, resolved chromatography with the capability of using the same column and trap for both volatile and semi-volatile analysis to address the changing needs
of a laboratory to analyze a diverse range of samples types.
Operating ConditionsBased on the sample throughput requirements described, the TD, GC and MS conditions for this study were optimized and shown in Table 4.
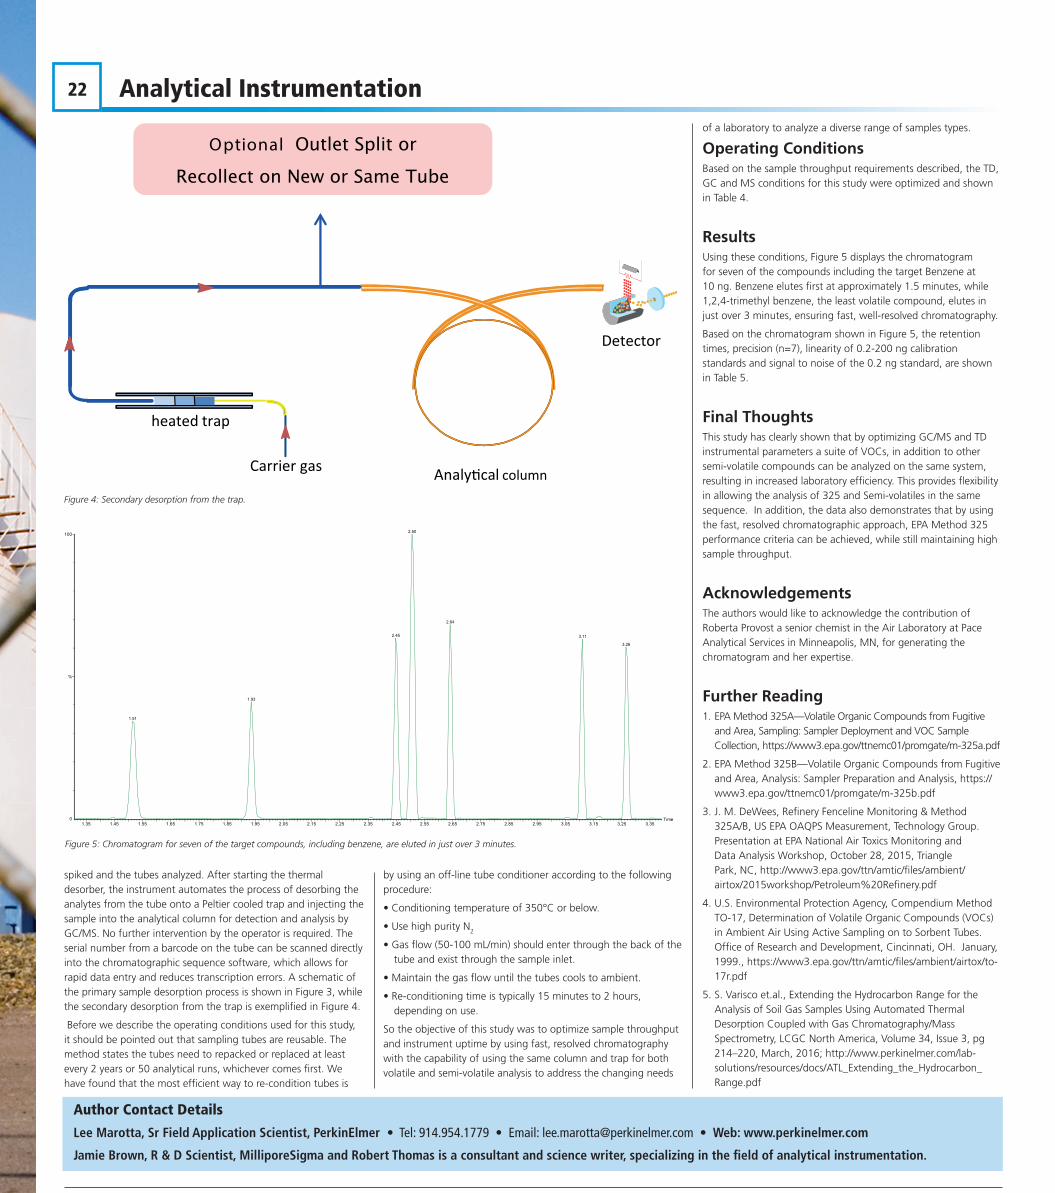
ResultsUsing these conditions, Figure 5 displays the chromatogram for seven of the compounds including the target Benzene at 10 ng. Benzene elutes first at approximately 1.5 minutes, while 1,2,4-trimethyl benzene, the least volatile compound, elutes in just over 3 minutes, ensuring fast, well-resolved chromatography.
Based on the chromatogram shown in Figure 5, the retention times, precision (n=7), linearity of 0.2-200 ng calibration standards and signal to noise of the 0.2 ng standard, are shown in Table 5.
Final ThoughtsThis study has clearly shown that by optimizing GC/MS and TD instrumental parameters a suite of VOCs, in addition to other semi-volatile compounds can be analyzed on the same system, resulting in increased laboratory efficiency. This provides flexibility in allowing the analysis of 325 and Semi-volatiles in the same sequence. In addition, the data also demonstrates that by using the fast, resolved chromatographic approach, EPA Method 325 performance criteria can be achieved, while still maintaining high sample throughput.
AcknowledgementsThe authors would like to acknowledge the contribution of Roberta Provost a senior chemist in the Air Laboratory at Pace Analytical Services in Minneapolis, MN, for generating the chromatogram and her expertise.
Further Reading1. EPA Method 325A—Volatile Organic Compounds from Fugitive
and Area, Sampling: Sampler Deployment and VOC Sample Collection, https://www3.epa.gov/ttnemc01/promgate/m-325a.pdf
2. EPA Method 325B—Volatile Organic Compounds from Fugitive and Area, Analysis: Sampler Preparation and Analysis, https://www3.epa.gov/ttnemc01/promgate/m-325b.pdf
3. J. M. DeWees, Refinery Fenceline Monitoring & Method 325A/B, US EPA OAQPS Measurement, Technology Group. Presentation at EPA National Air Toxics Monitoring and Data Analysis Workshop, October 28, 2015, Triangle Park, NC, http://www3.epa.gov/ttn/amtic/files/ambient/airtox/2015workshop/Petroleum%20Refinery.pdf
4. U.S. Environmental Protection Agency, Compendium Method TO-17, Determination of Volatile Organic Compounds (VOCs) in Ambient Air Using Active Sampling on to Sorbent Tubes. Office of Research and Development, Cincinnati, OH. January, 1999., https://www3.epa.gov/ttn/amtic/files/ambient/airtox/to-17r.pdf
5. S. Varisco et.al., Extending the Hydrocarbon Range for the Analysis of Soil Gas Samples Using Automated Thermal Desorption Coupled with Gas Chromatography/Mass Spectrometry, LCGC North America, Volume 34, Issue 3, pg 214–220, March, 2016; http://www.perkinelmer.com/lab-solutions/resources/docs/ATL_Extending_the_Hydrocarbon_Range.pdf
Carrier gas Analy�cal column
heated trap
Detector
Optional Outlet Split or
Recollect on New or Same Tube
1.35 1.45 1.55 1.65 1.75 1.85 1.95 2.05 2.15 2.25 2.35 2.45 2.55 2.65 2.75 2.85 2.95 3.05 3.15 3.25 3.35Time0
100
%
2.50
2.45
1.93
1.51
2.64
3.11
3.26
Figure 4: Secondary desorption from the trap.
Figure 5: Chromatogram for seven of the target compounds, including benzene, are eluted in just over 3 minutes.
Permeation Tubes for Light HydrocarbonsThe Kin-Tek (USA) Trace Source 57 Series refillable permeation tubes extend the range of analyte compounds to include light hydrocarbons and other gases with vapour pressures too high for conventional permeation tubes. The 57 Series tubes are used in the Kin-Tek FlexStream calibration gas generator to produce ppm and ppb mixtures directly from pure gases.
Typically permeation tubes contain a liquefied analyte under its vapour pressure at the operating temperature of the permeation tube. This limits the range of compounds available in permeation tubes. 57 Series tubes use only the gas phase of the compound. Controlling the pressure in the tube allows high vapour pressure compounds such as methane, ethane, or ethylene to be dispensed by permeation. Emission rate is proportional to the compound pressure in the tube. For very low emission rates the compound can be sealed in the tube. For higher emission rates tubes should be used with the FlexStream GF Module to allow for compound pressure control and periodic purge and refill.
Mixtures can also be diluted if the tube is certified for each gas in the mixture. Single step dilution ratios of 1000:1 to over 50,000,000:1 can be attained allowing ppb mixtures to be made directly from the pure analyte compound.
[email protected] More Info, email:
email:
For More Info, email:
email:
Author Contact Details
Lee Marotta, Sr Field Application Scientist, PerkinElmer • Tel: 914.954.1779 • Email: [email protected] • Web: www.perkinelmer.com
Jamie Brown, R & D Scientist, MilliporeSigma and Robert Thomas is a consultant and science writer, specializing in the field of analytical instrumentation.