Embed Size (px)
Citation preview

Journal of Research in Engineering and Applied Sciences
JREAS, Vol. 04, Issue 01, Jan 201931
OPTIMIZATION OF GATING SYSTEM PARAMETERS OFCI CONVEYOR BRACKET USING TAGUCHI ANDCOMPUTER AIDED SIMULATION TECHNIQUES
1 2 3PG Student , Assistant Professor , Associate Professor Department of Mechanical Engineering,
Yeshwantrao Chavan College of Engineering, Nagpur, India.1Email:{ [email protected]}
Abstract
In sand casting method, process of making casting depends upon various factors like mould, gating system, type of metal etc.For a sound casting, it is required to optimize the casting parameters for a given geometry of casting, to remove the defects and improve the quality in casted products.In this paper Taguchi technique along with design of experiments method (DOE) and Computer Aided Casting Simulation Technique are combined for optimization of gating system parameters of a CI Conveyor Bracket to improve the Product Yield (PY) and Hardness (HRD) of the casting.The gating system related parameters considered are, Runner Upper Diameter (mm), Runner Lower Diameter (mm), Runner Height (mm), Ingate Height (mm), Pouring Time (sec). In the First half part of the work, Taguchi based L18 Orthogonal Array was generated for experimental purpose and analysis of result was done using S/N ratio, Minitab 17 Software and Analysis of Variance (ANOVA) to analyze effect of gating system parameters on Product Yield and Hardness. In the second half part of work, AutoCast simulation software was used for validation of the result. Parameters are also validated by implementing it in foundry.
Key Words :
1. Introduction
As looking towards history traditional casting process is running since 6000 years long and is a basis of the entire mechanical industry. However, it still faces various problems such as difficulty in quality improvement, less production rate, to improve energy efficiency, to reduce material consumption and the question of environmental protection; one of the reasons behind it is complex casting process and lack of theoretical guidance (C.M. Choudhari et al., 2014). Sand casting is one of the most simplest type of casting process and highly used for centuries since it accounts for largest tonnage of production of different types of castings and because of its economical facts and flexibility in production (Manikanda Prasath K. et al., 2014). Casting process has many quality affecting casting process parameters some of which are controllable and some are noise factors. Therefore Taguchi Technique is the good choice for quality improvement in castings. Taguchi's contributions have made the practitioner's work simpler by advocating use of very less number of experimental designs and providing clear understanding of variation nature and economic consequences of quality engineering in the manufacturing sector (S. Guharaja et al., 2006). Dr. Taguchi has introduced several new statistical concepts in the field of quality improvement which have proven to be estimable. Many Japanese manufacturers have improved their product and process quality with a great success. Taguchi has calculate on W.E. Deming's observation that only 15% to the worker and more i.e. 85% of the poor quality is attribute to the
1 2 3Devendra Pandit, S. R. Jachak and S. L. Banker
ISSN (Print) : 2456-6411, ISSN (Online) : 2456-6403
manufacturing process, out of which again many researchers has reported that 90% of the defects are due to incorrect design of Gating and risering system.
1.1 Process parameters of Green Sand castings
The process parameters can be listed in five categories as follows:
1. Mould-machine-related parameters
2. Cast-metal-related parameters
3. Green-sand-related parameters
4. Mould-related parameters
5. Shake-out-related parameters
An Ishikawa diagram (cause and effect diagram) was constructed as shown in Fig. 1to identify the casting process parameters that may influence green sand casting defects (S. Guharaja et al. 2006).
Fig. 1 : Cause and effect diagram

JREAS, Vol. 04, Issue 01, Jan 201932ISSN (Print) : 2456-6411, ISSN (Online) : 2456-6403
2. Literature Review
Presently various research work and experiments has been done on several distinct casting parameters for all casting methods. In sand casting the process parameters are classified in following categories as: 1. Machine related parameters 2. Metal related parameters 3. Sand realetd parameters 4. Mould related parameters 5. Shake-out related parameters, etc. Most percentage of defects are improved by optimizing sand and gating system related parameters.
Zhizhong Sun et al. (2008)optimized the gating system parameters of cylindrical magnesium casting in iron foundry by maximizing signal to noise ratios and minimizing the noise factors using Taguchi method with multiple performance characteristics. They have selected four gating system parameters, namely ingate height, ingate width, runner height, runner width for optimization with consideration of multiple performance characteristics including filling velocity, shrinkage porosity and product yield.Although the product yield has decreased by 1.57%, the shrinkage porosity is decreased by 56.57% and the filling velocity is decreased by 58.05% and finally it is concluded that the multiple performance characteristics such as product yield, shrinkage porosity and filling velocity can be simultaneously considered and improved through this optimization technique.Uday A. Dabhade et al. (2013) applied Taguchi method to optimize the green sand casting parameters as Moisture content (%), green compression strength (gm/cm²), Permeability Number, Mould Hardness Number for improvement of casting quality by reducing casting defects like sand drop, bad mould, blow holes, cuts and washes for reducing % rejection in casting products.
Also, for reducing Methoding, Filling, and solidification defects such as shrinkage porosity, hot tears etc, Computer Aided casting simulation technique is used. Experimental result obtained using optimized parameters as; % rejection in castings due to sand related defects is reduced from 10% to a maximum up to 3.59%. Also concluded that; shrinkage porosity defect, quality and yield of casting can be efficiently improved by Computer assisted casting simulation technique in shortest possible time and without doing actual trials in foundry shop. C. M. Choudhary et al.(2014)discussed about the simulation method of sand casting design using AutoCast-X software for minimizing the casting defects to improve its quality. They mentioned that various casting defects occur because of improper design of feeding system. Hence instead of going for direct experimental way, the attempt is made to compute an optimum feeding system using simulation software. S. Guharaja et al. (2006) applied Taguchi method to optimize the process parameters of green sand casting. First of all the cause and effect diagram was constructed to identify the process parameters that may influence green sand casting defects. the most significant parameters with their optimized
values are found to be moisture content (2.6%), Green sand strength (950gm/cm²), permeability number (235), and mould hardness number (80). These optimized values were used in final experimentation and gave result as, improvement in casting yield and reduction in castng defect from 25% to a maximum of 3.25%. Manikanda Prasath K. et al. (2014) reduced the sand related casting defects and improved the effective yield of casting by optimizing the green sand process parameters using Taguchi method and by using Solid cast simulation Software for simulating gating system. The optimum conditions for the control factors of casting process parameters found to be moisture content (4.5%), Green sand strength (1300gm/cm²), permeability number (200), and mould hardness number (75), Pouring temperature (1400 °C), Sand particle size number (AFS) (53). As a result of optimization they have got reduction in casting defects i.e. from 8.10% to 2.71% and effective yield are improved to 64.30% from 58.5%.Dr. B. Ravi (1999)has discussed how computer system has brought revolution in manufacturing sector. A scene of Past-present-future of computer-Aided system is described in this paper and has shown that how this system helped industries to directly improve the profit of production by reducing lead time and cost of production. He has generated software named AutoCAST which has became a fine tool for casting industry. So instead of going to do shop floor experiments in making First Article Approval, the software found to be very helpful in generating step by step casting process and gives final result in which we can find out whether defects will be present or not and after final result we can apply it in shop floor. In this way the software was found to be very helpful in saving time, cost, material wastage, etc.
From all these literatures, Taguchi method is found to be the best method for optimization of parameters.
3. Experimental Work
3.1 Research Methodology
This research work is done at a small scale Industry where the methodology of work done is shown briefly in figure 3.1.
Examine the casting process at Deepshikha Industry
To study the gating system at Deepshikha Industry
Process optimization and modification of casting parameters
Process analyze by using Design of Experiments
Experimentation
Validation of Conveyor Bracket using AutoCAST software
Performing actual casting to get the optimized values
Result of Optimization
Conclusion
Fig. 2 : Flow chart of research methodology
JREAS, Vol. 04, Issue 01, Jan 201933ISSN (Print) : 2456-6411, ISSN (Online) : 2456-6403
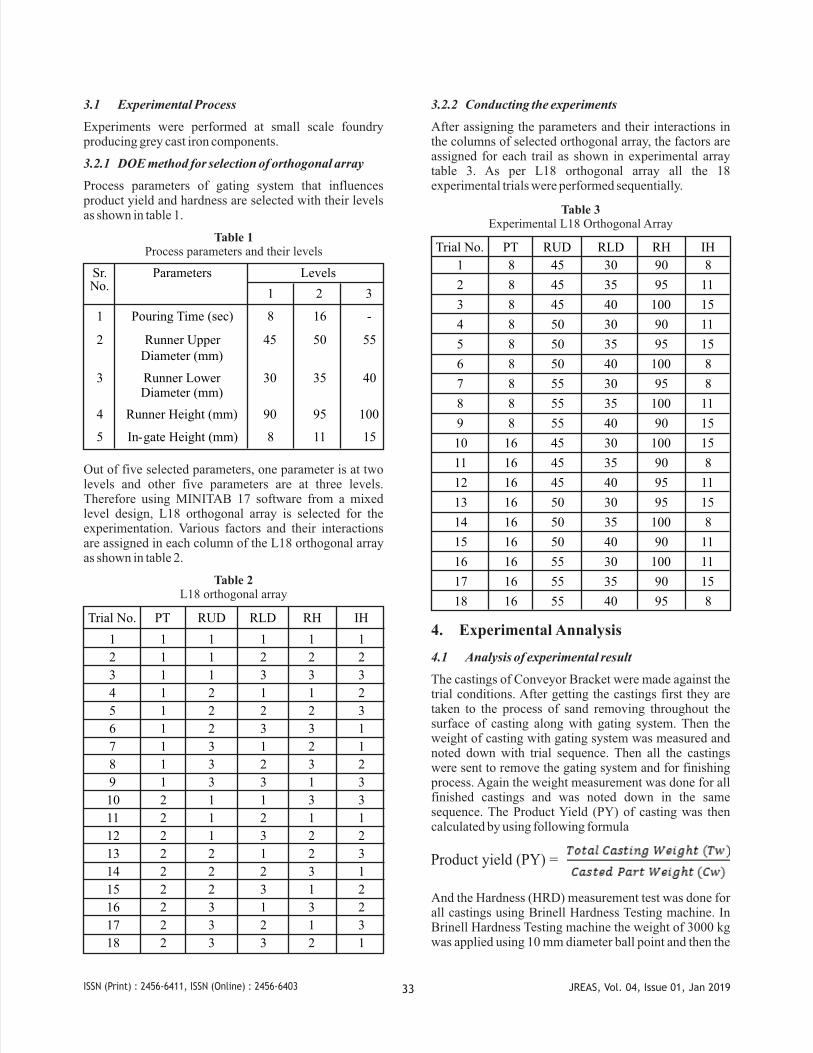
3.1 Experimental Process
Experiments were performed at small scale foundry producing grey cast iron components.
3.2.1 DOE method for selection of orthogonal array
Process parameters of gating system that influences product yield and hardness are selected with their levels as shown in table 1.
Table 1Process parameters and their levels
Sr. No.
Parameters Levels
1
2
3
1 Pouring Time (sec) 8 16 -
2 Runner Upper Diameter (mm)
45 50 55
3 Runner Lower Diameter (mm)
30 35 40
4 Runner Height (mm) 90 95 100
5 In-gate Height (mm) 8 11 15
Out of five selected parameters, one parameter is at two levels and other five parameters are at three levels. Therefore using MINITAB 17 software from a mixed level design, L18 orthogonal array is selected for the experimentation. Various factors and their interactions are assigned in each column of the L18 orthogonal array as shown in table 2.
Table 2L18 orthogonal array
Trial No. PT RUD RLD RH IH
1 1 1 1 1 1
2 1 1 2 2 2
3 1 1 3 3 3
4 1 2 1 1 2
5 1 2 2 2 3
6 1 2 3 3 1
7 1 3 1 2 1 8 1 3 2 3 2
9 1 3 3 1 3
10 2 1 1 3 3
11 2 1 2 1 1
12 2 1 3 2 2
13 2 2 1 2 3
14 2 2 2 3 1 15 2 2 3 1 2
16 2 3 1 3 2
17 2 3 2 1 3 18 2 3 3 2 1
3.2.2 Conducting the experiments
After assigning the parameters and their interactions in the columns of selected orthogonal array, the factors are assigned for each trail as shown in experimental array table 3. As per L18 orthogonal array all the 18 experimental trials were performed sequentially.
Table 3Experimental L18 Orthogonal Array
Trial No. PT RUD RLD RH IH
1 8 45 30 90 8
2 8 45 35 95 11
3 8 45 40 100 15
4 8 50 30 90 11
5 8 50 35 95 15
6 8 50 40 100 8
7 8 55 30 95 8 8 8 55 35 100 11
9 8 55 40 90 15
10 16 45 30 100 15
11 16 45 35 90 8
12 16 45 40 95 11
13 16 50 30 95 15
14 16 50 35 100 8
15 16 50 40 90 11
16 16 55 30 100 11
17 16 55 35 90 15
18 16 55 40 95 8
4. Experimental Annalysis
4.1 Analysis of experimental result
The castings of Conveyor Bracket were made against the trial conditions. After getting the castings first they are taken to the process of sand removing throughout the surface of casting along with gating system. Then the weight of casting with gating system was measured and noted down with trial sequence. Then all the castings were sent to remove the gating system and for finishing process. Again the weight measurement was done for all finished castings and was noted down in the same sequence. The Product Yield (PY) of casting was then calculated by using following formula
Product yield (PY) =
And the Hardness (HRD) measurement test was done for all castings using Brinell Hardness Testing machine. In Brinell Hardness Testing machine the weight of 3000 kg was applied using 10 mm diameter ball point and then the
JREAS, Vol. 04, Issue 01, Jan 201934ISSN (Print) : 2456-6411, ISSN (Online) : 2456-6403
diameter of circular impression generated on casting was measured using microscope. Then from the BHN chart hardness number for respective diameter was found out.
The values of product yield and hardness for respective trials are recorded in table 4.
Table 4Product Yield and Hardness Values
Trial No.
PT RUD RLD RH IH PY(%)
HRD(BHN)
1 8 45 30 90 8 90.32 217
2 8 45 35 95 11 87.71 207
3 8 45 40 100 15 85.71 187
4 8 50 30 90 11 88.52 197
5 8 50 35 95 15 87.71 178
6 8 50 40 100 8 85.25 178
7 8 55 30 95 8 87.09 207
8 8 55 35 100 11 85.25 169
9 8 55 40 90 15 84.84 170
10 16 45 30 100 15 84.37 177
11 16 45 35 90 8 87.71 197
12 16 45 40 95 11 85.25 178
13 16 50 30 95 15 84.84 178
14 16 50 35 100 8 83.58 185
15 16 50 40 90 11 83.07 175
16 16 55 30 100 11 83.87 170
17 16 55 35 90 15 83.07 169
18 16 55 40 95 8 84.37 163
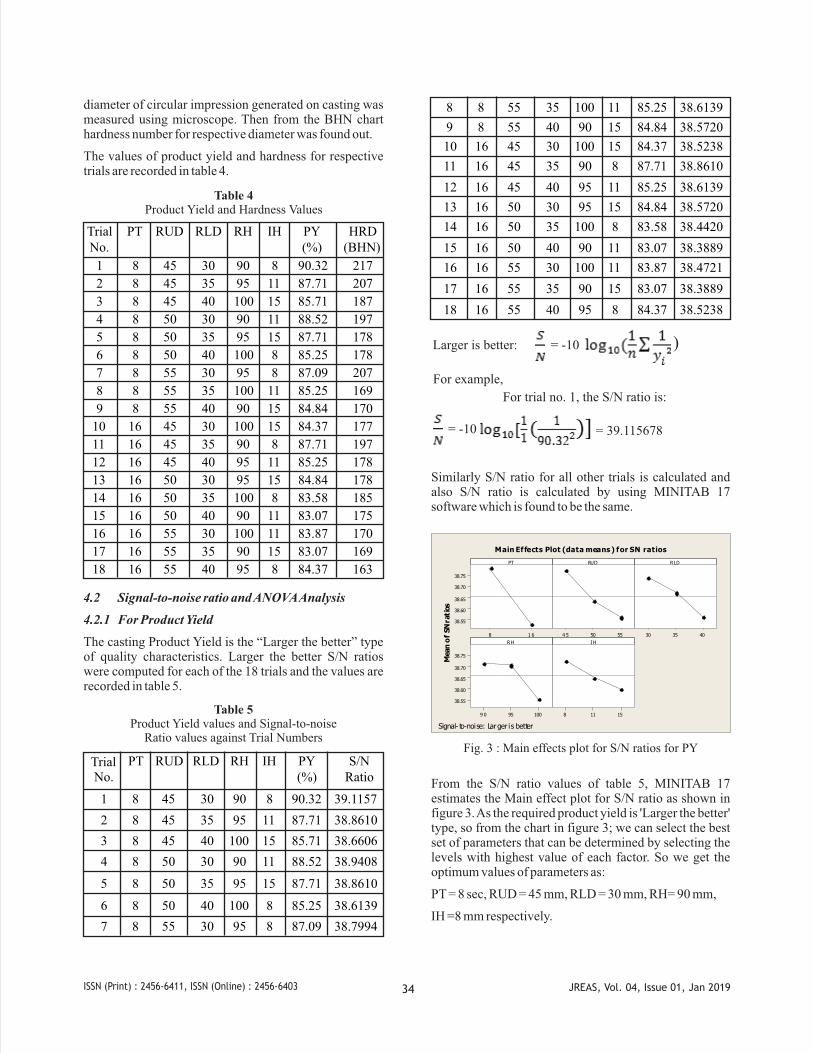
4.2 Signal-to-noise ratio and ANOVA Analysis
4.2.1 For Product Yield
The casting Product Yield is the “Larger the better” type of quality characteristics. Larger the better S/N ratios were computed for each of the 18 trials and the values are recorded in table 5.
Table 5Product Yield values and Signal-to-noise
Ratio values against Trial Numbers
No.PT RUD RLD RH IH PY
(%)S/N
Ratio
1 8 45 30 90 8 90.32 39.1157
2 8 45 35 95 11 87.71 38.8610
3 8 45 40 100 15 85.71 38.6606
4 8 50 30 90 11 88.52 38.9408
5 8 50 35 95 15 87.71 38.8610
6 8 50 40 100 8 85.25 38.6139
7 8 55 30 95 8 87.09 38.7994
Trial
8 8 55 35 100 11 85.25 38.6139
9 8 55 40 90 15 84.84 38.5720
10 16 45 30 100 15 84.37 38.5238
11 16 45 35 90 8 87.71 38.8610
12 16 45 40 95 11 85.25 38.6139
13 16 50 30 95 15 84.84 38.5720
14 16 50 35 100 8 83.58 38.4420
15 16 50 40 90 11 83.07 38.3889
16 16 55 30 100 11 83.87 38.4721
17 16 55 35 90 15 83.07 38.3889
18 16 55 40 95 8 84.37 38.5238
Larger is better: = -10 )
For example,
For trial no. 1, the S/N ratio is:
= -10 = 39.115678
Similarly S/N ratio for all other trials is calculated and also S/N ratio is calculated by using MINITAB 17 software which is found to be the same.
Mean
of
SN
ratio
s
1 68
38.75
38.70
38.65
38.60
38.55
55504 5 403530
100959 0
38.75
38.70
38.65
38.60
38.55
15118
PT RUD RLD
RH IH
Main Effects Plot (data means ) for SN ratios
Signal- to-noise: Larger is better
Fig. 3 : Main effects plot for S/N ratios for PY
From the S/N ratio values of table 5, MINITAB 17 estimates the Main effect plot for S/N ratio as shown in figure 3. As the required product yield is 'Larger the better' type, so from the chart in figure 3; we can select the best set of parameters that can be determined by selecting the levels with highest value of each factor. So we get the optimum values of parameters as:
PT = 8 sec, RUD = 45 mm, RLD = 30 mm, RH= 90 mm,
IH =8 mm respectively.

JREAS, Vol. 04, Issue 01, Jan 201935ISSN (Print) : 2456-6411, ISSN (Online) : 2456-6403
Table 6ANOVA for Product Yield at 95% confidence limit
Parameter DoF SS Variance F-
ratio
P-
value
PT 1 0.28173 0.28173 39.48 0.000
RUD 2 0.1373 0.1373 9.62 0.007
RLD 2 0.0939 0.0939 6.58 0.020
RH 2 0.0947 0.0947 6.64 0.020
IH 2 0.0510 0.0510 3.57 0.078
Error 8 0.05709 0.05709
Total 17 0.71573
S = 0.08448 R-Sq = 92.0% R-Sq(adj) = 83.0%
Rank: 1 = PT, 2 = RUD, 3 = RLD, 4 = RH, 5 = IH
ANOVA in table 6 indicates that Pouring temperature has most impact on Product Yield followed by Runner Upper Diameter, Runner Lower Diameter and Runner Height. But Ingate Height does not influence much.
4.2.2 For Hardness
Similarly as S/N analysis of Product Yield done above, the casting Hardness is the “Larger the better” type of quality characteristics. Larger the better S/N ratios were computed for each of the 18 trials and the values are recorded in table 7.
Table 7 Hardness values and Signal-to-noise Ratio values against
Trial Numbers
Trial No.
PT RUD RLD RH IH HRD S/N Ratio
1 8 45 30 90 8 217 46.7292
2 8 45 35 95 11 207 46.3194
3 8 45 40 100 15 187 45.4368
4 8 50 30 90 11 197 45.8893
5 8 50 35 95 15 178 45.0084
6 8 50 40 100 8 178 45.0084
7 8 55 30 95 8 207 46.3194
8 8 55 35 100 11 169 44.5577
9 8 55 40 90 15 170 44.6090
10 16 45 30 100 15 177 44.9595
11 16 45 35 90 8 197 45.8893
12 16 45 40 95 11 178 45.0084
13 16 50 30 95 15 178 45.0084
14 16 50 35 100 8 185 45.3434
15 16 50 40 90 11 175 44.8608
16 16 55 30 100 11 170 44.6090
17 16 55 35 90 15 169 44.5577
18 16 55 40 95 8 163 44.2438
Larger is better:
= -10
)
For example,
For trial no. 1, the S/N ratio is:
= -10
= 46.729194)
Similarly S/N ratio for all other trials is calculated and also S/N ratio is calculated by using MINITAB 17 software which is found to be the same.
From the S/N ratio values of table 7, MINITAB 17 estimates the Main effect plot for S/N ratio as shown in figure 3. As the required product yield is 'Larger the better' type, so from the chart in figure 3; we can select the best set of parameters that can be determined by selecting the levels with highest value of each factor. So we get the optimum values of parameters as:
PT = 8 sec, RUD = 45 mm, RLD = 30 mm, RH= 90 mm,
IH = 8 mm respectively.M
ean
of
SN
ratio
s
168
45 .6
45 .4
45 .2
45 .0
44 .8
555045 403530
1009 590
45 .6
45 .4
45 .2
45 .0
44 .8
15118
P OURING
TIME RUNNER UPP E R
DIAME TE R RUNNER
LOW ER
DIAME TE R
RUNNE R HEIGHT INGATE HE IGHT
Main
Effects
Plot (data
means )
for
SN
ratios
Signal- to-noise:
Larger
i s
better
Fig. 4 : Main effects plot for S/N ratios for HRD
Table 8ANOVA for Hardness at 95% confidence limit
Parameter DoF SS Variance F-ratio P-value
PT 1 1.6185 1.6185 13.57 0.006
RUD 2 2.4995 2.4995 10.48 0.006
RLD 2 1.5876 1.5876 6.65 0.020
RH 2 0.6240 0.6240 2.62 0.134
IH 2 1.3135 1.3135 5.50 0.031
Error 8 0.9544 0.9544
Total 17 8.5975
S = 0.3454 R-Sq = 88.9% R-Sq(adj) = 76.4%
Rank: 1 = RUD, 2 = RLD, 3 = IH, 4 = PT, 5 = RH

JREAS, Vol. 04, Issue 01, Jan 201936ISSN (Print) : 2456-6411, ISSN (Online) : 2456-6403
ANOVA in table 8 indicates that Runner Upper Diameter has most impact on Hardness followed by Runner Lower Diameter, Ingate Height and Pouring Temperature. But Runner Height does not influence much.
4.3. Validation by Autocast Software
AutoCAST-X software is a fine tool for casting industry in which simulation of casting product can be done; which in result gives the report of Casting Yield, optimized value of gating system and the quality affecting defects like shrinkage porosity, blow holes formation, cold shut, Hard zone etc.
A solid model in STL format is imported in AutoCAST software. All the values of process parameters are entered in initial stage. Then gating system is designed by giving the dimensional input as the optimum values we get by experimentation i.e. PT = 8 sec, RUD = 45 mm, RLD = 30 mm, RH = 90 mm, IH = 8 mm. By feeding these values the casting model with gating system gets generated as shown in figure 5.
Fig. 5 : Gating system generated in AutoCAST software
The next stage of software work is, it checks the gating system for its effectiveness in complete filling of mould cavity. And which is done in this case as can be seen in red colored view of a completely filled model in figure 6.
Fig. 6 : Mould filling Process in AutoCAST software
After confirmation of mould filling process, simulation work starts. It is divided in two levels as: Simulation 'Till the End of complete filling' and 'Till the end of solidification'. Both the processes are shown in following figure 7.
Fig. 7 : Simulation process of mould completefilling and solidification in AutoCAST software
After completion of simulation process, software generates simulation report. From this report we get that, Product Yield value is found to be 90.91% and which is very near to the experimental value of 90.32% we get. So we can say that our optimal value of all parameters is valid. Report of software is shown in figure 8.
Fig. 8 : Simulation report of AutoCAST software
5. Result and Discussion
Experiment was carried out to increase Product Yield and Hardness of CI Conveyor Bracket at industry. Optimization of Product Yield and Hardness was done by using Taguchi technique and by the analysis we get the value as 90.32% and 217 BHN respectively. From the Taguchi analysis optimal values of parameters for both Product Yield and Hardness are tabulated in table 9.

JREAS, Vol. 04, Issue 01, Jan 201937ISSN (Print) : 2456-6411, ISSN (Online) : 2456-6403
Table 9Optimal values of parameters for Product Yield and
Hardness improvement
Sr. No. Parameters Optimal Values
1 Pouring Time 8 sec
2 Runner Upper Diameter 45 mm
3 Runner Lower Diameter 30 mm
4 Runner Height 90 mm
5 Ingate Height 8 mm
Also the simulation report of AutoCAST software gives the value of Product Yield to be 90.91% which is very close to the experimental value of 90.32%. Hence the optimal values are validated.
6. Conclusion
§ A methodology for optimization of Gating design for sand casting process to maximize the Product Yield and Hardness for Conveyor Bracket has been described in this paper.
§ The optimized levels of selected gating system parameters obtained by Taguchi method are: Pouring Time = 8 sec, Runner Upper Diameter = 45 mm, Runner Lower Diameter = 30 mm, Runner Height = 90 mm and Ingate Height = 8 mm.
§ With Taguchi optimization method and experimental analysis we can conclude that for the Product yield to be more than 90% and Hardness to be more than 175 BHN can be obtained.
§ Computer aided casting simulation technique is found to be the most effective and accurate tool to design the gating system and to find out the quality and yield of casting in very less time, without doing actual trials in foundry.
References
[1] C. M. Choudhari, B. E. Narkhede, S. K. Mahajan, “Casting Design and Simulation of Cover Plate using AutoCast-X Software for Defect Minimization with Experimental Validation”,Procedia Material Science, 6 (2014) 786-797.
[2] Uday A. Dabade and Rahul C. Bhedasgaonkar, “Casting Defect Analysis using Design of Experiments (DoE) and Computer Aided Casting Simulation Technique”, Forty Sixth CIRP Conference on Manufacturing Syatem 2013.
[3] Zhizhong Sun, Henry Hu, Xiang Chen, “Numerical optimization of gating system parameters for a magnesium alloy casting with multiple performance characteristics”, Journal of Materials Processing Technology 199 (2008) 256-264.
[4] S. Guharaja, A. Noorul Haq, K. M. Karuppannan, “Optimization of green sand casting process parameters by using Taguchi's method”, International Journal of Advance Manufacturing Technology (2006) 30: 1040-1048 DOI 10.1007/s00170-005-0146-2.
[5] Manikanda Prasath K., Madesh R., Birundha P., Pranav R., “Effective Yield Improvement of Casting using
Taguchi Technique and Computer Aided Casting Simulation Technique”, Proceedings of Second International Conference on Advances in Industrial Engineering Applications, (ICAIEA 2014).
[6] N. W. Rasmussen, R. Aagaard, P. N. Hansen, “Gating and risering in vertical green sanf mould”, International Journal of Cast Metas Research (2002) ISSN: 1364-0461 (Print) 1743-1336.
[7] A. Kumaravadivel, U. Natarajan, “Optimization of sand-casting process variables—a process window approach”, International Journal of Manufacturing technology (2013) 66:695-709 DOI 10.1007/s00170-012-4358-y.
[8] Harshil Bhatta, Rakesh Barota, Kamlesh Bhatta, Hardik Beravalaa, Jay Shahb, “Design Optimization of Feeding System and Solidification Simulation for Cast Iron”, 2nd International Conference on Innovations in Automation and Mechatronics Engineering, ICIAME 2014, Procedia Technology 14 ( 2014 ) 357 – 364.
[9] A. Kumarvadivel, U. Natarajan, C. Ilamparithi, “Determining the optimum green sand casting process parameters using Taguchi's method”, Journal of the Chinese Institute of Industrial Engineers, Vol. 29, No. 2, March 2012, 148-162.
[10] B. Borowiecki, Z. Ignaszak, “The Identification of pouring conditions of cast iron to sand moulds”, Archieves of Foundry Engineering, ISSN (1897-3310) Volume 8 Issue 1/2008, 19-22.
[11] Dr. B. Ravi, “Computer-Aided Casting Design – Past, Present and Future”,
[12] D. E. Groteke, “Benchmarking commercial aluminium sand gating system”, International Journal of Cast Metal Research, 2002, 14, 341-354.
[13] Jean Kor, Xiang Chen, Henry Hu, “Multi-Objective Gating and Riser Design for Metal-Casting”, 2009 IEEE International Symposium on Intelligent Control Part of 2009 IEEE Multi-conference on Systems and Control Saint Petersburg, Russia, July 8-10,2009.
[14] Alireza Modaresi, Azim Safikhani, Amir Mohammad Sedigh Noohi, Naser Hamidnezhad, Sayed Mostafa Maki , “GATING SYSTEM DESIGN AND SIMULATION OF GRAY IRON CASTING TO ELIMINATE OXIDE LAYERS CAUSED BY TURBULENCE”, In terna t ional Journa l of Metalcasting, Copyright © 2016 American Foundry Society. DOI 10.1007/s40962-016-0061-3.
[15] Mohd. Muzammil, Prem Pal Singh, Faisal Talib, “Optimization of Gear Blank Casting Process by Using Taguchi's Robust Design Technique”, QUALITY ENGINEERING Vol. 15, No. 3, pp. 351-359,2003. DOI: 10.1081/QEN-120018033, Copyright © 2003 by Marcel Dekkar, Inc.
[16] Sachin L. Nimbulkar, Dr. Rajendra S. Dalu, “Design Optimization of Gating and Frrding System through Simulation Technique for Sand Casting of Wear Plate”, P e r s p e c t i v e s i n S c i e n c e ( 2 0 1 6 ) , D O I : http://dx.doi.org/doi:10.1016/j.pisc.2016.03.001.
[17] M. Masoumi, H. Hu, “Effect of Gating Design on Mould Filling”, AFS Transactions 2005 © American Foundry Society, Schaumburg, IL USA. Copyright 2005 American Foundry Society.