Embed Size (px)
Citation preview

1
Optimization of Fuzzy Energy Management Systemfor Grid-Connected Microgrid Using NSGA-II
Tiong Teck Teo, Member, IEEE, Thillainathan Logenthiran, Senior Member, IEEE, Wai Lok Woo, Senior Member,IEEE, Khalid Abidi, Member, IEEE, Thomas John, Member, IEEE, Neal S. Wade, Member, IEEE,
David M. Greenwood, Member, IEEE, Charalampos Patsios, and Philip C. Taylor, Senior Member, IEEE
Abstract—This paper proposes a fuzzy logic based energymanagement system (FEMS) for a grid-connected microgridwith renewable energy sources (RES) and energy storage system(ESS). The objectives of the FEMS are reducing the average peakload (APL) and operating cost through arbitrage operation ofthe ESS. These objectives are achieved by controlling the chargeand discharge rate of the ESS based on the state-of-charge ofESS, the power difference between load and RES, and electricitymarket price. The effectiveness of the fuzzy logic greatly dependson the membership functions. The fuzzy membership functionsof the FEMS are optimized offline using a Pareto based multi-objective evolutionary algorithm, nondominated sorting geneticalgorithm (NSGA-II). The best compromise solution is selected asthe final solution and implemented in the fuzzy logic controller. Acomparison with other control strategies with similar objectivesare carried out at a simulation level. The proposed FEMSis experimentally validated on a real microgrid in the energystorage test bed at Newcastle University, UK.
Index Terms—energy storage management, membership func-tion tuning, microgrid, multiobjective evolutionary algorithm.
I. INTRODUCTION
Microgrids are small-scale power systems which containrenewable energy sources (RES) such as photovoltaic (PV)and wind power, demand, and control and energy managementsystems to allow them to operate independently from the maintransmission and distribution system. The variability of theload and generation within a microgrid pose serious challengeto the stability and security of the power system [1]. EnergyStorage Systems (ESS) are seen as a key enabling technologyto mitigate these challenges. However, while capital costshave fallen significantly, large-scale ESS remain expensive. Assuch, the operation of a single ESS should provide multipleservices to maximize its benefit [2].
ESS can provide services such as energy arbitrage and peakdemand reduction. Energy arbitrage describes the process ofcharging the ESS when the cost of electricity is low anddischarging when the cost is high. The ESS can thereby gain
T.T. Teo and K. Abidi are with the Electrical Power Engineering Program,Newcastle University in Singapore, Singapore.
T. Logenthiran is with the School of Engineering and Technology, Univer-sity of Washington, Tacoma.
W.L. Woo is with the Department of Computer and Information Sciences,Northumbria University, United Kingdom.
Thomas John, Neal S. Wade, David M. Greenwood, Charalampos Patsios,and Philip C. Taylor are with the School of Engineering, Newcastle University,United Kingdom
The work in this paper was supported by the Engineering and PhysicalSciences Research Council (EPSRC) under grant number EP/P001173/1 , andEP/N032888/1.
revenue by capitalizing on the price difference. Peak demandreduction is a technique to reduce the power consumptionduring the period(s) of maximum demand. The ESS chargeswhen the demand is low and discharges when the demand ishigh; this can assist the power system operator to reduce or de-fer costly infrastructure expansion, avoid operating expensivepeaking generators, and reduce network losses.
Several control strategies have been proposed for the energymanagement system (EMS) to enable the ESS to combinethese services, including fuzzy logic-based EMS (FEMS) [3],fuzzy logic controller (FLC) for wind power smoothing [4],frequency response [5] and grid power smoothing [6]. Thesemethods improve the operation of the ESS, the design processheavily rely on expert knowledge and optimization is notconventionally applied.
Mathematical optimization methods such as mixed-integerlinear programming (MILP), stochastic programming and con-vex optimization can also be applied to the EMS. Day-aheadand week-ahead scheduling of ESS to maximize revenue isproposed in [7]. The bidding, scheduling and deployment ofan ESS, solely for revenue maximization, using stochasticprogramming is proposed in [8]. A daily cost minimizationusing convex optimization by considering time-of-use tariffsand day-ahead forecast of solar PV is proposed in [9]. Thesemethods aim to find the optimal solution for the respectiveobjective function which can result in a large optimizationproblem. In order to achieve computational viability for real-time operation, they have to consider a smaller set of uncer-tainty scenarios or constraint relaxation For the EMS of amicrogrid, many factors have to be considered besides revenuemaximization, such as peak demand reduction [10], storagedegradation [11], and real-time operation under uncertainty[12]–[14]. A multiobjective ESS in a grid-connected micro-grid, with the objective of significantly reducing operating costand power exchange is also investigated in [15].
An EMS based on Multi-Objective Optimization (MOO) isproposed in [16]–[18]. The operating cost and peak shavingof the microgrid are formulated as a single-objective opti-mization problem through scalarization [16]. The hydrogenconsumption of the fuel cells and load variation are minimizedto prolong the lifetime of the fuel cell using FLC in [17]. Theparameters of the FLC are tuned using a genetic algorithm(GA). The economic cost and CO2 equivalent emission areformulated as a day-ahead unit commitment problem and min-imized using dynamic programming in [18]. These methodsonly produces a single solution and do not consider the trade-
2
off between objective functions.In MOO, no single solution exists to minimize both ob-
jectives simultaneously. However, there exists a set of Paretooptimal solutions. A solution is part of the Pareto set if none ofthe individual objective can be improved without deterioratingthe other objective function. Without any additional informa-tion or preference, all Pareto optimal solutions are consideredequally good [19].
Multi-objective evolutionary algorithm (MOEA) such asniched Pareto genetic algorithm (NPGA) [20], strength Paretoevolutionary algorithm (SPEA) [21] and non-dominant sortingalgorithm II (NSGA-II) [22] can find a set of Pareto optimalsolutions in a single run. It has been used in inductionmachine design [23], generation and transmission expansionplanning [24], [25] and electric power optimal dispatch [26]–[28]. NSGA-II is able to find a more diverse solution on thePareto-optimal front when compared to other multi-objectiveevolutionary algorithms [22], [29]–[31].
FLC based energy management system (FEMS) can be ap-plied in real-time to manage variability of the load and RES. InFEMS, key parameters – including the membership functions(MF) and its fuzzy rules – are defined by expert knowledge.Determination of optimal FEMS parameters remains a chal-lenge. Moreover, parameter optimization algorithms for FLConly focus on a single objective function [32].
The main contributions of this paper are:1) A new method to simultaneously minimize the operating
cost and peak demand of a microgrid by tuning themembership functions of a FEMS using NSGA-II;
2) an investigation into the trade-off between conflictingobjective functions;
3) validating the real-time operational perforance of theproposed FEMS using the energy storage test bed inNewcastle University, UK.
The rest of this paper is organized as follows: the mathemat-ical model of the microgrid and proposed FEMS are presentedin section II; section III shows the implementation of NSGA-II to optimize the fuzzy membership functions; simulationstudies and result can be found in section IV. The experimentalvalidation of the proposed methodology is presented in SectionV, and conclusions are drawn in Section VI.
II. PROBLEM FORMULATIONS
This paper considers the problem of operating an ESS whichis connected to a microgrid containing renewable generationsources. The problem is formulated using a fixed time stepequal to the electricity market trading period. All systemvariables, constraints, and decisions are assumed constantfor the duration of each time step. The rest of this sectiondescribes the mathematical models of the microgrid and ESS.
A. Grid-connected Microgrid Model
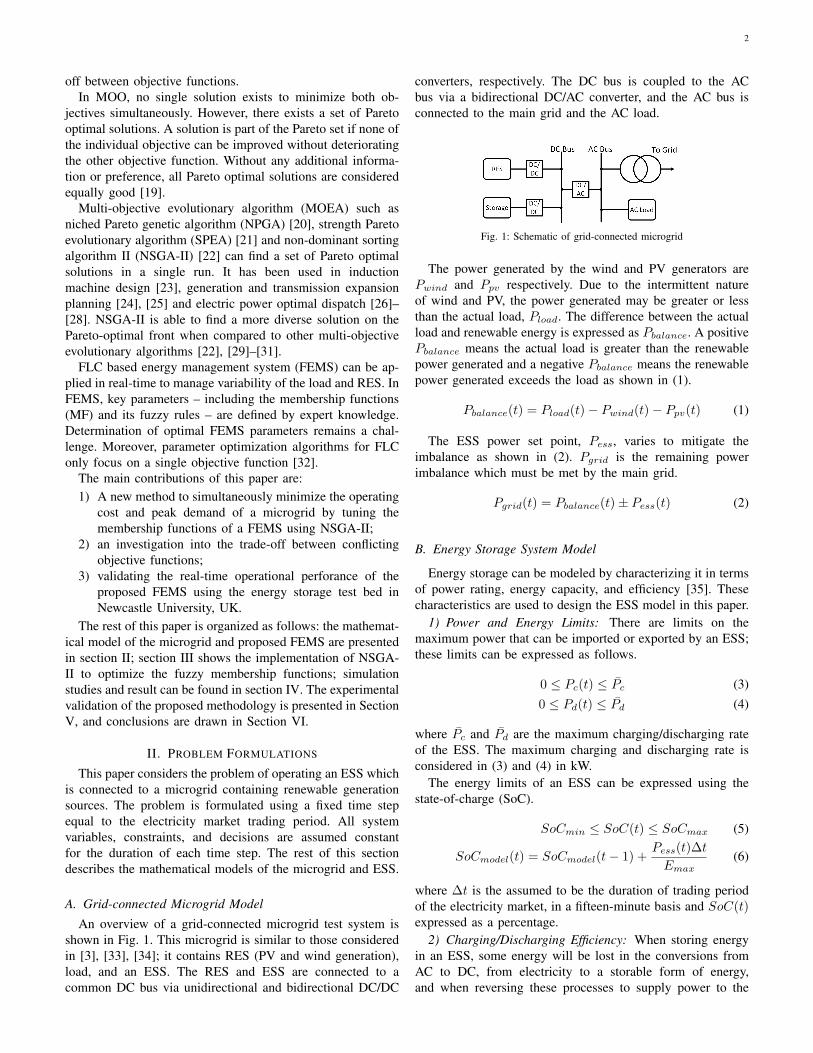
An overview of a grid-connected microgrid test system isshown in Fig. 1. This microgrid is similar to those consideredin [3], [33], [34]; it contains RES (PV and wind generation),load, and an ESS. The RES and ESS are connected to acommon DC bus via unidirectional and bidirectional DC/DC
converters, respectively. The DC bus is coupled to the ACbus via a bidirectional DC/AC converter, and the AC bus isconnected to the main grid and the AC load.
Fig. 1: Schematic of grid-connected microgrid
The power generated by the wind and PV generators arePwind and Ppv respectively. Due to the intermittent natureof wind and PV, the power generated may be greater or lessthan the actual load, Pload. The difference between the actualload and renewable energy is expressed as Pbalance. A positivePbalance means the actual load is greater than the renewablepower generated and a negative Pbalance means the renewablepower generated exceeds the load as shown in (1).
Pbalance(t) = Pload(t)− Pwind(t)− Ppv(t) (1)
The ESS power set point, Pess, varies to mitigate theimbalance as shown in (2). Pgrid is the remaining powerimbalance which must be met by the main grid.
Pgrid(t) = Pbalance(t)± Pess(t) (2)
B. Energy Storage System Model
Energy storage can be modeled by characterizing it in termsof power rating, energy capacity, and efficiency [35]. Thesecharacteristics are used to design the ESS model in this paper.
1) Power and Energy Limits: There are limits on themaximum power that can be imported or exported by an ESS;these limits can be expressed as follows.
0 ≤ Pc(t) ≤ P̄c (3)0 ≤ Pd(t) ≤ P̄d (4)
where P̄c and P̄d are the maximum charging/discharging rateof the ESS. The maximum charging and discharging rate isconsidered in (3) and (4) in kW.
The energy limits of an ESS can be expressed using thestate-of-charge (SoC).
SoCmin ≤ SoC(t) ≤ SoCmax (5)
SoCmodel(t) = SoCmodel(t− 1) +Pess(t)∆t
Emax(6)
where ∆t is the assumed to be the duration of trading periodof the electricity market, in a fifteen-minute basis and SoC(t)expressed as a percentage.
2) Charging/Discharging Efficiency: When storing energyin an ESS, some energy will be lost in the conversions fromAC to DC, from electricity to a storable form of energy,and when reversing these processes to supply power to the
3
network. These losses can be quantified by modelling thecharging and discharging efficiencies of the system.
Pess(t) = Pc(t)− Pd(t) (7)
Pc(t) =pc(t)
ηc(8)
Pd(t) = pd(t).ηd (9)
where p, η and P are DC power, efficiency and AC powerrespectively. Subscripts c and d denotes charging and discharg-ing. The power losses during conversion between DC/AC andAC/DC are considered in (8) and (9). The net output powerof ESS is considered in (7) in kW.
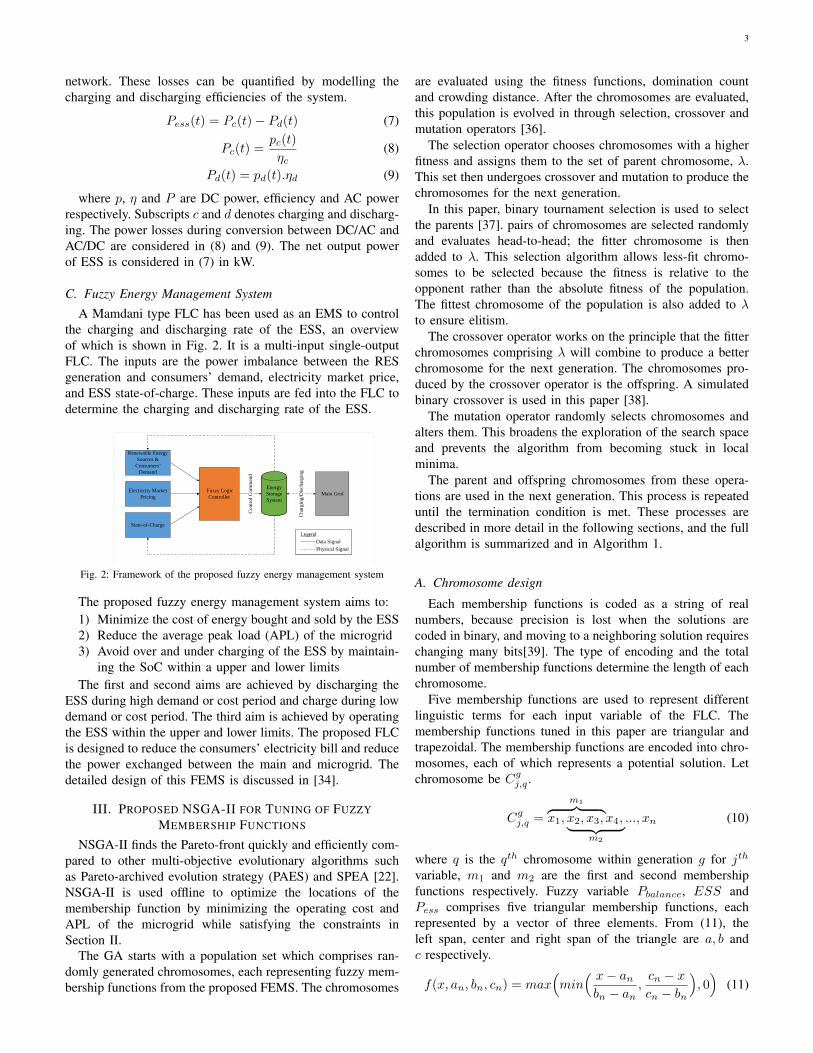
C. Fuzzy Energy Management SystemA Mamdani type FLC has been used as an EMS to control
the charging and discharging rate of the ESS, an overviewof which is shown in Fig. 2. It is a multi-input single-outputFLC. The inputs are the power imbalance between the RESgeneration and consumers’ demand, electricity market price,and ESS state-of-charge. These inputs are fed into the FLC todetermine the charging and discharging rate of the ESS.
Renewable Energy
Sources &
Consumers’
Demand
Electricity Market
Pricing
State-of-Charge
Fuzzy Logic
Controller
Energy
Storage
System
Energy
Storage
System
Main Grid
Co
ntr
ol
Co
mm
and
Ch
arg
ing
/Dis
char
gin
g
Data Signal
Physical Signal
Legend
Data Signal
Physical Signal
Legend
Data Signal
Physical Signal
Legend
Fig. 2: Framework of the proposed fuzzy energy management system
The proposed fuzzy energy management system aims to:1) Minimize the cost of energy bought and sold by the ESS2) Reduce the average peak load (APL) of the microgrid3) Avoid over and under charging of the ESS by maintain-
ing the SoC within a upper and lower limitsThe first and second aims are achieved by discharging the
ESS during high demand or cost period and charge during lowdemand or cost period. The third aim is achieved by operatingthe ESS within the upper and lower limits. The proposed FLCis designed to reduce the consumers’ electricity bill and reducethe power exchanged between the main and microgrid. Thedetailed design of this FEMS is discussed in [34].
III. PROPOSED NSGA-II FOR TUNING OF FUZZYMEMBERSHIP FUNCTIONS
NSGA-II finds the Pareto-front quickly and efficiently com-pared to other multi-objective evolutionary algorithms suchas Pareto-archived evolution strategy (PAES) and SPEA [22].NSGA-II is used offline to optimize the locations of themembership function by minimizing the operating cost andAPL of the microgrid while satisfying the constraints inSection II.
The GA starts with a population set which comprises ran-domly generated chromosomes, each representing fuzzy mem-bership functions from the proposed FEMS. The chromosomes
are evaluated using the fitness functions, domination countand crowding distance. After the chromosomes are evaluated,this population is evolved in through selection, crossover andmutation operators [36].
The selection operator chooses chromosomes with a higherfitness and assigns them to the set of parent chromosome, λ.This set then undergoes crossover and mutation to produce thechromosomes for the next generation.
In this paper, binary tournament selection is used to selectthe parents [37]. pairs of chromosomes are selected randomlyand evaluates head-to-head; the fitter chromosome is thenadded to λ. This selection algorithm allows less-fit chromo-somes to be selected because the fitness is relative to theopponent rather than the absolute fitness of the population.The fittest chromosome of the population is also added to λto ensure elitism.
The crossover operator works on the principle that the fitterchromosomes comprising λ will combine to produce a betterchromosome for the next generation. The chromosomes pro-duced by the crossover operator is the offspring. A simulatedbinary crossover is used in this paper [38].
The mutation operator randomly selects chromosomes andalters them. This broadens the exploration of the search spaceand prevents the algorithm from becoming stuck in localminima.
The parent and offspring chromosomes from these opera-tions are used in the next generation. This process is repeateduntil the termination condition is met. These processes aredescribed in more detail in the following sections, and the fullalgorithm is summarized and in Algorithm 1.
A. Chromosome design
Each membership functions is coded as a string of realnumbers, because precision is lost when the solutions arecoded in binary, and moving to a neighboring solution requireschanging many bits[39]. The type of encoding and the totalnumber of membership functions determine the length of eachchromosome.
Five membership functions are used to represent differentlinguistic terms for each input variable of the FLC. Themembership functions tuned in this paper are triangular andtrapezoidal. The membership functions are encoded into chro-mosomes, each of which represents a potential solution. Letchromosome be Cgj,q .
Cgj,q =
m1︷ ︸︸ ︷x1, x2, x3, x4, ..., xn︸ ︷︷ ︸
m2
(10)
where q is the qth chromosome within generation g for jth
variable, m1 and m2 are the first and second membershipfunctions respectively. Fuzzy variable Pbalance, ESS andPess comprises five triangular membership functions, eachrepresented by a vector of three elements. From (11), theleft span, center and right span of the triangle are a, b andc respectively.
f(x, an, bn, cn) = max(min
( x− anbn − an
,cn − xcn − bn
), 0)
(11)

4
Algorithm 1: NSGA-II1) Chromosome Design2) Initial Population Generation, G = Gk3) while Termination Condition ¬ do
Fitness FunctionEvaluates the quality of each chromosome for Allchromosomes do
Nondominant SortingAssign a domination count to each chromosomefor Chromosomes with same domination countdo
Calculate Crowding distance
Binary Tournament SelectionFrom population P , select λ = {s1, ..., sλ}s = 1for s ≤ λ do
Randomly select two chromosomeCompare domination count and crowdingdistancePut fitter chromsome into λs = s+ 1
Simulated Binary CrossoverSelect two parents x1 and x2Compute offspring xnew1 and xnew2
MutationRandom select a chromosome from λChange a single gene in the chromosomeSort the mutated chromosome in descending order.New populationCombine parent and offspring populationG = Gk+1
Five triangular membership functions are used for Pbalance,ESS and Pess as shown in Fig. 3. From Table I, the center,b1 and right span, c1 of the first linguistic term, M1 is equalto the left span, a2 and center b2 of the second linguistic term,M2. This is to ensure that there is sufficient overlap betweenadjacent linguistic terms. Continuity is lost if the overlap istoo small, and the linguistic term is redundant if overlap istoo large. In this manner, five triangular membership functionscan be represented using seven parameters, g1 to g7. The left,right and center of M1 can be represented by g1, g2 and g3respectively.
M1 M2 M3 M4 M5
g1 g2 g3 g4 g5 g6 g7
1
M1 M2 M3 M4 M5
g1 g3 g4 g5 g6 g7 g9
1
g2 g8
Fig. 3: Pbalance and ESS Membership Function
A randomly generated vector of 7 elements, g1 to g7,can represent the placement of all 5 triangular membership
functions for Pbalance and ESS as shown in Table I.
TABLE I: Encoding Pbalance and ESS
Cgj,q x1 x2 x3 x4 x5 x6 x7
M1 a1 b1 c1M2 a2 b2 c2M3 a3 b3 c3M4 a4 b4 c4M5 a5 b5 c5
The fuzzy membership function of Cp is similar to thoseofPbalance and ESS, but contains trapezoids in addition totriangles. Fuzzy variable Cp contains 3 triangular membershipfunctions and 2 trapezoid membership functions. The trape-zoidal membership functions are represented by a vector of 4elements. From (12), the left and right span are a and d. The”shoulders” are b and c.
f(x, an, bn, cn, dn) = max(min
( x− anbn − an
, 1,dn − xdn − cn
), 0)
(12)Similar to the chromosome design of Pbalance and ESS, fromTable II, the ”right shoulder”, c1 and right span, d1 of the firstlinguistic term M1 is equal to the left span, a2 and center, b2 ofthe second linguistic term M2. In this manner, two trapezoidand three triangle membership functions can be representedwith nine parameters, g1 to g9.
Fig. 4 shows the membership functions for Cp.
M1 M2 M3 M4 M5
g1 g2 g3 g4 g5 g6 g7
1
M1 M2 M3 M4 M5
g1 g3 g4 g5 g6 g7 g9
1
g2 g8
Fig. 4: Cp Membership Function
A randomly generated vector of 9 elements, g1 to g9 canrepresent the placement of all 5 membership functions for Cp,as shown in Table II.
TABLE II: Encoding Cp
Ckj,q x1 x2 x3 x4 x5 x6 x7 x8 x9
M1 a1 b1 c1 d1M2 a2 b2 c2M3 a3 b3 c3M4 a4 b4 c4M5 a5 b5 c5 d5
B. Initial Population
The chromosomes are randomly generated and are subjectedto the following constraints:
SoCmin ≤ SoC(t) ≤ SoCmax (13)
Pbalance,min ≤ Pbalance(t) ≤ Pbalance,max (14)
Cp,min ≤ Cp(t) ≤ Cp,max (15)

5
Constraint (13) restricts the upper and lower operatingcapacity of the ESS, which prevents over and under charging[40]. Constraints (14) and (15) are the maximum and minimumvalues of Pbalance and Cp, which are obtained from thehistorical data.
The maximum and minimum boundaries of these constraintscan modified to suit any storage technology, electricity marketprice and microgrid configuration for which historical data areavailable.
C. Fitness Function
The fitness function evaluates the quality of each chro-mosome in a given generation. A poorly designed fitnessfunction will result in a weak solution. The objective of theproposed FLC is to reduce the overall operating cost and APLby controlling the charging and discharging of the ESS. Theoverall operating cost of the microgrid can be calculated by(16).
f1 =
T∑t=1
Pgrid(t).Cp(t) (16)
where Cp is the wholesale electricity price. The microgrid canfreely purchase and sell electricity from the main grid at timet at the same market price, Cp(t).
a) Pgrid(t) > 0 if electricity is purchased from the grid;b) Pgrid(t) < 0 if electricity is sold back to the grid.The APL of the power profile is calculated using (17). The
operating cost can be reduced by reducing the peak load ofthe power profile because the price is comparatively higherduring this period.
f2 =
∑ωm=1 Pgrid,max(m)
ω(17)
where ω is the total number of months.Because the objective of the FLC is to minimize operating
cost and APL, equations (16) and (17) are used as fitnessfunctions to evaluate each chromosome.
The focus of this paper is the operation of ESS, thereforethe initial capital and maintenance cost of the ESS – whichare considered during the system planning stages – are omittedfrom the operation cost. Furthermore, because the microgridcan be assumed small relative to the main grid, any arbitrageoperation will have a negligible effect on the energy marketprice, therefore the microgrid is assumed to be a price taker.
A multi-objective optimization problem can be formulatedas follows:
min (f1(x), f2(x), ..., fk(x))
s.t. ∀x ∈ X(18)
where f , k, and x are the fitness function, kth fitness func-tion and x solution for the fitness function respectively. Forinstance, this paper considers (16) and (17) as the objectivefunctions.
Let the fitness functions f1, f2 be (16) and (17). In addi-tion to the fitness functions, domination count and crowdingdistance are computed to evaluate each solution.
1) Domination count and crowding distance: In multi-objective optimization, when considering the quality of twosolutions, p and q, with multiple objective functions, i and j,solution p is considered to dominate solution q if:
1) fi(p) ≤ fi(q) for all indices i ∈ 1, 2, ..., k and2) fj(p) < fj(q) for at least one index j ∈ 1, 2, ...k
When solution p is compared with q, if the fitness functionfor all objectives for p is less than or equal to q and p is lessthan q for at least one objective, p dominates q. If this criteriais not met, p and q are non-dominant and they belong to thesame Pareto front (A set of non-dominated optimal solutions,in which no objective can be improved without deteriorationof at least one other objective).
All solutions not dominated by any other solutions areassigned a domination count of 0. All solutions that areonly dominated by solutions with domination count of 0 areassigned a domination count of 1. This process is repeateduntil all the solutions have a domination count. All solutionswith the same domination count are considered equally good.The solutions with the same domination count are further dif-ferentiated by introducing a second entity, crowding distance.
Within the same Pareto front, the crowding distance iscalculated. A higher crowding distance signifies a less crowdedregion, and vice-versa. When comparing two solutions with thesame domination count, the solution with a higher crowdingdistance is the better solution. In this manner, the sortingalgorithm favors a more diverse solution. The detailed im-plementation of domination count and crowding distance isfound in [22].
2) Best Compromise Solution: Fuzzy set theory is imple-mented to determine the best compromise solution from theset of Pareto optimal solutions [26]. For each non-dominantsolution k, the respective fitness function is fuzzified using(19).
µi =
1 Fi ≤ FminiFmaxi −Fi
Fmaxi −FminiFmini < Fi < Fmaxi
0 Fi ≥ Fmaxi
(19)
For each solution i, the maximum and minimum values areFmaxi and Fmini respectively. The normalized membershipfunction µk for each non-dominant solution, k, is calculatedusing (20).
µk =
∑Nobji=1 µki∑M
j=1
∑Nobji=1 µji
(20)
where M is the total number of non-dominant solutions andNobj is the total number of objective functions. The solutionwith the highest value of µk is the best compromise solution.For each minimizing objective within the objective function,the lowest objective is assigned a value of 1 from (19).
D. Selection: Binary Tournament Selection
Binary tournament selection randomly chooses a pair ofchromosomes from the population [37]. The domination countof the selected pairs are compared and the chromosome whose

6
domination count is lower is selected. If both chromosomehave the same domination count, the chromosome with thehigher crowding distance is selected. Elitism is ensured byselecting the solution with the highest crowding distancein the Pareto front and adding it to λ, the set of selectedchromosomes.
E. Crossover & Mutation
Crossover produces the next generation of chromosomesbased on the fittest chromosome from the current generation.The literature proposes several methods for crossover and mu-tation, which depend on how the chromosomes are encoded.Simulated Binary Crossover (SBX) simulates the single-pointcrossover operator of the binary-coded GAs. Let Cgj,1 and Cgj,2be the two fittest chromosome of the gth generation and jth
variable.
Cgj,1 = (c1, ..., ch, ..., cz) (21)Cgj,2 = (c′1, ..., c
′h, ..., c
′z) (22)
where ε is a randomly generated number between 0 and 1,ψ is a distribution index which determines how similar theoffspring is to the parent and β is the spread factor. Theoffspring solution of a large ψ are close to the parent solutionand the offspring solution of a small ψ are far from the parentsolution.
Cg+1j,1 =
1
2[(1− β)Cgj,1 + (1 + β)Cgj,2] (23)
Cg+1j,2 =
1
2[(1 + β)Cgj,1 + (1− β)Cgj,2] (24)
β =
{(2ε)
1ψ+1 if ε ≤ 0.5
( 12(1−ε) )
1ψ+1 otherwise (25)
Random mutation is used in this paper to diversify thesearch space based using a predefined mutation probability,ρm.
IV. SIMULATION RESULTS AND DISCUSSION
The proposed FEMS was implemented using MAT-LAB/Simulink. The parameters of the grid-connected micro-grid used to test the FEMS are shown in Table III. The dataused in this paper are obtained from the National RenewableEnergy Laboratory (NREL) [41] and wholesale electricityprices from Energy Market Company Singapore (EMCSG).Time series data from January 1st 2013 to March 31st 2014,with a time step of 15 minutes, were used in this paper. Theresulting dataset contained 43584 data points. The proposedFEMS aims to minimize the operating cost and APL from(16) and (17) of the grid-connected microgrid respectively bytuning the input fuzzy membership functions using NSGA-II.
TheNSGA-II algorithm described in Section II was imple-mented using a M-script file in MATLAB, and the FEMS wasimplemented in Simulink. The data from January 1st 2013 toDecember 31st 2013 were used to tune the FEMS and datafrom January 1st 2014 to March 31st 2014 were used to testthe FEMS.
TABLE III: Microgrid Data
Parameter Values
PV Array 13.68 kWpWind Turbine 12 kWpLoad 26.8 kWpEnergy storage capacity 90 kWhMaximum charging\discharging rate 15kWUpper and lower limit 90kWh, 4kWhCharging\discharging efficiency, ηc, ηd 0.95
The chromosomes of the population were randomly gener-ated according to Table III. The membership functions fromeach chromosome were encoded and evaluated in the FEMS.After all the chromosomes within the generation were evalu-ated, they were sorted using NSGA-II. These chromosomesthen underwent crossover and mutation. This process wasrepeated until the maximum number of generations was met.
All of the parameters required by NSGA-II were determinedheuristically, and are shown in Table IV.
TABLE IV: NSGA-II Parameters
P G λ ψ ρc ρmParameters 100 100 40 2 0.9 0.05
where P is the total number of chromosomes, G is thetotal number of generations, λ is the number of selectedchromosomes for crossover, ψ is the crossover parameter, ρcand ρm are the crossover and mutation probability respectively.
Three case studies are presented in this paper as follows:
• Case study I: Minimizing operating cost• Case study II: Minimizing APL• Case study III: Multi-objective optimization
Case studies I and II were designed to find the extremepoints of trade-off on the solution space with competing objec-tive functions. Case studies I and II investigate single objectiveoptimization, minimizing only cost or APL, respectively. Inthese cases, a standard GA was implemented. Case studyIII was a multi-objective optimization, in which cost andAPL were minimized together. In this case, NSGA-II wasimplemented.
For each case study, the FEMS was tuned offline withhistorical data from 1 January 2013, to 31 December 2013, andvalidated online with data from 1 January 2014 to 31 March2014. All case studies investigated the effect of adding theexpert system fuzzy membership functions into the initial gen-eration of GA/NSGA-II. As such, each case study is repeatedtwice. The first case, with expert system fuzzy membershipfunctions as one of the chromosomes in the initial population,are labelled as Predefined and the second, without any expertfuzzy membership functions, are labelled as Random.
As a comparison to NSGA-II for case study III, the two fit-ness functions, f1 and f2 from (16) and (17) were normalizedusing (26) and summed into a single figure of merit using (27).Normalizing both objective before summing them up gives anequal importance to both objectives instead of using weightedsum where additional weights parameter must be determined[42].

7
X ′ =X −min(X)
max(X)−min(X)(26)
fagg = f1 + f2 (27)
The results of aggregated multi-objective optimization werecompared with NSGA-II. Furthermore, an expert tuned FEMSwas used as a comparison with the proposed methodology ineach case study.
A. Case study I: Minimizing operating cost
This subsection presents the results and discussions forsingle objective optimization of operating cost using standardGA. The offline tuning and online validation results areshown in Table Va and Vb respectively. In offline tuning, theoperating cost was reduced by approximately 5.5% and 3.8%in predefined and random. The APL reduced by 6.9% and8.1% in predefined and random.
TABLE V: Minimizing operating cost
(a) Offline tuning of FEMS for minimizing operating cost
FEMS Cost($) APL(kW) ∆Percentage (%)Cost APL
Expert FEMS 19246.5 12.5 - -GA Predefined 18188.1 11.6 -5.5 -6.9GA Random 18507.9 11.5 -3.8 -8.1
(b) Online validation of FEMS for minimizing operating cost
FEMS Cost($) APL(kW) ∆Percentage (%)Cost APL
Expert FEMS 4780.6 12.5 - -GA Predefined 4632.9 11.8 -3.1 -5.8GA Random 4684.5 12.1 -2.0 -3.6
The GA with predefined membership functions in the initialpopulation produced a better solution than random member-ship functions in terms of operating cost in this case study.Not only did it provide a lower operating cost, it also yieldeda lower APL.
The reduction of population average fitness and fittest solu-tion is shown in Fig. 5. GA with predefined expert knowledgemembership functions can reach a lower operating cost fasterthan a random initialized GA.
B. Case study II: Minimizing APL
This subsection presents the results and discussions forsingle objective optimization of APL using a standard GA.From this subsection onward, the FEMS were tuned offlineand only the online validation results are shown. The objectiveof case study II was to reduce the APL of the microgrid.The result of the online validation is shown in Table VI. TheAPL was reduced by approximately 21.2% and 11.4% forpredefined and random respectively.
GA with predefined membership functions in the initial pop-ulation produced a better solution than random membershipfunctions in this case study. Not only did it provide a lowerAPL but also slightly reduced the operating cost.
Fig. 5: Single Objective Optimization: Cost
TABLE VI: Online validation of FEMS for minimizing APL
FEMS Cost($) APL(kW) ∆Percentage (%)Cost APL
Expert FEMS 4780.6 12.5 - -GA Predefined 4796.8 9.9 -0.3 -21.2GA Random 4822.4 11.1 -0.9 -11.4
Similar to minimizing operating cost, GA with predefinedexpert membership functions can reach a lower APL fasterthan a random GA as shown in Fig. 6.
Fig. 6: Single Objective Optimization: Average Peak Load
In case studies I and II, having the expert tuned membershipfunctions in the initial GA population yielded better results.For example in Case study I, even though minimizing oper-ating cost was the objective function, both operating cost andAPL were lower than the case where all initial chromosomeswere random.
It is important to note that in online validation, for casestudy I: minimizing operating cost, the lowest operating costwas $4632.9 and with an APL of 11.8kW. In case studyII: minimizing APL, the lowest APL was 9.9kW with anoperating cost of $4796.8. These are the extreme points in thesolution space, at the edges of the Pareto front. By comparing

8
the results in single objective optimization from Table Vband VI, both objectives functions are in conflict. When theoperating cost is minimized in case study I, the APL increasesand vice-versa in case study II.
C. Case study III: Multi-objective optimization
Case study III compares three FEMS namely: an expertsystem from [34], aggregated multi-objective GA, and NSGA-II. Similar to case study I and II, aggregated multi-objectiveGA and NSGA-II were further separated into predefined andrandom. The online validation results are shown in Table VII.
The fittest solution from each generation is plotted onto thescatter heat maps shown in Fig. 7a and Fig. 7b illustrate theconvergence of the GAs. Dark blue represents first generation,and dark red represents the 100th generation. The optimumregion is in the bottom left region of the heat map. From thefirst generation, the fittest solution of each generation improvesand converges into the bottom left region through the geneticoperators. In FEMS optimized using NSGA-II, by comparingFig. 7c and Fig. 7d, the NSGA-II predefined have a morediverse Pareto front compared to NSGA-II random. NSGA-IIpredefined also have more solutions on the Pareto front.
As Table VII shows, the solutions obtained by differentFEMS were fuzzified using (19) and (20) to obtain theµk. Among these solutions, NSGA-II predefined is the bestcompromise solution because it has the highest µk of 0.35. Inthe solution obtained by NSGA-II predefined, the operatingcost and APL are decreased by 7.5% and 16.1% duringoffline tuning and 2.1% and 18.4% during online validationrespectively.
TABLE VII: Best compromise solution for multi-objective optimization
FEMS Cost ($) APL (kW) µ1 µ2 µk
Expert FEMS 4780.6 12.5 0.00 0.00 0.00Aggregated predefined 4666.2 12.5 1.00 0.00 0.22Aggregated random 4739.2 9.3 0.36 1.00 0.30NSGA-II predefined 4681.9 10.2 0.86 0.72 0.35NSGA-II random 4751.5 11.6 0.25 0.28 0.12
Fig. 8 shows the solutions for case studies I to III. Fromthese case studies, the optimum solutions for case studies Iand II are obtained from GA with predefined population. It issimilar with case studies III as the best compromise solutionis obtained with NSGA-II with predefined population. Bycomparing with the best solution from case study I and II,all three solutions belong to the same Pareto front as none ofthe solution dominates the other.
D. Simulated operation of FEMS using the best compromisesolution
The best compromise solution from Section IV-C was usedas the FEMS. Fig. 9 shows a one day of FEMS operation.From 0000 to 0600 hours, Pbalance was positive while theprice was low. Hence the storage capitalized on this arbitrageopportunity to charge the storage. From 0800 to 1600 hours,Pbalance and Cp began to increase simultaneously; conse-quently, the storage discharged to reduce the peak demand.From 1600 to 2000 hours, the evening peak demand kicked
in and the storage continued to discharge. From 2000 to 0000hours, the SoC of the storage was approaching the minimumSoC, so the discharge rate gradually decreased to prevent over-discharging of the storage. The Pgrid power profile fluctuatedless compared to Pbalance as a result of FEM operation. TheSoC of the storage also operated within the upper and lowerboundary.
In multi-objective optimization, NSGA-II converges fasterto the Pareto-optimal front when the initial population is ini-tialized with expert membership functions. NSGA-II with pre-defined initial population has higher diversity. While NSGA-IIcan automatically generate all the membership functions forFEMS, empirical evidence from Case I and II have shown thatthe solution with predefined expert MF in the initial generationcan yield a more diversified Pareto front and better solution.
Electricity was expensive during peak demand, so discharg-ing during high price periods also reduced the peak demand[43]. Reducing peak demand can defer costly expansion ofunderutilized peaking power plant, transmission infrastructure,and distribution network. The APL was reduced by controllingthe charging/discharging of the energy storage without alteringthe consumption of the consumer. The proposed methodologyutilizes real-time electricity prices to enhance the operation ofthe ESS. It does not require the intervention of consumers todecide whether to buy or sell from the main grid. Furthermore,the proposed methodology utilizes the available resourceswithout any changes or expansion to the current infrastructureof the microgrid. The proposed FEMS can be applied toother ESS operation as it is designed with historical data andparameters of the ESS.
V. EXPERIMENTAL VALIDATION
The proposed methodology is experimentally validated inreal-time using the energy storage test bed (ESTB) at New-castle University, UK. An overview of the ESTB is shownin Fig. 10. The ESTB was connected to a 400V three phasenetwork via a bi-directional AC/DC power converter rated at360kVA, which then interfaces with the Northern Powergriddistribution network.
A. Energy storage test bed setup
1) 400V/400V Isolating Transformer: The ESTB is con-nected to the University network. The test bed is isolated fromthe main grid by this transformer.
2) Engineering station: The engineering station acts as asupervisory and control center for the ESTB. The proposedFEMS is implemented in MATLAB simulink model. Theengineering station interfaces with the real-time target (RTT).
3) 700V DC busbar and power converters: The ESTB con-sisted of a single bi-directional AC/DC power converter ratedat 360kVA and three bi-directional DC/DC power convertersrated at 90kW each. These converters were connected to acommon 700V DC bus. They were capable of setting differentvoltage, current and power set points either in real-time orfrom historical data.

9
(a) Aggregated Predefined Multiobjective (b) Aggregated Random Multiobjective
(c) NSGA-II Predefined Multiobjective (d) NSGA-II Random Multiobjective
Fig. 7: Solution Space with Two Minimizing Objectives
Fig. 8: Solutions of case studies I-III
4) Real-time target: The simulink model from the engi-neering station was compiled into a C program and executedin the RTT. The RTT controlled the voltage and current levelsof the AC/DC converters, DC/DC converters and DC bus. Thisallowed real-time control of the power converters and ESS.
Fig. 9: Power profiles of simulation
5) Energy storage system: A super-capacitor bank withratings of 90 kW and 2 kWh was used in this experiment.The operating voltage was between 300V to 650V. This ESSwas connected to the 700V DC bus via DC/DC converter.
This ESTB setup enabled experimental validation of the

10
400V Isolation Transformer Engineering Station Real-time Target
700V DC Busbar and Power Converters Energy Storage System400V Incoming
LegendData signal Physical signal
Fig. 10: Experimental setup of energy storage test bed
proposed control methodology in real-time and at grid-scale.
B. Experimental results
In the experiments presented, Pload, Ppv , and Pwind wererepresented using with data signals. This did not affect theresults adversely, because the focus of this paper is theoperation of ESS.
The time conversion from simulation to experimental isshown in Table VIII. Since the data signal is in 15 minutesinterval (900s) and the ESTB runs in real-time, the ESTBoperates 20 times faster. Where 1s in real-time corresponds to45s in simulation time, as such 20s in real-time correspondsto 900s (15 minutes) in simulink. This allowed the 2kWhenergy storage system to represent a 90 kWh system withinthe experiments.
TABLE VIII: Simulation to Experimental Time Conversion
Time-step Energy Capacity
Simulation 900s 90 kWhExperiment 1s 2 kWhRatio 900:1 45:1
The SoC of the actual ESS was estimated using the opencircuit voltage, VOC and the operating voltage range, Vmaxand Vmin as shown in (28) from [44], [45].
SoCactual =VOC − VminVmax − Vmin
(28)
Fig. 11 compares the simulation power profile of ESS andSoC with the experiment. The SoC of the model can beaccurately estimated using the generalized storage model from(6) and the actual ESS can follow the power setpoints fromthe proposed controller in real-time.
Mean absolute percentage error (MAPE) in (29) is usedto quantify the agreement between the simulation model andexperimental results. It is expressed as a percentage.
MAPE =100%
S
S∑t=1
|s(t)− e(t)s(t)
| (29)
Fig. 11: Comparison between experimental and simulation results of theproposed FEMS
where S, s and e are the total number of samples, simulationdata and experimental data for time t respectively.
From Table IX, the MAPE of SoC and Pess are 1.87% and1.66% respectively. This shows excellent agreement betweenthe model and experiment, thereby affirming the feasibility ofthe proposed approach in real systems.
TABLE IX: MAPE of simulation and experiment
MAPE (%)SoC 1.87Pess 1.66
VI. CONCLUSION
This paper proposes a fuzzy based energy managementsystem with three inputs and one output. The objectivesare to minimize the operating cost and APL of the grid-connected microgrid with real-time pricing. The minimizationof operating cost and APL is formulated into a multi-objectiveoptimization problem with conflicting objective functions.Expert knowledge is integrated into the initial population ofNSGA-II to obtain a diverse Pareto front in a single run.Three case studies were conducted in this paper. Case study Iand II present a single objective optimization problem, whereonly operating cost or APL is minimized using standard GA.Case study III presents a multi-objective optimization problemby comparing an aggregated multi-objectives and NSGA-II.The results show that NSGA-II with expert knowledge inthe initial population of GA is effective for handling multi-objective optimization with conflicting objective. NSGA-II isalso able to obtain a diverse Pareto front. The proposed FEMScan be deployed to other power system with ESS with similarobjectives as it is designed based on the historical data andnot any specific storage technology. Furthermore, the proposedFEMS is experimentally validated and shows good agreementwith the simulation.
REFERENCES
[1] T. T. Teo, T. Logenthiran, and W. L. Woo, “Forecasting of photovoltaicpower using extreme learning machine,” in 2015 IEEE Innovative SmartGrid Technologies-Asia (ISGT ASIA). IEEE, 2015, pp. 1–6.

11
[2] R. H. Byrne, T. A. T. Nguyen, D. A. Copp, B. R. Chalamala, andI. Gyuk, “Energy management and optimization methods for grid energystorage systems,” IEEE Access, vol. 6, pp. 13 231–13 260, 2018.
[3] T. T. Teo, W. L. Woo, T. Logenthiran, and K. Abidi, “Fuzzy logic controlof energy storage system in microgrid operation,” in Innovative SmartGrid Technologies - Asia (ISGT-Asia), 2016 IEEE. IEEE, 2016.
[4] F. Zhang, K. Meng, Z. Xu, Z. Dong, L. Zhang, C. Wan, and J. Liang,“Battery ess planning for wind smoothing via variable-interval referencemodulation and self-adaptive soc control strategy,” IEEE Transactionson Sustainable Energy, vol. 8, no. 2, pp. 695–707, April 2017.
[5] D. Greenwood, K. Lim, C. Patsios, P. Lyons, Y. Lim, and P. Taylor,“Frequency response services designed for energy storage,” AppliedEnergy, vol. 203, pp. 115 – 127, 2017.
[6] D. Arcos-Aviles, J. Pascual, L. Marroyo, P. Sanchis, and F. Guinjoan,“Fuzzy logic-based energy management system design for residentialgrid-connected microgrids,” IEEE Transactions on Smart Grid, vol. PP,no. 99, pp. 1–1, 2017.
[7] H. Khani and M. R. D. Zadeh, “Real-time optimal dispatch andeconomic viability of cryogenic energy storage exploiting arbitrageopportunities in an electricity market,” IEEE Transactions on SmartGrid, vol. 6, no. 1, pp. 391–401, Jan 2015.
[8] H. Mohsenian-Rad, “Optimal bidding, scheduling, and deployment ofbattery systems in california day-ahead energy market,” IEEE Transac-tions on Power Systems, vol. 31, no. 1, pp. 442–453, Jan 2016.
[9] Y. Wang, X. Lin, and M. Pedram, “A near-optimal model-based controlalgorithm for households equipped with residential photovoltaic powergeneration and energy storage systems,” IEEE Transactions on Sustain-able Energy, vol. 7, no. 1, pp. 77–86, Jan 2016.
[10] T. T. Teo, T. Logenthiran, W. L. Woo, and K. Abidi, “Near-optimal day-ahead scheduling of energy storage system in grid-connected microgrid,”in 2018 IEEE Innovative Smart Grid Technologies - Asia (ISGT Asia),May 2018, pp. 1257–1261.
[11] C. Ju, P. Wang, L. Goel, and Y. Xu, “A two-layer energy managementsystem for microgrids with hybrid energy storage considering degrada-tion costs,” IEEE Transactions on Smart Grid, vol. 9, no. 6, pp. 6047–6057, Nov 2018.
[12] Y. Neo, T. Teo, W. Woo, T. Logenthiran, and A. Sharma, “Forecasting ofphotovoltaic power using deep belief network,” in Region 10 Conference,TENCON 2017 - 2017 IEEE, At Penang, Malaysia, Malaysia, 2017.
[13] V. De, T. T. Teo, W. L. Woo, and T. Logenthiran, “Photovoltaic powerforecasting using lstm on limited dataset,” in 2018 IEEE InnovativeSmart Grid Technologies-Asia (ISGT Asia). IEEE, 2018, pp. 710–715.
[14] T. T. Teo, T. Logenthiran, and W. L. Woo, “Forecasting of photovoltaicpower using regularized ensemble extreme learning machine,” in 2016IEEE Region 10 Conference (TENCON), 2016.
[15] T. T. Teo, T. Logenthiran, W. L. Woo, and K. Abidi, “Advanced controlstrategy for an energy storage system in a grid-connected microgrid withrenewable energy generation,” IET Smart Grid, vol. 1, no. 3, pp. 96–103,2018.
[16] M. R. Sandgani and S. Sirouspour, “Energy management in a network ofgrid-connected microgrids/nanogrids using compromise programming,”IEEE Transactions on Smart Grid, vol. PP, no. 99, pp. 1–1, 2017.
[17] R. Zhang and J. Tao, “Ga based fuzzy energy management system forfc/sc powered hev considering h2 consumption and load variation,” IEEETransactions on Fuzzy Systems, vol. PP, no. 99, pp. 1–1, 2017.
[18] H. Kanchev, F. Colas, V. Lazarov, and B. Francois, “Emission reductionand economical optimization of an urban microgrid operation includingdispatched pv-based active generators,” IEEE Transactions on Sustain-able Energy, vol. 5, no. 4, pp. 1397–1405, Oct 2014.
[19] A. Zhou, B.-Y. Qu, H. Li, S.-Z. Zhao, P. N. Suganthan, and Q. Zhang,“Multiobjective evolutionary algorithms: A survey of the state of theart,” Swarm and Evolutionary Computation, vol. 1, no. 1, pp. 32 – 49,2011.
[20] J. Horn, N. Nafpliotis, and D. E. Goldberg, “A niched pareto geneticalgorithm for multiobjective optimization,” in Proceedings of the FirstIEEE Conference on Evolutionary Computation. IEEE World Congresson Computational Intelligence, Jun 1994, pp. 82–87 vol.1.
[21] E. Zitzler and L. Thiele, “An evolutionary algorithm for multiobjectiveoptimization: The strength pareto approach,” 1998.
[22] K. Deb, A. Pratap, S. Agarwal, and T. Meyarivan, “A fast and elitistmultiobjective genetic algorithm: Nsga-ii,” IEEE Transactions on Evo-lutionary Computation, vol. 6, no. 2, pp. 182–197, Apr 2002.
[23] L. A. Pereira, S. Haffner, G. Nicol, and T. F. Dias, “Multiobjectiveoptimization of five-phase induction machines based on nsga-ii,” IEEETransactions on Industrial Electronics, vol. 64, no. 12, pp. 9844–9853,Dec 2017.
[24] P. Murugan, S. Kannan, and S. Baskar, “Application of nsga-ii algo-rithm to single-objective transmission constrained generation expansionplanning,” IEEE Transactions on Power Systems, vol. 24, no. 4, pp.1790–1797, Nov 2009.
[25] M. R. AlRashidi and M. E. El-Hawary, “A survey of particle swarmoptimization applications in electric power systems,” IEEE transactionson evolutionary computation, vol. 13, no. 4, pp. 913–918, 2009.
[26] M. A. Abido, “Multiobjective evolutionary algorithms for electric powerdispatch problem,” IEEE Transactions on Evolutionary Computation,vol. 10, no. 3, pp. 315–329, June 2006.
[27] Y. Del Valle, G. K. Venayagamoorthy, S. Mohagheghi, J.-C. Hernandez,and R. G. Harley, “Particle swarm optimization: basic concepts, variantsand applications in power systems,” IEEE Transactions on evolutionarycomputation, vol. 12, no. 2, pp. 171–195, 2008.
[28] N. Sinha, R. Chakrabarti, and P. Chattopadhyay, “Evolutionary program-ming techniques for economic load dispatch,” IEEE Transactions onevolutionary computation, vol. 7, no. 1, pp. 83–94, 2003.
[29] B. Ji, X. Yuan, and Y. Yuan, “Modified nsga-ii for solving continuousberth allocation problem: Using multiobjective constraint-handling strat-egy,” IEEE Transactions on Cybernetics, vol. 47, no. 9, pp. 2885–2895,Sept 2017.
[30] E. Masazade, R. Rajagopalan, P. K. Varshney, C. K. Mohan, G. K.Sendur, and M. Keskinoz, “A multiobjective optimization approach toobtain decision thresholds for distributed detection in wireless sensornetworks,” IEEE Transactions on Systems, Man, and Cybernetics, PartB (Cybernetics), vol. 40, no. 2, pp. 444–457, April 2010.
[31] K. Govindan, A. Jafarian, M. E. Azbari, and T. Choi, “Optimal bi-objective redundancy allocation for systems reliability and risk manage-ment,” IEEE Transactions on Cybernetics, vol. 46, no. 8, pp. 1735–1748,Aug 2016.
[32] S. Wang, Y. Tang, J. Shi, K. Gong, Y. Liu, L. Ren, and J. Li, “Designand advanced control strategies of a hybrid energy storage system forthe grid integration of wind power generations,” IET Renewable PowerGeneration, vol. 9, no. 2, pp. 89–98, 2015.
[33] A. Merabet, K. T. Ahmed, H. Ibrahim, R. Beguenane, and A. M. Y. M.Ghias, “Energy management and control system for laboratory scalemicrogrid based wind-pv-battery,” IEEE Transactions on SustainableEnergy, vol. 8, no. 1, pp. 145–154, Jan 2017.
[34] T. T. Teo, T. Logenthiran, W. L. Woo, and K. Abidi, “Intelligentcontroller for energy storage system in grid-connected microgrid,” IEEETransactions on Systems, Man, and Cybernetics: Systems, 2018.
[35] H. Ibrahim, A. Ilinca, and J. Perron, “Energy storage sys-tems—characteristics and comparisons,” Renewable and SustainableEnergy Reviews, vol. 12, no. 5, pp. 1221 – 1250, 2008.
[36] G. Syswerda, “Uniform crossover in genetic algorithms,” in Proceedingsof the 3rd international conference on genetic algorithms, 1989, pp. 2–9.
[37] B. L. Miller and D. E. Goldberg, “Genetic algorithms, tournamentselection, and the effects of noise,” Complex systems, vol. 9, no. 3,pp. 193–212, 1995.
[38] R. B. Agrawal, K. Deb, and R. Agrawal, “Simulated binary crossover forcontinuous search space,” Complex systems, vol. 9, no. 2, pp. 115–148,1995.
[39] K. Deep, K. P. Singh, M. L. Kansal, and C. Mohan, “A real codedgenetic algorithm for solving integer and mixed integer optimizationproblems,” Applied Mathematics and Computation, vol. 212, no. 2, pp.505–518, 2009.
[40] I. Papic, “Simulation model for discharging a lead-acid battery energystorage system for load leveling,” IEEE transactions on energy conver-sion, vol. 21, no. 2, pp. 608–615, 2006.
[41] C. Draxl, B. Hodge, A. Clifton, and J. McCaa, “Overview and mete-orological validation of the wind integration national dataset toolkit,”NREL/TP-5000-61740. Golden (CO): National Renewable Energy Lab-oratory (forthcoming), Tech. Rep., 2015.
[42] R. Wang, Z. Zhou, H. Ishibuchi, T. Liao, and T. Zhang, “Localizedweighted sum method for many-objective optimization,” IEEE Transac-tions on Evolutionary Computation, vol. PP, no. 99, pp. 1–1, 2016.
[43] J. C. Tee, T. Teo, T. Logenthiran, W. L. Woo, and K. Abidi, “Day-ahead forecasting of wholesale electricity pricing using extreme learningmachine,” in Region 10 Conference, TENCON 2017 - 2017 IEEE, AtPenang, Malaysia, Malaysia, 2017.
[44] M. Ceraolo, G. Lutzemberger, and D. Poli, “State-of-charge evaluationof supercapacitors,” Journal of Energy Storage, vol. 11, pp. 211 – 218,2017.
[45] K. Mansiri, S. Sukchai, and C. Sirisamphanwong, “Fuzzy controlalgorithm for battery storage and demand side power management foreconomic operation of the smart grid system at naresuan university,thailand,” IEEE Access, vol. 6, pp. 32 440–32 449, 2018.