Embed Size (px)
Citation preview

UNIVERSITY OF NAIROBI
OPTIMIZATION OF ACID ACTIVATION AND BLEACHING
PERFORMANCE OF LOCAL BENTONITE CLAY
By
EUPHROSINE UJENEZA
I56/79318/2012
A THESIS SUBMITTED IN PARTIAL FULFILLMENT OF THE
REQUIREMENTS FOR THE DEGREE OF MASTER OF SCIENCE IN
INDUSTRIAL CHEMISTRY OF THE UNIVERSITY OF NAIROBI.
2014

ii
DECLARATION
This thesis is my original work and has not been submitted for examination to any other
university.
……………………………………..
Euphrosine Ujeneza
This thesis has been submitted for examination with our approval as University
supervisors.
……………………………………..
Prof. Helen N. Njenga
Department of Chemistry
University of Nairobi
…………………………………….
Dr. Damaris N. Mbui
Department of Chemistry
University of Nairobi

iii
DEDICATION
This work is dedicated to the members of my family for inspiring me.

iv
ACKNOWLEDGEMENT
I am sincerely grateful to the Almighty God for the unconditional love, mercy and above all
his amazing grace throughout my academic life.
I would like to express my deepest gratitude to my supervisors Prof. Helen Njenga and Dr.
Damaris Mbui for their invaluable guidance and assistance which has enabled me to
successfully complete this thesis.
I would like to acknowledge all the academic and non-academic staff members of the School
of Physical Sciences. I am particularly grateful to Prof. David N. Kariuki for his assistance
and the technologists in the physical chemistry laboratory, Department of Chemistry for
offering me facilities to run the experiments.
Special thanks go to my family. Words cannot express how grateful I am to my father,
Apollinaire Karekezi and my mother Edith N. Habimana for all the sacrifices they have made
on my behalf. My gratitude also goes to my sisters and my brothers. They were always
supporting me and encouraging me with their best wishes.
And lastly, I wish to thank all the people who helped and contributed great ideas and advice
towards this project and especially, my classmate and close friends who supported and
encouraged me during the writing of this thesis so that I could achieve my goal.
May God Almighty bless all of you.
v
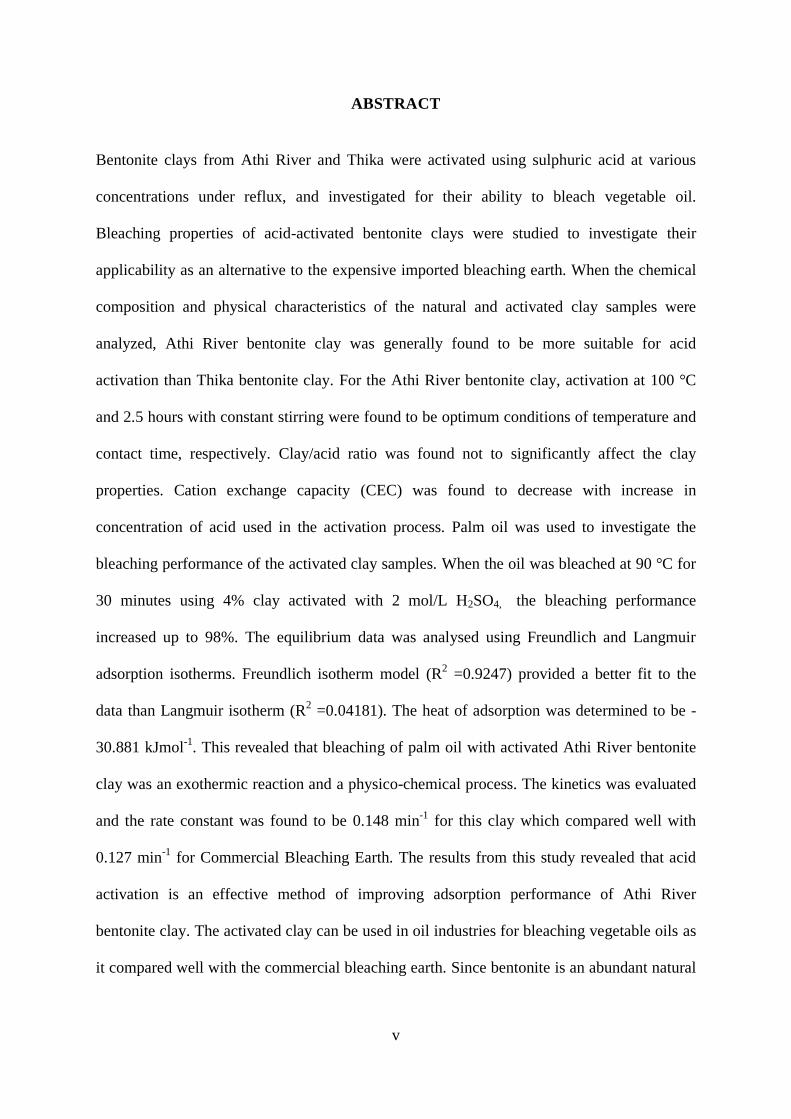
ABSTRACT
Bentonite clays from Athi River and Thika were activated using sulphuric acid at various
concentrations under reflux, and investigated for their ability to bleach vegetable oil.
Bleaching properties of acid-activated bentonite clays were studied to investigate their
applicability as an alternative to the expensive imported bleaching earth. When the chemical
composition and physical characteristics of the natural and activated clay samples were
analyzed, Athi River bentonite clay was generally found to be more suitable for acid
activation than Thika bentonite clay. For the Athi River bentonite clay, activation at 100 °C
and 2.5 hours with constant stirring were found to be optimum conditions of temperature and
contact time, respectively. Clay/acid ratio was found not to significantly affect the clay
properties. Cation exchange capacity (CEC) was found to decrease with increase in
concentration of acid used in the activation process. Palm oil was used to investigate the
bleaching performance of the activated clay samples. When the oil was bleached at 90 °C for
30 minutes using 4% clay activated with 2 mol/L H2SO4, the bleaching performance
increased up to 98%. The equilibrium data was analysed using Freundlich and Langmuir
adsorption isotherms. Freundlich isotherm model (R2 =0.9247) provided a better fit to the
data than Langmuir isotherm (R2 =0.04181). The heat of adsorption was determined to be -
30.881 kJmol-1
. This revealed that bleaching of palm oil with activated Athi River bentonite
clay was an exothermic reaction and a physico-chemical process. The kinetics was evaluated
and the rate constant was found to be 0.148 min-1
for this clay which compared well with
0.127 min-1
for Commercial Bleaching Earth. The results from this study revealed that acid
activation is an effective method of improving adsorption performance of Athi River
bentonite clay. The activated clay can be used in oil industries for bleaching vegetable oils as
it compared well with the commercial bleaching earth. Since bentonite is an abundant natural

vi
adsorbent, improving its properties by acid activation can make a cost effective adsorbent for
bleaching vegetable oils.
Keywords: Acid activation, Bentonite clay, Palm oil, Bleaching oil

vii
TABLE OF CONTENT
DECLARATION .................................................................................................................. ii
DEDICATION ..................................................................................................................... iii
ACKNOWLEDGEMENT .................................................................................................... iv
ABSTRACT ......................................................................................................................... v
TABLE OF CONTENTS .................................................................................................... vii
LIST OF ABBREVIATIONS .............................................................................................. xi
LIST OF FIGURES ........................................................................................................... xiii
LIST OF TABLES .............................................................................................................. xv
LIST OF APPENDICES .................................................................................................... xvi
CHAPTER ONE ................................................................................................................... 1
INTRODUCTION ................................................................................................................ 1
1.1 Background............................................................................................................. 1
1.2 Problem Statement .................................................................................................. 3
1.3 Justification............................................................................................................. 4
1.4 Objectives ............................................................................................................... 5
1.4.1 Overall objective .............................................................................................. 5
1.4.2 Specific objectives ........................................................................................... 5
1.5 Scope and limitation ............................................................................................... 5
CHAPTER TWO .................................................................................................................. 6
LITERATURE REVIEW ...................................................................................................... 6
2.1 Background On Bentonite Clay ............................................................................... 6
2.1.1 Bentonite Occurrence in Kenya ........................................................................ 6
2.1.2 Composition and properties of Bentonite clay .................................................. 7
2.2 Industrial Use Of Activated Bentonite Clay ............................................................. 9
2.2.1 Wastewater treatment ....................................................................................... 9
2.2.2 Catalyst .......................................................................................................... 10

viii
2.2.3 Edible Oils refining ........................................................................................ 10
2.2.4 Pharmaceutical, cosmetics and medicine ........................................................ 11
2.2.5 Paper.............................................................................................................. 11
2.2.6 Construction and civil engineering ................................................................. 11
2.3 Activation Methods of Clay Mineral ..................................................................... 12
2.3.1 Acid activation of bentonite clay .................................................................... 12
2.3.2 Pillaring treatment .......................................................................................... 15
2.3.3 Cationic surfactant treatment .......................................................................... 16
2.3.4 Thermal activation ......................................................................................... 16
2.3.5 Polymer modified clays .................................................................................. 16
2.4 Vegetable Oil ........................................................................................................ 16
2.4.1 Palm oil ......................................................................................................... 18
2.4.2 Methods of refining vegetable Oils ................................................................ 20
2.5 Bleaching of vegetable oil ..................................................................................... 21
2.5.1 Types of Bleaching Methods .......................................................................... 24
2.5.2 Freundlich isotherm ....................................................................................... 25
2.5.3 Langmuir isotherm ......................................................................................... 26
2.5.4 Bleaching Agents ........................................................................................... 27
2.5.5 Bleaching process .......................................................................................... 29
CHAPTER THREE ............................................................................................................. 31
MATERIALS AND METHOD ........................................................................................... 31
3.1 Materials ............................................................................................................... 31
3.2 Physical Characterization ...................................................................................... 31
3.2.1 Moisture Content ........................................................................................... 31
3.2.2 pH determination ........................................................................................... 32
3.2.3 Apparent bulk density determination .............................................................. 32
3.2.4 Cation exchange capacity (CEC) .................................................................... 32
ix
3.3 Chemical characterization of bentonite clay .......................................................... 33
3.4 Acid activation of bentonite clay ........................................................................... 33
3.4.1 Effect of acid concentration ........................................................................... 34
3.4.2 Effect of activation contact time ..................................................................... 34
3.4.3 Effect of temperature on activation ................................................................ 35
3.4.4 Effect of clay acid ratio .................................................................................. 35
3.5 Evaluation of bleaching performance of bentonite clay ......................................... 36
3.6 Analysis of the final product ................................................................................. 38
3.6.1 Oil retention (OR) .......................................................................................... 38
3.6.2 Free fatty acid (FFA) determination ............................................................... 38
3.6.3 Oil density (D) ............................................................................................... 39
CHAPTER FOUR ............................................................................................................... 40
RESULTS AND DISCUSSION .......................................................................................... 40
4.1 Chemical properties of the clay ............................................................................. 40
4.2 Physical characteristics ......................................................................................... 44
4.2.1 Moisture content determination ...................................................................... 44
4.2.2 Cation exchange capacity (CEC) .................................................................... 45
4.2.3 Density .......................................................................................................... 46
4.3 Maximum absorption wavelength (λmax) ............................................................. 49
4.4 Acid activation of bentonite clay ........................................................................... 49
4.4.1 Effect of acid concentration ........................................................................... 51
4.4.2 Effect of activation time ................................................................................. 52
4.4.3 Effect of activation on temperature ................................................................ 53
4.4.4 Effect of clay acid ratio .................................................................................. 54
4.5 Bleaching studies .................................................................................................. 54
4.5.1 Effect of bleaching contact time and acid concentration ................................. 55
4.5.2 Effect of temperature on bleaching of palm oil ............................................... 58

x
4.5.3 Effect of clay dosage on bleaching of palm oil ............................................... 59
4.6 Adsorption isotherms ............................................................................................ 62
4.6.1 Sample A2 isotherms ..................................................................................... 62
4.6.2 Sample T1 isotherms ...................................................................................... 63
4.6.3 CBE isotherms ............................................................................................... 65
4.7 Heat evolved during the bleaching process ............................................................ 66
4.7.1 Heat evolved during the bleaching of palm oil with A2 .................................. 67
4.7.2 Heat evolved during bleaching of palm oil with CBE ..................................... 68
4.8 Rate constant ........................................................................................................ 69
4.9 Analysis of final product ....................................................................................... 70
4.9.1 Oil retention (OR) .......................................................................................... 70
4.9.2 Free fatty acid (FFA) determination ............................................................... 71
4.9.3 Oil density ..................................................................................................... 72
CHAPTER FIVE ................................................................................................................ 73
CONCLUSIONS AND RECOMMENDATIONS ............................................................... 73
6.1 CONCLUSIONS .................................................................................................. 73
6.2 RECOMMENDATIONS ...................................................................................... 74
REFERENCES ................................................................................................................... 76
APPENDICES .................................................................................................................... 83
xi
LIST OF ABBREVIATIONS
A: Athi River
AAS: Atomic absorption spectrometer
ABD: Apparent bulk density
ABE: Activated bleaching earth
BP: bleaching performance
BPO: Bleached palm oil
CBE: Commercial Bleaching Earth
CCI: Cameron carbon incorporated
CEC: Cation exchange capacity
CaB: Calcium bentonite
CPO: Crude palm oil
D: Density
EPZA: Export processing zone authority
EUBA: European Bentonite Association
FAO: Food and Agriculture Organization
FFA: Free fatty acids
GOK: Government of Kenya
LOI: Loss on ignition
NaB: Sodium bentonite
OGA: Office of Global Analysis
OR: Oil retention

xii
SD: Standard deviation
T: Thika
USA: United State of America
UV-Vis: Ultraviolet visible
WWF: World Wide Fund
xiii
LIST OF FIGURES
Figure 2.1: Illustration of 2:1 phyllosilicate minerals ............................................................. 8
Figure 2.2: Structure of 2:1 phyllosilicate minerals indicating charge sites and different
locations of substitutions ..................................................................................................... 14
Figure 2.3: Industrial process of acid activation [Farihahusnah et al., 2011] ........................ 15
Figure 2.4: Vegetable oil production, consumption and trade in Kenya ............................... 18
Figure 2.5: Chemical and physical refining routes ............................................................... 21
Figure 2.6: Kenya's imports for decolorizing earth and fuller's earth, 1997-2007 (World
Integrated Trade Solutions, 2014)........................................................................................ 23
Figure 2.7: Quantity of Kenya‟s imports for decolorizing earth and fuller's earth, 1997-2007
(World Integrated Trade Solutions, 2014) ........................................................................... 23
Figure 2.8: Acid activated bentonite clay ............................................................................. 27
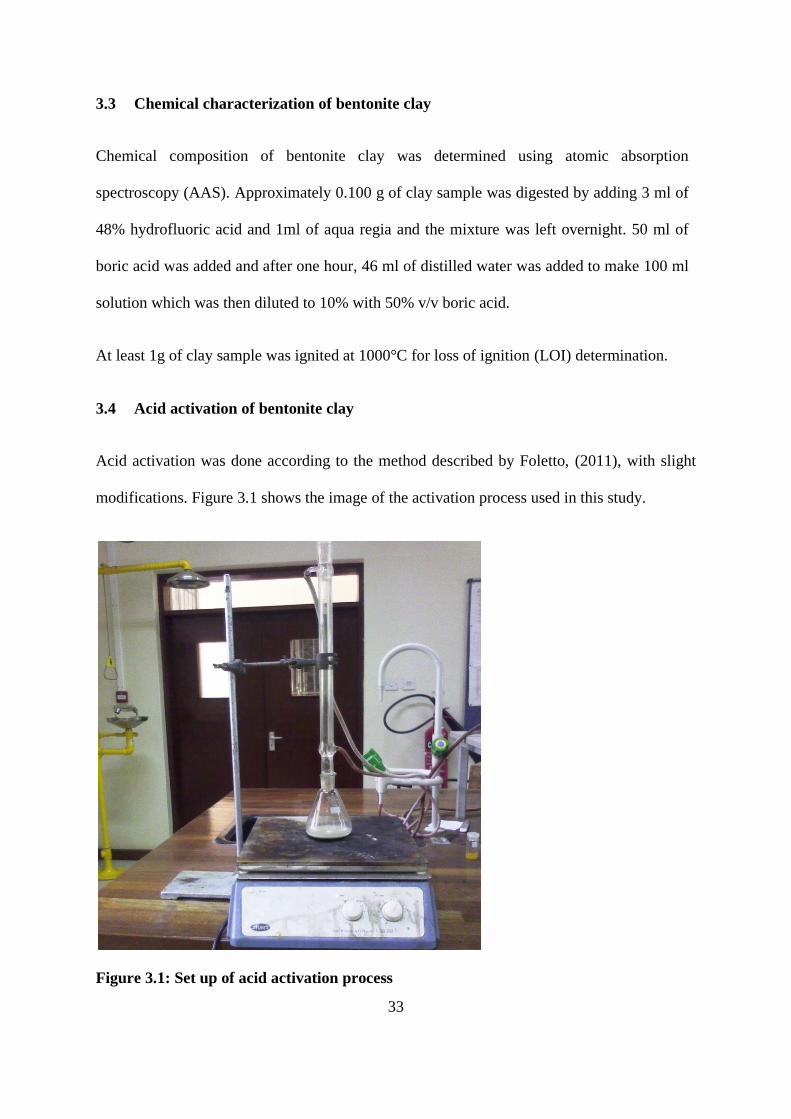
Figure 3.1: Set up of acid activation process ........................................................................ 33
Figure 3.2: Flow schematic diagram for acid activation of bentonite clay ............................ 36
Figure 3.3: Bleaching process unit ....................................................................................... 37
Figure 4.1: Chemical composition of raw Athi River (A) and Thika (T) bentonite clay ....... 43
Figure 4.2: Chemical composition of Athi River (A) and Thika (T) bentonite clay activated
with 2M H2SO4 ................................................................................................................... 44
Figure 4.3: Variation in cation exchange capacity of Athi River and Thika bentonite clays
with acid concentration ....................................................................................................... 46
Figure 4.4: Bulk density of Athi River bentonite against acid concentration ........................ 47
Figure 4.5: Bulk density of Athi River bentonite against clay/acid % ................................... 47
Figure 4.6: Bulk density of Thika bentonite against acid concentration ................................ 48
Figure 4.7: Bulk density of Thika against clay/acid ratio ..................................................... 48
Figure 4.8: A plot of absorbance versus wavelength of palm oil .......................................... 49
Figure 4.9: Raw (inactivated-left) and activated (right) A bentonite clays ............................ 50
Figure 4.10: Raw (inactivated-left) and activated (right) T bentonite clays .......................... 50
Figure 4.11: A plot of percent bleaching performance versus acid concentration ................. 51
Figure 4.12: Effect of activation contact time on the bleaching of palm oil .......................... 52
Figure 4.13: Variation of bleaching performance with time at different temperature ............ 53
Figure 4.14: Effect of clay/ acid ratio on bleaching performance of Athi River bentonite ..... 54
Figure 4.15: Crude palm oil (left) and bleached palm oil (right) .......................................... 55

xiv
Figure 4.16: Effect of contact time and acid concentration on bleaching of palm oil with 1%
A bentonite clay. ................................................................................................................. 56
Figure 4.17: Effect of bleaching time and acid concentration on bleaching of palm oil with
1% T bentonite .................................................................................................................... 56
Figure 4.18: Effect of contact time on bleaching of palm oil by 1% CBE ............................ 57
Figure 4.19: Effect of temperature on bleaching of palm oil by A bentonite and CBE ......... 59
Figure 4.20: Effect of A bentonite clay dosage on bleaching of palm oil.............................. 60
Figure 4.21: Effect of T bentonite clay dosage on bleaching of palm oil .............................. 60
Figure 4.22: Effect of CBE dosage on bleaching of palm oil ............................................... 61
Figure 4.23: Freundlich isotherm for bleaching process using A2 ........................................ 62
Figure 4.24: Freundlich isotherm for bleaching process on T ............................................... 63
Figure 4.25: Langmuir isotherm for bleaching process on T ................................................ 64
Figure 4.26: Freundlich isotherm for bleaching process on A2 ............................................ 65
Figure 4.27: Langmuir isotherm for bleaching process on CBE ........................................... 65
Figure 4.28: Plot ln Xe against 1/T for sample A2................................................................ 67
Figure 4.29: The plot of ln Xe against 1/T of CBE ............................................................... 68
Figure 4.30: A plot of ln (A/A0) against t0.5
for the bleaching of palm oil with 1% of clay (A2)
........................................................................................................................................... 69
Figure 4.31: A plot of ln (A/A0) against t0.5
for bleaching of palm oil with 1 % of CBE ....... 70

xv
LIST OF TABLES
Table 2.1: Chemical composition of CPO ............................................................................ 19
Table 4.1: Chemical composition (% oxide content) of raw and acid activated Athi River
bentonite clay and Commercial bleaching earth (CBE) ........................................................ 41
Table 4.2: Chemical composition (% oxide content) of raw and acid activated T bentonite
clay ..................................................................................................................................... 42
Table 4.3: Variation of moisture content with acid concentration ........................................ 44
Table 4.4: Freundlich and Langmuir isotherm constants for the bleaching of palm oil with A ,
T bentonite clay and CBE ................................................................................................... 66
Table 4.5: FFA content in CPO and BPO ............................................................................ 71
Table 4.6: Material characterization of the optimized Athi River (A) bentonite clay sample
and Commercial bleaching earth. ........................................................................................ 72
xvi
LIST OF APPENDICES
Appendix A: Wavelength, detection limits and optimum analysis ranges of chemical
composition analysed by AAS ............................................................................................. 83
Appendix B: Apparent bulk density of Athi River bentonite clay ........................................ 83
Appendix C: Apparent bulk density of Thika bentonite clay ................................................ 84
Appendix D: Moisture content of Athi River bentonite clay ................................................ 85
Appendix E: Moisture content of Thika bentonite clay ........................................................ 86
Appendix F: Percent bleaching performance (BP %) of Athi River bentonite clay at different
acid concentration ............................................................................................................... 87
Appendix G: Percent bleaching performance (BP %) of Athi River bentonite clay at different
contact time ......................................................................................................................... 87
Appendix H: Percent bleaching performance (BP %) of Thika bentonite clay at different
contact time ......................................................................................................................... 88
Appendix I: Percent bleaching performance (BP %) of Athi River bentonite clay at different
clay amount......................................................................................................................... 89
Appendix J: Percent bleaching performance (BP %) of Thika bentonite clay at different clay
amount ................................................................................................................................ 89
Appendix K: Percent bleaching performance (BP %) of Athi River bentonite clay at different
temperature ......................................................................................................................... 90
Appendix L: oil density after bleaching with prepared samples ........................................... 91
Appendix M: Titration of FFA ............................................................................................ 91
Appendix N: Sampling sites retrieved from exploratory soil map of Kenya ......................... 92
Appendix O: Kenya's imports of decolqourising earth and fuller's earth, 1997-2007 (World
Integrated Trade Solutions, 2014)........................................................................................ 93
Appendix P: Characteristics of palm oil .............................................................................. 94

1
1 CHAPTER ONE
INTRODUCTION
1.1 Background
Bleaching is an adsorption process that utilizes clay as adsorbent. It serves both cosmetic and
chemical purposes. It is used in refinery industries to stabilize the oil by removing coloured
and colourless pigments which tend to destabilize vegetable oils [Didi et al., 2009; Usman et
al., 2013].
Refining process comprises of several stages such as degumming, neutralization, bleaching
and deodorization [Al-Zahrani et al., 2000; Berbesi, 2006, CIWC, 2008, Farihahusnah et al.,
2011]. Bleaching is the most critical stage since it helps to improve the appearance, flavour,
taste and stability of the final oil products [Farihahusnah et al., 2011; Rohani et al., 2006].
The bleaching process can be carried out after degumming and neutralizing the vegetable oil
under specific conditions [Diaz and Santos, 2001].
Activated bleaching earth (ABE) is by far the most common adsorbent for oil purification.
Other adsorbents that have been tested for removal of pigment and impurities from oil
included activated carbon and silica based products [Ejikeme et al., 2013]. Oil industries in
Kenya use imported bleaching agents in spite of the fact that the raw material for ABE is the
abundantly available bentonite clay.
Bentonite clays are used widely as binding agent in foundry sand and iron ore palleterization.
Acid activated clays have been used as catalysts for a number of reactions of industrial
interests [Foletto et al., 2011; Didi et al., 2009, EUBA, 2011]. Activated clays have also been

2
utilized in paper industry, in sulphur production, for environment protection [Foletto et al.,
2011, EUBA, 2011], in food industries particularly in the bleaching of vegetable oils [Hassan
and Abel-khalek, 1998; Makhoukhi et al., 2009; Didi et al., 2009].
Bentonite is a versatile natural mineral, in class of smectite clays formed from alteration of
siliceous glass-rich volcanic rocks. It is primarily composed of montmorillonite. Industrial
bentonites are generally either the sodium or calcium variety [Hassan and Abel-khalek, 1998;
Nadežda et al., 2011; Basim, 2011]. Calcium bentonite (CaB) is not a very good adsorbent
and is, therefore, activated to develop a capacity to adsorb colouring matter and other
impurities dissolved in oils (vegetables, animals and petroleum matter) [Diaz and Santos,
2001]. In this study, only acid activation of CaB has been optimized. It has been reported that
clays which contain high proportions of montmorillonite and which are poor in natural
bleaching potency are suitable for activation [Oboh et al, 1987, Usman et al., 2013 and
Makhoukhi et al, 2008]
Bentonites are found in nature abundantly. However, most of them need to undergo
appropriate physical or chemical treatments such as acid activation, ion exchange and heating
in order to increase surface properties, adsorption capacity, and range of applicability
[Kariuki, 1996; Rossi et al., 2003; Rožic et al., 2010, Foletto et al., 2011]. Ajemba and
Onukwuli (2013) observed that activated clay adsorb colour pigments more than inactivated
clay. Farihahusnah et al., 2011 have reported that the high bleaching performance of
bleaching earth depends on the activation treatment which results in structural modification.
The modified clay minerals have a high potential of serving as an alternative to the most
widely used high-cost activated carbon [ Ajemba and Onukwuli, 2013].

3
During acid activation, initially interlayer cations are replaced with H+ ions followed by
partial destruction of aluminium octahedral sheets with subsequent dissolution of structural
cations [Komadel et al., 1990; Korichi et al., 2009; Rossi et al., 2003; Rožic et al., 2010]. A
study by Usman et al., (2013) reported that acid activation depends considerably on the
conditions of activation such as acid concentration, contact time and the temperature of the
activation process.
Many studies have reported successful bleaching of oil using acid activated clays from across
the World [Usman et al., 2013; Makhoukhi et al., 2008, Diaz and Santos, 2001] but few have
been carried out using local Kenya clay [Kariuki, 2013].
The purpose of this study was to characterize the local bentonite clays and to investigate
optimum conditions for acid activation. The bleaching performance was to be based on palm
oil because it is the most widely used vegetable oil in Kenya.
1.2 Problem Statement
Bleaching is an important process in oil refining industries. It removes pigments and other
impurities which negatively influence the taste of oils [Makhoukhi et al., 2009]. Bleaching of
oil is done by the use of adsorbents such as activated carbon and the less expensive activated
bleaching earths. The latter is produced from clays which contain high proportions of
montmorillonite through acid activation [Usman et al., 2013; Makhoukhi et al., 2008].
Natural clays which are locally available in abundant quantities have potential to undergo
modification to enhance the surface area, adsorption capacity for use in a range of
applications including bleaching earth, catalyst beds, carbonless copy paper and medication
[Usman et al., 2013]. In order to promote value addition of natural resources, for example

4
bentonite clay, a number of physical and chemical methods have to be investigated in order to
ameliorate the adsorption properties and increase its applicability.
In Kenya, few studies have been reported on the activation of bentonite clay [Omondi, 2012;
Kariuki, 2013], and the results demonstrated that sulphuric acid was more efficient than
hydrochloric acid. However, studies on physico-chemical characteristic of activated clay and
adsorption power need more investigation. Therefore, the aim of this study was to activate
local bentonite by acid treatment, and to evaluate the product for oil bleaching performance
in comparison with commercial bleaching clay.
1.3 Justification
Acid activation for clay has been reported to be an effective process to improve adsorption
property of clay [Foletto et al., 2011]. Clays in their activated forms are extensively used in
the fats and oil industries in the production of vegetable oil.
Kenya‟s national demand of edible oil is continuously increasing. Thus, the government of
Kenya (GOK) together with the Food and Agriculture Organization (FAO), other government
organizations and the private sector have initiated the development of raw material centre in
the country [EPZA, 2005 and OGA, 2009]. The commercial bleaching earth used is for the
most part imported by the refining industries. Therefore, it is important to investigate the use
of natural clay deposits for their potential in making substitutes for this purpose. Besides
developing a cost effective method for improving adsorbent properties of native clay,
commercial exploitation of the clay will increase income and reduce imports thus
contributing to the GOK‟s vision of food self sufficiency by 2030.

5
1.4 Objectives
1.4.1 Overall objective
The main objective of this study was to enhance and optimize the bleaching activity of
selected native bentonite clays.
1.4.2 Specific objectives
1. To characterize various local clays with respect to acid activation
2. To monitor the variation of some physicochemical properties with respect to
activation
3. To investigate the bleaching performance of activated bentonite clays
4. To carry out a comparative study of the activated clay vis-a vis commercial bleaching
earths with respect to industrial application
1.4.3 Scope and limitation
The scope of this project was laboratory-scale investigation of activation potential of two
bentonite clays obtained from Athi River and Thika respectively using sulphuric acid. Only
200-mesh clay particle size was used. After the initial activation studied, more work was to
be carried on the clay that gave better performance than the other. Palm oil was used to test
the performance of the activated clay with regard to pigment removal. Apart from
degumming, no other oil refining processes were carried out on the oil before it was used for
the bleaching tests. Also, the effects of such oil characteristics as viscosity on bleaching
performance were not studied. The study did not include regeneration of the clay after
bleaching.
6
2 CHAPTER TWO
LITERATURE REVIEW
2.1 Background On Bentonite Clay
The term bentonite was first used to designate a particular, highly colloidal, plastic clay found
near Fort Benton in the Cretaceous beds of Wyoming, USA [Kutlic et al., 2012]. Later the
term was attributed to every plastic clay generated by the alteration of organic ash or glass
emitted from volcanoes [Nadežda et al., 2011; Basim 2011]. Bentonite is a part of smectite
clay minerals, which is mainly composed of montmorillonite [Kutlic et al., 2012]. They are
generally classified as sodium (Na), calcium (Ca), potassium (K) and aluminium (Al)
depending on the dominant element. Of these elements, Na and Ca bentonites possess some
physical properties, which make them valuable to a great variety of industries [Olugbenga et
al., 2013; Nadežda et al., 2011]. Na bentonite clays have extensive water absorption
properties, accompanied by swelling and ability to remain suspended in water for long
periods of time. Ca bentonite clays do not show swelling properties [Kutlic et al., 2012] and
forms colloidal suspensions very quickly [Basim, 2011]. Clays have been widely investigated
because of their potential application in many fields such as adsorbents in the bleaching of
edible oils, purification of discharge waters, medication and in the preparation of pillared
clays and organoclays [Diaz and Santos, 2001; Usman et al., 2013].
2.1.1 Bentonite Occurrence in Kenya
In Kenya, we find bentonite clays (CaB) in different parts of the country, such as Athi River,
Amboselli, Timau, Nanyuki, Meru and Namanga among others [Mutisya et al., 2011].
Mineralogical and X-ray diffraction tests that have been done on samples of different clays
7
occurring in Kenya have shown a low swelling potency in water. Thus according to the
particular usage, for example, when NaB is of interest (electrochemistry), these clays are
converted to NaB by addition of soda ash before use [Kariuki, 1996]. The fact that CaB clays
are available and inexpensive qualifies them as an important candidate in acid activation
studies. By improving their properties, they could possibly satisfy local demand for bleaching
oil and other uses as well as earn the government of Kenya (GOK) the much needed foreign
exchange through cross border trade.
2.1.2 Composition and properties of Bentonite clay
Clay minerals are small fragments of hydrous layer silicates. The most important of these
minerals are kaolinite, montmorillonite, illite vermiculite and chlorite, each having specific
characteristics [Ejikeme et al., 2013]. The bentonite clay consists essentially of
montmorillonite. The swelling type or sodium bentonite (NaB) has a single water layer
particles containing Na+ as an exchangeable ion. Calcium bentonite (CaB), which is non-
swelling type, has double layer particles with Ca2+
as an exchangeable ion [Kutlic et al.,
2012]. Therefore, a description and discussion of montmorillonite is applicable to bentonite
[Basim, 2011].
Chemically, montmorillonite is described as a hydrous aluminium silicate and is classified
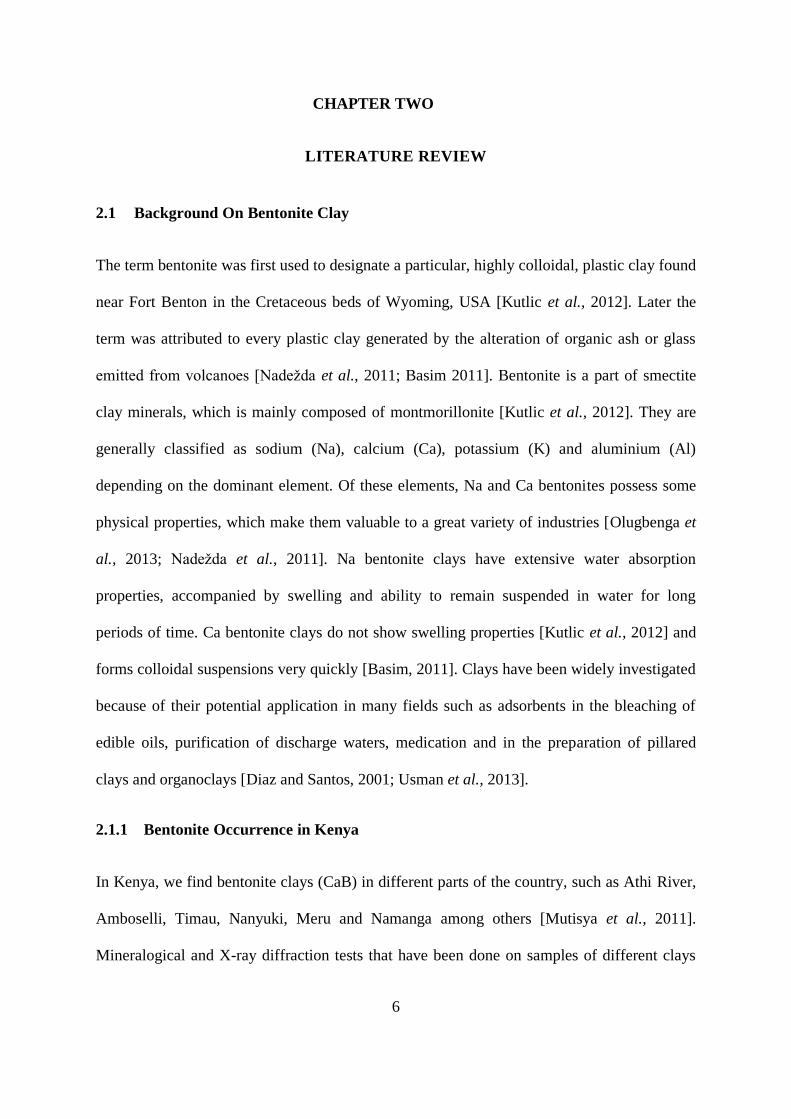
under phyllosilicates; (Al,Mg)2(OH)2(Si,Al)4O10Cax.nH2O. Its structure is made of two basic
building blocks, an edge-linked octahedral sheet and a corner-linked tetrahedral sheet, with a
2:1 relationship between tetrahedral and octahedral sheets [Nadežda et al., 2011; Basim,
2011]. Each tetrahedron consists of Mx+
cation, coordinated to four oxygen atoms. The
dominant Mx+
cation in the tetrahedral sheet is Si4+
, but Al3+
substitutes Fe3+
occasionally
(Figure 2.1).
8
Chemical analysis of the composition of bentonite shows considerable variation with SiO2
ranging between 45 and 65%, Al2O3 from 17 to 25% and Fe2O3 up to 12%. It has been found
that clays turn towards non-swelling type if CaO content is 1% or more, or if MgO content in
form of exchangeable ions is above 2.5% [Kutlic, et al, 2012].
Figure 2.1: Illustration of 2:1 phyllosilicate minerals
[Sipag Bisalta, retrieved on 10th
October 2014]
Bentonite clays are valued for their physical properties such as shape and size, thixotropy,
adsorbent properties, cation exchange capacity (CEC), plasticity, high bonding strength,
hydration and swelling capacity [Olugbenga et al., 2013; Nadežda et al., 2011; Rossi et al.
2003]. Some properties of these clays are improved commonly with mineral acid activation

9
for applications in purification, decolourization and stabilization of vegetable oils with
respect to market consumption [Nadežda et al., 2011]. Therefore, it is important to examine
the qualitative properties of bentonite and to determine the mineral composition and
physicochemical parameters which control their behaviour. Europian Bentonite Assosiation
(EUBA) qualitatively distinguishes five types of bentonite: Ca bentonite, activated bentonite,
natural Na bentonite, organofilic bentonite and acid activated bentonite [Kutlic et al., 2012].
2.2 Industrial Use of Activated Bentonite Clay
Natural CaB has some bleaching action useful in activities such as oil refining,
pharmaceutical preparation, catalyst, and sugar refining. Its bleaching power can be increased
manifold by treatment with strong mineral acid such as sulphuric or hydrochloric acid. There
are many others uses but the major use for activated clay is for refining oils [Makhoukhi et
al., 2009].
Acid activated bentonites have been used as solid acid catalysts and catalyst supports of
organic applications that require an extreme degree of reaction control of considerable
industrial interest [Didi et al. 2009, Foletto, et al., 2011].
2.2.1 Wastewater treatment
Wastewater treatment can be achieved by chemical precipitation, ion exchange, adsorption,
membrane filtration, and electrodialysis. Among these methods, chemical precipitation is the
most common technique. But adsorption is an alternative technology for metal separation
from aqueous solutions. Activated clay is used in the removal of heavy metals and dyes from
wastewater [Resmi et al., 2012; Qingliang et al., 2013]; for example it has been used to
remove cobalt from wastewater [Al-shahrani, 2013].
10
It has been shown that acid activated bentonite clay can also be used in petrochemical
wastewater pre-treatment for the removal of ammonium compounds and phosphorous ions.
Such ions-saturated bentonite can be used as a mineral fertilizer or as an additive for cattle
fodder [Buic and Zelic, 2009].
2.2.2 Catalyst
Activated montmorillonite is used to catalyse various chemical reactions such as cracking of
petroleum to increase the yield and the quality of gasoline from petroleum. In addition, the
montmorillonite is used as an alkylation catalyst of phenols and as delicate pH adjuster
[Hartwell, 1965]. Vijayakumar et al., (2009) have reported high efficient catalyst for
esterification of various carboxylic acids with phenol alcohols made from acid activated
Indian bentonite.
2.2.3 Edible Oils refining
In vegetable fats and oils industries, bentonite is utilized in the removal of impurities, where
its adsorptive properties are crucial [ EUBA, 2011].
Mineral oils such as lubricating oils and other hydrocarbons are refined by treatment with
activated bleaching clays. The unburned fuel is stripped off by steam, and the oil-soluble
impurities, which are corrosive and gum-forming, are removed by the bleaching earth
[Hartwell, 1965]. Besides removing pigments and other impurities such as soap, trace metals
and phosphatides, the clay also reduces the oxidation products [Langmaack and Eggers,
2002]. Bentonite is also used as a clarification agent in drinks such as beer, wine and mineral
water and in products like sugar or honey [ EUBA, 2011]
11
Most of these oils are refined in vegetable oil refineries in Kenya using imported bleaching
agent. This prompted the need to investigate the optimization of adsorption capacity of
natural bentonite clays in this project.
2.2.4 Pharmaceutical, cosmetics and medicine
Due to its adsorptive properties, bentonite is used as a filler in pharmaceuticals because it
allows paste formation. In medicine, it is used as an antidote in heavy metal poisoning.
Bentonite is also used in production of personal care products such as sunburn cream, baby
and face powder, etc.[ EUBA, 2011].
2.2.5 Paper
Bentonite is crucial to paper making for pitch control and in paper recycling where it offers
useful de-inking properties. In addition, acid activated bentonite is used in the manufacture of
carbonless copy paper as active component [ EUBA, 2011].
2.2.6 Construction and civil engineering
Bentonite is traditionally used as a thixotropic, support and lubricant agent in diaphragm
wall, foundation and pipe jacking. It is also used in cement and mortars due to its viscosity
and plasticity [EUBA, 2011]. It is conventionally used as mud constituent in oils and water-
well drilling mainly to seal the borehole walls, to remove drill cuttings and to lubricate the
cutting head. In Kenya, it is mostly used as drilling mud [Mutisya et al., 2011].

12
2.3 Activation Methods of Clay Mineral
Generally, activation is a chemical or physical treatment applied to certain types of clays to
improve the capacity to adsorb colouring matter and other impurities in oils and solutions
[Farihahusnah et al., 2011].
2.3.1 Acid activation of bentonite clay
Bentonite clays are found abundantly in nature; however most of them can be modified in
different ways such as acid activation, ion exchange and heating in order to promote their
surface properties [Korichi et al., 2009, Ejikeme et al., 2013].
Acid activation of bentonite is an important process for modifying the physical and chemical
properties of the clay [Diaz and Santos, 2001; Korichi et al., 2009]. Acid activated bentonite
is a bentonite whose structure has been dissolved by treatment mostly with inorganic acids.
Depending on degree of activation, Ca2+
, Mg2+
and Na+ are mostly replaced by H
+, while Al,
Fe, Mg and Si are dissolved from the lattice [Kutlic et al., 2012].
The acid activation of clays is usually made on non-swelling types [Diaz and Santos, 2001].
In addition, it has been reported that natural bentonite clays are generally less efficient in the
removal of impurities. However, the activated clays are more effective [Farihahusnah et al.,
2011]. Acid activation of CaB clay result in an important increase in the specific surface area,
increase in acids centres and ion exchanges, and consequently makes it an excellent adsorbent
[Makhoukhi et al., 2009].
Acid activation process 2.3.1.1
Acid activation is complex and involves a series of chemical reactions, resulting in strongly
protonated clay mineral surface and increased specific surface area. Activation proceeds with
13
partial dissolution of bentonites and includes an initial replacement of exchangeable cations
by protons (H+); indeed Al
3+, Mg
2+and Fe
2+ cations are extracted from octahedral and
tetrahedral sheets and are also replaced by H+, with subsequent release of the structural
cations as salts of the mineral acid, as shown in Figure 2.2 which indicates the site of
substitution. This attack alters the structure, chemical and physical properties of the clay
while increasing the adsorption capacity [Korichi et al., 2009; Rossi et al., 2003; Rožic et al.
2010]. Didi et al., 2009 examined the bleaching capacity and optimized acid activation of
bentonites from Algeria and found that acid concentration and activation time influence
greatly the bleaching capacity of bentonite. Despite numerous studies, no definite relationship
exists between the performance of the acid activated clay and the composition or properties
of the original clay. Hence, each clay has to be specifically activated and tested for its
performance [Foletto, et al., 2011].
14
Figure 2.2: Structure of 2:1 phyllosilicate minerals indicating charge sites and different
locations of substitutions
[Farihahusnah et al., 2011].
The acid attack plays an important role to enhance the adsorption capacity of bentonite clay.
Generally, raw bentonite sample is washed and crushed before treatment with a mineral acid
at fixed temperature and contact time with constant stirring. When activation is completed,
the mixture is filtered, washed several times with distilled water and then dried. The dried
clay is sized and kept for future applications [Ajemba and Onukwuli, 2013 and Usman et al.,
2013]. The simplified flow diagram of the process for the production of acid activated
bleaching earth is illustrated in Figure 2.3 below.
15
Figure 2.3: Industrial process of acid activation [Farihahusnah et al., 2011]
Factors affecting acid activation process 2.3.1.2
Acid activation is mostly affected by the following factors [Farihahusnah et al., 2011]:
Nature of the natural clay
Contact time
Temperature
Acid concentration and
Type of acid used for activation.
2.3.2 Pillaring treatment
Pillaring is a method which alters the properties of bleaching earth by using combination of
chemical and physical treatment. Pillared clays are produced by calcinations of the
exchangeable oxacations (for example Al, Cr, Ga, Si, Ce,) for use as adsorbents or catalysts,
especially in production of fuel by cracking vegetable oils [Kloprogge et al., 2005].
Mining Crushing Acid
treatment Washing
Filtering Drying Grinding Sizing

16
2.3.3 Cationic surfactant treatment
Organic surfactants are adsorbed by montmorillonite to form „organo-montmorillonite
complex‟. These hydrophobic complexes are used as adsorbents of organic pollutant and as
components in the synthesis of clay-polymer nanocomposites as low cost organoclays
[Hongping et al., 2010].
2.3.4 Thermal activation
Thermal activation of clay mineral is a physical treatment process which involves calcination
of clays at high temperatures. It removes impurities and moisture content in clay particles
[Ajemba, 2012].
2.3.5 Polymer modified clays
Polymer modified clays are generally formed by physical adsorption, chemical grafting or ion
exchange with surfactants. It enhances the physical and chemical properties, but does not
affect the structure [Peng, 2007].
2.4 Vegetable Oil
Oils are usually obtained from animal tissues. Most vegetable oils are from seeds and fruits.
Vegetable oils and fats contain the highest source of energy per unit mass than any other
nutrient and are carriers of fat-soluble vitamins [Fortification basics, 2014]. They are used in
the production of shortening, margarines, frying oils, and other edible products, as well as in
food manufacturing. Besides the food industry, they also have applications in oleo-chemical,
leather, paint, rubber, textile and pharmaceutical industries [Gunstone, 2002].
17
Edible oils in Kenya represent the second important import after petroleum oils [EPZA,
2005]. The increase in consumption of vegetable is considerable, and therefore, the
government of Kenya (GOK) has invested in both plantation of oilseeds and in the
importation of crude vegetable oils [OGA, 2009]. Malaysia is the main supplier as it sells at a
lower price than other world markets [OGA, 2009]. Kenya has considerable opportunities for
boosting local production in terms of conducive climate and a range of annual and perennial
oil seed crops. Hence, GOK and Food and Agriculture Organization (FAO) have promoted
traditional crops in western Kenya such as coconut, groundnuts, sunflower, soybeans, palm
oil, cotton seed and maize. Figure 2.4 shows the production, consumption and trade of
vegetable oil in Kenya [EPZA, 2005; OGA, 2009]. Kenya embassy in Brussels has reported
that services that enhance the production of industrial crop such as oil seeds are among the
main stay of Kenya‟s economy with abundant opportunities
[www.kenyabrussels.com/Investment_Opportunities, retrieved on 17th
September 2013].
Office of global analysis (OGA) in 2009 has reported that about 30 Kenyan companies refine
vegetable oilseeds with the largest of them crushing about 100 tons of oilseeds per day, while
refining another 800 tons of oils per day. The five largest companies process over 550 000
tons of oilseeds and crude oils per year. Therefore, using activated clay from locally available
bleaching earth is an advantage to the country‟s economy and the entire society.

18
Figure 2.4: Vegetable oil production, consumption and trade in Kenya
[OGA, 2009]
2.4.1 Palm oil
Palm oil (Elaeis guineesis), one of the most important oil producing plants originated from
West Africa. In 2012, The World Wide Fund for nature (WWF) reported that, among 17 oils
and fats on the global market, palm oil has emerged as the leader, accounting for
approximately a third of the world‟s edible oil production. The main areas of palm oil
production are Malaysia, Indonesia, Africa and Latin America [WWF, 2012].
Oil extracted from palm nut is termed crude palm oil (CPO). It is a raw material for products
such as cooking oil, margarine and shortening but also has non-food applications in soap,
detergent, and cosmetics production [Rohani et al., 2006].

19
Table 2.1 shows the composition of crude palm oil which has 5 main chemical groups
[Ejikeme et al., 2013].
Table 2.1: Chemical composition of CPO
Group Components in the group
Oil -Triglycerides, diglyceride , monoglyceride
- Phospholipids, glycolipid and lipoprotein
- Free fatty acids
Oxidized Products
- Peroxides, aldehydes, ketones, furfurals
(from sugars)
Non-oil (but oil soluble)
- Carotene
- Tocopherols
- Squalene
- Sterols
Impurities
- Metal particles
- Metal ions
- Metal complexes
Water Soluble
- Water (moisture)
- Glycerol
- Chlorophyll pigments
- Phenols
- Sugars (soluble carbohydrates)
The pigmentation of fruits is related to their stage of maturity. The ripe palm is extracted and
the resulting oil has a rich orange-red colour due to its high content of carotene. The major
20
saturated fatty acids that compose CPO is palmitic acid (C16) 44.3% which is balanced by
almost 38.7% monosaturated oleic acid (C18) and 10.5% polyunsaturated linoleic acid (C18).
The reminder is largely stearic (C18) 4.6% and myristic (C14) 1% acids [Mukherjee and Mitra,
2009].
CPO contains impurities such as organic pigments, soaps, oxidation metals and trace metals.
These impurities have negative impacts on the taste and smell of the oil as well as on its
appearance and shelf life stability which reduces consumer acceptance and marketability,
hence the need for removal through refining [Usman et al., 2013, Ejikeme et al., 2013]. In
addition, CPO has a very low smoke point, which can be removed if the oil can be bleached
to remove impurities [Ajemba and Onukwuli, 2013].
2.4.2 Methods of refining vegetable oils
Refining process is a necessary step for production of edible oil and fats products. The aim of
this process is to remove coloured material, impurities such as gums (phosphatides), traces of
metal and free fatty acids which may produce oxidation products leading to degeneration and
short life of the finished product [Barbesi, 2006, Usman et al., 2013].
It is important to have proper refining process in order to produce high quality finished
product with specified quality range that meet user‟s requirements. There are basically two
types of refining processes available in the vegetable oils industries, namely, chemical and
physical refining [Farihahusnah et al., 2011; Rossi et al., 2003]. These processes differ in the
type of chemicals used and the mode of removing the free fatty acid. These processes
comprise of several stages such as degumming, neutralization, bleaching and deodorization
[Farihahusnah et al., 2011, Berbesi, 2006]. The processing routes for chemical and physical
refining are as illustrated in Figure 2.5 below.

21
Figure 2.5: Chemical and physical refining routes
Among these stages, bleaching is the most critical phase since it helps to improve the
appearance, flavour, taste and stability of the final oil products [Rossi et al., 2003].
2.5 Bleaching of vegetable oil
Bleaching stage of the refining process is regarded as the most important step in fats and oil
refining, as it is designed to remove not only pigments (colour-producing substances), but
also a wide range of other impurities; it guarantees an excellent quality of the final products
[Langmaack and Eggers, 2002] and it is also a cost intensive process for refining vegetable
oils attributed to use of bleaching agent. Bleaching basically consist of impurities and
colouring matter adsorption by means of bleaching agents. This consists of bringing the oil

22
into contact with adsorbent mineral clay. In vegetable oil industry, they usually use acid
activated bleaching earth (bentonite), natural bleaching earth, activated carbon and synthetic
silicates [Rohani et al., 2006].
During the bleaching process, the oil is brought into contact with surface active substances
that adsorb undesired particles. The adsorbent and the adsorbed are filtered off, and the oil
leaves the plant with the desired colour. As a consequence, the quality of the oil is stabilised,
since precursors and catalysts of autoxidation are removed [Langmaack and Eggers, 2002].
Activated clay may act as a catalyst for oxidation in the presence of oxygen at elevated
temperatures. The oxidation products lead to degeneration and short shelf life of the final
product [Usman et al., 2012]. Therefore the bleaching process is carried out either under
steam/ nitrogen blanket or vacuum.
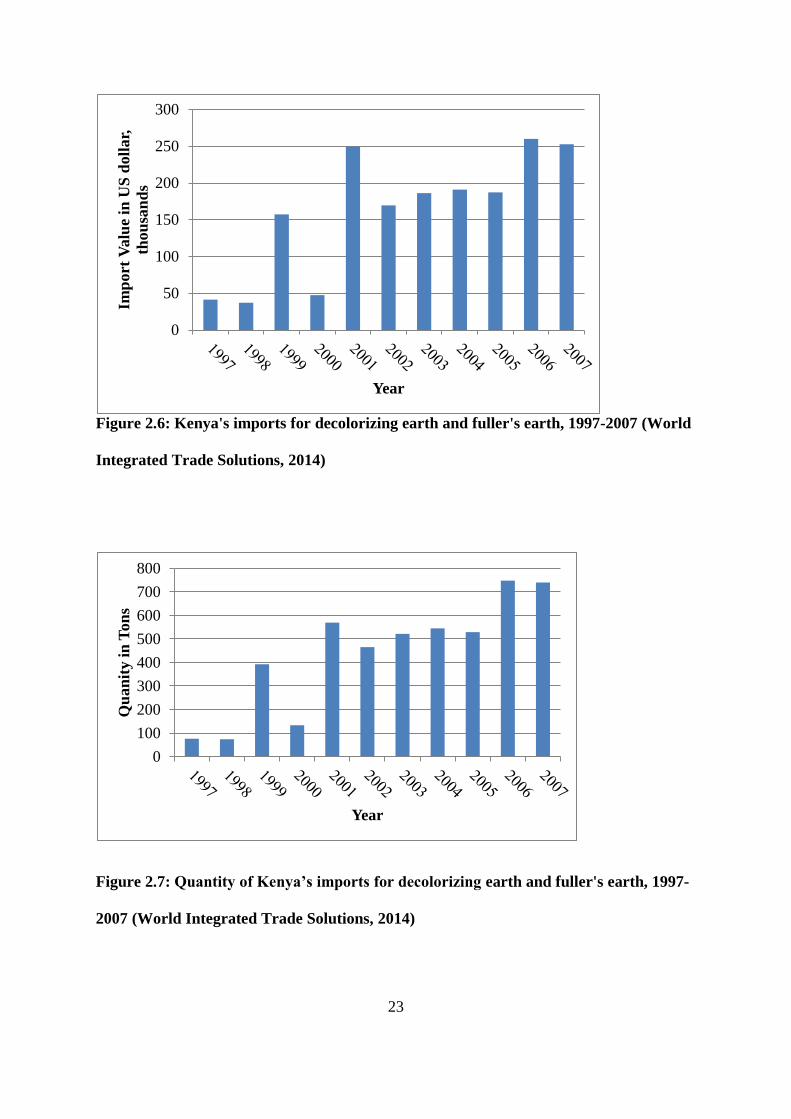
Figure 2.6 shows annual imports of bleaching earth in Kenya. Between 1997 and 2007, the
importation cost increased about five times. The amount imported rose from 76 tons to 740
tons during the same period as shown in Fig. 2.7 [World Integrated Trade Solutions, 2014].
Information from Kapa Oil Refineries, one of the vegetable refiners in Kenya indicated the
cost of activated bleaching in 2013 was 46 Kenya shillings exclusive of value added tax.
23
Figure 2.6: Kenya's imports for decolorizing earth and fuller's earth, 1997-2007 (World
Integrated Trade Solutions, 2014)
Figure 2.7: Quantity of Kenya’s imports for decolorizing earth and fuller's earth, 1997-
2007 (World Integrated Trade Solutions, 2014)
0
100
200
300
400
500
600
700
800
Qu
an
ity i
n T
on
s
Year
0
50
100
150
200
250
300Im
port
Valu
e in
US
doll
ar,
thou
san
ds
Year
24
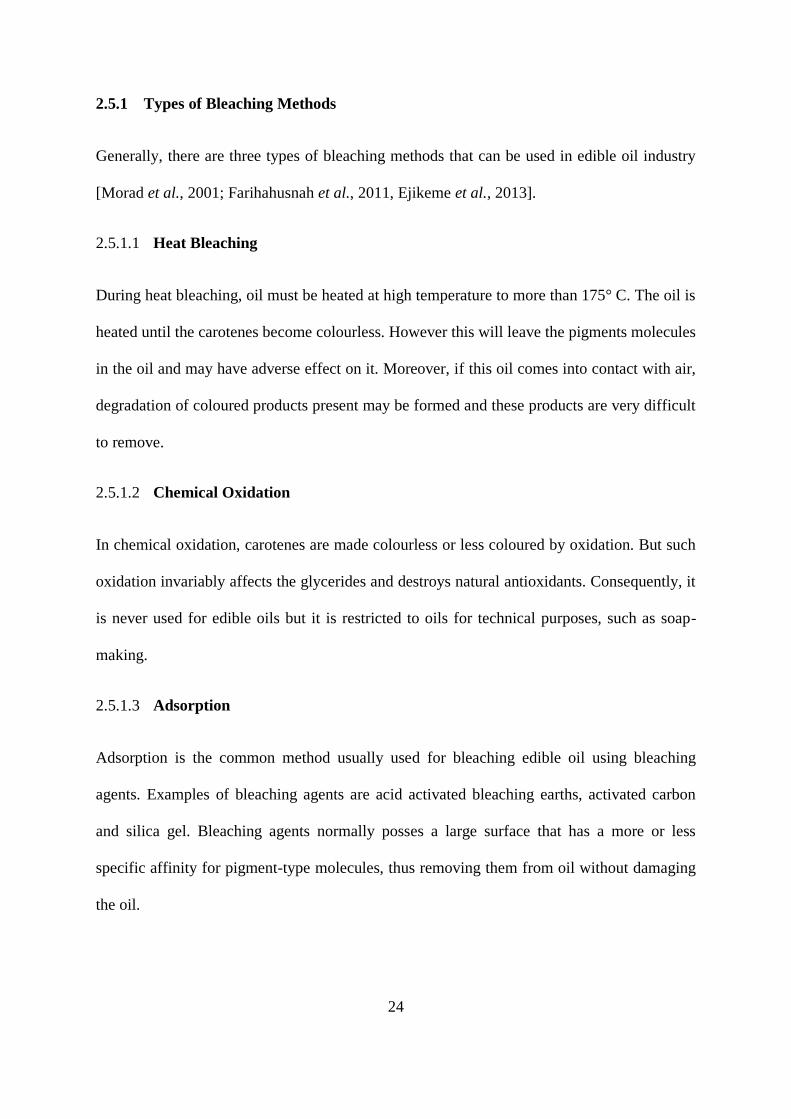
2.5.1 Types of Bleaching Methods
Generally, there are three types of bleaching methods that can be used in edible oil industry
[Morad et al., 2001; Farihahusnah et al., 2011, Ejikeme et al., 2013].
Heat Bleaching 2.5.1.1
During heat bleaching, oil must be heated at high temperature to more than 175° C. The oil is
heated until the carotenes become colourless. However this will leave the pigments molecules
in the oil and may have adverse effect on it. Moreover, if this oil comes into contact with air,
degradation of coloured products present may be formed and these products are very difficult
to remove.
Chemical Oxidation 2.5.1.2
In chemical oxidation, carotenes are made colourless or less coloured by oxidation. But such
oxidation invariably affects the glycerides and destroys natural antioxidants. Consequently, it
is never used for edible oils but it is restricted to oils for technical purposes, such as soap-
making.
Adsorption 2.5.1.3
Adsorption is the common method usually used for bleaching edible oil using bleaching
agents. Examples of bleaching agents are acid activated bleaching earths, activated carbon
and silica gel. Bleaching agents normally posses a large surface that has a more or less
specific affinity for pigment-type molecules, thus removing them from oil without damaging
the oil.

25
2.5.2 Freundlich isotherm
Mathematically, the bleaching process follows Freundlich adsorption isotherm [Rohani et al.,
2006]. Adsorption is the equilibrium relationships between the concentration in the fluid
phase and the concentration in the adsorbent particles at a given temperature [Rossi et al.,
2003]. The mathematical expression relating adsorption to residual solute concentration is
illustrated as per the equation below:
Equation (2.1)
By linearization the Freundlich equation becomes,
Equation (2.2)
Where = amount of substance adsorbed
= quantity of adsorbent
=quantity of residual substance dissolved
K and n = constants unrelated to the amount of solute and adsorbent.
As demonstrated by Topallar, (1998), by measuring the absorbance, the relative amount of
pigment adsorbed (X) and the relative residual amount at equilibrium (Xe) are obtained from
Equations 2.3 and 2.4:
Equation (2.3)
Equation (2.4)
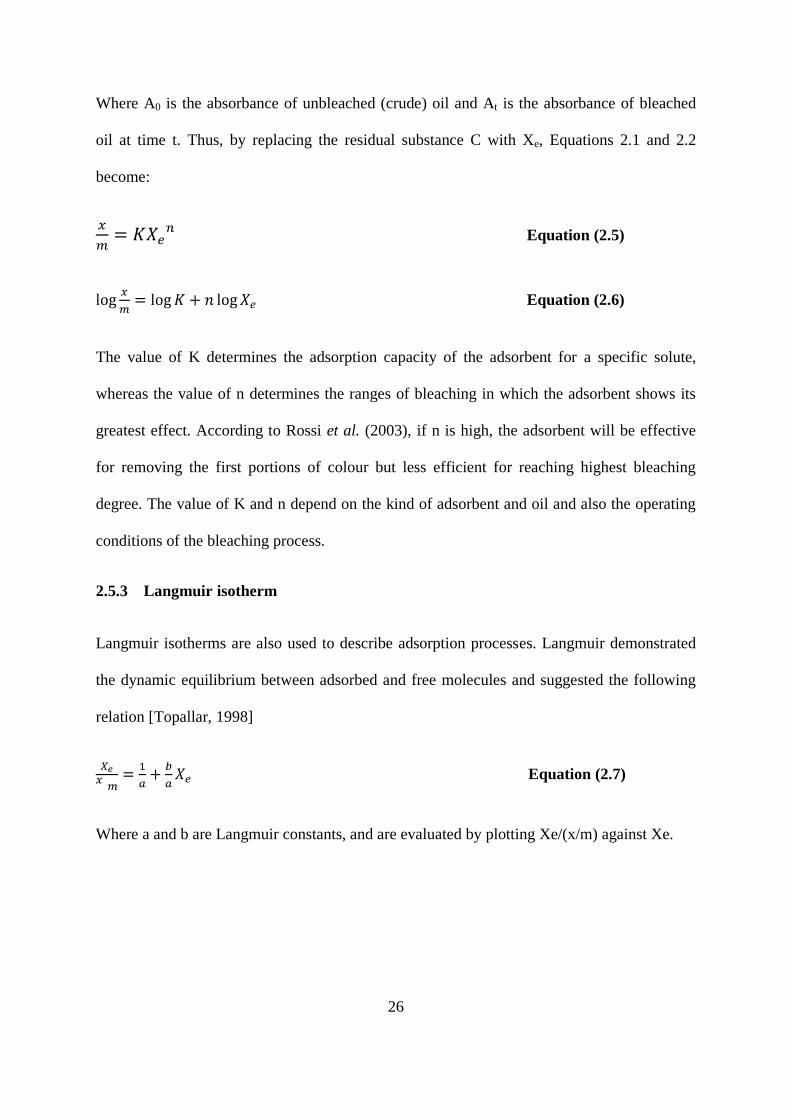
26
Where A0 is the absorbance of unbleached (crude) oil and At is the absorbance of bleached
oil at time t. Thus, by replacing the residual substance C with Xe, Equations 2.1 and 2.2
become:
Equation (2.5)
Equation (2.6)
The value of K determines the adsorption capacity of the adsorbent for a specific solute,
whereas the value of n determines the ranges of bleaching in which the adsorbent shows its
greatest effect. According to Rossi et al. (2003), if n is high, the adsorbent will be effective
for removing the first portions of colour but less efficient for reaching highest bleaching
degree. The value of K and n depend on the kind of adsorbent and oil and also the operating
conditions of the bleaching process.
2.5.3 Langmuir isotherm
Langmuir isotherms are also used to describe adsorption processes. Langmuir demonstrated
the dynamic equilibrium between adsorbed and free molecules and suggested the following
relation [Topallar, 1998]
Equation (2.7)
Where a and b are Langmuir constants, and are evaluated by plotting Xe/(x/m) against Xe.

27
2.5.4 Bleaching Agents
Acid –Activated Bleaching Earth 2.5.4.1
Acid-activated bleaching earths (Figure 2.8) are normally used in the refining of minerals and
in the bleaching of vegetable oils for removing all kind of impurities. Acid activated
bleaching earths are in general produced from naturally occurring high montmorillonite clays.
The structural features of the clay are modified by treatment with mineral acids. Bleaching
earth works based on adsorption and ion exchange [Rohani et al., 2006].
Figure 2.8: Acid activated bentonite clay
[Rohani et al., 2006]
The adsorption process is influenced by some factors such as:
Adsorbent polarity
Particle size
Surface area
Pore volume
28
Pore size
Natural Bleaching Earth 2.5.4.2
Natural/neutral bleaching earths are used with limited colour-reducing effect but are
particularly useful in treating animal fats. According to Rossi et al., (2003), they are excellent
metal adsorbents.
Activated Carbon 2.5.4.3
Activated carbon is derived from all materials containing high fixed carbon content. The most
used are coal, coconut shell, wood, peat and petroleum based residues. Depending upon the
raw material and the production procedures, activated carbons contain different pore
diameters ranging from micropores (40 Angstrom) to macropores (>5000Angstrom)
structures. Adsorption process is due to the large adsorbent surface and small volume of
carbon and therefore the micropores structure is more suitable for bleaching action [CCI,
2006].
Activated carbon has been used in bleaching oil, but its use is limited due to the high
operation costs, which is a major economic consideration in any production process
[Qingliang et al., 2013; Usman et al., 2013].
Synthetic Silicates 2.5.4.4
Synthetic silicates are used in edible oil bleaching, largely in wet bleaching with a focus on
selectively removing phosphatides, trace metals and soaps. Although they have a moderate
capacity for pigment removal, they are used in combination with bleaching clay and due to
the synergic action the amount of bleaching clays is reduced [Rossi et al., 2003].
29
2.5.5 Bleaching process
The general bleaching process is carried out at temperature in the range of 80-120°C and
contact time ranging from 20 to 40 minutes under vacuum or nitrogen. The dosage of
bleaching earth can vary depending on both the process and oil type. Chemical refining uses
0.5-2% on a weight basis while physical refining uses 0.25-2%. However for darker oils, 2-
4% bleaching earth may be used to meet final colour requirements [Diaz and Santos, 2001,
Usman et al., 2012]. After bleaching, the bleaching agent is removed through vacuum
filtration. The filter cake still contains oil and this parameter is referred to as „oil retention‟.
Excessive oil retention increases the cost of running the bleaching process. In general, oil loss
results from oil lost to filter cake and this oil retention can go up to 40% [Usman et al., 2012].
This value can be reduced to 20-30%, either by the use of steam or nitrogen at the end of
filtration. Smaller particle size of clays produce better bleaching performance however,
filtration rate and oil retention can be affected adversely. Therefore for efficient filtration,
short filtration time and low oil retention are desired.
Bleaching can be carried out as either batch or as continuous process.
Batch bleaching 2.5.5.1
Batch bleaching is the simple operation, where the bleaching vessel is fed with a set amount
of oil and heated by steam to remove the moisture while the apparatus is maintained under
vacuum by the barometric condenser and vacuum pump. During this stage the bleacher acts
as dryer. After drying, a metered amount of bleaching earth is added to the mass and the
adsorbent is pulled into the vessel by the vacuum existing therein. Upon completion of
bleaching, the oil-bleaching earth suspension is pumped to filtration section where
components are separated [Rohani et al., 2006].

30
Continuous bleaching 2.5.5.2
In a continuous bleaching plant, the crude oil is heated by means of steam in the exchanger
and is sucked as very small drops in the lower part of the vacuumed bleacher which operation
is ensured by the presence of barometric condenser and ejectors. Dry steam is injected to the
oil mass in order to facilitate the operation and also to keep the mass in agitation. The oil is
then taken by a pump through a series of heat exchangers to raise its temperature to a desired
level and is then sent to the upper part of the bleaching vessel. The oil remains in contact with
the earth for a specified period of time and then the suspension is sent to filtration [Rohani et
al., 2006].
31
3 CHAPTER THREE
MATERIALS AND METHOD
3.1 Materials
The grey and brownish coloured bentonite clays were obtained locally from Thika
(Silverstone Masters Ltd) and Athi River, Kenya respectively at 1 m from the surface.
Bentonite clays were used after washing with distilled water, ground and sieved through 200
mesh size (75 µm). The crude palm oil was obtained from Kapa Oil Refineries Ltd. (K). All
chemicals used were of analytical grade.
3.2 Physical Characterization
3.2.1 Moisture Content
Moisture content of both raw and acid activated bentonite clays were determined by drying
approximately 1.00g of bentonite clay at 110 °C in an oven (E 28# 04-71528) until the mass
became constant. Then after cooling in desiccator the moisture content was determined using
equation below. Each sample was analyzed twice and the average percentage was reported.
Equation (3.1)
Where W%: percentage of moisture in the sample
A: weight of wet sample (grams)
B: weight of dry sample (grams)
32
3.2.2 pH determination
pH of both activated and natural bentonite clays were determined by soaking 5g±0.025g of
clay in 25 ml of distilled water for twelve hours before pH was tested using pH-meter
(HANNA instruments, pH 211 ).
3.2.3 Apparent bulk density determination
The sieved clay (whether raw or activated) was put into a graduated cylinder of known
weight and avoiding compression. The cylinder was tapped vigorously on the horizontal
surface to constant clay volume. The volume of the packed clay was taken and apparent bulk
density (ABD) was calculated [Rich, 1960] as follows:
Equation (3.2)
Where is the weight of the cylinder plus clay; is the weight of the empty cylinder; V is
the total weight of clay used after compression.
3.2.4 Cation exchange capacity (CEC)
CEC of bentonite clay was determined by the BaCl2 compulsive exchange method. 1mg of
sample clay was put in a centrifuge tube, followed by 10 ml of 0.1 M BaCl2.2H2O. (LOBA
chemie PVT Ltd India). After the mixture was shaken for 2 hours, the slurry was separated by
centrifuging at 10000 rpm and was then decanted. The CEC was determined by measuring
Ca, Mg, K and Al in the extract using AAS (SpectrAA-10, Varlan) and then applying the
following equation:
CEC (cmol/kg of clay) = Ca/20 + Mg/12 + K/39 +Al/9 Equation (3.3)
33
3.3 Chemical characterization of bentonite clay
Chemical composition of bentonite clay was determined using atomic absorption
spectroscopy (AAS). Approximately 0.100 g of clay sample was digested by adding 3 ml of
48% hydrofluoric acid and 1ml of aqua regia and the mixture was left overnight. 50 ml of
boric acid was added and after one hour, 46 ml of distilled water was added to make 100 ml
solution which was then diluted to 10% with 50% v/v boric acid.
At least 1g of clay sample was ignited at 1000°C for loss of ignition (LOI) determination.
3.4 Acid activation of bentonite clay
Acid activation was done according to the method described by Foletto, (2011), with slight
modifications. Figure 3.1 shows the image of the activation process used in this study.
Figure 3.1: Set up of acid activation process
34
3.4.1 Effect of acid concentration
The samples of clay were initially washed thoroughly with distilled water. They were then
dried in the oven at 105 °C for 3 hours and sieved through a 200 mesh sieve. Five
concentrations of sulphuric acid (BDH Chemicals Ltd, Poole England) were prepared (1.0 M,
2.0 M, 3.0 M, 4.0 M and 5.0 M). 5g ± 0.025g of the dry 200 mesh clay sample was mixed
with 50 ml 1.0 M acid concentrations and the mixture heated at 100 °C under reflux for 3
hours. The procedure was repeated with the other acid concentrations.
The obtained samples were then cooled, filtered under vacuum and washed repeatedly with
distilled water until the filtrate was free of SO42-
ions. The filtered samples were dried at 105
°C for 3 hours. All bentonite clay samples were again crushed to a particle size that would
pass through a 200 mesh size and labeled A0, A1, A2, A3, A4, A5, T0, T1, T2, T3, T4, and
T5, where numbers indicate the molar acid concentration used in activation steps, while A
and T stands for Athi River and Thika bentonite clays respectively. Then they were stored in
polyethylene bags for bleaching and other studies.
3.4.2 Effect of activation contact time
5g ± 0.025g of the dry 200 mesh clay sample was treated with 50 ml of 2.0 M H2SO4. The
mixture was heated at 100 °C under reflux. The experiment was carried out for various
contact times ranging from 30 minutes to 180minutes. The obtained samples were then
cooled, filtered under vacuum and washed repeatedly with distilled water until the filtrate
was free of SO42-
ions. The filtered samples were dried at 105 °C for 3 hours. Then dried
activated bentonite clays were again crushed to a particle size that would pass through a 200
mesh sieve and were stored in polyethylene bags for bleaching studies.
35
3.4.3 Effect of temperature on activation
5 g ± 0.025g of the dry 200 mesh clay sample was treated with 50 ml of 2.0 M H2SO4. The
mixture was heated under reflux at 100 °C and 120 °C for 3 hours. The obtained samples
were then cooled, filtered under vacuum and washed repeatedly with distilled water until the
filtrate was free of SO42-
ions. The filtered samples were dried at 105 °C for 3 hours. Then
dried activated bentonite clays were again crushed to a particle size that would pass through
a 200 mesh sieve and were then stored in polyethylene bags for bleaching studies.
3.4.4 Effect of clay acid ratio
5 g ± 0.025g of the dried 200 mesh clay sample was activated with 5.0 M H2SO4 the mixture
was heated under reflux at 100 °C for 3 hours with a constant stirring. The procedure was
repeated for 15 g, 25 g, and 35 g of bentonite clays. The obtained samples were then cooled,
filtered under vacuum and washed repeatedly with distilled water until the filtrate was free
of SO42-
ions. The filtered samples were dried at 105 °C for 3 hours. Then dried activated
bentonite clays were again crushed to a particle size that would pass through a 200 mesh
sieve and were then stored in polyethylene bags for bleaching studies.
36
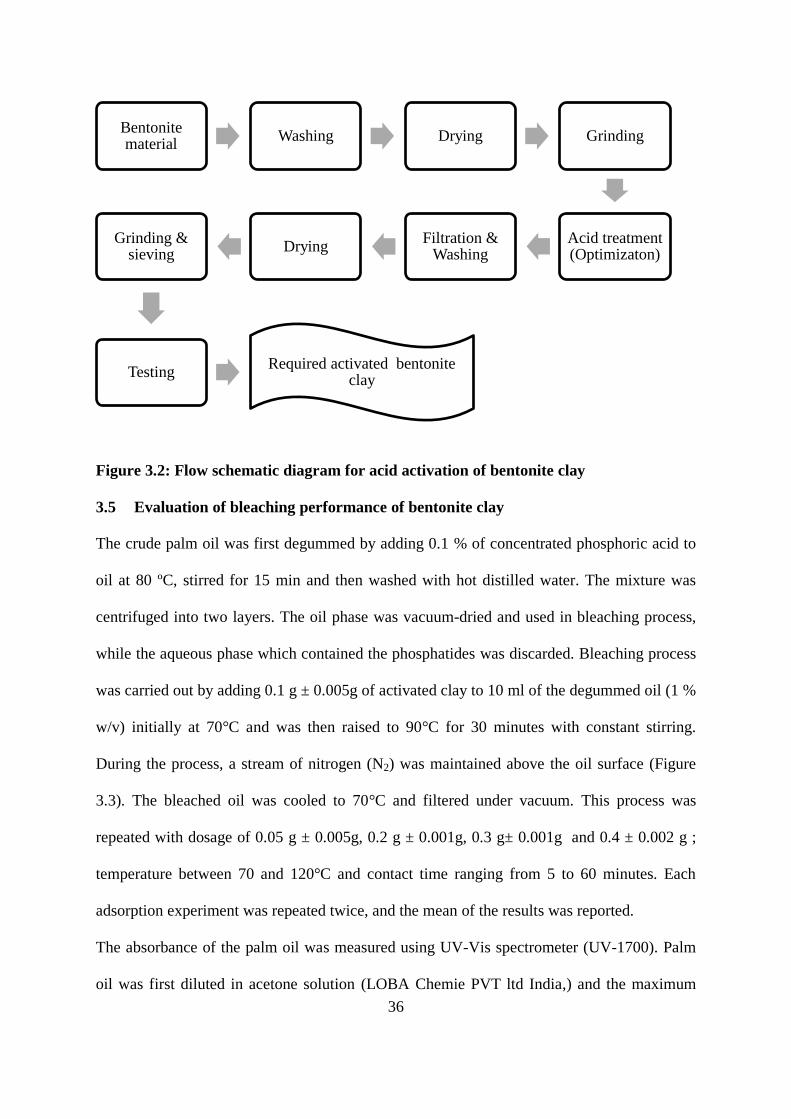
Figure 3.2: Flow schematic diagram for acid activation of bentonite clay
3.5 Evaluation of bleaching performance of bentonite clay
The crude palm oil was first degummed by adding 0.1 % of concentrated phosphoric acid to
oil at 80 ºC, stirred for 15 min and then washed with hot distilled water. The mixture was
centrifuged into two layers. The oil phase was vacuum-dried and used in bleaching process,
while the aqueous phase which contained the phosphatides was discarded. Bleaching process
was carried out by adding 0.1 g ± 0.005g of activated clay to 10 ml of the degummed oil (1 %
w/v) initially at 70°C and was then raised to 90°C for 30 minutes with constant stirring.
During the process, a stream of nitrogen (N2) was maintained above the oil surface (Figure
3.3). The bleached oil was cooled to 70°C and filtered under vacuum. This process was
repeated with dosage of 0.05 g ± 0.005g, 0.2 g ± 0.001g, 0.3 g± 0.001g and 0.4 ± 0.002 g ;
temperature between 70 and 120°C and contact time ranging from 5 to 60 minutes. Each
adsorption experiment was repeated twice, and the mean of the results was reported.
The absorbance of the palm oil was measured using UV-Vis spectrometer (UV-1700). Palm
oil was first diluted in acetone solution (LOBA Chemie PVT ltd India,) and the maximum
Bentonite material
Washing Drying Grinding
Acid treatment (Optimizaton)
Filtration & Washing
Drying Grinding &
sieving
Testing Required activated bentonite
clay

37
absorbance was read at 450 nm wavelength using acetone as reference. The percentage
bleaching performance of the clays was determined as:
BP% = Equation (3.4)
Where; and A, are the absorbances of the unbleached and bleached palm oil respectively
[Foletto et al., 2011, Usman, et al., 2013].
Figure 3.3: Bleaching process unit
38
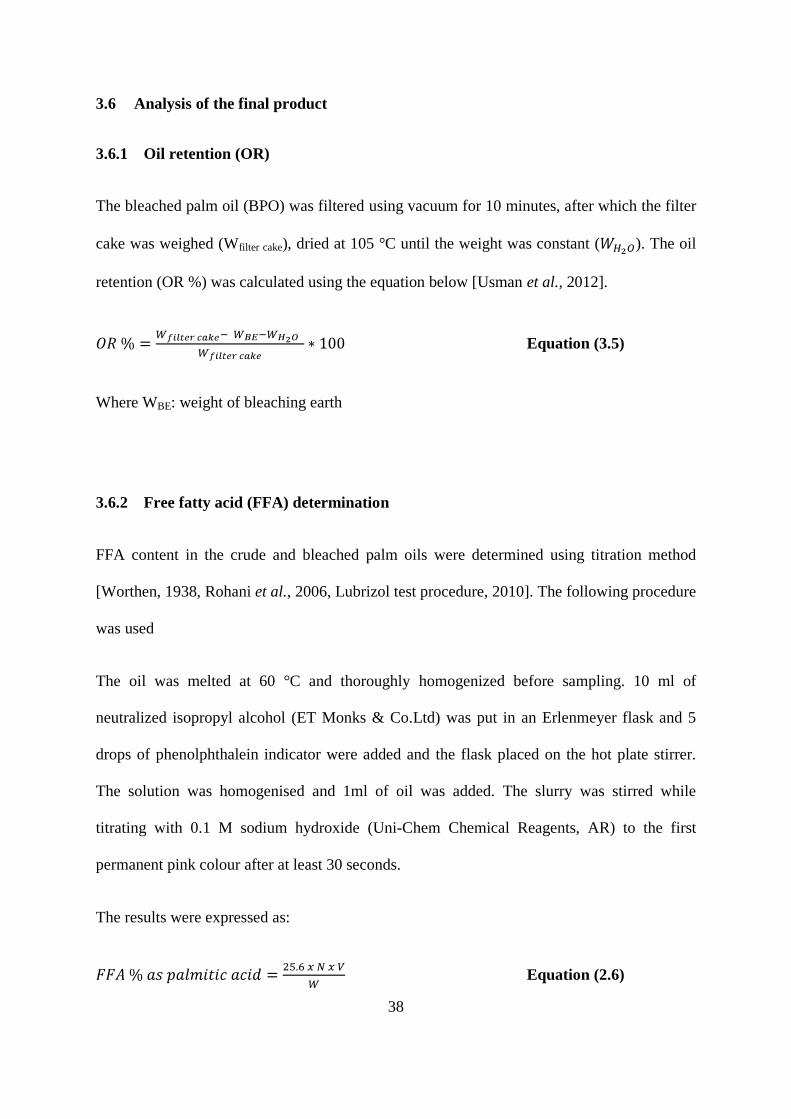
3.6 Analysis of the final product
3.6.1 Oil retention (OR)
The bleached palm oil (BPO) was filtered using vacuum for 10 minutes, after which the filter
cake was weighed (Wfilter cake), dried at 105 °C until the weight was constant ( ). The oil
retention (OR %) was calculated using the equation below [Usman et al., 2012].
Equation (3.5)
Where WBE: weight of bleaching earth
3.6.2 Free fatty acid (FFA) determination
FFA content in the crude and bleached palm oils were determined using titration method
[Worthen, 1938, Rohani et al., 2006, Lubrizol test procedure, 2010]. The following procedure
was used
The oil was melted at 60 °C and thoroughly homogenized before sampling. 10 ml of
neutralized isopropyl alcohol (ET Monks & Co.Ltd) was put in an Erlenmeyer flask and 5
drops of phenolphthalein indicator were added and the flask placed on the hot plate stirrer.
The solution was homogenised and 1ml of oil was added. The slurry was stirred while
titrating with 0.1 M sodium hydroxide (Uni-Chem Chemical Reagents, AR) to the first
permanent pink colour after at least 30 seconds.
The results were expressed as:
Equation (2.6)
39
Where N: normality of NaOH solution
V: volume of NaOH solution used in ml
W: weight of oil sample
3.6.3 Oil density (D)
Density of both crude palm oil and bleached palm oil were determined using a pycnometer.
First the weight of empty pycnometer was determined, and then it was filled with oil. The
density of oil was calculated as follow:
Equation (3.7)
Where Moil was weight of oil and V was the volume of the pycnometer.

40
4 CHAPTER FOUR
RESULTS AND DISCUSSION
4.1 Chemical properties of the clay
The chemical composition and loss of ignition (LOI) of Athi River (A) and Thika (T) clay
samples of both raw and activated bentonite clay minerals activated at different acid
concentration are shown in Tables 4.1 and 4.2.
Acid treatment was observed to modify the structure of bentonite as indicated by the change
in the chemical composition. Except for SiO2 which recorded a consistent increase in amount
from 46.71 % to 78.52 % for A bentonite and 63.88 % to 76.81 % for T bentonite as acid
concentration was increased, the composition of other components decreased after activation.
The increase in SiO2 content and a decrease of others was in conformity with the results
reported by Usman et al., (2012) and Arfaoui et al., (2008) which indicated a partial
destruction of the octahedral sheet by dissolution of the exchangeable cations.
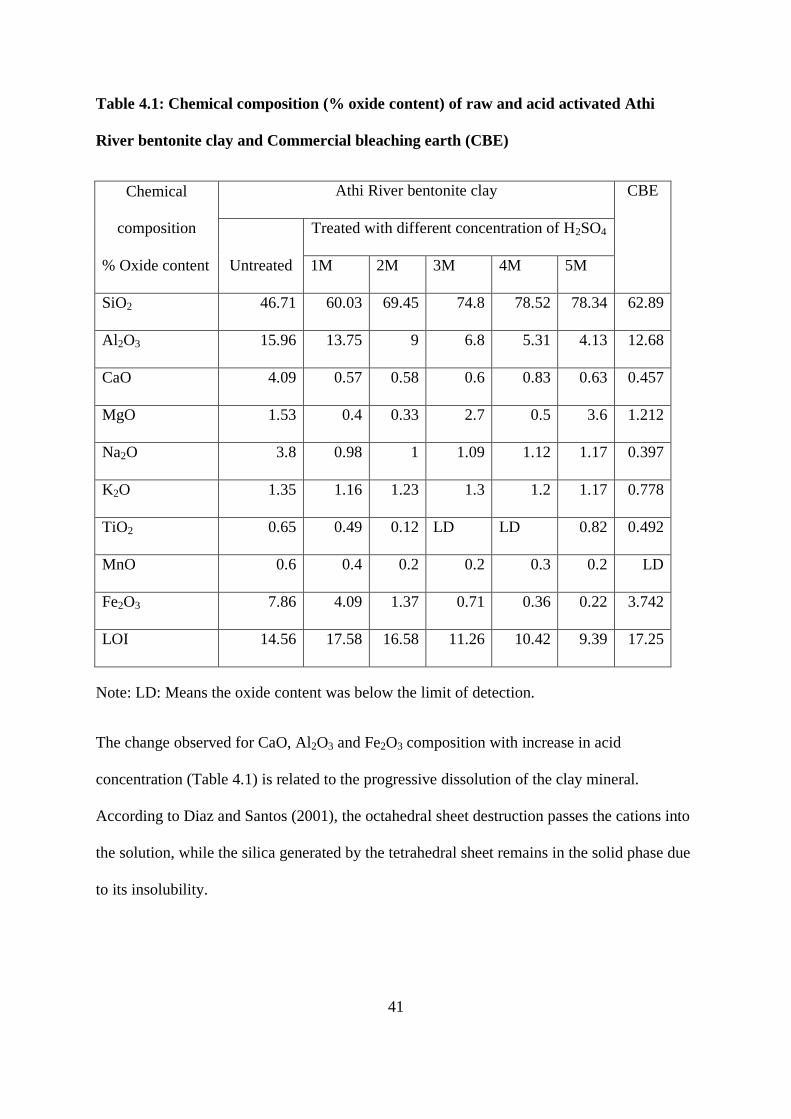
41
Table 4.1: Chemical composition (% oxide content) of raw and acid activated Athi
River bentonite clay and Commercial bleaching earth (CBE)
Chemical
composition
Athi River bentonite clay CBE
Untreated
Treated with different concentration of H2SO4
% Oxide content 1M 2M 3M 4M 5M
SiO2 46.71 60.03 69.45 74.8 78.52 78.34 62.89
Al2O3 15.96 13.75 9 6.8 5.31 4.13 12.68
CaO 4.09 0.57 0.58 0.6 0.83 0.63 0.457
MgO 1.53 0.4 0.33 2.7 0.5 3.6 1.212
Na2O 3.8 0.98 1 1.09 1.12 1.17 0.397
K2O 1.35 1.16 1.23 1.3 1.2 1.17 0.778
TiO2 0.65 0.49 0.12 LD LD 0.82 0.492
MnO 0.6 0.4 0.2 0.2 0.3 0.2 LD
Fe2O3 7.86 4.09 1.37 0.71 0.36 0.22 3.742
LOI 14.56 17.58 16.58 11.26 10.42 9.39 17.25
Note: LD: Means the oxide content was below the limit of detection.
The change observed for CaO, Al2O3 and Fe2O3 composition with increase in acid
concentration (Table 4.1) is related to the progressive dissolution of the clay mineral.
According to Diaz and Santos (2001), the octahedral sheet destruction passes the cations into
the solution, while the silica generated by the tetrahedral sheet remains in the solid phase due
to its insolubility.
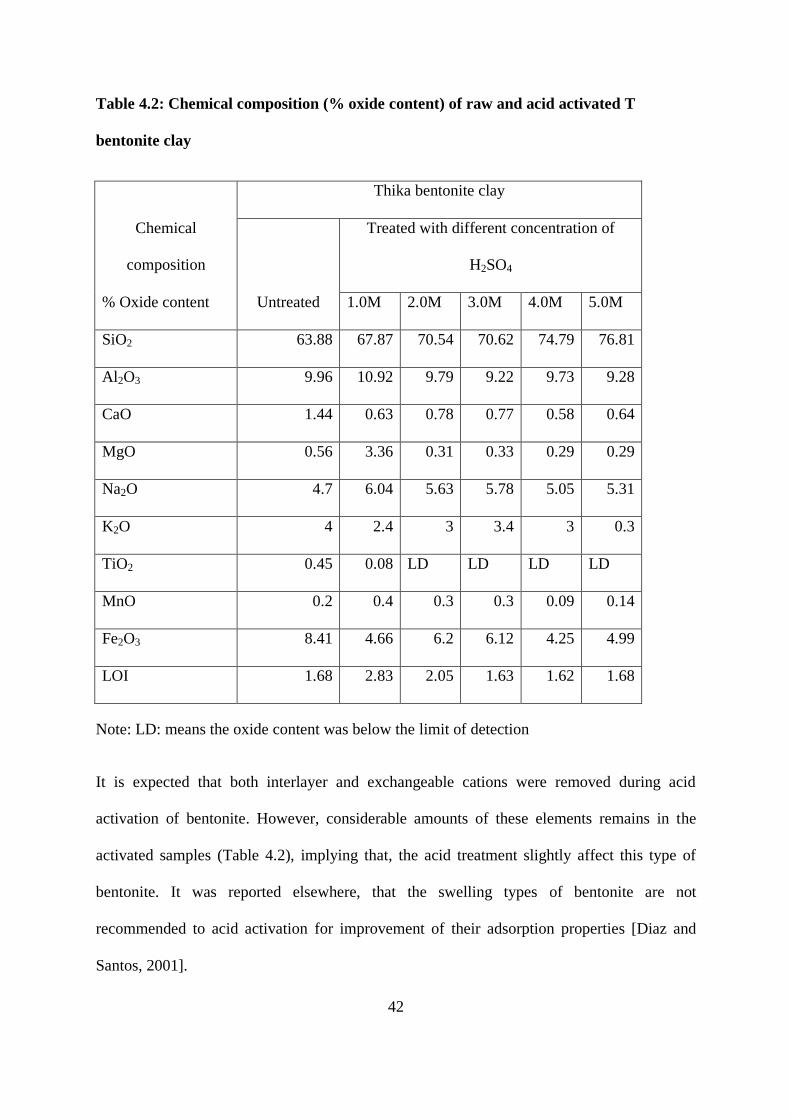
42
Table 4.2: Chemical composition (% oxide content) of raw and acid activated T
bentonite clay
Chemical
composition
Thika bentonite clay
Untreated
Treated with different concentration of
H2SO4
% Oxide content 1.0M 2.0M 3.0M 4.0M 5.0M
SiO2 63.88 67.87 70.54 70.62 74.79 76.81
Al2O3 9.96 10.92 9.79 9.22 9.73 9.28
CaO 1.44 0.63 0.78 0.77 0.58 0.64
MgO 0.56 3.36 0.31 0.33 0.29 0.29
Na2O 4.7 6.04 5.63 5.78 5.05 5.31
K2O 4 2.4 3 3.4 3 0.3
TiO2 0.45 0.08 LD LD LD LD
MnO 0.2 0.4 0.3 0.3 0.09 0.14
Fe2O3 8.41 4.66 6.2 6.12 4.25 4.99
LOI 1.68 2.83 2.05 1.63 1.62 1.68
Note: LD: means the oxide content was below the limit of detection
It is expected that both interlayer and exchangeable cations were removed during acid
activation of bentonite. However, considerable amounts of these elements remains in the
activated samples (Table 4.2), implying that, the acid treatment slightly affect this type of
bentonite. It was reported elsewhere, that the swelling types of bentonite are not
recommended to acid activation for improvement of their adsorption properties [Diaz and
Santos, 2001].
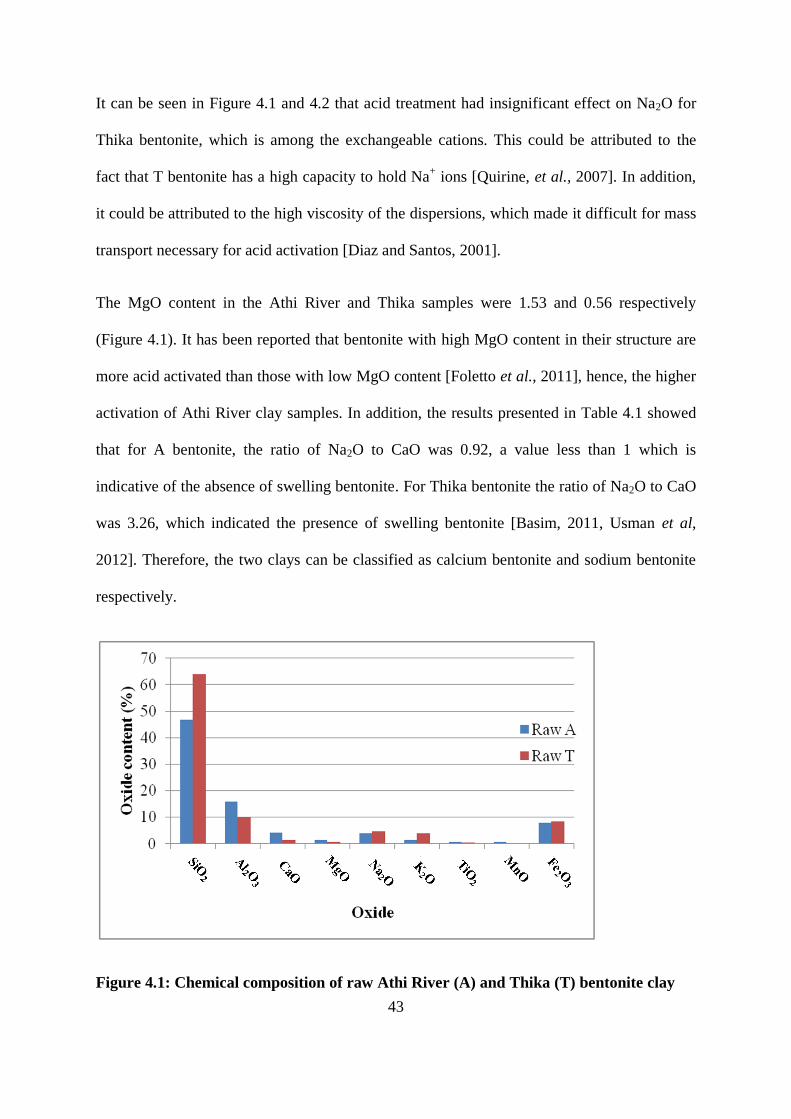
43
It can be seen in Figure 4.1 and 4.2 that acid treatment had insignificant effect on Na2O for
Thika bentonite, which is among the exchangeable cations. This could be attributed to the
fact that T bentonite has a high capacity to hold Na+ ions [Quirine, et al., 2007]. In addition,
it could be attributed to the high viscosity of the dispersions, which made it difficult for mass
transport necessary for acid activation [Diaz and Santos, 2001].
The MgO content in the Athi River and Thika samples were 1.53 and 0.56 respectively
(Figure 4.1). It has been reported that bentonite with high MgO content in their structure are
more acid activated than those with low MgO content [Foletto et al., 2011], hence, the higher
activation of Athi River clay samples. In addition, the results presented in Table 4.1 showed
that for A bentonite, the ratio of Na2O to CaO was 0.92, a value less than 1 which is
indicative of the absence of swelling bentonite. For Thika bentonite the ratio of Na2O to CaO
was 3.26, which indicated the presence of swelling bentonite [Basim, 2011, Usman et al,
2012]. Therefore, the two clays can be classified as calcium bentonite and sodium bentonite
respectively.
Figure 4.1: Chemical composition of raw Athi River (A) and Thika (T) bentonite clay
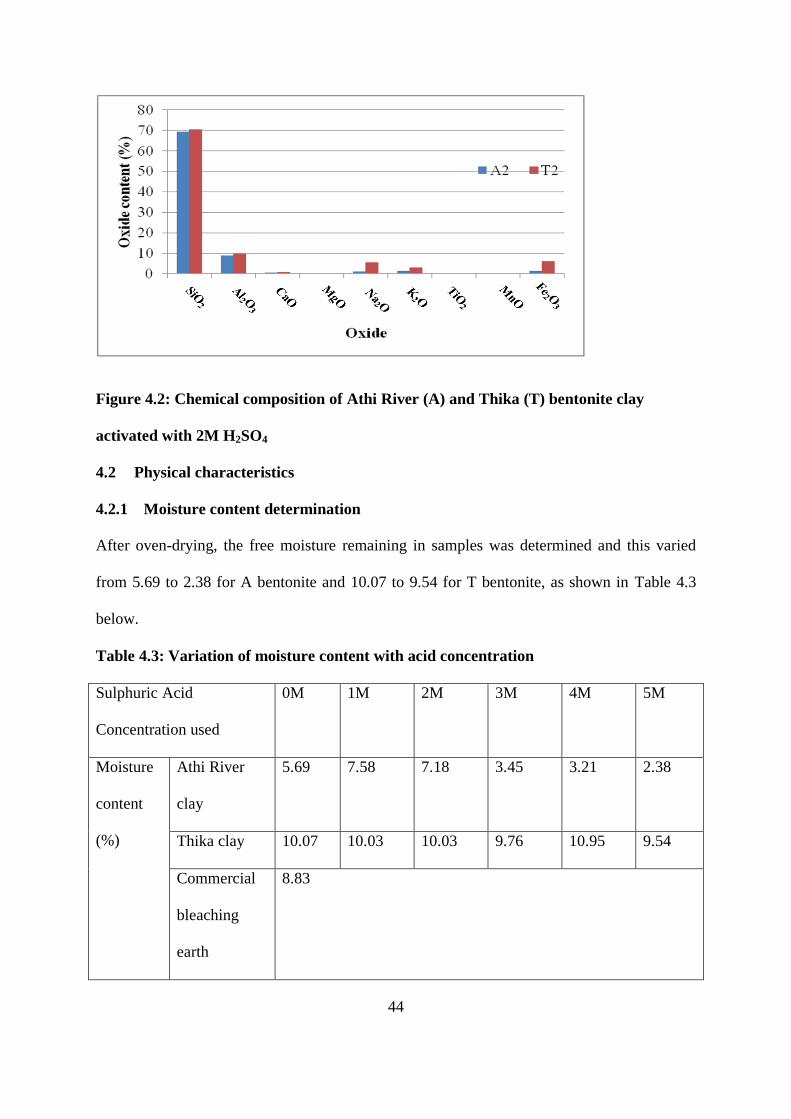
44
Figure 4.2: Chemical composition of Athi River (A) and Thika (T) bentonite clay
activated with 2M H2SO4
4.2 Physical characteristics
4.2.1 Moisture content determination
After oven-drying, the free moisture remaining in samples was determined and this varied
from 5.69 to 2.38 for A bentonite and 10.07 to 9.54 for T bentonite, as shown in Table 4.3
below.
Table 4.3: Variation of moisture content with acid concentration
Sulphuric Acid
Concentration used
0M 1M 2M 3M 4M 5M
Moisture
content
(%)
Athi River
clay
5.69 7.58 7.18 3.45 3.21 2.38
Thika clay 10.07 10.03 10.03 9.76 10.95 9.54
Commercial
bleaching
earth
8.83
45
The results presented in Table 4.3 for A bentonite, revealed that at first, the acid attack
increased the capacity of the clay to hold water. Subsequently, the moisture content decreased
as the acid concentration was further increased. This could be attributed to the increase in
void space as created as the exchangeable metal ions were displaced by hydrogen ions which
have smaller volumes than metal ions. However, T bentonite showed only 1 % moisture
difference, which could be attributed to less change in the T clay structure.
4.2.2 Cation exchange capacity (CEC)
Figure 4.3 shows the CEC of the two bentonite clays before and after acid activation. The
CEC of Athi River bentonite decreased as the acid concentration increased. A similar trend
was observed by Ajemba and Onukwuli (2013) during acid activation of Nteje clay. This
could be attributed to the removal of the exchangeable ions from the lattice of the clay
samples and replacement by hydrogen ion [Rossi et al., 2003]. However, Thika bentonite
showed an increase followed by a slight decrease in CEC with the increase in acid
concentration. The same trend was observed for Al2O3, MgO and Na2O in Thika samples.
This small change could be attributed to the change in CaO content during activation process
(Table 4.2). Quirine et al., (2007), pointed out that the higher the CEC the higher the number
of cations held by the soil, and the higher the swelling capacity.

46
Figure 4.3: Variation in cation exchange capacity of Athi River and Thika bentonite
clays with acid concentration
4.2.3 Density
The bulk density of both A and T bentonite clays were determined for various acid
concentrations and acid/clay ratio (% w/v). The results are shown in the Figures 4.4, 4.5, 4.6
and 4.7 below.
0
0.2
0.4
0.6
0.8
1
1.2
1.4
0 2 4 6
Cati
on
exch
an
ge
cap
aci
ty (
100
cmol/
kg)
Acid concenntration (mol/L)
Variation in cation exchange capacity with
acid concentration
T
A
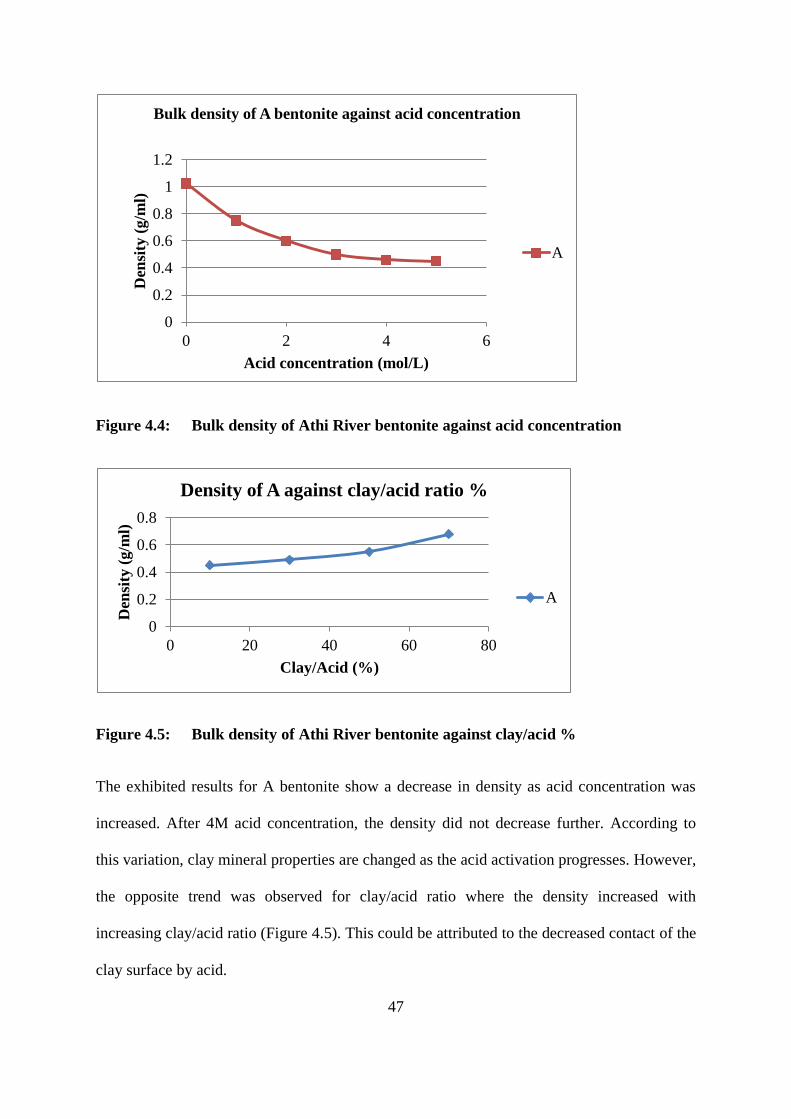
47
Figure 4.4: Bulk density of Athi River bentonite against acid concentration
Figure 4.5: Bulk density of Athi River bentonite against clay/acid %
The exhibited results for A bentonite show a decrease in density as acid concentration was
increased. After 4M acid concentration, the density did not decrease further. According to
this variation, clay mineral properties are changed as the acid activation progresses. However,
the opposite trend was observed for clay/acid ratio where the density increased with
increasing clay/acid ratio (Figure 4.5). This could be attributed to the decreased contact of the
clay surface by acid.
0
0.2
0.4
0.6
0.8
1
1.2
0 2 4 6
Den
sity
(g/m
l)
Acid concentration (mol/L)
Bulk density of A bentonite against acid concentration
A
0
0.2
0.4
0.6
0.8
0 20 40 60 80
Den
sity
(g/m
l)
Clay/Acid (%)
Density of A against clay/acid ratio %
A

48
The density of T bentonite clay increased as the acid concentration used for clay activation
increased from 1.11g/ml to a maximum of 1.22g/ml at about 2M and then decreased to
1.18g/ml at 5M. This indicates that the density of T bentonite was only slightly altered by
acid treatment.
Figure 4.6: Bulk density of Thika bentonite against acid concentration
Figure 4.7: Bulk density of Thika against clay/acid ratio
1.1
1.15
1.2
1.25
0 2 4 6
Den
sity
(g/m
l)
Acid concentration (mol/L)
Density of T bentonite against acid
concentration
T
1.18
1.19
1.2
1.21
1.22
1.23
1.24
1.25
1.26
0 20 40 60 80
Den
sity
(g/m
l)
Clay/Acid (%)
Density of T against clay/acid ratio %
T

49
4.3 Maximum absorption wavelength (λmax)
Maximum absorption wavelength of pigments in palm oil samples was determined by
scanning from 400 nm to 700 nm using UV-Vis spectrophotometer (UV-1700, SHIMADZU).
The λmax was found to be 450 nm, as shown in Figure 4.8 below. A similar λmax value was
obtained by Ejikeme et al., (2013) and Usman et al., (2013) during adsorption studies of palm
oil.
Figure 4.8: A plot of absorbance versus wavelength of palm oil
4.4 Acid activation of bentonite clay
After chemical and physical characterization of both A and T bentonite clays, it was observed
that A bentonite was more affected by acid attack during the activation process, whereas T
bentonite clay was not changed as much by activation. Consequently, the optimization
experimental conditions of acid treatment were focused on A bentonite clay. After acid
treatment, A bentonite changed from brown to whitish colour as shown in Figure 4.9. This
could be due to the replacement of metal ions such as Al3+
, Fe3+
and Ca2+
in the clay structure
0
0.5
1
1.5
2
2.5
3
300 350 400 450 500 550 600 650 700
Ab
sorb
an
ce
Wavelength (nm)
Maximum wavelength

50
with H+. The T bentonite remained grey in colour and this could be due to the relatively high
amount of cations such as Al3+
and Fe3+
which still remained after the activation. Moreover,
the higher the content of Na+ (4.7%) and K
+ (4%), the more the clay structure resist acid
attack (Figure 4.10).
Figure 4.9: Raw (inactivated-left) and activated (right) A bentonite clays
Figure 4.10: Raw (inactivated-left) and activated (right) T bentonite clays

51
4.4.1 Effect of acid concentration
The effect of acid concentration on bleaching of palm oil was studied at 90°C with 1% (w/v)
clay dosage for 30 minutes.
The effect of acid concentration for A bentonite on the bleaching performance of palm oil is
shown in the Figure 4.11 below;
Figure 4.11: A plot of percent bleaching performance versus acid concentration
It can be seen that the activated clay samples adsorbed colour pigments from the palm oil
more than the raw clay sample, raising the bleaching performance from 6.3 % to 91.86 %.
The bleaching performance first increased with the concentration of acid used up to 2 M
H2SO4 Above this concentration, the performance dropped. These results indicate that the
maximum value of bleaching performance (94.54 %) was attained at 2 M acid concentration.
Subsequent decline in bleaching performance could be due to passivation of the rest of the
clay which protects the clay layers from further acid attack [Christidis et al., 1997]. The
0
20
40
60
80
100
0 1 2 3 4 5 6
BP (%)
Acid concentration (mol/l)
Effect of acid concentration
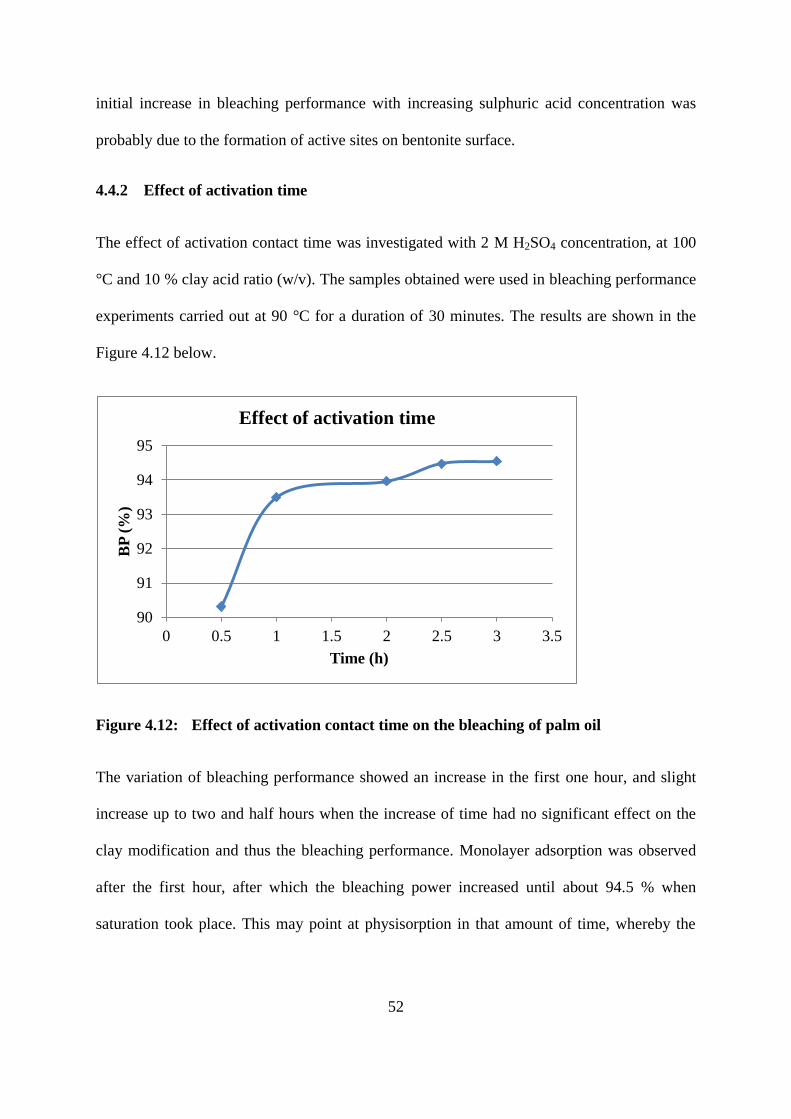
52
initial increase in bleaching performance with increasing sulphuric acid concentration was
probably due to the formation of active sites on bentonite surface.
4.4.2 Effect of activation time
The effect of activation contact time was investigated with 2 M H2SO4 concentration, at 100
°C and 10 % clay acid ratio (w/v). The samples obtained were used in bleaching performance
experiments carried out at 90 °C for a duration of 30 minutes. The results are shown in the
Figure 4.12 below.
Figure 4.12: Effect of activation contact time on the bleaching of palm oil
The variation of bleaching performance showed an increase in the first one hour, and slight
increase up to two and half hours when the increase of time had no significant effect on the
clay modification and thus the bleaching performance. Monolayer adsorption was observed
after the first hour, after which the bleaching power increased until about 94.5 % when
saturation took place. This may point at physisorption in that amount of time, whereby the
90
91
92
93
94
95
0 0.5 1 1.5 2 2.5 3 3.5
BP
(%
)
Time (h)
Effect of activation time
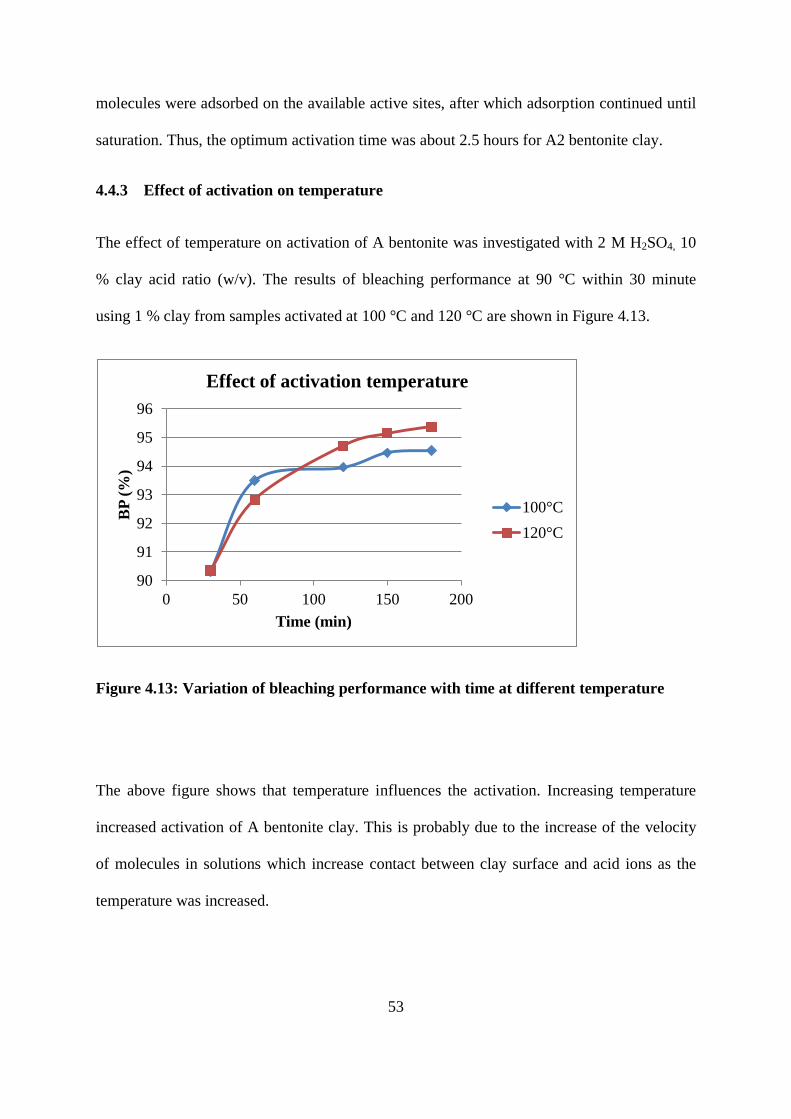
53
molecules were adsorbed on the available active sites, after which adsorption continued until
saturation. Thus, the optimum activation time was about 2.5 hours for A2 bentonite clay.
4.4.3 Effect of activation on temperature
The effect of temperature on activation of A bentonite was investigated with 2 M H2SO4, 10
% clay acid ratio (w/v). The results of bleaching performance at 90 °C within 30 minute
using 1 % clay from samples activated at 100 °C and 120 °C are shown in Figure 4.13.
Figure 4.13: Variation of bleaching performance with time at different temperature
The above figure shows that temperature influences the activation. Increasing temperature
increased activation of A bentonite clay. This is probably due to the increase of the velocity
of molecules in solutions which increase contact between clay surface and acid ions as the
temperature was increased.
90
91
92
93
94
95
96
0 50 100 150 200
BP
(%
)
Time (min)
Effect of activation temperature
100°C
120°C
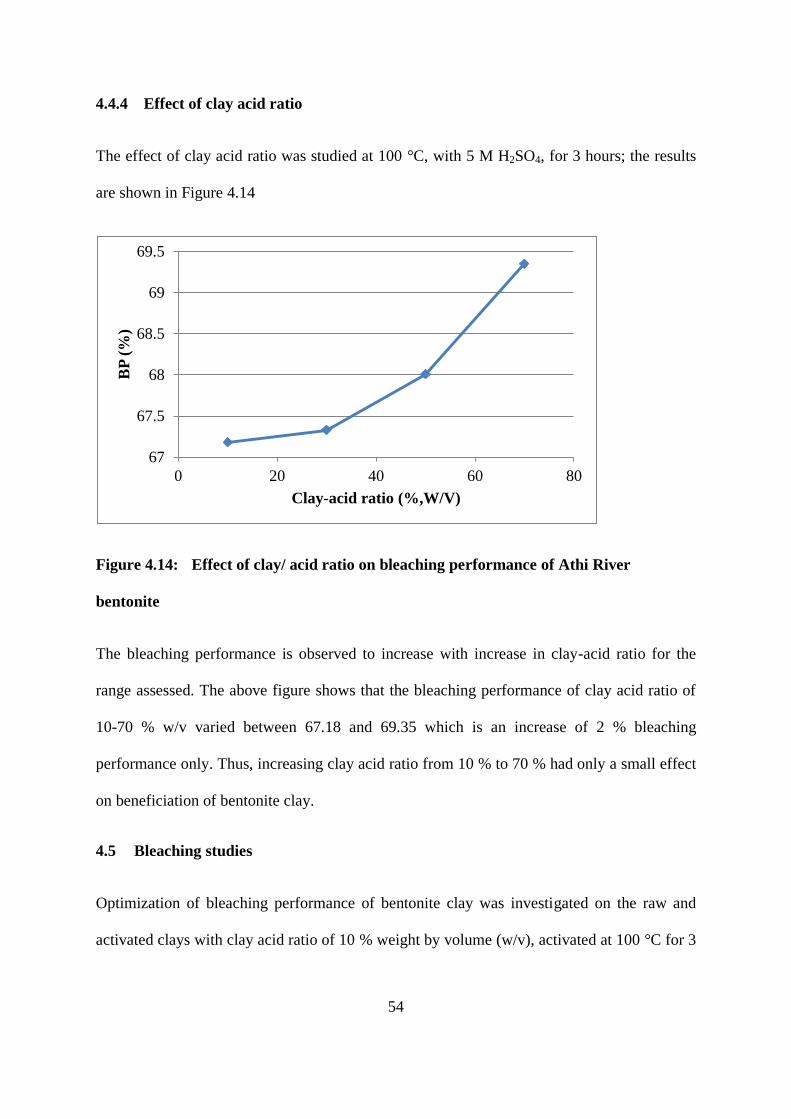
54
4.4.4 Effect of clay acid ratio
The effect of clay acid ratio was studied at 100 °C, with 5 M H2SO4, for 3 hours; the results
are shown in Figure 4.14
Figure 4.14: Effect of clay/ acid ratio on bleaching performance of Athi River
bentonite
The bleaching performance is observed to increase with increase in clay-acid ratio for the
range assessed. The above figure shows that the bleaching performance of clay acid ratio of
10-70 % w/v varied between 67.18 and 69.35 which is an increase of 2 % bleaching
performance only. Thus, increasing clay acid ratio from 10 % to 70 % had only a small effect
on beneficiation of bentonite clay.
4.5 Bleaching studies
Optimization of bleaching performance of bentonite clay was investigated on the raw and
activated clays with clay acid ratio of 10 % weight by volume (w/v), activated at 100 °C for 3
67
67.5
68
68.5
69
69.5
0 20 40 60 80
BP
(%
)
Clay-acid ratio (%,W/V)
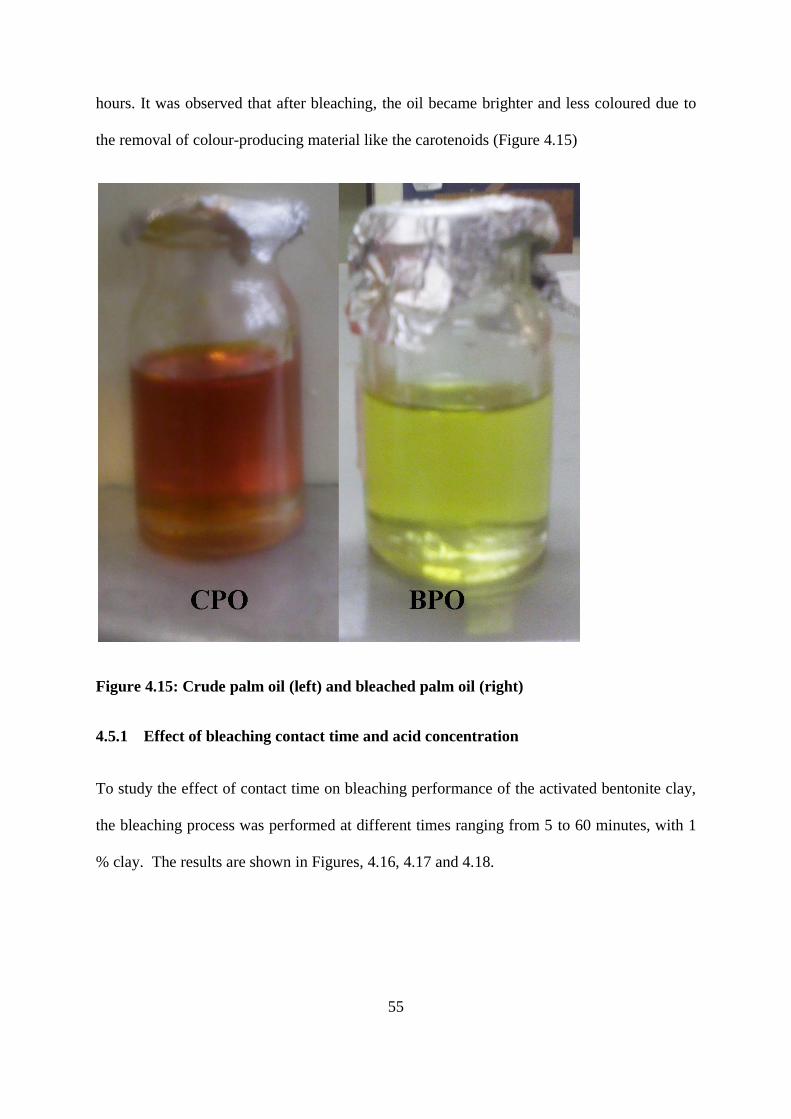
55
hours. It was observed that after bleaching, the oil became brighter and less coloured due to
the removal of colour-producing material like the carotenoids (Figure 4.15)
Figure 4.15: Crude palm oil (left) and bleached palm oil (right)
4.5.1 Effect of bleaching contact time and acid concentration
To study the effect of contact time on bleaching performance of the activated bentonite clay,
the bleaching process was performed at different times ranging from 5 to 60 minutes, with 1
% clay. The results are shown in Figures, 4.16, 4.17 and 4.18.
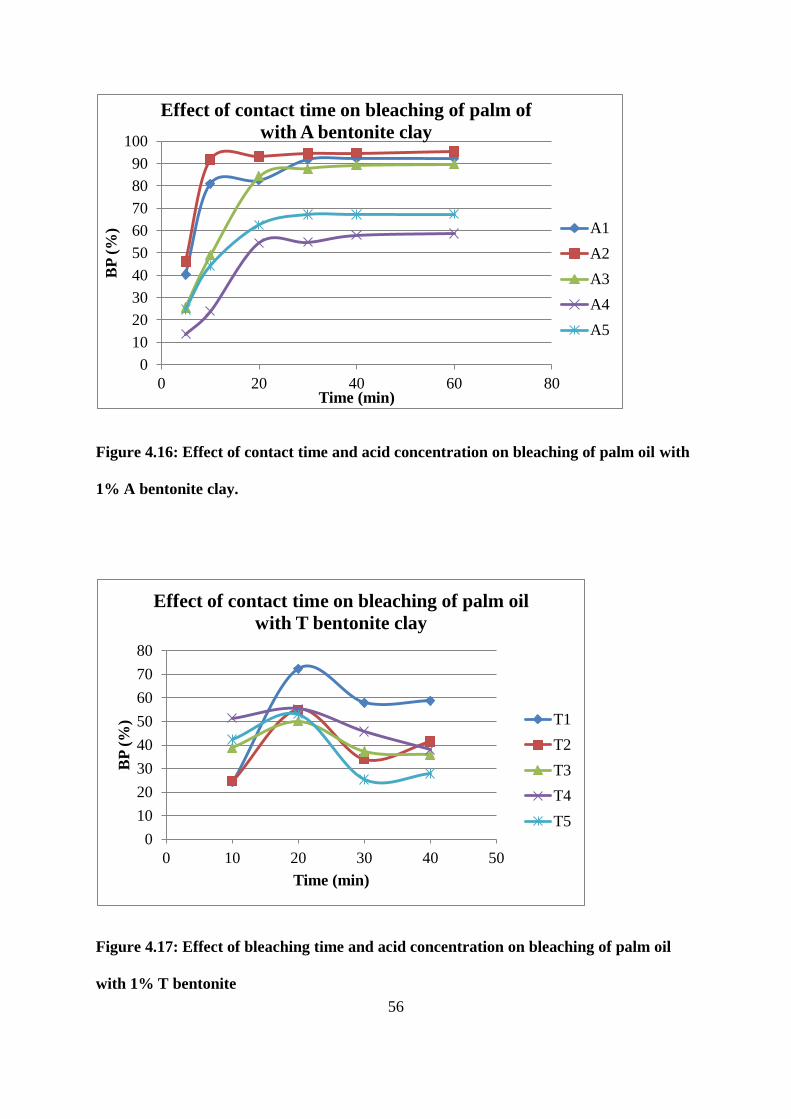
56
Figure 4.16: Effect of contact time and acid concentration on bleaching of palm oil with
1% A bentonite clay.
Figure 4.17: Effect of bleaching time and acid concentration on bleaching of palm oil
with 1% T bentonite
0
10
20
30
40
50
60
70
80
90
100
0 20 40 60 80
BP
(%
)
Time (min)
Effect of contact time on bleaching of palm of
with A bentonite clay
A1
A2
A3
A4
A5
0
10
20
30
40
50
60
70
80
0 10 20 30 40 50
BP
(%
)
Time (min)
Effect of contact time on bleaching of palm oil
with T bentonite clay
T1
T2
T3
T4
T5

57
Figure 4.18: Effect of contact time on bleaching of palm oil by 1% CBE
Figure 4.16 shows the effect of bleaching performance by A bentonite. It is clear from the
curves that bleaching performance increased rapidly with contact time up to an optimum
contact time of 30 minutes for all acid concentrations apart from A2 whose optimal contact
time was 10 minutes. It is also the concentration that had the highest bleach performance of
all the 5 concentrations, which indicates that it is the optimal concentration for bleaching
performance of Athi River bentonite clay. Nwabanne and Ekwu (2013) also observed an
increase of colour removal from palm oil with increase in contact time. Similar observations
have also been reported by Usman et al., (2013). The rapid pigment adsorption by the
adsorbent in the first 5 to 20 minutes can be attributed to the increased availability of vacant
surface sites at the initial stages.
The fact that optimal contact time is a maximum of 30 minutes for the various acid
concentrations is in agreement with the report of Berbesi (2006) who concluded that the
contact time for effective bleaching normally ranges from 15 to 45 minutes, with 20 to 30
30
40
50
60
70
80
90
100
0 20 40 60 80
BP
(%
)
Time (Min)
Effect of contact time on bleaching of palm oil with
CBE
CBE

58
minutes being the most common. After 30 minutes the adsorption was slow, implying
equilibrium conditions had been attained.
It is clear from Figure 4.16 that acid concentration used during activation process had a
significant effect on palm oil bleaching.
In Figure 4.17 the effect of contact time and sulphuric acid concentration on bleaching
performance of activated T bentonite clays is shown. Performance rose to a maximum at 20
minutes for all the samples. Thereafter the bleaching performance decreased. A concentration
of 1 M H2SO4 was found to be the optimum.
The effect of contact time on bleaching of palm oil with commercial bleaching earth (CBE)
was studied for comparison with the activated local bentonite clay. From Figure 4.18, it is
seen that the bleaching curve of CBE is similar to that of activated Athi River bentonite
sample A2. Thus, it is clear that activated bentonite from Athi River can be used to bleach
crude vegetable oil in place of commercially obtained bentonite.
4.5.2 Effect of temperature on bleaching of palm oil
The percentage pigment removal increases with increase in temperature as observed in Fig.
4.19. This is most probably because increase in temperature activates the molecules, and
increases their kinetic energy, thereby promoting access to more adsorption.

59
Figure 4.19: Effect of temperature on bleaching of palm oil by A bentonite and CBE
The BP % increased with temperature to a maximum and then remained constant for all the
A- species studied except A3, which attained a maximum value at 90 oC before dropping
drastically until equilibration was reached at bleaching performance value of 65 %. It can be
deduced that the highest bleaching performance was obtained at 90 °C, which agrees with the
observation by Berbesi (2006), who noted that bleaching temperature typically ranges from
90-125 °C. He also noted that oil viscosity decreases with increasing temperature resulting in
better dispersion of bentonite clay particles, improved clay oil interactions and less resistance
to flow.
The maximum bleaching performance for bleaching palm oil with CBE was attained at 100
°C after which temperature, it remained constant. This is in agreement with results obtained
by Berbesi (2006).
4.5.3 Effect of clay dosage on bleaching of palm oil
The clay dosage was varied from 0.05 g to 0.4 g in 10 ml of palm oil.
30
40
50
60
70
80
90
100
60 80 100 120 140
BP
%
Temperature
C
Effect of temperature
A1
A2
A3
A4
A5
CBE

60
% dosage: mass of clay/ volume of oil * 100%
Figure 4.20: Effect of A bentonite clay dosage on bleaching of palm oil
% dosage: mass of clay/ volume of oil * 100 %
Figure 4.21: Effect of T bentonite clay dosage on bleaching of palm oil
30
40
50
60
70
80
90
100
0 1 2 3 4 5
BP
(%
)
Adsorbent dosage (%)
Effect of A bentonite clay dosage on bleaching of palm
oil
20 min
30 min
30
40
50
60
70
80
90
0 1 2 3 4 5
BP
%
Dosage (%)
Effect of T bentonite dosage on bleaching of palm oil
20 min
30 min

61
Figure 4.22: Effect of CBE dosage on bleaching of palm oil
Figure 4.20, 4.21 and 4.22 show that the bleaching performance increased to a maximum
with increasing clay dosage. This can be attributed to the increase in active sites available for
adsorption. Bleaching clay dosage was varied between 0.5 and 4 %. The bleaching
performance of A2, T1 and CBE increased from 40 %, 35 % and 46.8 % to 98.49 %, 71 %
and 97 % respectively.
The results show that the bleaching performance increased to an optimum value of 1-2% the
adsorbent dosage after which further increase in adsorbent dosage had little effect on
performance. Diaz and Santos (2001) stated that darker oils like palm oil require as much as 2
%- 4 % or more to meet the colour requirements. Nwabanne and Ekwu (2013) have reported
the increase of BP % with the increase in clay dosage for decolourization of palm oil using
local Nigerian clay.
40
50
60
70
80
90
100
0 1 2 3 4 5
BP
%
Dosage (%)
Effect of CBE dosage on bleaching of palm oil
30 min
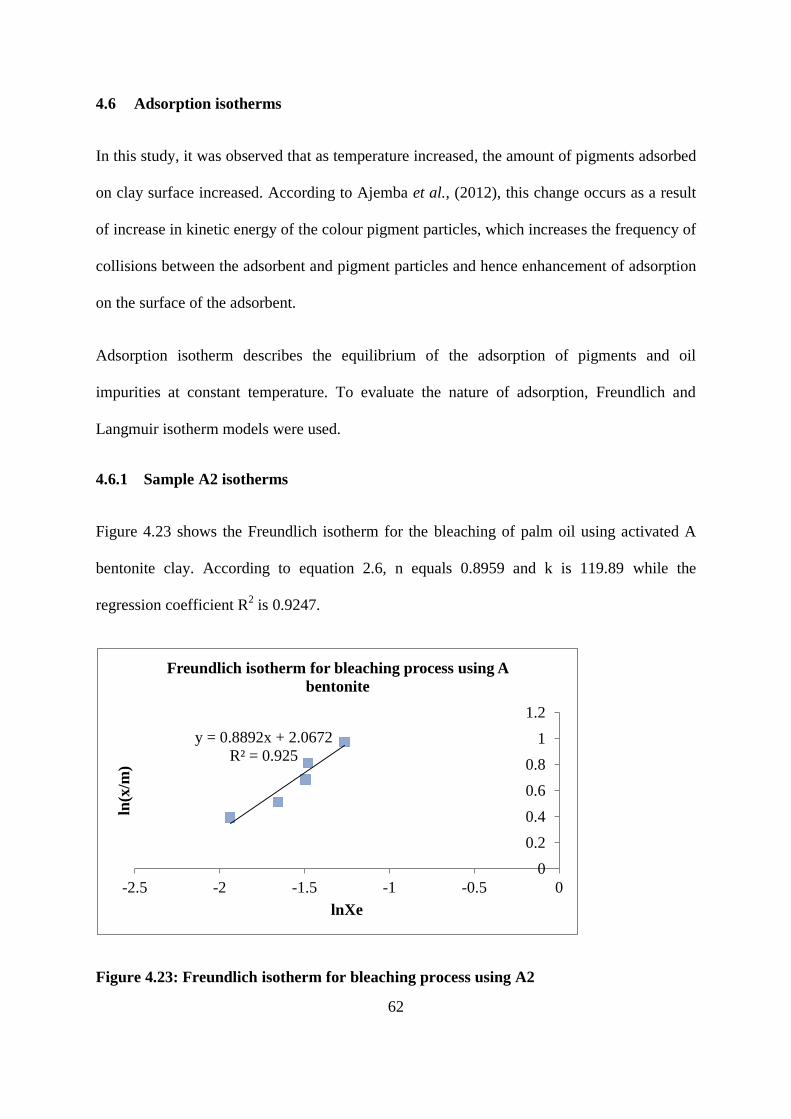
62
4.6 Adsorption isotherms
In this study, it was observed that as temperature increased, the amount of pigments adsorbed
on clay surface increased. According to Ajemba et al., (2012), this change occurs as a result
of increase in kinetic energy of the colour pigment particles, which increases the frequency of
collisions between the adsorbent and pigment particles and hence enhancement of adsorption
on the surface of the adsorbent.
Adsorption isotherm describes the equilibrium of the adsorption of pigments and oil
impurities at constant temperature. To evaluate the nature of adsorption, Freundlich and
Langmuir isotherm models were used.
4.6.1 Sample A2 isotherms
Figure 4.23 shows the Freundlich isotherm for the bleaching of palm oil using activated A
bentonite clay. According to equation 2.6, n equals 0.8959 and k is 119.89 while the
regression coefficient R2 is 0.9247.
Figure 4.23: Freundlich isotherm for bleaching process using A2
y = 0.8892x + 2.0672
R² = 0.925
0
0.2
0.4
0.6
0.8
1
1.2
-2.5 -2 -1.5 -1 -0.5 0
ln(x
/m)
lnXe
Freundlich isotherm for bleaching process using A
bentonite
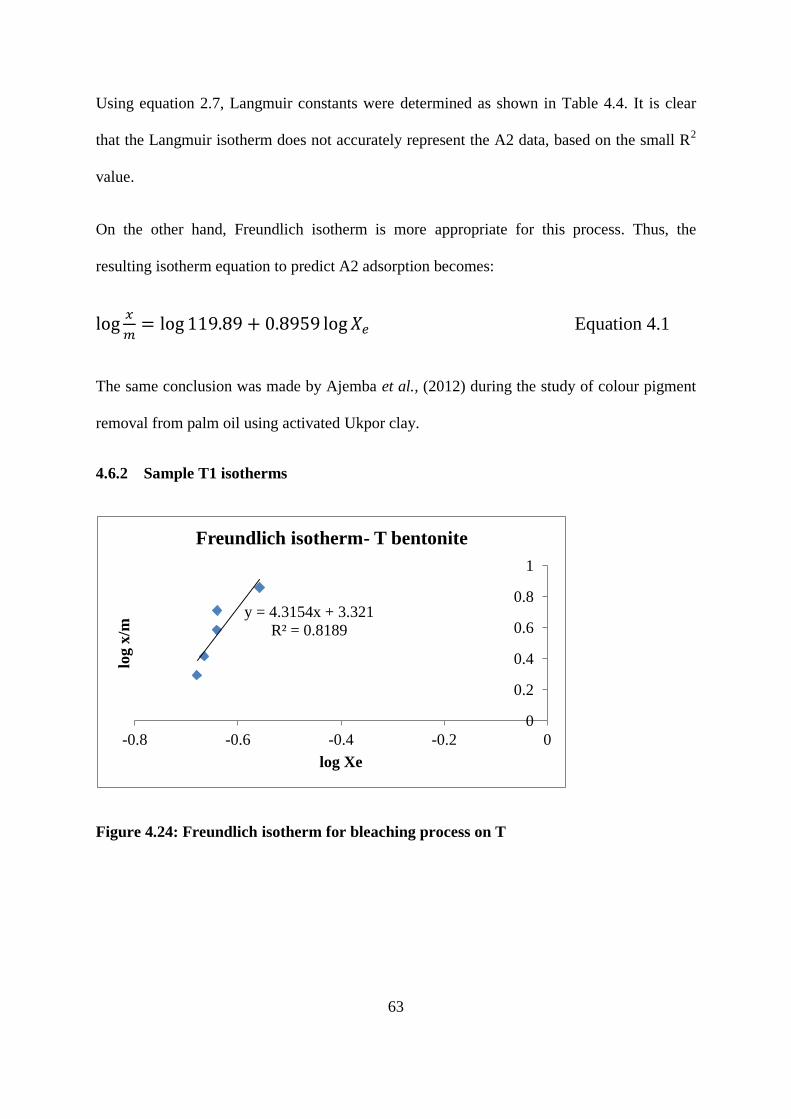
63
Using equation 2.7, Langmuir constants were determined as shown in Table 4.4. It is clear
that the Langmuir isotherm does not accurately represent the A2 data, based on the small R2
value.
On the other hand, Freundlich isotherm is more appropriate for this process. Thus, the
resulting isotherm equation to predict A2 adsorption becomes:
Equation 4.1
The same conclusion was made by Ajemba et al., (2012) during the study of colour pigment
removal from palm oil using activated Ukpor clay.
4.6.2 Sample T1 isotherms
Figure 4.24: Freundlich isotherm for bleaching process on T
y = 4.3154x + 3.321
R² = 0.8189
0
0.2
0.4
0.6
0.8
1
-0.8 -0.6 -0.4 -0.2 0
log x
/m
log Xe
Freundlich isotherm- T bentonite

64
Figure 4.25: Langmuir isotherm for bleaching process on T
It can be seen from Figures 4.24 and 4.25 that the points of the Langmuir isotherm plot are
presented randomly on the trend line, whereas a better fit was obtained using the Freundlich
isotherm. As Freundlich isotherm model fits the T bentonite data more than Langmuir
isotherm model, the bleaching equation takes the following form:
Equation 4.2
y = -0.8332x + 0.2595
R² = 0.6189
0
0.02
0.04
0.06
0.08
0.1
0.12
0.19 0.21 0.23 0.25 0.27 0.29
Xe/
(x/m
Xe
Langmuir isotherm - T bentonite
65
4.6.3 CBE isotherms
Figure 4.26: Freundlich isotherm for bleaching process on A2
Figure 4.27: Langmuir isotherm for bleaching process on CBE
Figure 4.26 and 4.27 show that bleaching of palm oil with CBE follows the Freundlich
isotherm model and the regression value (R2) is greater than that for the Langmuir isotherm
(R2: 0.9175>0.4393). Thus for the three clay species observed, the adsorption process seems
y = 1.3996x + 2.569
R² = 0.9175
0
0.2
0.4
0.6
0.8
1
1.2
-1.6 -1.4 -1.2 -1 -0.8
log x
/m
log Xe
Freundlich isotherm -CBE
y = -0.0789x + 0.0132
R² = 0.4393
0
0.002
0.004
0.006
0.008
0.01
0.012
0.014
0 0.02 0.04 0.06 0.08
Xe/
(x/m
)
Xe
Langmuir Isotherm- CBE
66
to favour the Freundlich isotherm more than the Langmuir isotherm as summarized in Table
4.4 below.
Table 4.4: Freundlich and Langmuir isotherm constants for the bleaching of palm oil
with A , T bentonite clay and CBE
Isotherm
model
Parameter
Athi River (A)
bentonite clay
Thika (T)
bentonite clay
Commercial bleaching
earth (CBE)
Freundlich k
n
R2
119.89
0.8959
0.9247
2094
4.31
0.8189
370.68
1.399
0.9175
Langmuir a.
b
R2
185.18
2.35
0.0481
3.85
-3.21
0.6189
75.75
-5.97
0.4393
4.7 Heat evolved during the bleaching process
The heat evolved during the adsorption process was calculated using the following equation
(Topallar, 1998).
Equation 4.3

67
Where Xe: the residual amount of pigment at equilibrium
ΔHa: Heat of adsorption (kJ/mol)
R: Gas constant (8.314 J/mol K )
T: Temperature (K)
C: integration constant from the plot of ln Xe against 1/T
4.7.1 Heat evolved during the bleaching of palm oil with A2
Figure 4.28: Plot ln Xe against 1/T for sample A2
The heat evolved was evaluated from Equation 4.3 and Fig. 4-28 to be -30.881 kJ/ mol, the
negative value indicating that the adsorption of pigments from palm oil onto A bentonite clay
is an exothermic process.
ΔHa value also indicates the type of sorption. The heat evolved during physical adsorption
falls in the range of 2.1 to 20.9 kJ/mol while that evolved during chemical adsorption is in the
y = 3714.4x - 12.75 R² = 0.9169
-4
-3.5
-3
-2.5
-2
-1.5
-1
-0.5
0
0.0024 0.0025 0.0026 0.0027 0.0028 0.0029 0.003
ln X
e
1/T

68
range of 80 to 200 kJ/mol [Ajemba et al., 2012]. Therefore, since the value evaluated (-
30.881 kJ/mol) lies between the upper value for physical and the lower value for chemical
adsorption, the bleaching of palm oil by Athi River acid activated clay can be attributed to
physico-chemical adsorption process.
4.7.2 Heat evolved during bleaching of palm oil with CBE
Figure 4.29: The plot of ln Xe against 1/T of CBE
From Figure 4.29, the heat evolved during the bleaching of palm oil using CBE was found to
be -32.05 kJ/mol. The negative value indicates that it is an exothermic process which is the
same observation made for Athi River activated clay (-30.881 kJ/mol).
ΔHa values obtained from Figures 4.28 and 4.29 show that the bleaching process with Athi
River bentonite is comparable to that with CBE.
y = 3855.9x - 12.672
R² = 0.8613
-3.5
-3
-2.5
-2
-1.5
-1
-0.5
0
0.0025 0.0026 0.0027 0.0028 0.0029 0.003
Ln
Xe
1/T
Heat evolved- CBE
69
4.8 Rate constant
The rate constant determines the speed of decolourization of vegetable oil. According to
Brimberg (1982), the rate constant is determined from equation 4.4, which is based on the
fact that absorbance is proportional to the concentration of the pigments in the oil; according
to Beer Lambert law. Therefore, equation 4.2 has taken the form of equation 4.4:
Equation 4.4
Equation 4.5
where t is the bleaching contact time, C0 is the initial concentration of the pigments and C is
the concentration of pigments at time t, A0 and A are the absorbances of the crude and
bleached oils at time t respectively and k is the rate constant. From equation 4.5, the linear
regression between ln A/A0 and t0.5
is a straight line whose slope is equal to –k.
Figure 4.30: A plot of ln (A/A0) against t0.5
for the bleaching of palm oil with 1% of clay
(A2)
y = -0.148x - 1.9965
R² = 0.9451
-3.5
-3
-2.5
-2
-1.5
-1
-0.5
0
0 2 4 6 8 10
ln A
/A0
√t
70
It can be deduced from the linear equation in the Fig. 4.30 above that the rate constant k is
0.148 with the correlation coefficient R2 of 0.945.
Figure 4.31: A plot of ln (A/A0) against t0.5
for bleaching of palm oil with 1 % of CBE
It can be seen from Figure 4.31 that the rate constant k is 0.1275, which indicates that the rate
constant for the removal of pigments from palm oil by CBE is 0.1275 min-1
which is lower
than the value 0.148 obtained for Athi River activated clay.
4.9 Analysis of final product
4.9.1 Oil retention (OR)
Equation 4.6
The oil retention of oil for Athi River bentonite clay activated at 100°C with 2 M H2SO4 and
for CBE was determined, and found to be 27.73 % and 27.04 % respectively. This is in
agreement with the observation made by Rich (1960), who found that clay with higher
apparent bulk density (ABD) value retain less amount of oil. In addition, according to Usman
et al., (2012), this OR % meets commercial standards. Once more the ABD values of A
y = -0.1275x - 2.0188
R² = 0.9722
-3.5
-3
-2.5
-2
-1.5
-1
-0.5
0
0 2 4 6 8 10
ln A
/A0
√t
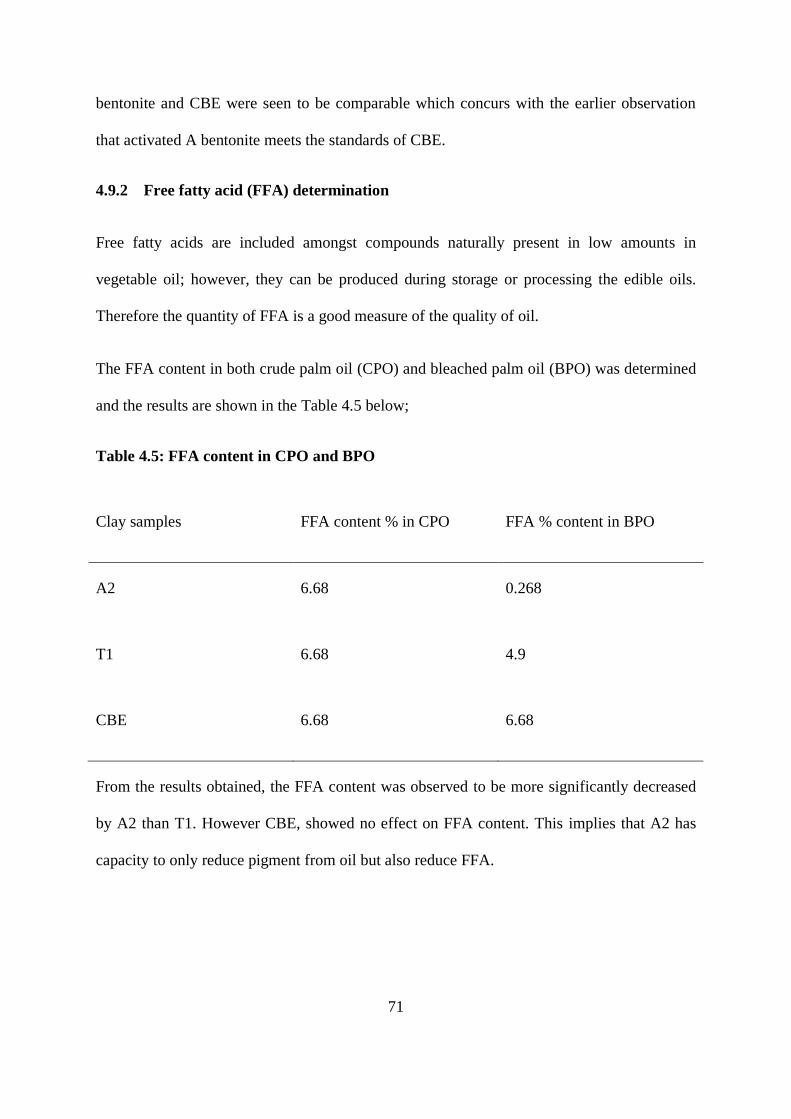
71
bentonite and CBE were seen to be comparable which concurs with the earlier observation
that activated A bentonite meets the standards of CBE.
4.9.2 Free fatty acid (FFA) determination
Free fatty acids are included amongst compounds naturally present in low amounts in
vegetable oil; however, they can be produced during storage or processing the edible oils.
Therefore the quantity of FFA is a good measure of the quality of oil.
The FFA content in both crude palm oil (CPO) and bleached palm oil (BPO) was determined
and the results are shown in the Table 4.5 below;
Table 4.5: FFA content in CPO and BPO
Clay samples FFA content % in CPO FFA % content in BPO
A2 6.68 0.268
T1 6.68 4.9
CBE 6.68 6.68
From the results obtained, the FFA content was observed to be more significantly decreased
by A2 than T1. However CBE, showed no effect on FFA content. This implies that A2 has
capacity to only reduce pigment from oil but also reduce FFA.

72
4.9.3 Oil density
Density of oil was determined and found to be 0.9357, a value less than that of water. This
indicates that BPO produced cannot make a solution with water.
The specifications of the optimized activated bentonite clay and that of commercial bleaching
earth are shown in Table 4.6 below:
Table 4.6: Characteristics and performance of the optimized Athi River (A)
bentonite clay and commercial bleaching earth (CBE).
Parameter Raw A bentonite A bentonite activated with
2 M H2SO4
CBE
Colour
Particle size
Brown
200 mesh
White
200 mesh
White
200 mesh
pH ( 10% in water) 10.7 4.35 3.8
Apparent bulk density g/l 1024.97 600.68 715.81
CEC 102 cmol/kg
Tested oil
ND
Palm oil
0.5926
Palm oil
ND
Palm oil
FFA content % 6.68 0.268 6.68
Oil retention % ND 27.73 27.04
Moisture content %
Cu
Pb
5.69
ND
ND
7.18
0.047
0.001
8.3
0.0465
0.0014
ND: not determined

73
5 CHAPTER FIVE
6 CONCLUSIONS AND RECOMMENDATIONS
5.1. CONCLUSIONS
In this project, the potential of activated Kenyan bentonite clay in palm oil bleaching was
investigated.
Chemical composition of both bentonite clays allowed classification of Athi River bentonite
as „Calcium bentonite‟ and Thika bentonite as „Sodium bentonite‟ clays‟. Moreover, physical
properties determination showed that Athi River bentonite responded well to acid attack more
than the Thika bentonite as the properties of activated Athi River bentonite were significantly
different from those of the inactivated clay, unlike for the Thika bentonite clay, whose
physical properties did not change as much on activation. Therefore optimization conditions
were focused on Athi River bentonite.
The acid clay ratio, the increase of temperature, time and acid concentration were found to
significantly alter the clay structure and consequently improve bleaching performance. The
results showed increase of bleaching performance up to the optimum concentration of 2M
H2SO4.
Activation was found to decrease the cation exchange capacity (CEC), which implied an
increase in surface area, and hence of the adsorption capacity. Also clay density showed a
decrease with increased acid concentration.
74
On the investigation of the effect of various operating parameters on bleaching of palm oil,
such as, contact time, adsorbent dosage and temperature, it was found that the optimal contact
time, adsorbent dosage and temperature were 30 minutes, 4 % and 90 °C respectively.
Upon activation, the bleaching performance of the activated clay was observed to increase
from 37.73 to 98.49 % for A bentonite and from 33.4 to 79 % for T bentonite indicating the
importance of acid treatment in improving adsorption performance of local clay.
The bleaching data showed that the adsorption followed the Freundlich adsorption model.
The heat evolved during bleaching process was determined and found to indicate an
exothermic physico-chemical adsorption (-30.881 kJ/mol) Bleaching performance of Athi
River bentonite was compared with that of commercial bleaching earth. Activated clay made
under optimized conditions compared well in terms of bleaching performance with
commercial bleaching earth. Furthermore, activated Athi River bentonite was found to reduce
FFA content more than CBE.
This study has shown that Athi River bentonite clay is a viable source of adsorbent for palm
oil bleaching when it is activated with sulphuric acid as it removes 98% of pigment from
palm oil. The results can be applied in the local establishment of an activated clay
manufacturing plant.
5.2. RECOMMENDATIONS
1. More work should be done to understand the science behind the change of bentonite
structure by acid attack.
2. A pilot study should be undertaken as part of a feasibility study for the manufacture of
activated Athi River bentonite clay in Kenya. In this study the stirring rate during
75
activation was kept constant. However stirring rate is expected to affect the dispersion of
molecules into solution, therefore, it can be varied to find optimum speed.
3. Removal or reduction of peroxide value and phosphorous present in palm oil by
activated Athi River bentonite clay can be investigated
4. Studies on other industrial uses of activated Athi River bentonite clay should be
undertaken, for example in wastewater treatment or sugar refining.
5. More study should be done on Thika bentonite clay to evaluate the best method to
optimise its bleaching performance or alternatively, its use as a drilling mud.

76
REFERENCES
Ajemba R. O., (2012), Modification of the physico-chemical properties of Udi clay mineral
to enhance its adsorptive capacity, Advanced Applied Science Research, 3(4), 2042-
2049.
Ajemba R.O, Igbokwe, P.K and Onukwuli, O.D (2012), kinetics, equilibrium studies of
colour pigments removal from palm oil using activated ukpor clay, Applied Science
Research, 4 (5), 1958-1966
Ajemba R. O., and Onukwuli O. D., (2013), Nitric Acid-activated Nteje Clay: Structural and
Bleaching Properties International Journal of Engineering, 26(5), 495-500.
Al-shahrani S.S., (2013), Treatment of wastewater contaminated with cobalt using Saudi
activated bentonite, Alexandria Engineering journal, 53, 205-211.
Al-zahrani, A.A., Al-shahrani S.S., Al-Tawil Y.A, (2000), Study on the activation of Soudi
bentonite, part II: Characterization of the produced active clay and its test as an
adsorption agent, Engineering Science. 13(2), 193-203.
Arfaoui, S., Frini-Srasra, N. and Srasra, E., (2008), Modelling of the adsorption of the
chromium ion by modified clays, Desalination, 222(1-3), 474–481.
Basim A., (2011), Rheology of sodium and calcium bentonite–water dispersions: Effect of
electrolytes and aging time. International Journal of Mineral Processing, 98, 208–
213.
Berbesi R., (2006), Achieving Optimal Bleaching Performance, Oil Mill Gazetteer, 112, 2-6

77
Brimberg, U.I., (1982), Kinetics of bleaching of vegetable oils. Journal of American Oil
chemists’ Society, 59, 74-78
Buic Z. and Zelic B., (2009), Application of clay for petrochemical wastewater pre-treatment,
water Quality Research Journal of Canada, 44(4), 399-406
Cameron Carbon Incorporated (CCI), (2006), Activated carbon: manufacture structure &
properties, activated carbon & related technology
Christidis G., Scott P. and Dunham A., (1997), Acid activation and bleaching capacity of
bentonites from the islands of milos and chios, aegean, greece, Applied Clay
Science, (12) 4, 329-347
Crown Iron Works Company (CIWC), (2008), Oils and refining. A CPM Company.
Diaz F. V. and de Souza S. P., (2001) studies on the acid activation of brazilian smectitic
clays. Quim Nova, 24(3), 345-353
Didi M.A, Makhoukhi B., Azzouz A., and Villemin D., (2009), Colza oil bleaching through
optimized acid activation of bentonite: A comparative study Applied Clay Science,
42, 336–344
Ejikeme E.M., Egbuna S.O and Ejikeme P.C.N, (2013), Optimal bleaching performance of
activated „Ngwulangwu‟ clay, Interantional Journal of Engineering and Innovative
Technology, 3(5), 13-19.
European Bentonite Association (EUBA), (2011), Bentonite, Industrial Minerals
Association-Europe
Export Processing Zones Authority (EPZA), (2005), Vegetable oil industry in Kenya.
78
Farihahusnah H., Mohamed K. A., and Wan Mohd Ashri Wan Daud, (2011), Textural
characteristics, surface chemistry and activation of bleaching earth: A review,
Chemical Engineering Journal, 170, 90–106.
Foletto, E. L., Colazzo, G. C., Volzone, C. and Porto, L. M., (2011), Sunflower oil bleaching
by adsorption onto acid-activated bentonite. Brazilian Journal of Chemical
Engineering, 28 (01), 169 – 174
Fortification basics (2014) oils and margarine, DSM, 1-4 retrieved from
https://www.dsm.com/content/dam/dsm/nip/en_US/documents/oils.pdf on
14/04/2014
Gunstone, F.D., (2002), Vegetable oils in food technology: Composition, properties and uses,
Backwell Publishing, 3-14
Hartwell J. M., (1965), The diverse uses of montmorillonite, clay minerals,6, 111-118.
Hassan, M.S., and Abdel-Khalek, N.A., (1998), Beneficiation and application of an Egyptian
bentonite, Applied Clay Science, 13, 99-115
Hongping, H., Yuehong M., Jianxi Z., Peng Y., and Yanhong Q., (2010), Organoclays
prepared from montmorillonites with different cation exchange capacity and
surfactant configuration, Applied Clay Science, 48, 67–72
Kariuki, B., (1996), Electrochemical behaviour of polyaniline electrodeposited on a redox
ion-exchanger modified electrode. Msc Thesis University of Nairobi-Kenya

79
Kariuki, M. E., (2013), Determining optimal conditions for activating local bentonite clay
and comparison with commercial bleaching earth. Report, University of Nairobi,
Kenya
Kloprogge, J. T., Duong, L.V. and Frost, L. R., (2005), A review of the synthesis and
characterisation of pillared clays and related porous materials for cracking of
vegetable oils to produce biofuel. Environmental Geology
Komadel, P., Schmidt, D., Madejevá, J., and Cicel, B., (1990), Alteration of smectite by
treatment with hydrochloric acid and sodium carbonate solutions. Applied Clay
Science 5, 113–122.
Korichi, S., Elias A., and Mefti, A., (2009), Characterization of smectite after acid activation
with microwave irradiation. Applied Clay Science, 42, 432–438
Kutlic A., Bedekovic G. and Sobota I., (2012), Bentonite processing, professional paper 24,
61-65
Langmaack T. and Eggers R. (2002), On the bleaching kinetics of vegetable oils-
experimental study and mass transfer-based interpretation, European Journal of
Lipid and Science Technology, 104, 98-109
Lubrizol test procedure (2010), determination of acid value and free fatty acid, Lubrizol
Mukherjee S. and Mitra A., (2009), Health Effects of Palm Oil, Journal of Human Ecology,
26(3), 197-203
Makhoukhi B., Didi M. A., Villemin D., and Azzouz A., (2009), Acid activation of Bentonite
for use as a vegetable oil bleaching agent. grasas y aceites, 60 (4), 343-349.

80
Makhoukhi, B, Didi, M. A, and Villemin, D., (2008), Modification of bentonite with
diphosphonium salts: Synthesis and characterisation. Material Letters, 62(16),
2493–2496
Morad, N.A.; Aziz, M.K.A; and Zain, R.M., (2001), Process design in degumming and
bleaching of palm oil, Msc Thesis, Universiti Technologi Malaysia (UTM).
Mutisya, P.K., Maranga, S.M., Ikua, B. W., (2011), An insight into the source of bentonite
used in the local drilling industry, Jomo Kenyatta University of Agriculture and
Technology, Kenya.
Nadežda, S.; Mihovil, L.; Jelena, L., Jelena, P.; Miljana, M.; Biljana, B and Radosavljević-
Mihajlović. (2011) Characterization of bentonite clay from “Greda” deposit.
Processing and Application of Ceramics 5 (2), 97–101.
Nwabanne J.T. and Ekwu F.C., (2013), decolourizing of palm oil by Nigerian local clay: A
study of adsorption Isotherms and bleaching kinetics, international Journal Of
multidisciplinary sciences and engineering, 4(1), 20-25
Oboh A. O., Aworhi O.C., and Agagu O. K., (1987), The use of Nigerian clays in vegetable
oil refining: evaluation of some Nigerian clays as potential bleaching earths,
Nigerian Food Journal, 5, 42–51
Office of Global Analysis (OGA) (2009) Vegetable oil sector, Gain report ke9018.
Olugbenga A. G, Garba M. U., Soboyejo W., and Chukwu G., (2013), Beneficiation and
Characterization of a Benetonite from Niger Delta Region of Nigeria. International
Journal of Science and Engineering Investigations, 2 (14), 14-18
81
Omondi C., (2012), Activation of local bentonite clay and testing its bleaching efficiency.
Report, University of Nairobi.
Peng, L., (2007), Polymer modified clay minerals: A review, Applied clay Science, 28, 64-76
Qingliang Ma, Fangfang Shen, Xiaofang Lu , Weiren Bao and Hongzhu Ma, (2013), Studies
on the adsorption behavior of methyl orange from dye wastewater onto activated
clay, Desalination and Water Treatment, 51,19-21
Quirine, K., Shaw, R., and Renuka, R., (2007), Cation Exchange Capacity, Agronomy fact
sheet series, 22, 1-2
Resmi G, Thampi SG, and Chandrakaran S., (2012), Removal of lead from wastewater by
adsorption using acid-activated clay, environment Technology, 33, 1-3.
Rich A.D., (1960), relationship between the apparent bulk density of a bleaching clay and its
oil retention, Journal of American Oil Chemists’ Society, 7(6), 305-307
Rohani B. M. Z., Madia N.A.M. and Madya M. K.A,, (2006), Process design in degumming
and bleaching of Palm oil. Universiti Teknologi Malaysia
Rossi, M.; Gianazza, M.; Alamprese, C. and Stanga, F., (2003), The role of bleaching clays
and synthetic silica in palm oil physical refining, Food Chemistry, 82, 291–296
Rožic, L. Tatjana, N., and Srđan P. (2010), Modeling and optimization process parameters of
acid activation of bentonite by response surface methodology, Applied Clay Science
48, 154–158
Sipag Bisalta, la bentonite: Bentonite structure, retrieved on 10th
October 2014
82
Topallar, H., (1998), The Adsorption Isotherms of the Bleaching of Sunflower-Seed Oil,
Turkish Journal of Chemistry 22, 143-148
Usman, M. A., Ekwueme, V. I. Alaje, T. O., and Mohammed, A. O., (2012),
Characterization, Acid Activation, and Bleaching Performance of Ibeshe Clay,
Lagos, Nigeria, International Scholarly Research Network Ceramics, 1-5
Usman, M. A., Oribayo, O., and Adebayo, A. A., (2013), Bleaching of Palm Oil by Activated
Local Bentonite and Kaolin Clay from Afashio, Edo-Nigeria, Chemical and Process
Engineering Research, 10, 1-12
Vijayakumar B., Nagendrappa G. and Prakash B.S.J., (2009), Acid Activated Indian
Bentonite, an Efficient Catalyst for Esterification of Carboxylic Acids, catalysis
letters, 128 (1-2),183-189
World Integrated Trade Solutions, (2014), HS 1997, Data retrieved May 6th 2014 from
http://wits.worldbank.org/WITS/WITS/AdvanceQuery/RawTradeData/QueryDefinit
ion.aspx?Page=RawTradeData
Worthen G. (1938) isopropyl alcohol as a solvent for free fatty acid titration, oil &soap,
15(7), 189-190
World wide fund (WWF), (2012) Investor guidance on palm oil, the role of investor in
supporting the development of a sustainable palm oil industry, Palm oil investor
review, 1-42
www.kenyabrussels.com/Investment_Opportunities, Kenya embassy, July 2011, 1-9
83
APPENDICES
Appendix A: Wavelength, detection limits and optimum conditions of chemical
composition analysis of clay samples by AAS
Oxides Wavelength
(nm)
Flame Silt
(nm)
Flow
(/min)
TiO2 364.0 Acetylene gas 0.5 4.5
SiO2 251.6 Acetylene gas 0.2 4.5
Al2O3 309.3 N2O-Acetylene gas 0.5 4.5
Fe2O3 248.3 Air-Acetylene gas 0.2 1.5
MnO 279.5 Air-Acetylene gas 0.2 1.5
MgO 285.2 Air-Acetylene gas 0.5 1.5
Na2O 589.0 Air-Acetylene gas 0.5 1.5
CaO 422.7 N2O-Acetylene gas 0.5 4.5
K2O 766.5 Air-Acetylene gas 1.0 1.5
Appendix B: Apparent bulk density of Athi River bentonite clay
Run 1 Run 2
Clay sample VF (g)
VF+S (g)
V
(ml) S (g) D
(g/ml)1 VF (g) VF+S
(g) V
(ml) S (g) D
(g/ml)2 Average
(g/ml) SD
A0 21.9378 25.1012 3.1 3.1634 1.02045 21.9378 25.0263 3 3.0885 1.0295 1.02498 0.0064
A1 21.9437 24.1904 3.1 2.2467 0.72474 21.9411 24.0556 2.7 2.1145 0.78315 0.75395 0.0413
A2 21.9417 23.5039 2.8 1.5622 0.55793 21.939 23.6119 2.6 1.6729 0.64342 0.60068 0.06045
A3 21.94 23.3601 2.8 1.4201 0.50718 21.9377 23.3207 2.8 1.383 0.49393 0.50055 0.00937
A4 21.939 23.1176 2.6 1.1786 0.45331 21.94 23.2021 2.7 1.2621 0.46744 0.46038 0.01
A5 21.939 23.1755 2.7 1.2365 0.45796 21.9378 23.2085 2.8 1.2707 0.45382 0.45589 0.00293
A5-30 21.9408 23.3262 2.8 1.3854 0.49479 21.9055 23.2629 2.8 1.3574 0.48479 0.48979 0.00707
A5-50 21.9393 23.4243 2.7 1.485 0.55 21.941 23.4328 2.7 1.4918 0.55252 0.55126 0.00178
A5-70 21.941 24.0601 3 2.1191 0.70637 21.9393 24.0104 3.1 2.0711 0.6681 0.68723 0.02706
CBE 21.9055 23.7629 2.6 1.8574 0.71438 21.9378 23.8026 2.6 1.8648 0.71723 0.71581 0.00201
84
Appendix C: Apparent bulk density of Thika bentonite clay
Run 1 Run 2
Clay
sample VF(g) VF + S
(g) V(ml) S(g) D(g/ml) VF(g) VF +
S(g) V(ml) S(g) D(g/ml) AVRG(g/ml) Sd
T0 21.94 25.6193 3.3 3.6793 1.11494 21.941 25.5017 3.2 3.5607 1.11272 1.11383 0.00157
T1 21.9437 25.8869 3.4 3.9432 1.15976 21.9386 26.0112 3.3 4.0726 1.23412 1.19694 0.05258
T2 21.9408 25.7683 3.2 3.8275 1.19609 21.9398 25.8027 3.1 3.8629 1.2461 1.2211 0.03536
T3 21.9417 25.8125 3.2 3.8708 1.20963 21.9408 25.7317 3.1 3.7909 1.22287 1.21625 0.00937
T4 21.9398 25.7119 3.1 3.7721 1.21681 21.9418 25.5521 3 3.6103 1.20343 1.21012 0.00946
T5 21.941 25.6109 3.1 3.6699 1.18384 21.9408 25.5307 3 3.5899 1.19663 1.19024 0.00905
T5-30 21.9437 25.9817 3.2 4.038 1.26188 21.9428 26.0698 3.3 4.127 1.25061 1.25624 0.00797
T5-50 21.9408 25.9797 3.2 4.0389 1.26216 21.9398 25.9891 3.3 4.0493 1.22706 1.24461 0.02482
T5-70 21.9399 25.5912 3.1 3.6513 1.17784 21.94 25.9677 3.2 4.0277 1.25866 1.21825 0.05715
Where A and T are Athi River and Thika bentonite clay, numbers represent the acid concentration used during activation.

85
Appendix D: Moisture content of Athi River bentonite clay
Clay
sample
Empty
vial (g)
Vial + Wet
Sample (g)
Vial + Dry
sample (g)
Wt. of wet
sample (g) Wt of Dry (g) Moisture (%)
AV.
Moisture SD
A01 50.6046 51.6423 51.5779 1.0377 0.9733 6.206033 5.698185
0.718205
A02 67.4293 68.7664 68.697 1.3371 1.2677 5.190337
A11 40.1584 41.3159 41.2504 1.1575 1.092 5.658747 7.580606
2.717919
A12 66.8763 67.9918 67.8858 1.1155 1.0095 9.502465
A21 69.5385 70.5769 70.4816 1.0384 0.9431 9.177581 7.182009
2.822164
A22 63.3296 64.5713 64.5069 1.2417 1.1773 5.186438
A31 40.1603 41.2626 41.2228 1.1023 1.0625 3.610632 3.453821
0.221764
A32 62.8397 63.9134 63.878 1.0737 1.0383 3.29701
A41 63.3285 64.396 64.36 1.0675 1.0315 3.372365 3.21283
0.225618
A42 64.3523 65.4331 65.4001 1.0808 1.0478 3.053294
A51 64.3487 65.3766 65.3512 1.0279 1.0025 2.471057 2.387523
0.118135
A52 62.8356 63.708 63.6879 0.8724 0.8523 2.303989

86
Appendix E: Moisture content of Thika bentonite clay
Clay
sample
Empty
vial(g)
Vial + Wet
Sample(g)
Vial + Dry
sample (g)
Wt. of wet
sample (g) Wt of Dry (g)
Moisture
(%)
Average
Moisture
content SD
T01 69.5363 70.8355 70.7199 1.2992 0.1156 8.897783 10.07196 1.660542
T02 66.8808 67.9505 67.8302 1.0697 0.1203 11.24614
T11 43.8652 44.9284 44.9187 1.0632 0.1097 10.31791 10.03126 0.405378
T12 54.9472 56.0945 56.0827 1.1473 0.1118 9.744618
T21 50.6046 51.6423 51.6296 1.0377 0.1127 10.86056 10.03237 1.171229
T22 67.4293 68.7374 68.717 1.3081 0.1204 9.204189
T31 69.5385 70.5769 70.5636 1.0384 0.1133 10.91102 9.768144 1.616266
T32 63.3296 64.5713 64.5642 1.2417 0.1071 8.625272
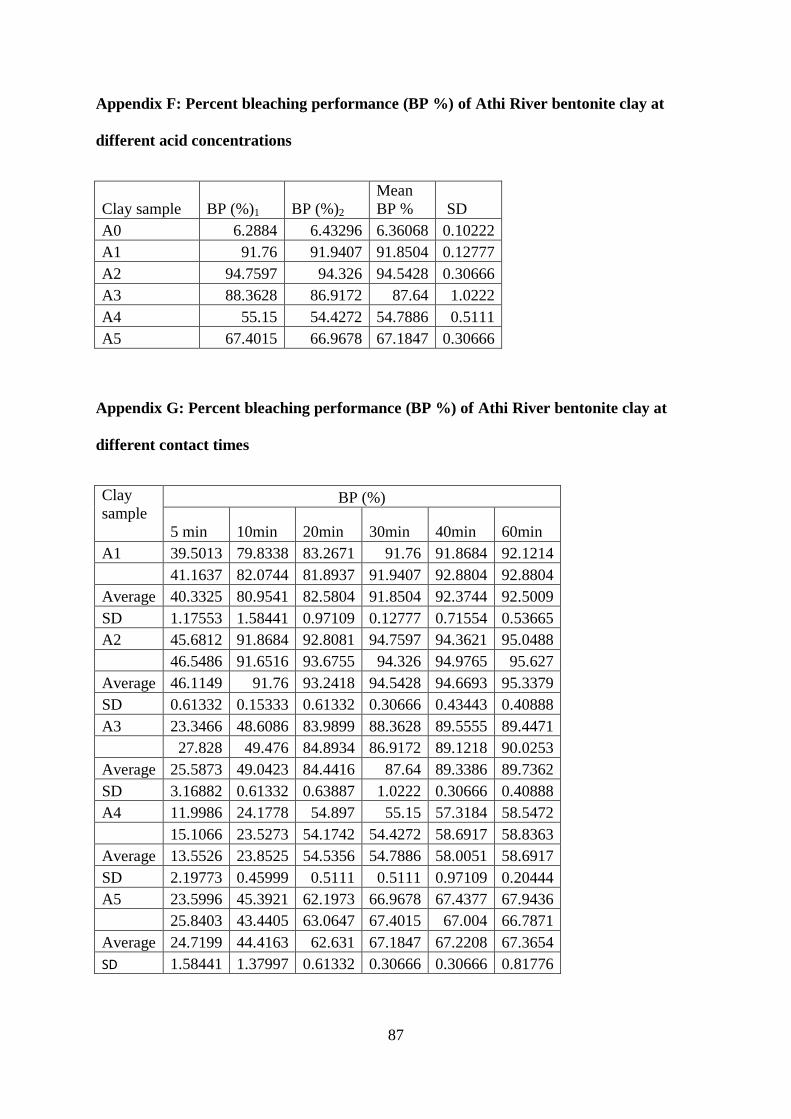
87
Appendix F: Percent bleaching performance (BP %) of Athi River bentonite clay at
different acid concentrations
Clay sample BP (%)1 BP (%)2
Mean
BP % SD
A0 6.2884 6.43296 6.36068 0.10222
A1 91.76 91.9407 91.8504 0.12777
A2 94.7597 94.326 94.5428 0.30666
A3 88.3628 86.9172 87.64 1.0222
A4 55.15 54.4272 54.7886 0.5111
A5 67.4015 66.9678 67.1847 0.30666
Appendix G: Percent bleaching performance (BP %) of Athi River bentonite clay at
different contact times
Clay
sample
BP (%)
5 min 10min 20min 30min 40min 60min
A1 39.5013 79.8338 83.2671 91.76 91.8684 92.1214
41.1637 82.0744 81.8937 91.9407 92.8804 92.8804
Average 40.3325 80.9541 82.5804 91.8504 92.3744 92.5009
SD 1.17553 1.58441 0.97109 0.12777 0.71554 0.53665
A2 45.6812 91.8684 92.8081 94.7597 94.3621 95.0488
46.5486 91.6516 93.6755 94.326 94.9765 95.627
Average 46.1149 91.76 93.2418 94.5428 94.6693 95.3379
SD 0.61332 0.15333 0.61332 0.30666 0.43443 0.40888
A3 23.3466 48.6086 83.9899 88.3628 89.5555 89.4471
27.828 49.476 84.8934 86.9172 89.1218 90.0253
Average 25.5873 49.0423 84.4416 87.64 89.3386 89.7362
SD 3.16882 0.61332 0.63887 1.0222 0.30666 0.40888
A4 11.9986 24.1778 54.897 55.15 57.3184 58.5472
15.1066 23.5273 54.1742 54.4272 58.6917 58.8363
Average 13.5526 23.8525 54.5356 54.7886 58.0051 58.6917
SD 2.19773 0.45999 0.5111 0.5111 0.97109 0.20444
A5 23.5996 45.3921 62.1973 66.9678 67.4377 67.9436
25.8403 43.4405 63.0647 67.4015 67.004 66.7871
Average 24.7199 44.4163 62.631 67.1847 67.2208 67.3654
SD 1.58441 1.37997 0.61332 0.30666 0.30666 0.81776

88
Appendix H: Percent bleaching performance (BP %) of Thika bentonite clay at
different contact times
BP (%)
10 min 20 min 30 min 40 min
T11 23.63571 71.95519 57.39068 58.36646
T12 24.75605 72.67799 58.33032 59.08927
Average 24.19588 72.31659 57.8605 58.72786
SD 0.792205 0.5111 0.66443 0.5111
T21 25.1536 56.59559 35.63426 42.64546
T22 24.17781 53.12613 32.30936 40.18793
Average 24.6657 54.8609 33.9718 41.4167
SD 0.68998 2.45328 2.35106 1.73774
T31 39.50126 50.63245 35.99566 35.20058
T32 37.98338 49.22299 38.38092 36.57391
Average 38.7423 49.9277 37.1883 35.8872
SD 1.07331 0.99664 1.68663 0.97109
T41 50.88544 54.57174 45.35598 38.34478
T42 51.68052 56.08963 46.07879 37.69425
Average 51.283 55.3307 45.7174 38.0195
SD 0.56221 1.07331 0.5111 0.45999
T51 42.57318 54.13806 24.50307 27.68341
T52 42.03108 51.7528 25.94868 28.11709
Average 42.30213 52.94543 25.22588 27.90025
SD 0.383325 1.68663 1.0222 0.30666

89
Appendix I: Percent bleaching performance (BP %) of Athi River bentonite clay at
different clay amounts
20 min
Clay amount
(g) BP (%)1 BP (%)2 Mean SD
0.005 38.41706 37.04373 37.73039 0.97109
0.01 92.15757 93.02494 92.59125 0.61332
0.015 94.68739 95.62703 95.15721 0.66443
0.02 93.31406 94.10914 93.7116 0.56221
0.03 93.27792 94.50669 93.8923 0.86887
0.04 96.09686 96.81966 96.45826 0.5111
30 min
0.005 40.98301 39.68197 40.33249 0.91998
0.01 95.08493 93.96458 94.52476 0.792205
0.015 96.45826 95.88001 96.16914 0.40888
0.02 96.92808 96.63896 96.78352 0.20444
0.03 98.30141 97.28948 97.79545 0.71554
0.04 98.80737 98.22913 98.51825 0.40888
Appendix J: Percent bleaching performance (BP %) of Thika bentonite clay at different
clay amount s
20 Min
Clay amount
(g) BP (%)1 BP (%)2 Average SD
0.005 35.20058 35.92338 35.56198 0.5111
0.01 73.00325 71.62992 72.31659 0.97109
0.02 76.03903 78.20744 77.12324 1.5333
0.03 78.09902 78.67727 78.38815 0.40888
0.04 78.49657 79.65305 79.07481 0.81776
30 Min
0.005 33.93567 32.85146 33.39357 0.76665
0.01 57.20997 58.51102 57.8605 0.91998
0.02 66.10047 67.32924 66.71485 0.86887
0.03 70.32888 67.79906 69.06397 1.78885
0.04 71.37694 71.77449 71.57571 0.281105

90
Appendix K: Percent bleaching performance (BP %) of Athi River bentonite clay at different temperatures
Clay
sample BP% Average BP % ± SD
70°C 90°C 100°C 120°C 70°C 90°C 100°C 120°C
A1
73.5815 71.0517 80.9180 84.9657 89.1218 89.8446 93.0611 92.6997
72.3166
±1.78
82.9418
±2.8
89.4832
±0.51
92.8804
± 0.25
A2
80.7011 84.5320 93.8923 92.5913 93.4586 93.0972 95.3379 93.9646
82.6166
±2.7
93.2418
±0.9
93.2779
±0.25
94.6512
±0.97
A3
74.6657 69.4615 82.7611 81.6046 67.5099 66.7871 65.7029 67.0040
72.0636
±3.6
82.1829
±0.8
67.1485
± 0.51
66.3535
±0.91
A4
44.1634 45.6812 54.3549 54.7163 46.1872 48.9339 44.9584 49.1507
44.9223
±1.07
54.5356
±0.25
47.5605
±1.96
47.0546
±2.9
A5
50.5963 52.9816 63.7152 61.5468 60.8240 62.3419 60.7517 62.5587
51.7889
4 ±1.68
62.6310
±1.5
61.5829
±1.07
61.6552
±1.27

91
Appendix L: Oil density after bleaching with prepared activated clay samples
Clay minerals D (g/ml)
A1
A2
A3
A4
A5
T1
T2
T3
T4
T5
0.9340
0.9375
0.9347
0.9354
0.9368
0.9375
0.9369
0.9360
0.9369
0.9370
Appendix M: Titration of FFA
Mixture and oil and isopropanol + indicator; the solution after adding one drop of NaOH; the
solution at end point.
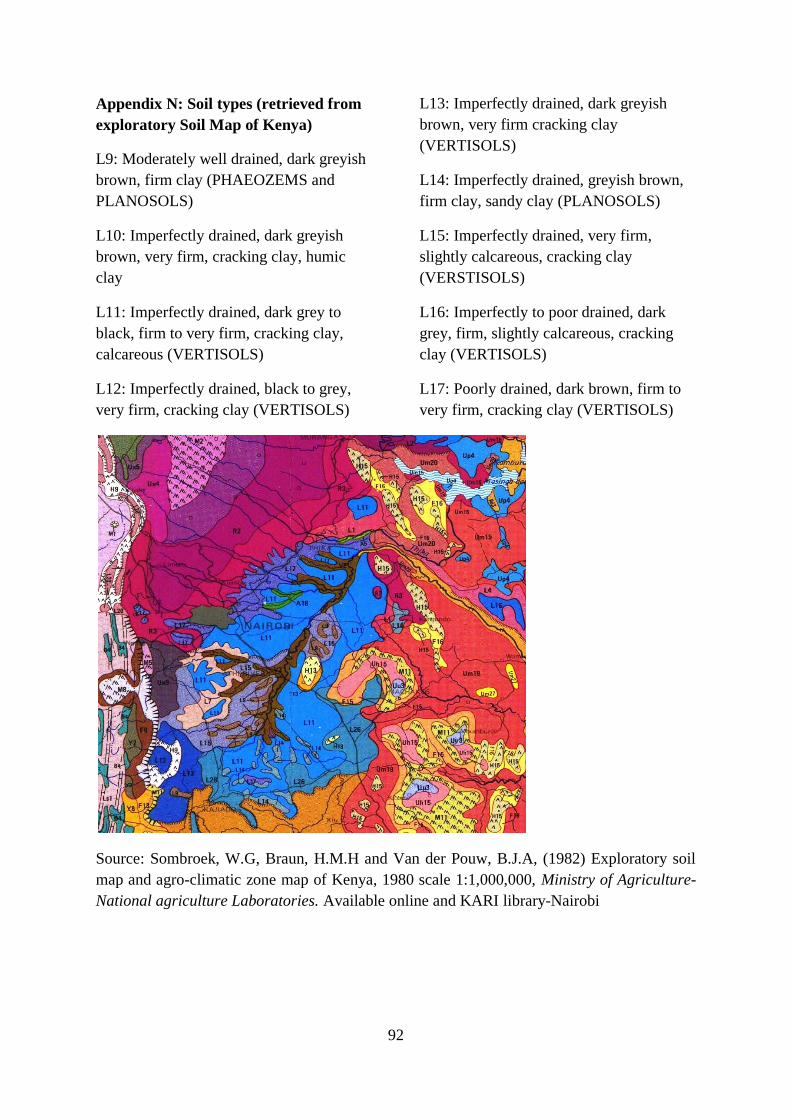
92
Appendix N: Soil types (retrieved from
exploratory Soil Map of Kenya)
L9: Moderately well drained, dark greyish
brown, firm clay (PHAEOZEMS and
PLANOSOLS)
L10: Imperfectly drained, dark greyish
brown, very firm, cracking clay, humic
clay
L11: Imperfectly drained, dark grey to
black, firm to very firm, cracking clay,
calcareous (VERTISOLS)
L12: Imperfectly drained, black to grey,
very firm, cracking clay (VERTISOLS)
L13: Imperfectly drained, dark greyish
brown, very firm cracking clay
(VERTISOLS)
L14: Imperfectly drained, greyish brown,
firm clay, sandy clay (PLANOSOLS)
L15: Imperfectly drained, very firm,
slightly calcareous, cracking clay
(VERSTISOLS)
L16: Imperfectly to poor drained, dark
grey, firm, slightly calcareous, cracking
clay (VERTISOLS)
L17: Poorly drained, dark brown, firm to
very firm, cracking clay (VERTISOLS)
Source: Sombroek, W.G, Braun, H.M.H and Van der Pouw, B.J.A, (1982) Exploratory soil
map and agro-climatic zone map of Kenya, 1980 scale 1:1,000,000, Ministry of Agriculture-
National agriculture Laboratories. Available online and KARI library-Nairobi

93
Appendix O: Kenya's imports of decolourising and fuller's earth, 1997-2007 (World
Integrated Trade Solutions, 2014)
YEAR VALUE IN 1000 US$ QUANTITY, KG
1997 41.331 75,878
1998 37.065 73,375
1999 157.308 392,250
2000 47.391 133,484
2001 249.33 569,483
2002 169.417 465,000
2003 186.137 521,261
2004 190.994 545,022
2005 187.238 528,795
2006 260.124 747,890
2007 252.763 739,756

94
Appendix 16: Characteristics of palm oil
Parameters
CPO BPO ( A) BPO (CBE)
Colour
Orange- red Yellow Yellow
FFA (%)
6.68 0.268 6.68
Peroxide value
ND ND ND
Iodine value
ND ND ND
Density (g/ml)
0.9377 0.9375 0.9361
BP (%) 6.3 98 97
ND: Not determined, CPO: crude palm oil, BPO: bleached palm oil, CBE: commercial
bleaching earth, A: Athi River bentonite clay


![SURFACE MELTING AND THERMAL ABLATION ...chalcogen.ro/1161_Preoteasa.pdfwhitening [9] and activation of teeth bleaching agents [10], and caries prevention by surface modifications of](https://img.pdfslide.us/doc/110x75/5f7b962af18fdc1987195599/surface-melting-and-thermal-ablation-whitening-9-and-activation-of-teeth-bleaching.jpg)