Embed Size (px)
Citation preview

Optimization and design of enzyme based biosensors for high temporal recording of molecules important in brain chemistry.
Bachelor of Science Thesis
Department of Chemical and Biological engineering CHALMERS UNIVERSITY OF TECHNOLOGY Gothenburg, Sweden 2016
Hampus Lindmark
Ann-Sofie Cans - Examiner Yuanmo Wang- Head supervisor Jenny Bergman- Supervisor

Acknowledgement
First and foremost I would like to express my sincere gratitude towards my head supervisor, PhD
student Yuanmo Wang. Your guidance, support and encouragement throughout these three months
have been very valuable. One could not wish for a better supervisor.
I would like to give a special thanks to my examiner, Associate Professor Ann-Sofie Cans. Your feedback
on my thesis and your support has been of huge help during this project. Thank you for introducing me
in to the fascinating world of neurochemistry.
I would like to thank my supervisor, PhD student Jenny Berggren for helping me understand the
fundamentals of electrochemistry.
I wish to thank the staff members on the 4th and 5th floor who helped me set up instruments.
Finally I would like to thank my family and friends for their support and encouragement.
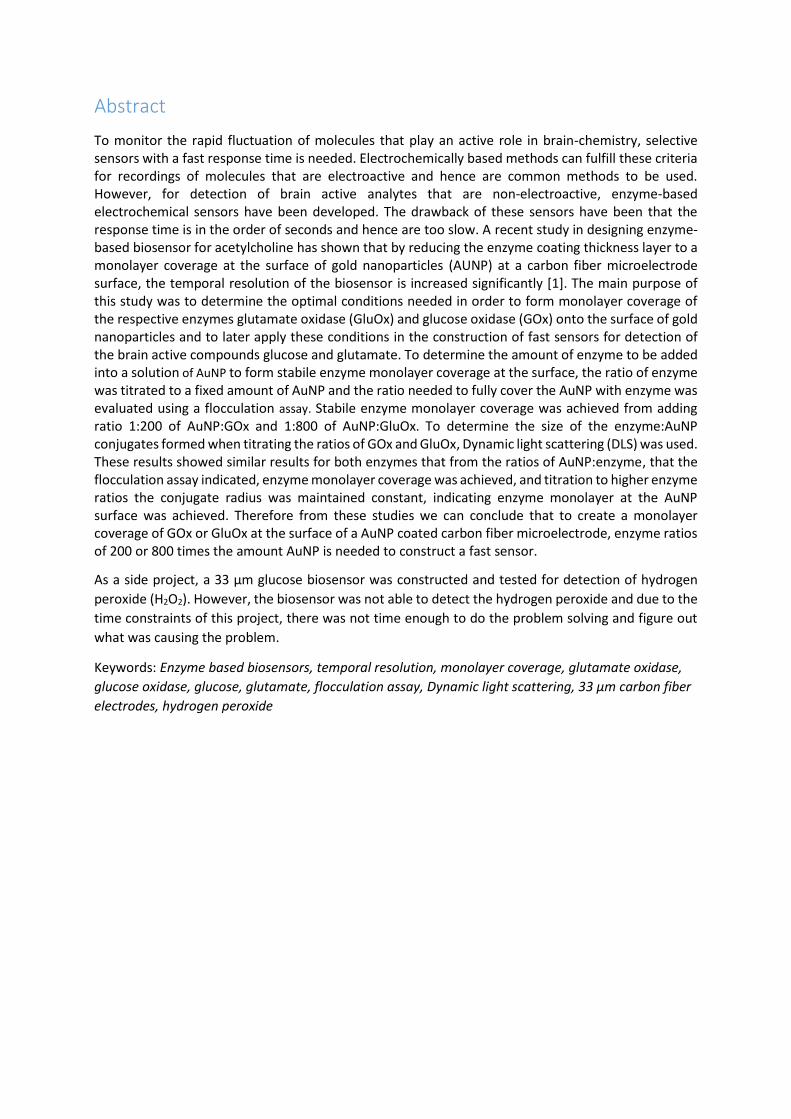
Abstract
To monitor the rapid fluctuation of molecules that play an active role in brain-chemistry, selective sensors with a fast response time is needed. Electrochemically based methods can fulfill these criteria for recordings of molecules that are electroactive and hence are common methods to be used. However, for detection of brain active analytes that are non-electroactive, enzyme-based electrochemical sensors have been developed. The drawback of these sensors have been that the response time is in the order of seconds and hence are too slow. A recent study in designing enzyme- based biosensor for acetylcholine has shown that by reducing the enzyme coating thickness layer to a monolayer coverage at the surface of gold nanoparticles (AUNP) at a carbon fiber microelectrode surface, the temporal resolution of the biosensor is increased significantly [1]. The main purpose of this study was to determine the optimal conditions needed in order to form monolayer coverage of the respective enzymes glutamate oxidase (GluOx) and glucose oxidase (GOx) onto the surface of gold nanoparticles and to later apply these conditions in the construction of fast sensors for detection of the brain active compounds glucose and glutamate. To determine the amount of enzyme to be added into a solution of AuNP to form stabile enzyme monolayer coverage at the surface, the ratio of enzyme was titrated to a fixed amount of AuNP and the ratio needed to fully cover the AuNP with enzyme was evaluated using a flocculation assay. Stabile enzyme monolayer coverage was achieved from adding ratio 1:200 of AuNP:GOx and 1:800 of AuNP:GluOx. To determine the size of the enzyme:AuNP conjugates formed when titrating the ratios of GOx and GluOx, Dynamic light scattering (DLS) was used. These results showed similar results for both enzymes that from the ratios of AuNP:enzyme, that the flocculation assay indicated, enzyme monolayer coverage was achieved, and titration to higher enzyme ratios the conjugate radius was maintained constant, indicating enzyme monolayer at the AuNP surface was achieved. Therefore from these studies we can conclude that to create a monolayer coverage of GOx or GluOx at the surface of a AuNP coated carbon fiber microelectrode, enzyme ratios of 200 or 800 times the amount AuNP is needed to construct a fast sensor.
As a side project, a 33 µm glucose biosensor was constructed and tested for detection of hydrogen
peroxide (H2O2). However, the biosensor was not able to detect the hydrogen peroxide and due to the
time constraints of this project, there was not time enough to do the problem solving and figure out
what was causing the problem.
Keywords: Enzyme based biosensors, temporal resolution, monolayer coverage, glutamate oxidase,
glucose oxidase, glucose, glutamate, flocculation assay, Dynamic light scattering, 33 µm carbon fiber
electrodes, hydrogen peroxide

Table of contents 1. Introduction ............................................................................................................................. 1
2. Purpose .................................................................................................................................... 3
3. Background and theory ............................................................................................................. 4
3.1 Exocytosis ...................................................................................................................................... 4
3.2 Gold nanoparticles ........................................................................................................................ 4
3.3 Fundamentals of electrochemistry ............................................................................................... 5
4.0 Experimental methods ............................................................................................................ 6
4.1 Amperometry ................................................................................................................................ 6
4.2 Cyclic Voltammetry ....................................................................................................................... 6
4. 3 Ultraviolet-visible spectroscopy, UV-VIS ...................................................................................... 7
4. 4 Dynamic light scattering, DLS ....................................................................................................... 8
5. Method .................................................................................................................................... 9
5.1 Flocculation assay .......................................................................................................................... 9
5.2 DLS analysis for determination of AuNP:enzyme conjugate hydrodynamic diameter. .............. 12
5.3 Designing 33 carbon fiber microelectrodes (CFME) .................................................................... 13
5.3 Designing glucose biosensor ....................................................................................................... 15
6. Results and discussion ............................................................................................................ 17
6.1 Flocculation assay ........................................................................................................................ 17
6.2 Hydrodynamic diameter .............................................................................................................. 19
6.3 Glucose biosensor ....................................................................................................................... 21
7. Conclusion .............................................................................................................................. 22
9. Summary ................................................................................................................................ 23
9. References ............................................................................................................................. 24

1
1. Introduction In order to get a better understanding of neurological diseases it is important to study intercellular
communication between neurons to gain better insights of the mechanisms for neuronal
communication in healthy brain function. The brain is the center of our nervous system and is
responsible for controlling our organs and our body. Neurons, the nerve cells that act as building blocks
in the nervous system, are responsible for transmitting signals both from our body to our brain and
also between themselves in the complex neuronal networks of the brain [2].
The critical step in the transmission of a signal from one neuron to another is the electrical nerve signal
at one neuron triggering the release of neurotransmitters into the thin gap space between two
neurons in a process referred to as exocytosis. These neurotransmitters can diffuse across the gap and
bind to specific receptors at the neighboring nerve cell and trigger a nerve signal to further be
transmitted [2]. Disorders that change the production, release or reception of neurotransmitter can
cause neurological diseases [3]. Therefore, with improved understanding of the basis for intercellular
communication between nerve cells, development of drugs that modifies neurotransmission can be
manufactured. Glutamate is the most common excitatory neurotransmitter in our brain and is involved
in major brain function such as cognition, memory and learning, thus it is important to understand its
function and activity in the brain. In addition, it is indicated that glutamate may have some involvement
in chronic neurodegenerative processes and disorders, such as schizophrenia and Alzheimer’s disease
[5].
The brains primary source of fuel is glucose. Neurotransmission in mammals’ brain is a very energy
demanding process and requires a high intake of glucose in order to work properly. Glucose provides
the brain with ATP molecules through glucose metabolism and disruption in this process is linked to
several different diseases [6, 7].
Since exocytotic release takes place on the sub-millisecond to millisecond time scale there are some
challenges to monitor these events at live cells and in brain tissue [1]. Today, techniques based on
electrochemistry such as amperometry, are being recognized as one of the most effective methods for
monitoring exocytosis due to the high temporal resolution and sensitivity. Amperometric recordings
are most commonly performed by placing a carbon fiber microelectrode in close proximity to a
secretory cell or in the tissue of the brain. Then by applying a potential to the electrode surface,
neurotransmitters released during the exocytosis process can be oxidized or reduced when these
molecules encounter the electrode surface, which result in detection of an amperometric current
spike. Each single current spike corresponds to detection of the neurotransmitter molecules released
from one single vesicle exocytosis release event. These current spikes can be used to determine release
kinetics of exocytosis and the number of signaling molecules released per event [8].
However, some neurotransmitters, such as glutamate and acetylcholine and also other brain active
molecules such as glucose, are not electroactive and therefore it is important to find new fast and
sensitive detection schemes for glutamate and glucose [9, 10]. A methodology developed for detection
of non-electroactive compounds has been enzyme based electrochemical biosensors. These
biosensors consist of two parts: an enzyme and an electrode. The enzyme recognizes the analyte and
catalyzes a reaction that ultimately produces an electro-active molecule from the analyte, which can
be detected by a redox reaction at the electrode surface [4]. In the case of a glutamate sensor, the
enzyme glutamate oxidase is attached to the surface of the electrode, and catalyzes the reaction of
glutamate into product formation of hydrogen peroxide (H2O2), which is electroactive. Through an
oxidation or reduction reaction at the electrode surface, a detectable amperometric current is
measured that is used for determining the number of glutamate in solution. The reaction scheme for

2
glutamate oxidase to transform glutamate into hydrogen peroxide and the subsequent reduction
reaction of hydrogen peroxide that is amperometrically recorded at the electrode can be summarized
in the following two reactions [11]:
In the case of a glucose sensor, the enzyme glucose oxidase is attached to the surface of the electrode
and catalyzes the reaction of glucose into product formation of hydrogen peroxide. The reaction
scheme for glucose oxidase to transform glucose into H2O2 and the subsequent reduction reaction of
hydrogen peroxide that is amperometrically recorded at the electrode can be summarizes in the
following two reactions [12]:
Figure 2. Reaction mechanism describing the formation of hydrogen peroxide from glucose with GOx catalyzing the reaction.
Enzymes that are placed directly on a flat electrode surface has less resistance to denaturation than
enzymes adsorbed on highly curved surfaces. Since denaturation of enzymes reduces enzymatic
activity and leads to less efficient biosensors, it is important to find an enzyme attachment scheme to
the sensor surface that prevents denaturation to achieve as high retained enzymatic activity as
possible. By letting enzymes adsorb onto nanoparticles attached to the electrode surface, a stable
environment for the enzyme is created by providing a surface with high curvature for them to adsorb
to thus reducing the chance for denaturation of the enzyme [1].
Enzyme based biosensors have long time suffered from slow response time, on the time scale of
seconds, and are therefore not fast enough to monitor single exocytosis events in the brain. Recent
research on biosensor design has shown that by reducing the number of enzymes adsorbed on the
surface of gold nanoparticle coated on carbon fiber microelectrode into a monolayer coverage, the
risk for enzymes to create steric hindrance is reduced and the transport distance for the analyte to
reach the electrode surface for detection is more than 100 times faster than previous developed
technology. This leads to a temporal resolution of the biosensor that is fast enough to time resolve the
fast fluctuations of neurotransmitter release in the brain during recording of neuronal communication
[1]. Therefore to attach enzymes onto nanoparticle coated electrodes and limit the enzyme coverage
to a monolayer, the retained enzymatic activity and temporal resolution can be optimized. The enzyme
biosensor fabrication and function for glutamate and glucose biosensors is described in figure 3.
Figure 1. Reaction mechanism describing the formation of hydrogen peroxide from glutamate. Glutamate oxidase (GluOx) catalyzes the first reaction, forming hydrogen peroxide. At a certain potential, hydrogen peroxide and the electrode surface will undergo a redox reaction leading to an electron transport between hydrogen peroxide and the electrode surface.
3
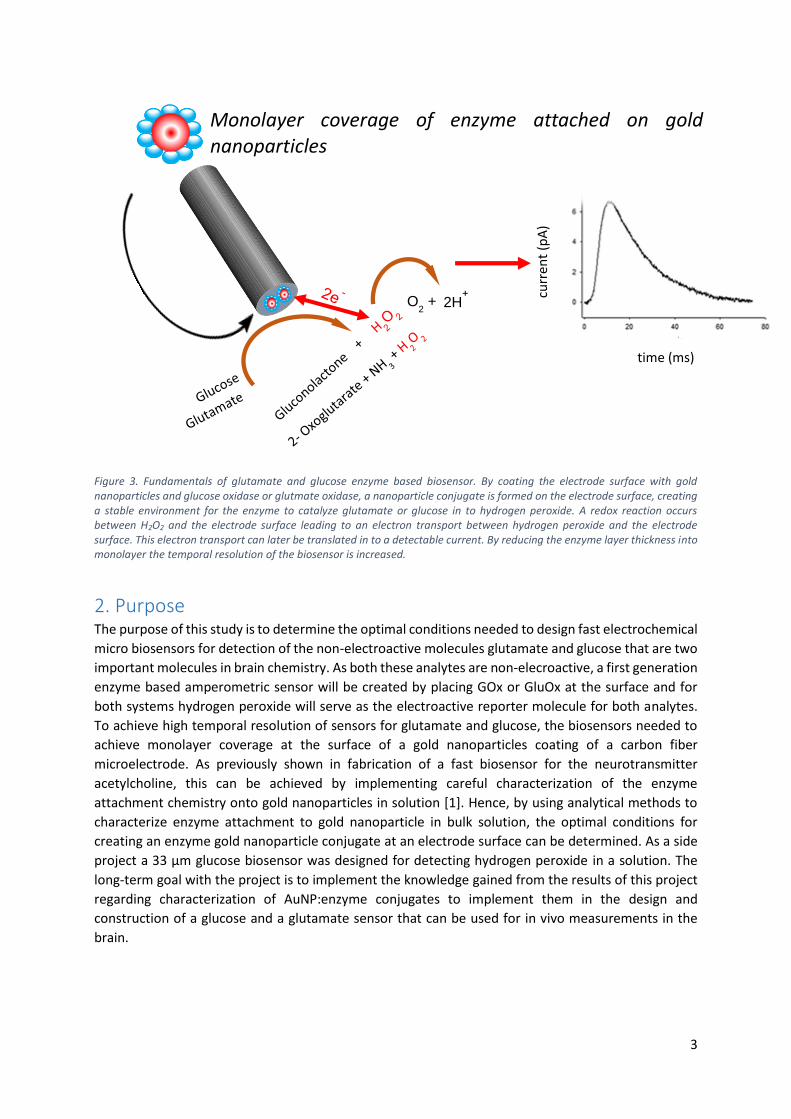
Figure 3. Fundamentals of glutamate and glucose enzyme based biosensor. By coating the electrode surface with gold nanoparticles and glucose oxidase or glutmate oxidase, a nanoparticle conjugate is formed on the electrode surface, creating a stable environment for the enzyme to catalyze glutamate or glucose in to hydrogen peroxide. A redox reaction occurs between H2O2 and the electrode surface leading to an electron transport between hydrogen peroxide and the electrode surface. This electron transport can later be translated in to a detectable current. By reducing the enzyme layer thickness into monolayer the temporal resolution of the biosensor is increased.
2. Purpose The purpose of this study is to determine the optimal conditions needed to design fast electrochemical
micro biosensors for detection of the non-electroactive molecules glutamate and glucose that are two
important molecules in brain chemistry. As both these analytes are non-elecroactive, a first generation
enzyme based amperometric sensor will be created by placing GOx or GluOx at the surface and for
both systems hydrogen peroxide will serve as the electroactive reporter molecule for both analytes.
To achieve high temporal resolution of sensors for glutamate and glucose, the biosensors needed to
achieve monolayer coverage at the surface of a gold nanoparticles coating of a carbon fiber
microelectrode. As previously shown in fabrication of a fast biosensor for the neurotransmitter
acetylcholine, this can be achieved by implementing careful characterization of the enzyme
attachment chemistry onto gold nanoparticles in solution [1]. Hence, by using analytical methods to
characterize enzyme attachment to gold nanoparticle in bulk solution, the optimal conditions for
creating an enzyme gold nanoparticle conjugate at an electrode surface can be determined. As a side
project a 33 µm glucose biosensor was designed for detecting hydrogen peroxide in a solution. The
long-term goal with the project is to implement the knowledge gained from the results of this project
regarding characterization of AuNP:enzyme conjugates to implement them in the design and
construction of a glucose and a glutamate sensor that can be used for in vivo measurements in the
brain.
2H+ O
2 +
Monolayer coverage of enzyme attached on gold nanoparticles
time (ms)
curr
ent
(pA
)

4
3. Background and theory
3.1 Exocytosis Exocytosis is the critical step in the transmission of a signal from one neuron to another as illustrated
in figure 4. When a nerve cell is stimulated, sodium ion channels will open, allowing sodium ions in to
the cell. This action change the negative resting potential of the membrane in to a more positive
potential. This new potential is called the action potential and stimulates two processes; the opening
of nearby sodium ion channel that allows Na+ flux into the cell and the subsequent opening of K+ ion
channels, allowing K+ ions to diffuse out of the cell and restore the potential to its ground state. In this
way the action potential will carry the signal forward to the end of the axon [2 - 4]
When a signal reaches the end of the axon, voltage gated Ca2+ channels opens, allowing the transport
of Ca2+ ions in to the cell from the extracellular space. When the intracellular concentration of Ca2+
increases, vesicles that are stored inside the cell and filled with neurotransmitters will fuse with the
plasma membrane. The neurotransmitters are then released into the thin space between the two
nerve cells called the synaptic cleft where they can then bind to receptors on an adjacent nerve cell,
transmitting the signal forward [2 - 4].
Figure 4. Schematic of exocytosis as neurotransmitter signaling occurs between interconnected neurons. Left of the schematic shows neurons connecting to one another and to the right is an image zooming in on the synapse of one neuron connecting to the dendrite of the neighboring neuron. Neurotransmitters are loaded into and stored in vesicles in the cytoplasm of a neuronal synapse. These vesicles can dock and prime to the plasma membrane by the SNARE-proteins in the vesicle and plasma membrane. When a nerve signal triggers Ca2+ channels to open, causing Ca2+ influx into the cell and triggers vesicles to fuse with the plasma membrane. This leads to release of neurotransmitter into the synaptic cleft, where the neurotransmitters diffuses across the synaptic cleft and bind to receptors on an adjacent cell and can lead to transporting the signal forward [2].
3.2 Gold nanoparticles Nanoparticles are particles with a diameter that ranges between 1 to 100 nm in size. At this dimension
the nanoparticles display behavior that is linking the properties of the corresponding bulk material to
the atomic level that the nanoparticle is composed of. Therefore nanoparticles often possess
unexpected chemical and physical properties. For instance, chemical reactivity and optical properties
of nanoparticles are significantly different than bulk. Nanoparticles in general have a large surface-
area-to-volume ratio, which means that if nanoparticles are used for sensor surface, modification will
significantly increase the total sensor surface area. This allows for a larger amount of molecules to be
adsorbed to the electrode surface while still limiting the enzyme coating to a monolayer, which is
useful for designing a fast biosensor [1, 13].
<<<<<<<
5
Biomolecules can easily be immobilized onto gold nanoparticles by either covalent bonding or non-
covalent interactions such as electrostatic and van der Waal interactions between a nanoparticle and
the enzyme. Immobilization of enzymes on gold nanoparticles may both enhance and decrease the
enzyme activity depending on the properties of the gold nanoparticle and the properties of the
enzyme. Therefore, it is of great importance to carefully characterize the interactions of enzyme
attachment to a nanoparticle material and evaluate the retained enzymatic activity after nanoparticle
immobilization. Previous studies has shown that when enzymes are adsorbed on nanoparticles with a
low surface curvature structure or flat surface, there is an increased risk for the enzyme to reform
from its natural state leading to a denaturation state upon binding and hence leading to a loss in
enzyme activity. As the nanoparticle size decrease, its structure gains higher surface curvature.
Therefore, for many enzymes the high curvature of very small nanoparticles stabilize the three-
dimensional structure of the enzyme, leading to a more stable enzyme activity [1, 14].
In order for a biosensor to work properly the electron transfer between the analyte and the electrode
surface has to be effective. Gold nanoparticles are excellent conductors due to their metallic bonding
structure and thus gold can serve as a good nanostructured material at the sensor surface [15].
Enzyme gold nanoparticle based analytical assays have been developed that allows careful
characterization of enzyme interactions with gold nanoparticles in bulk [15]. These assays are in part
based on the optical properties of the gold where the surface plasmon resonance of the particles
causes absorption of visible light and the absorption is tunable with nanoparticle size, surface
chemistry and nanoparticle shape [16]. Both flocculation assays and UV/VIS quantification of gold
nanoparticles are methods based on monitoring the optical properties of the gold nanoparticle and
enzyme gold nanoparticle conjugates to determine conditions for enzyme monolayer coverage at the
gold surface and to quantify the number of gold nanoparticles in a sample solution. Gold nanoparticle
also scatter light very well and therefore dynamic light scattering was used to determine the
hydrodynamic radius of enzyme gold nanoparticles. By the ease of dissolving gold in cyanide, the
number of fluorescently labeled enzymes coating each gold nanoparticles can be quantified after
dissolution of the gold. Together these methods can be used for determining the optimal conditions
for enzyme attachment in biosensor design to achieve the highest retained enzymatic activity after
immobilization and to limit the enzyme coverage to monolayers [1, 15]. We are here focusing this work
on studying the conjugation of the enzyme glucose oxidase and glutamate oxidase to gold
nanoparticles with the aim to implement our findings on optimal conditions for enzyme monolayer
coverage at nanoparticle surfaces to be implemented for construction of fast nanoparticle coated
biosensors for glucose and glutamate.
3.3 Fundamentals of electrochemistry Electrochemistry is the study of chemical reactions that involves electrons being transferred from an
electroactive molecule to an electrode and vice versa through a redox reaction. Electric potential is a
relative measurement and it measured between two electrodes: the working electrode and the
reference electrode. The rate of this reaction can be manipulated by applying a potential at a working
electrode versus a reference electrode, thus increasing the driving force for a redox reaction to occur
for an analyte present at the electrode surface of a working electrode. The reference electrode is an
electrode with a stabile well-known potential that is put in to the solution together with a working
electrode. Since the reference electrode has a stabile potential over time, the working electrode
potential is relative to the reference electrode. Every reference electrode’s redox potential is relative
to the standard hydrogen electrode (SHE) [8]. For this project an Ag/AgCl and a Cu/Cu+ reference
electrode was used.
6
4.0 Experimental methods This chapter will give a short introduction and theory of the instruments used in this study.
4.1 Amperometry Amperometry is a quantitative technique that offers very high temporal resolution and is therefore
suitable for measurements of the amount of neurotransmitters released during exocytosis [9]. In
amperometry a constant electric potential is applied between a working electrode and a reference
electrode. By choosing a potential that will make the electroactive molecule of interest go through a
redox reaction at the working electrode, an electric charge can be measured. By integrating the current
over time, and the number of electrons transferred per molecule during the redox reaction, the
quantity of molecules released from a single exocytosis release event can be determined using
Faraday’s law as described in Equation 1 [17]. Apart from quantitative information amperometry can
also provide information on kinetics for each exocytosis events by analyzing the current spike
parameters such as current spike rise time, half width and fall time. In addition, the frequency of
exocytosis events when a cell is stimulated can be determined. One disadvantage with amperometry
is the fact that it cannot identify the chemical substances that gives rise to a current. The current that
rises in amperometry is a representation of all different molecules that have been oxidized/reduced at
that specific potential. This can be quite problematic during in vivo measurements, since there are
many different neurotransmitters and electroactive molecules in the extracellular space that may
contribute to a current at a certain potential and thus does not provide a selective recording for one
analyte, unless selective electrode modification schemes might be used [8].
Equation 1. Faraday’s law reports the relationship between current and the amount of analyte being detected where Q equals the charge, N equals the number of molecules, n equals the number of electrons in the redox reaction and F equals the Faraday constant = 96485 C/mole.
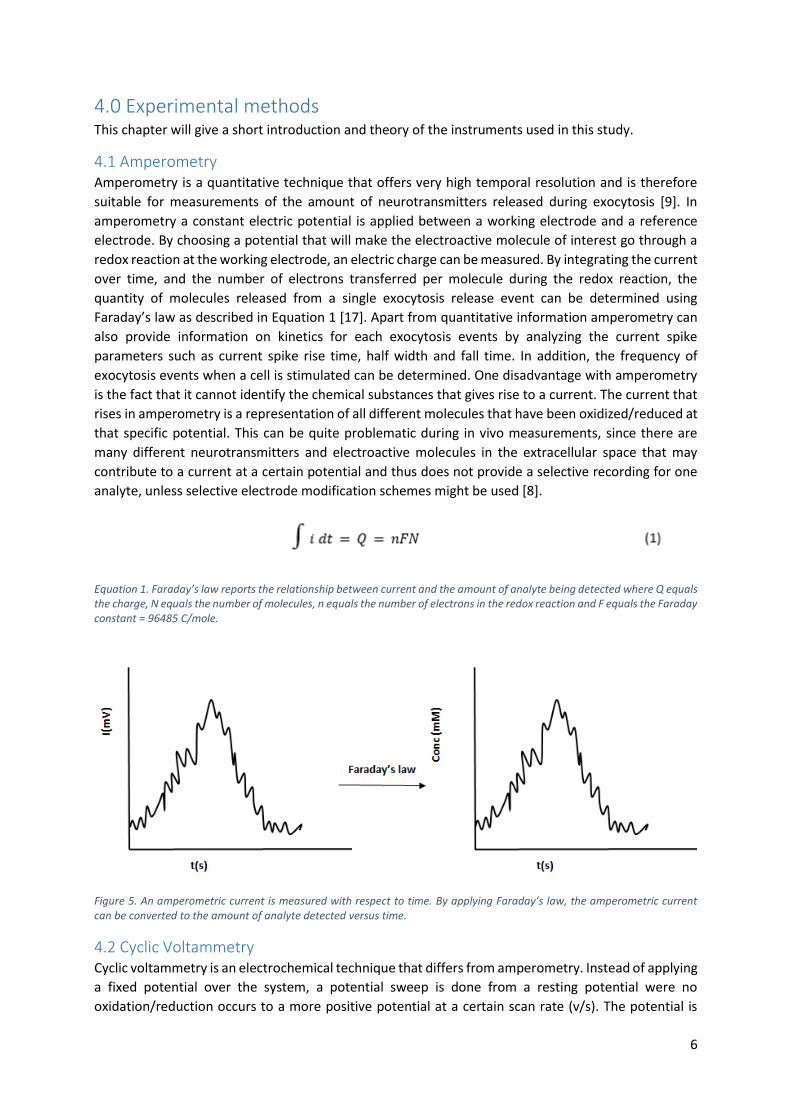
Figure 5. An amperometric current is measured with respect to time. By applying Faraday’s law, the amperometric current can be converted to the amount of analyte detected versus time.
4.2 Cyclic Voltammetry
Cyclic voltammetry is an electrochemical technique that differs from amperometry. Instead of applying
a fixed potential over the system, a potential sweep is done from a resting potential were no
oxidation/reduction occurs to a more positive potential at a certain scan rate (v/s). The potential is

7
then scanned back to the resting potential and the electrode current during the analyte redox reaction
is recorded. When performing a recording of the redox current during a potential sweep, the oxidation
and reduction potential most often differ for different analytes, giving rise to specific “finger print”
current vs potential traces. Therefore cyclic voltammetry is a good technique for identification of
analytes in a solution. Simply by applying a cyclic voltammetry scan over a solution with unknown
analytes it is possible to identify the analytes by investigating the current peak potentials that is
detected [4].
Figure 6. Cyclic voltammetry. Picture to the left describes CV with current vs potential. At point 1 the redox reaction rate is dependent on the applied potential. The oxidation of analyte will eventually reach a peak were all analyte near the electrode surface has been consumed (2). The current will therefore decrease and is dependent on the mass transfer of analyte towards the electrode surface (3). At point four a steady state environment has been established. In the following reverse scan a minimum peak is detected due to the reduction of analyte following the same principle as for the first scan. Picture to the right illustrates one cyclic scan in cyclic voltammetry with potential vs time.
4. 3 Ultraviolet-visible spectroscopy, UV-VIS UV-VIS spectroscopy is a technique that measure the amount of light absorbed by a sample in the
ultraviolet-visible region of the electromagnetic spectrum. Molecules with the property to absorb light
within the UV-VIS region will undergo an electronic transition when exposed by light in the UV-VIS
region, promoting the molecule in to an excited state. The intensity of the absorption depends on
several factors, such as how capable the molecule is to absorb light at a certain wavelength and the
concentration of the analyte in the sample solution. When the beam of light reaches a light detector,
the irradiance (P) of the beam will be recorded and compared to with the incoming light (P0). The
portion of light that is not absorbed is called the transmittance (T) [18].
Absorbance is of great use for analytical chemistry since it is under certain conditions directly
proportional to the concentration of the light-absorbing molecule, as stated in Lambert-Beer’s law
[18]:
Where 𝑒 stands for the molar absorptivity of the light-absorbing molecule, 𝑐 is the concentration of
the light-absorbing molecule and 𝑙 is the path length of the cell [18].

8
Figure 7. Schematic picture of a spectrophotometric instrument. Light passes through a monochromator that selects the wavelength spectra of interest to pass on to the sample. Molecules in the sample may absorb light at a specific wavelength, leading to a decrease in irradiance (P) for the outgoing light that reaches the light detector. The absorbance can then be measured versus the wavelength of light irradiated. The material of the light source differs depending on which wavelength that is selected for the experiment. For the ultraviolet region, a light source made of deuterium is often used while for the visible region a tungsten filament is preferred. The irradiance of the light passing through the sample is often measured by a photomultiplier as a light detector.
4. 4 Dynamic light scattering, DLS Dynamic light scattering is a technique that measures the size of a nanoparticle in a solution by subjecting the sample with a monochromatic laser beam. When the laser beam irradiates the sample, the light will be scattered in every different angle. The light is scattered and caught up by a detector, often by a photomultiplier, at a specific scattering angle that is determined depending on the experiment. The change in the wavelength of the incoming light is related to the size of the nanoparticle.Certain assumptions of the analyte is necessary to make when analyzing the data collected from a DLS experiment. It is assumed that the analyte in the sample is spherical-shaped and undergoes Brownian motion. By assuming this, the diffusion constant can be measured from the DLS and then the hard spherical radius for the analyte can be determined using Stoke-Einstein’s equation [15, 19]:
Were D is the particles diffusion constant, kb is Boltzmann’s constant, T is the absolute temperature, 𝜂
is the dynamic viscosity and r is the hydrodynamic radius of the particle.
Since the analyte undergoes Brownian motion in the solution, their position in space will change with
time, which will fluctuate the intensity at a certain scattering angle. The Brownian motion is related to
the size of the nanoparticle; smaller particles will move more rapidly than bigger ones. That is why the
hydrodynamic radius is inversely proportional to the diffusion constant in Stoke-Einstein’s equation.
By analyzing the fluctuation of the intensity, the self-diffusion constant is determined and the
hydrodynamic radius of the analyte can be obtained using Einstein-Stoke’s equation [19].
DLS is a very sensitive technique that requires careful preparation before use. It is necessary to remove
any kinds of dust particles since presence of dust will interfere in the analyzing process. The
concentration of the analyte must be optimized. To high concentrations of the analyte will make the
nanoparticles interact with each other and give an inaccurate radius of the conjugates. By contrast, if
the concentration is to low, too little light will scatter to the detector, resulting in to too low intensity
for measurements [19].

9
Figure 8. An illustration describing the principal of a DLS instrument, where the laser light is irradiating the sample cuvette and the angle of scattering light is detected, which can be used to calculate the radius of particles in the sample.
5. Method In this section the method for establishing optimal enzyme-nanoparticle conjugate and the creation of
microelectrodes are presented and made according to previous work [8, 15].
5.1 Flocculation assay Flocculation assay was used in this project in order to determine the amount of enzyme needed in
solution to fully cover the gold nanoparticle surface during enzyme gold nanoparticle conjugation. If
insufficient amount of enzyme is added to fully coat the gold nanoparticles at the conjugation process
and the conjugates are subjected to a high salt solution, the thickness of the electric double layer at
the gold nanoparticle surface is reduced, which destabilize the colloids in solution and lead to particle
aggregation. This formation of nanoparticle aggregates can easily be detected with UV/VIS
spectroscopy since the transition from soluble gold nanoparticle solution to formation of gold
nanoparticle aggregates shift the color of solution from red to almost transparent. However, if there
is enough enzyme covering the gold nanoparticle AuNP, the enzyme will create a steric stabilization of
the particle and hinder aggregation of the AuNP. Hence, the color of the sample will remain the same
as the reference sample containing bare gold nanoparticles.
Figure 9. Flocculation assay on AuNP:GlOx and AuNP:GluOx bio-conjugate. Sufficient enzyme in solution will prevent the enzyme conjugates from aggregating in the presence of high salt, giving a similar absorbance maximum to pure gold nanoparticles. If there is insufficient protection (a lower GluOx:AuNP or GOx:AuNP ratio) the salt will significantly decrease the gold nanoparticles electrical double layer, creating enzyme conjugate aggregates that will have an absorbance peak at higher wavelength compared to the absorbance of gold nanoparticles.
NaCl
NaCl
AuNP Abs ~ 520 nm
Enzyme Abs ~ 400-800 nm
Aggregated form of AuNP:enzyme Abs ~ 700-800 nm
Stabile AuNP:enzyme conjugate Abs ~ 520 nm

10
Figure 10. Images presenting the effect of adding NaCl to conjugates with insufficient enzyme coverage at the AuNP surface (left image) that shows a color shift from red to transparent and with sufficient enzyme coverage at the AuNP surface (right image) no color change occurs.
The different samples prepared by adding various amount of enzyme to the AuNP solution before
subjected to high salt conditions were monitored with ultraviolet-visible- spectroscopy and the
absorbance spectrum recorded of the conjugates were compared to the spectrum of the AuNP
reference sample. The sample with a spectra most alike the reference sample was determined to be
the ratio that yielded fully covered and stabile enzyme gold nanoparticle conjugates. Hence, using this
method and titrating the ratio between GluOx and AuNPs or GOx and AuNPs the ratio of GluOx or GOx
to gold nanoparticles needed to create a fully covered and stabile enzyme gold nanoparticle conjugate
during synthesis was determined. Since this ratio is difficult to estimate, as this is highly affected by
the adsorptivity of the specific enzyme to the AuNP surface, a wide range of different enzyme to gold
nanoparticle ratios were explored. Three replicates for each ratio was prepared and studied. The mean
value of the absorbance for these replicates is presented as the absorbance for each ratio presented
was reported in the results.
A theoretical ratio of how many enzymes per gold nanoparticle can be expected to fit at the AuNP
surface if fully covered by a monolayer enzyme was estimated by taking into account the enzyme
molecular dimensions and the surface area of each enzyme. The likelihood of all enzymes added in
solution during the conjugations process would stick to the gold nanoparticles surfaces is very low, but
can be used as a start for the lowest ratio of enzyme to gold nanoparticle to be added during enzyme
to AuNP titration and from here increase the enzyme ratio added. After preparation of a series of
samples with variation of enzyme to gold nanoparticle ratios, the samples were incubated in the dark
for 60 minutes. Then NaCl was added to each sample to achieve a final concentration of 148.9 mM
NaCl for AuNP:GluOx samples and 150 mM for AuNP:GOx samples. Samples were then placed in the
dark for an additional 20 min incubation time. The salt was added to all samples except the reference
sample containing bare AuNP solution to avoid aggregate formation. Sodium carbonate was used as a
buffer for all samples. A summary of the preparation of samples with the various enzyme to gold
nanoparticle ratios is summarized in table 1 for GOx experiments and the enzyme ratios used in
titration of GluOx to AuNP is summarized table 2. The absorbance spectra of the reference sample and
enzyme AuNP conjugate samples were then measured by scanning the absorbance intensity between
400-800 nm. The sample revealing the absorbance spectra with the closest one matching the reference
sample determined the ratio enzyme to AuNP needed to be added in solution to achieve a stabile gold
nanoparticle conjugate.

11
Table 1. Variation of the ratio AuNP: GOx when preparing enzyme gold nanoparticle conjugates for the flocculation assay.
AuNP:GOx V AuNP(µl) V GOx (µL) V 10mM NaHCO3 (µl)
1:0 (reference) 400 0 1361
1 10 400 2 1359
1 20 400 3 1358
1 30 400 5 1356
1 40 400 7 1354
1 50 400 9 1352
1 100 400 17 1344
1 200 400 34 1327
1 400 400 68 1293
1 1000 400 170 1191
1 1200 400 204 1157
1 1400 400 238 1123
Table 2. Variation of the ratio AuNP: GluOx used when preparing enzyme AuNP conjugates for the flocculation assay.
AuNP:GluOx V AuNP (µl) V GluOx (µl) V 10mM NaHCO3 (µl)
1:0 (reference) 46 0 119
1 200 46 6 113
1 800 46 24 95
1 1000 46 30 89
1 1200 46 36 83
1 1400 46 41 78

12
5.2 DLS analysis for determination of AuNP:enzyme conjugate hydrodynamic diameter. In order to monitor the size of the enzyme AuNP conjugates constructed, Dynamic Light Scattering
(DLS) was used to determine the hydrodynamic diameter of the synthesized enzyme gold nanoparticle
conjugate. Weather a successful monolayer coverage had been established or not was determined by
comparing the hydrodynamic diameter of the conjugate with that for pure gold nanoparticles and size
of the enzyme molecule.
After preparation of a series of samples with variation of the enzyme to gold nanoparticle ratios, the
samples were incubated in the dark for 60 minutes. The different enzyme to gold nanoparticle ratios
that were used in the DLS analysis is listed in table 3 and 4.
Table 3. The AuNP:GOx ratios prepared for DLS analysis
Table 4. The AuNP:GluOx ratios prepared for DLS analysis
AuNP:GluOx V AuNP (µl) V GluOx (µl) V 10mM NaHCO3 (µl)
1:0 (reference) 46 0 119
1 200 46 6 113
1 800 46 24 95
1 1000 46 30 89
1 1200 46 36 83
1 1400 46 41 78
Since the hydrodynamic diameter of the enzyme AuNP conjugates was to be measured, enzymes that
did not attach to a gold nanoparticle during the conjugation process were removed through
centrifugation to eliminate free enzymes in conjugate solution that otherwise would interfere in an
appropriate size measurement of the conjugates. Therefore, after conjugation process all samples
were centrifuged at 10000 rpm at 4 °C for 30 minutes. After the centrifugation, for the glucose oxidase
enzyme, 711 µl of the supernatant were carefully removed from the sample and replaced with 1000
µl 10mM sodium carbonate buffer. This step was repeated two times to ensure that all free enzymes
in the solution had been removed from the samples. After the third centrifugation, the same amount
of supernatant was removed as in the previous step. However the amount of the buffer solution added
in the samples was reduced to 400 µl. This change of volume was made in order to establish a
concentration of the conjugate that we found optimal for DLS analysis. For the glutamate oxidase, 60
µl of the supernatant were carefully removed from the sample and replaced with 50 µl of 10mM
sodium carbonate buffer. This step was also repeated two times. After the third centrifugation, the
same amount of supernatant was removed as in the previous step with the same amount of buffer
added.
Au:GOx V AuNP(µl) V GOx (µL) V 10mM NaHCO3 (µl)
1:0 (reference) 400 0 1361
1:50 400 2 1359
1:100 400 17 1344
1:1000 400 170 1191
1:2000 400 340 1021
1:4000 400 690 681
1:8000 400 1361 0
13
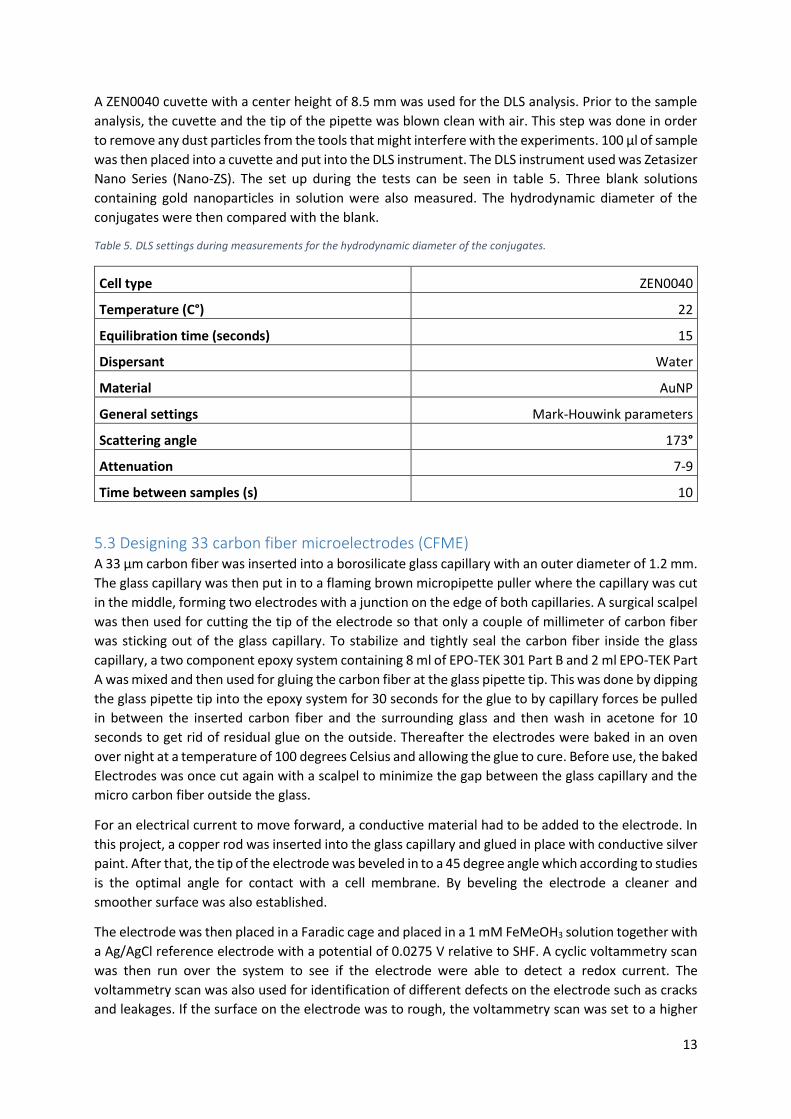
A ZEN0040 cuvette with a center height of 8.5 mm was used for the DLS analysis. Prior to the sample
analysis, the cuvette and the tip of the pipette was blown clean with air. This step was done in order
to remove any dust particles from the tools that might interfere with the experiments. 100 µl of sample
was then placed into a cuvette and put into the DLS instrument. The DLS instrument used was Zetasizer
Nano Series (Nano-ZS). The set up during the tests can be seen in table 5. Three blank solutions
containing gold nanoparticles in solution were also measured. The hydrodynamic diameter of the
conjugates were then compared with the blank.
Table 5. DLS settings during measurements for the hydrodynamic diameter of the conjugates.
Cell type ZEN0040
Temperature (C°) 22
Equilibration time (seconds) 15
Dispersant Water
Material AuNP
General settings Mark-Houwink parameters
Scattering angle 173°
Attenuation 7-9
Time between samples (s) 10
5.3 Designing 33 carbon fiber microelectrodes (CFME) A 33 µm carbon fiber was inserted into a borosilicate glass capillary with an outer diameter of 1.2 mm.
The glass capillary was then put in to a flaming brown micropipette puller where the capillary was cut
in the middle, forming two electrodes with a junction on the edge of both capillaries. A surgical scalpel
was then used for cutting the tip of the electrode so that only a couple of millimeter of carbon fiber
was sticking out of the glass capillary. To stabilize and tightly seal the carbon fiber inside the glass
capillary, a two component epoxy system containing 8 ml of EPO-TEK 301 Part B and 2 ml EPO-TEK Part
A was mixed and then used for gluing the carbon fiber at the glass pipette tip. This was done by dipping
the glass pipette tip into the epoxy system for 30 seconds for the glue to by capillary forces be pulled
in between the inserted carbon fiber and the surrounding glass and then wash in acetone for 10
seconds to get rid of residual glue on the outside. Thereafter the electrodes were baked in an oven
over night at a temperature of 100 degrees Celsius and allowing the glue to cure. Before use, the baked
Electrodes was once cut again with a scalpel to minimize the gap between the glass capillary and the
micro carbon fiber outside the glass.
For an electrical current to move forward, a conductive material had to be added to the electrode. In
this project, a copper rod was inserted into the glass capillary and glued in place with conductive silver
paint. After that, the tip of the electrode was beveled in to a 45 degree angle which according to studies
is the optimal angle for contact with a cell membrane. By beveling the electrode a cleaner and
smoother surface was also established.
The electrode was then placed in a Faradic cage and placed in a 1 mM FeMeOH3 solution together with
a Ag/AgCl reference electrode with a potential of 0.0275 V relative to SHF. A cyclic voltammetry scan
was then run over the system to see if the electrode were able to detect a redox current. The
voltammetry scan was also used for identification of different defects on the electrode such as cracks
and leakages. If the surface on the electrode was to rough, the voltammetry scan was set to a higher

14
potential and scan rate to smoothen the electrode surface. If this did not smoothen the surface
enough, the electrode was re beveled and the whole process was repeated.
Figure 11. Cyclic voltammetry scan for a carbon fiber electrode placed in 1 mM FcMeOH with a scan rate of 0.1 V/s.
If an electric current was deteced and no leakage or cracks had been found on the electrode, the
electrode was placed in a 0.5 mM HAuCl4 solution together with an Ag/AgCl reference electrode. The
system was then held at a constant potential over -0.6 V for 32 seconds. This formed the reduction of
Au3+ to Au0 leading to an electrodeposition of Au nanoparticles onto the surface of a carbon fiber
microelectrode

15
Figure 12. AuNP from a 0.5 mM HAuCl4 solution was electrodeposited on a carbon fiber microelectrode by applying a constant potential of -0.6 V for 32 seconds over the electrode.
A Cu/Cu+ reference electrode were then put together with the carbon fiber electrode in a sulfuric acid
solution. A linear voltammetry scan over a potential of 0.5 - 1.5 V for 10 seconds was conducted in
order to determine the charges on the gold surface. By knowing this parameter the surface for the
gold nanoparticles on the electrode could be calculated. If the surface area did not correspond to the
optimal surface area which in this study was set to 1200-1400 µm2, the electrode was re-beveled and
the procedure was repeated from the CV scan of CFME dipped in a FeMeOH solution.
Figure 13. A linear voltammetry scan illustrating the charges on the Au surface. By knowing this parameter a total surface area of the gold nanoparticles attached on the electrode surface is calculated.
5.3 Designing glucose biosensor When the microelectrodes had been fully optimized, bio-conjugates were coated on the tip of the electrode by placing the gold nanoparticle coated electrode in a solution of glucose oxidase (2 mg/mL)

16
for 3 hours (see figure 12). The concentration of glucose oxidase was enough to create a full enzyme coverage and stabile bio-conjugates on the electrode. The electrode was then dipped into a 10 mM H2O2 solution together with an Ag/AgCl reference electrode. A CV scan was run, with a potential between -700 mV to 700 mV, in order to see if a current could be detected from the redox reaction between H2O2 and the electrode surface.
Figure 14. AuNP coated microelectrodes were dipped in a GOx solution in order to form bio-conjugates on the electrode surface.
Figure 15. CFME coated with AuNP:GOx bio conjugate was put into a 10 mM H2O2 solution together with an Ag/AgCl reference electrode. The experiment was performed in a Faradic cage.
17
6. Results and discussion The purpose of this study was to determine the optimal conditions needed to design fast micro
biosensors for detection of the enzyme catalyzed reporter molecule hydrogen peroxide, for the
detection of non-electroactive molecules glutamate and glucose that are two important molecules in
brain chemistry. The enzymes GOx and GluOx were used as enzymes to catalyze the reaction of glucose
and glutamate into product formation of hydrogen peroxide. To achieve high temporal resolution of
sensors for glutamate and glucose, the biosensors needed to achieve monolayer coverage of the
respective enzymes glutamate oxidase and glucose oxidase at the surface of gold nanoparticles coating
a carbon fiber microelectrode.
As a side project, a 33 µm glucose biosensor was designed for detecting hydrogen peroxide in a
solution. However, this biosensor did not detect hydrogen peroxide in the solution. Due to time
constraints of this project there was not time enough to perform more of these experiments and solve
this problem.
6.1 Flocculation assay A Flocculation assay was made to ensure that a full coverage of enzyme on gold nanoparticles had
been established. Ratios that were tested ranged from 1:0 to 1:1400 for AuNP:GOx and 1:0 to 1:1400
for AuNP:GluOx. Samples with an absorbance maximum close or higher to that of pure gold
nanoparticles were determined to be the ratio needed to develop a fully saturated bio-conjugate.
Figure 16 illustrates the results from the UV/Vis measurements for AuNP:GOx ratios ranging from 1:0
to 1:200. The y-axis represent the absorbance of the sample and the x-axis represents the wavelength.
The dark blue line represents the Au colloid reference sample. The 1:200 ratio was very similar to the
spectra of the Au colloid solution and was considered to result in fully coverage of enzyme layer at the
gold nanoparticle surface. Ratios from 1:10 to 1:40 was shown to absorb light at around 720 nm which
indicates that aggregates had been formed in these samples. Although no clear absorbance peak was
found at 700-800 nm for the 1:100 ratio, it is still believed that at this ratio aggregates was formed
since the absorption peak at 520 nm for this ratio was lower than that of the blank.
Another flocculation assay was done for AuNP:GOx conjugates but this time for higher ratios then the
previous one (see figure 17). Results from this experiment confirms that stabile conjugates of
AuNP:GOx was achieved from adding ratio 1:200. Result from this experiment suggest that the molar
absorption coefficient of 20 nm gold nanoparticles may increase when gold nanoparticles are covered
with enzymes at the surface, hence the high absorption peak amplitude for high ratios of GOx added
to AuNP (see figure 17).
Figure 18 illustrates the results from the flocculation assay for AuNP:GluOx. Fewer ratios were tested
for this enzyme due to the limited amount of enzyme available and the high cost of the enzyme.
According to the results, stabile conjugates of AuNO:GluOx was achieved from the adding ratio 1:800.
At 1:200 some peak broadening in the absorbance spectra was detected, which indicates that
aggregates had been formed.

18
Figure 16. Flocculation assay for different ratios of AuNP:GOx ranging from 1:10 to 1:200. At ratios up to 1:40, an absorbance peak around 720 nm is detected, which indicates that aggregates has been formed. The 1:200 ratio showed a very similar spectra as the reference sample, which suggest that samples with 1:200 ratio creates stabile bio-conjugates.

19
Figure 17. Flocculation assay for different AuNP:GOx ratios ranging from 1:100 to 1:1400 confirm that stabile bio-conjugates of AuNP:GOx was achieved from adding ratio of 1:200.
Figure 18. Flocculation assay for different AuNP:GluOx ratios ranging from 1:200 to 1:1400 confirms that stabile bio conjugates of AuNP:GluOx was achieved from adding ratio 1:800.
6.2 Hydrodynamic diameter Zetasizer Nano Series (Nano-ZS) DLS instrument was used to characterize the size of the produced
AuNP:enzyme conjugates and to confirm whether monolayer coverage of enzymes adsorbed on AuNP
had been established. The results imply that both glutamate oxidase and glucose oxidase form
monolayer coverage at the gold nanoparticle surface and that neither enzyme would form multilayers.
This is confirmed by the results that there is no increase in hydrodynamic diameter when increasing

20
the AuNP:enzyme ratios during conjugation as shown in figure 19 and 20, where the thickness of the
enzyme layer adsorbed on AuNP is not increasing when adding enzymes above the amount needed to
form monolayer coverage as determined by flocculation. A larger standard deviation of the
hydrodynamic diameter was detected for low ratios of AuNP:GOx added. This result was expected
since according to the results from the flocculation assay, bio-conjugate aggregation was formed in
samples with ratios between 1:10 to 1:100. From the results of the flocculation assay, the 1:100 ratio
did not have a significant absorbance peak at 700-800 nm indicating that only a small part of the
conjugate aggregated. This is why a much smaller standard deviation is seen for the 1:100 ratio
compared to 1:50 were a larger amount of the bio-conjugates were aggregated.
The standard deviation for AuNP:GluOx was generally larger than for the AuNP:GOx. A reason for this
is the fact that fewer samples were made with this enzyme, and that by using very small volumes for
this assay due to the limit of amount enzyme available. Working with the very small volumes in the
GluOx assays increases the random experimental error and leading to a higher standard deviation.
Figure 19. DLS analysis of the hydrodynamic diameter of different ratios of AuNP:GOx. The error bar represents the standard deviation for the different ratios. The n symbol stands for the number of samples tested for each ratio tested.
0
5
10
15
20
25
30
35
40
Hyd
rod
ynam
ic D
iam
eter
(n
m)

21
Figure 20. DLS analysis of the hydrodynamic diameter of different ratios of AuNP:GluOx. The error bar represents the standard deviation for the different ratios. The n symbol stands for the number of samples tested for each ratio tested.
6.3 Glucose biosensor The glucose biosensor was made by coating glucose oxidase onto a 33 µm carbon fiber electrode. The
biosensor was tested by placing the biosensor in a 10 mM hydrogen peroxide solution together with
an Ag/AgCl reference electrode with a potential of 0.0275 V relative to SHF. A CV scan was run between
-700 mV to 700 mV, which is within the potential range for detection of where redox reaction of
hydrogen peroxide occurs if the biosensor works properly. However, as can be seen in figure 21, an
oxidation peak for hydrogen peroxide is not detected, which indicates that the hydrogen peroxide do
not form a redox reaction at the electrode surface. The reduction slope that was formed during this
experiment corresponds to the potential where reduction of oxygen in solution occurs. A reason that
no oxidation peak was observed, may be due to low concentrations of hydrogen peroxide in the
solution, however more experiments would be needed to confirm this.
Figure 21. Glucose sensor test for the response of hydrogen peroxide.
0
5
10
15
20
25
30
35
40
45H
ydro
dyn
amic
Dia
met
er (
nm
)
22
7. Conclusion In this report, some of the optimal conditions that later will be used for the design of a glutamate
biosensor and a glucose biosensor with monolayer coverage of the respective enzymes, glutamate
oxidase (GOx) and glucose oxidase (GluOx) attached on AuNP coated on a 33 µm microfiber electrode
surface is described.
Different ratios of AuNP:enzyme were studied in order to determine the optimal ratio for creating
stabile bio-conjugates where enzyme monolayer coverage at the surface of the AuNP is created. The
results from the flocculation assay indicates that stabile glucose oxidase gold nanoparticle conjugates
was achieved by adding ratio 1:200 of AuNP:GOx,. Flocculation assays also indicates that stabile
glutamate oxidase gold nanoparticle conjugates was achieved from adding ratio of 1:800 of
AuNP:GluOX.
A larger absorbance peak amplitude relative to the reference sample containing bare Au colloids was
observed for ratios between 1:800 to 1:1400 for AuNP:GOx conjugates. This increase in absorbance
might suggest that the molar absorption coefficient of 20 nm gold nanoparticles may change when
gold nanoparticles are surrounded with enzymes.
Weather a successful monolayer coverage of enzyme attached to AuNP had been established or not
was confirmed by measuring the hydrodynamic diameter for the different bio-conjugates, using DLS.
No significant increase in the hydrodynamic diameter of AuNP:GOx was observed for higher AuNP:GOx
ratios which indicates that this enzyme will not form enzyme multilayers when attached to AuNP. The
relative high standard deviation from ratios 1:50 and 1:100 was expected since according to the
flocculation assay, these ratios could form bio-conjugate aggregates. At higher enzyme ratios added
the standard deviation is smaller indicating a more homogenous size distribution of the conjugates.
The hydrodynamic diameter for stabile monolayer coverage of AuNP:GOx conjugate was estimated to
26 nm.
No significant increase in the hydrodynamic diameter for AuNP:GluOx was observed for higher
AuNP:GluOx ratios, which indicates that this enzyme do not form multilayer coverage of enzymes
attached on AuNP. The hydrodynamic diameter for stabile monolayer coverage of AuNP:GOx
conjugate was estimated to 27 nm. A larger standard deviation relative to the AuNP:GOx conjugates
was observed for the AuNP:GluOx samples. This might be due to the fact that fewer samples were
performed and working with smaller volume in these assays using this enzyme,. This will lead to higher
risk for random experimental errors to occur.
A glucose biosensor was designed as a side project. The glucose biosensor was tested by placing it in a
10 mM hydrogen peroxide and run a CV scan over the sample. No response was detected. This might
be due to low concentrations of hydrogen peroxide in the solution or some defects on the carbon fiber
micro electrode. A reduction slope was monitored from the results. This reduction slope might have
occurred due to the reduction of free oxygen in the hydrogen peroxide solution.
Due to the tight time schedule for this project there was no time to design and test the glutamate
biosensor. Further studies testing the glucose biosensor and glutamate biosensor are needed in order
to properly validate their function.

23
9. Summary In this study, the optimal conditions for determining the amount of enzyme needed in solution to form
stable glucose gold nanoparticle conjugates and glutamate gold nanoparticle conjugates was
determined using flocculation assays. The conjugates formed by titrating ratios of added enzyme
versus AuNP in solution were characterized in terms of bio-conjugate size using DLS. From these
experiments we could conclude that both glucose oxidase and glutamate oxidase forms monolayers
rather than multilayers when attaching to gold nanoparticle surfaces. These results are essential
information needed in further creating enzyme based gold nanoparticle coated carbon fiber
microelectrodes with high temporal resolution that can be used as probes for monitoring rapid
fluctuations of glucose and glutamate in the brain.

24
9. References [1] Keighron J, Wigström J, Kurczy M, Bergman J, Wang Y, Cans A. Amperometric Detection of Single
Vesicle Acetylcholine Release Events from an Artificial Cell. ACS Chem Neurosci. 2015; 6(1):181-188.
[2] Pratt W. Charlotte, Cornely Kathleen. Essential Biochemistry. Second edition. John Wiley & Sons,
INC. 2011.
[3] Obrenovitch T, Urenjak J, Zilkha E, Jay T. Excitotoxicity in neurological disorders — the glutamate
paradox. International Journal of Developmental Neuroscience. 2000; 18(2-3):281-287.
[4] Wigström J. New Electrochemical Tools to Study Exocytosis [PhD thesis]. Gothenburg: Chalmers
University of technology. 2015. http://publications.lib.chalmers.se/publication/224289-new-
electrochemical-tools-to-study-exocytosis
[5] Greenamyre J, Maragos W, Albin R, Penney J, Young A. Glutamate transmission and toxicity in
alzheimer's disease. Progress in Neuro-Psychopharmacology and Biological Psychiatry. 1988;
12(4):421-IN4.
[6] Mergenthaler P, Lindauer U, Dienel G, Meisel A. Sugar for the brain: the role of glucose in
physiological and pathological brain function. Trends in Neurosciences. 2013;36(10):587-597. [7]
[7] Messier CGagnon M. Glucose regulation and cognitive functions: relation to Alzheimer's disease
and diabetes. Behavioural Brain Research. 1996; 75(1-2):1-11.
[8] Hochstetler, Spencer E., and R. Mark Wightman. "Detection of secretion with electrochemical
methods." On-Line Biophysics Textbook (1998).
[9] Lugo-Morales L, Loziuk P, Corder A, Toups J, Roberts J, McCaffrey K et al. Enzyme-Modified Carbon-
Fiber Microelectrode for the Quantification of Dynamic Fluctuations of Nonelectroactive Analytes
Using Fast-Scan Cyclic Voltammetry. Analytical Chemistry. 2013; 85(18):8780-8786. [10]
[10] Adrian C Michael, Borland M Laura. Electrochemical Methods for Neuroscience. London: Taylor
and Francis group: 2007.
[11] Qin S, van der Zeyden M, Oldenziel W, Cremers T, Westerink B. Microsensors for in vivo
Measurement of Glutamate in Brain Tissue. Sensors. 2008;8(11):6860-6884.
[12 Kong T, Chen Y, Ye Y, Zhang K, Wang Z, Wang X. An amperometric glucose biosensor based on the
immobilization of glucose oxidase on the ZnO nanotubes. Sensors and Actuators B: Chemical. 2009;
138(1):344-350.
[13] National Nannotechnology Initiative. United States. What’s so special about the nanoscale?
http://www.nano.gov/nanotech-101/special
[14 Vertegel A, Siegel R, Dordick J. Silica Nanoparticle Size Influences the Structure and Enzymatic
Activity of Adsorbed Lysozyme. Langmuir. 2004; 20(16):6800-6807.
[15] Åkesson S. Characterization of Acetylcholine esterase- Gold Nanoparticle Conjugates. [Bachelor
thesis]. Gothenburg. Chalmers University of Technology; 2012.
[16] 6. Eustis SEl-Sayed M. Why Gold Nanoparticles Are More Precious than Pretty Gold: Noble Metal
Surface Plasmon Resonance and Its Enhancement of the Radiative and Nonradiative Properties of
Nanocrystals of Different Shapes. ChemInform. 2006; 37(25).

25
[17] Dunevall. J. Electrochemistry of Neurochemicals at Carbon Nanotube Modified Microelectrodes
[licentiate thesis]. Gothenburg. University of Gothenburg; 2012.
[18] Harris D. Quantitative Chemical Analysis. Eight Edition. New York: W.H. Freeman and Company;
2010.
[19] Zetasizer nano serie user manual. Worcestershire: Malver Instruments LTD: 2007

26