Embed Size (px)
Citation preview
University of Pennsylvania University of Pennsylvania
ScholarlyCommons ScholarlyCommons
Master of Applied Positive Psychology (MAPP) Capstone Projects
Master of Applied Positive Psychology (MAPP) Capstones
10-10-2006
Optimistic Managers & Their Influence on Productivity & Optimistic Managers & Their Influence on Productivity &
Employee Engagement in a Technology Organization Employee Engagement in a Technology Organization
Margaret H. Greenberg Mrs. The University of Pennsylvania, [email protected]
Dana Arakawa The University of Pennsylvania, [email protected]
Follow this and additional works at: https://repository.upenn.edu/mapp_capstone
Part of the Human Resources Management Commons
Greenberg, Margaret H. Mrs. and Arakawa, Dana, "Optimistic Managers & Their Influence on Productivity & Employee Engagement in a Technology Organization" (2006). Master of Applied Positive Psychology (MAPP) Capstone Projects. 3. https://repository.upenn.edu/mapp_capstone/3
International Coaching Psychology Review published a peer-review edition of this study in their March 2007 edition (Vol. 2, No. 1). Gallup Management Journal (http:://gmj.gallup.com) published two articles using the results of this study: "The Business Benefits of Positive Leadership: Finding the connection between productivity & positive management behavior" - May 10, 2007 "It Pays to Be Optimistic: Exploring the connections between optimism & business success" - August 9, 2007
This paper is posted at ScholarlyCommons. https://repository.upenn.edu/mapp_capstone/3 For more information, please contact [email protected].
Optimistic Managers & Their Influence on Productivity & Employee Engagement Optimistic Managers & Their Influence on Productivity & Employee Engagement in a Technology Organization in a Technology Organization
Abstract Abstract The objective of this study is to investigate whether teams are more engaged and productive when led by an optimistic manager. Furthermore, we hypothesize that optimistic managers embody positive leadership—employing a strengths-based approach, maintaining a positive perspective, and frequently providing recognition and encouragement—which increases the engagement and productivity of their employees. In a cross-sectional study of 86 employees and 17 managers in an Information Technology (IT) organization, positive leadership correlated with employee optimism, engagement, and project performance. When we looked at a subset of this data prospectively, with 39 employees and 14 managers, manager optimism predicted project performance. Our data support the claim that positive leadership is correlated with employee engagement and performance, and further extends the importance of optimism in the workplace.
Keywords Keywords optimism, employee engagement, productivity, strengths, recognition, business, leadership, managers, teams
Disciplines Disciplines Human Resources Management
Comments Comments International Coaching Psychology Review published a peer-review edition of this study in their March 2007 edition (Vol. 2, No. 1). Gallup Management Journal (http:://gmj.gallup.com) published two articles using the results of this study: "The Business Benefits of Positive Leadership: Finding the connection between productivity & positive management behavior" - May 10, 2007 "It Pays to Be Optimistic: Exploring the connections between optimism & business success" - August 9, 2007
This thesis or dissertation is available at ScholarlyCommons: https://repository.upenn.edu/mapp_capstone/3
Optimistic Managers 1
Optimistic Managers and Their Influence on Productivity and Employee Engagement in a
Technology Organization
Dana Arakawa & Margaret Greenberg
July 31, 2006
Master of Applied Positive Psychology
Optimistic Managers 2
Abstract
The objective of this study is to investigate whether teams are more engaged and productive
when led by an optimistic manager. Furthermore, we hypothesize that optimistic managers
embody positive leadership—employing a strengths-based approach, maintaining a positive
perspective, and frequently providing recognition and encouragement—which increases the
engagement and productivity of their employees. In a cross-sectional study of 86 employees and
17 managers in an Information Technology (IT) organization, positive leadership correlated with
employee optimism, engagement, and project performance. When we looked at a subset of this
data prospectively, with 39 employees and 14 managers, manager optimism predicted project
performance. Our data support the claim that positive leadership is correlated with employee
engagement and performance, and further extends the importance of optimism in the workplace.
Optimistic Managers 3
Optimistic Managers and Their Influence on Productivity and Employee Engagement in a
Technology Organization
An optimistic explanatory style has been linked to a wide range of positive performance
outcomes in academic, athletic, and work domains (cf. Kamen & Seligman, 1985; Nolen-
Hoeksema, Girgus, & Seligman, 1986; Peterson & Barrett, 1987; Peterson & Seligman, 1984).
Researchers have found that an optimistic explanatory style significantly correlates with and
predicts successful job performance (Seligman & Schulman, 1986). According to Tombaugh
(2005, p. 16), “Optimistic leaders are more likely to see problems as challenges, exert greater
effort for longer periods to reach their goals, and seek out and appreciate the positive aspects of
difficult situations.” On an individual-level analysis, optimism clearly influences work
performance. Given that an optimistic explanatory style predicts and precedes a successful job
performance, what role does a manager play in influencing employee performance?
According to Gallup researchers Kruger and Killham (2005), managers greatly influence
employee well-being and engagement, which in turn play a significant role in organizational
performance. Fredrickson’s (1998) broaden-and-build theory of positive emotions provides an
explanation of how managers might create more engagement in employees. In this model,
positive emotions “broaden an individual’s momentary thought-action repertoire, which in turn
has the effect of building that individual’s physical, intellectual, and social resources,” promoting
engagement and therefore productivity (Fredrickson, 1998, p.300).
Business schools have taken the lead in researching the effects of leadership style on
employees. McColl-Kennedy and Anderson (2002) found that frustration and optimism fully
mediate the relationship between leadership style and employee performance. This finding
brings back the question of how managers can improve the productivity of their employees. We
Optimistic Managers 4
hypothesize that the manager’s own optimism can engender employee engagement via positive
emotion, which then positively influences work performance.
The importance of manager optimism is supported by Popper, Amit, Gal, Mishkal-Sinai,
and Lisak (2004), who found that optimism is one of three psychological capacities essential for
leadership. Similarly, Humphrey (2002) argues that the emotional displays of leaders have a
larger impact on employees than the content of their messages. How do optimistic managers
influence the productivity of their teams? We hypothesize that optimistic managers embody a
positive leadership approach, in which they are more likely to: employ a strengths-based
approach to managing employees, maintain a positive perspective when difficulties arise, and
provide frequent recognition of employee accomplishments.
The first component in our model of positive leadership is a strengths-based approach to
managing. Over the last 30 years, The Gallup Organization has taken the lead in investigating
human talents and strengths. According to Clifton and Harter (2003, p. 119), “top-performing
managers have an approach to management that focuses on developing the strengths of the
individuals they manage.” From this research, we chose to investigate a strengths-based
approach as a key component of positive leadership. As Clifton and Harter (2003, p. 119)
surmise, “top-performing managers have been ahead of their time in doing what is
psychologically most efficient: they affect engagement and productivity by understanding and
positioning individual differences in their employees.”
The second component of positive leadership we investigated is the manager’s
perspective during difficult times. According to Henry (2005), “Individuals with a more positive
explanatory style are better able to manage the uncertainty of change. This is because these
individuals exhibit greater control perceptions and implement more active coping strategies to
Optimistic Managers 5
dampen potential downsides. Also, they often reinterpret the negative event as an opportunity
for growth.” These findings align with the work of Reivich and Shatte (2002) on resiliency,
which includes other components of positive perspective such as de-catastrophizing setbacks and
appropriate disengagement. Taken together, positive perspective includes de-catastrophizing
setbacks, accuracy around perceptions of control, appropriate disengagement, emotional coping,
solution-orientation, and positive interpretation of the problem.
The third component of positive leadership we investigated is the manager’s style in
providing recognition and encouragement. Kouzes and Posner (1999, p.4) found that 98% of
respondents answered “yes” to the question, “When you get encouragement, does it help you
perform at a higher level?” Further emphasizing the importance of providing encouragement,
Fredrickson and Losada (2005) discovered that teams of employees displaying more positive
than negative interactions (3:1) outperformed other teams. In addition, Ryan and Deci (2000, p.
70) found that “positive performance feedback enhanced intrinsic motivation, whereas negative
performance feedback diminished it.” Together, these findings support our hypothesis that an
optimistic manager may affect employee productivity by providing frequent recognition and
encouragement.
From this review of previous research, we chose to investigate the influence of manager
optimism on team productivity and employee engagement in an IT organization. This study is
driven by two primary research questions investigated through both retrospective and
prospective correlational design: 1) Do teams produce better results when led by an optimistic
manager? 2) Are employees more engaged at work when led by an optimistic manager? We
hypothesize that the answers to both questions will be affirmative, leading us to our secondary
research objective: discovering how optimistic managers influence the productivity of their
Optimistic Managers 6
teams. We hypothesize that managers embodying positive leadership—employing a strengths-
based approach, maintaining a positive perspective, and frequently providing recognition and
encouragement—increase the engagement and productivity of their employees.
Method
Participants
Participants in our study were recruited from a highly ranked property and casualty
insurance company located in Worcester, Massachusetts. All participants are Information
Technology (IT) professionals working on key IT projects within the technology organization.
These employees represented various individual contributor and managerial roles such as
Program and Project Managers, Business Analysts, Developers, and Architects.
The company selected projects with significant scope and duration and aligned
employees with these projects in 2005 were identified as potential participants. Toward the latter
part of 2005 and early 2006, the technology organization underwent a restructuring.
Consequently, only a subset of the employees aligned with the 2005 projects continued to be
aligned with those same projects in 2006. A total of 155 people received the survey
electronically and 117 actually completed the survey for a 75% response rate.
Demographics
We assessed the following demographics on the survey: year of birth, location, gender,
race/ethnicity, and length of employment with the company. 84% of the participants are
Caucasian; 7.5% Asian or Pacific Islander; 4.7% Other or Unknown; 1.9% Hispanic; and .9%
each of American Indian or Alaskan Native, Black (not of Hispanic origin). 97% of the
participants are located in the United States. 54% are female and 46% are male. Ages ranged
from 25 to 59 with a mean age of 44 (SD = 7.59). 55% have worked for the company 10 or
Optimistic Managers 7
more years, 20% for one to five years, 20% for five to ten years, and 5% worked for an
outsourcing firm.
Materials
We constructed two electronic surveys, one for the employees and one for the managers,
by combining three separate questionnaires.
The Life Orientation Test Revised (LOT-R). The LOT-R (Scheier, Carver, & Bridges,
1994) is a ten-item scale designed to assess individual differences in generalized optimism
versus pessimism. This measure is available in the public domain and its brevity made it an ideal
measure for our project since two other measures were also being used. The LOT-R has
demonstrated internal consistency, with a Cronbach’s alpha of .78 and high test-retest reliability:
.68 (4 months); .60 (12 months); .56 (24 months); .79 (28 months) (Scheier, Carver, Charles, &
Bridges, 1994).
The Gallup Organization’s Q12
(Q12
). The Q12
is a 12-item scale that measures
engagement in the workplace. According to Rath (2006), over eight million employees
worldwide have taken the Q12
; those with high Q12
scores exhibit superior performance, such as
lower turnover, higher sales growth, increased productivity, and better customer loyalty.
Permission was granted by The Gallup Organization to use the Q12
as part of our study.
Positive Leadership. We developed our own set of questions, both closed an open-ended,
to investigate three components of positive leadership. Based upon our literature review we
hypothesized that an optimistic manager may be more inclined to employ a strength-based
approach, have more perspective when difficulties arise, and provide more recognition than
pessimistic managers.
Optimistic Managers 8
Strength-Based approach (STR). We measured the degree to which the manager employs
a strength-based approach to managing by taking the mean of all strength-based questions (listed
in the Appendices A and B) such as “My Project Manager matches my talents to the tasks that
need to be accomplished.” Our definition of a strengths-based approach to management
includes: appreciating employees’ strengths, matching talents to tasks, and focusing on strengths
more than weaknesses.
Perspective (PER). We measured the degree to which the manager maintains a positive
perspective when difficulties arise by taking the mean of all perspective-based questions such as:
“When a problem crops up on my project, my Project Manager is able to help me come up with
solutions.” Our definition of positive perspective includes: de-catastrophizing setbacks,
accuracy around perceptions of control, appropriate disengagement, emotional coping, solution-
orientation, and positive interpretation of the problem.
Recognition (REC). We measured the degree to which the manager provides recognition
for employee’s efforts and accomplishments by taking the mean of all recognition-based
questions such as: “My Project Manager regularly recognizes project milestones.” Our
definition of recognition includes: frequently encouraging and rewarding employee
accomplishments.
These questions form three psychometrically reliable scales, with Cronbach’s alpha
reliability scores above .8 and item-to-total correlations above .6.
Project Performance (PP). Project Performance was measured by examining nine key
project attributes. The first six attributes listed on the next page are reviewed monthly by
members of the senior leadership team and the Project Management Office (PMO); the next two
are reviewed after the project is complete; and lastly, the organization considers project
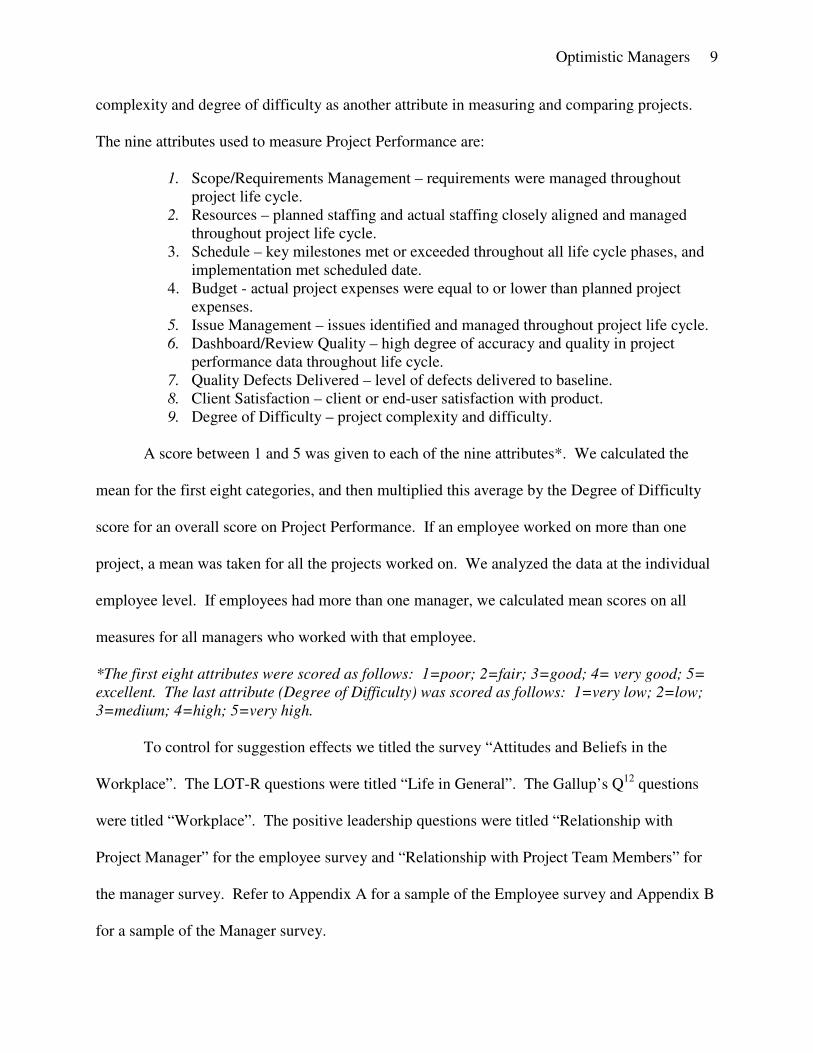
Optimistic Managers 9
complexity and degree of difficulty as another attribute in measuring and comparing projects.
The nine attributes used to measure Project Performance are:
1. Scope/Requirements Management – requirements were managed throughout
project life cycle.
2. Resources – planned staffing and actual staffing closely aligned and managed
throughout project life cycle.
3. Schedule – key milestones met or exceeded throughout all life cycle phases, and
implementation met scheduled date.
4. Budget - actual project expenses were equal to or lower than planned project
expenses.
5. Issue Management – issues identified and managed throughout project life cycle.
6. Dashboard/Review Quality – high degree of accuracy and quality in project
performance data throughout life cycle.
7. Quality Defects Delivered – level of defects delivered to baseline.
8. Client Satisfaction – client or end-user satisfaction with product.
9. Degree of Difficulty – project complexity and difficulty.
A score between 1 and 5 was given to each of the nine attributes*. We calculated the
mean for the first eight categories, and then multiplied this average by the Degree of Difficulty
score for an overall score on Project Performance. If an employee worked on more than one
project, a mean was taken for all the projects worked on. We analyzed the data at the individual
employee level. If employees had more than one manager, we calculated mean scores on all
measures for all managers who worked with that employee.
*The first eight attributes were scored as follows: 1=poor; 2=fair; 3=good; 4= very good; 5=
excellent. The last attribute (Degree of Difficulty) was scored as follows: 1=very low; 2=low;
3=medium; 4=high; 5=very high.
To control for suggestion effects we titled the survey “Attitudes and Beliefs in the
Workplace”. The LOT-R questions were titled “Life in General”. The Gallup’s Q12
questions
were titled “Workplace”. The positive leadership questions were titled “Relationship with
Project Manager” for the employee survey and “Relationship with Project Team Members” for
the manager survey. Refer to Appendix A for a sample of the Employee survey and Appendix B
for a sample of the Manager survey.
Optimistic Managers 10
Procedure
We administered the survey during an eleven-day period between March 28 and April 7,
2006. To ensure a good response rate, targeted managers and employees received an email, a
day before we launched the survey, from the Chief Information Officer (CIO) alerting them of
our study and requesting their participation. In the letter he stressed that participation was
optional and confidentiality would be assured. Refer to Appendix C for a sample of the letter
from the CIO.
These managers and employees then received an email from us, which explained the
purpose of the study and instructions for completing the survey online. They were informed that
by clicking on the link to the survey, they would be granting their consent to participate in our
study. Refer to Appendix D for a sample of the letter from us, the researchers.
Managers and employees were given one week to complete the survey. A reminder by
the CIO was distributed a day before the due date and an extension was granted for an additional
three days. After participants completed the survey, we gained retrospective access to the
company’s internal performance data for key projects in 2005. Between the time managers and
employees completed the survey and the end of the quarter (April-June 2006), performance data
was collected prospectively on these same projects. In addition, prospective performance data
were collected for the projects that participants had been reassigned to during the restructuring.
Results
The primary question of our research study was: “Are teams led by an optimistic manager
more engaged in their work, and do they produce better results than teams led by a pessimistic
manager?” We hypothesized that optimistic managers would lead teams that are 1) more
engaged and 2) more productive than pessimistic managers. Second, we were interested in the
Optimistic Managers 11
other relationships among manager optimism, manager engagement, employee optimism,
employee engagement and project performance. Finally, we wanted to test our model of positive
leadership.
To investigate these relationships, we ran the correlations between eight variables:
Manager Optimism (MO), Manager Engagement (ME), Employee Optimism (EO), Employee
Engagement (EE), Project Performance (PP), Strengths-Based approach (STR), Perspective
(PER), and Recognition (REC). Although this was one study, we ran the set of inter-correlations
twice: once with the retrospective project performance data from 2005 and once with the
prospective project performance data from April to June 2006.
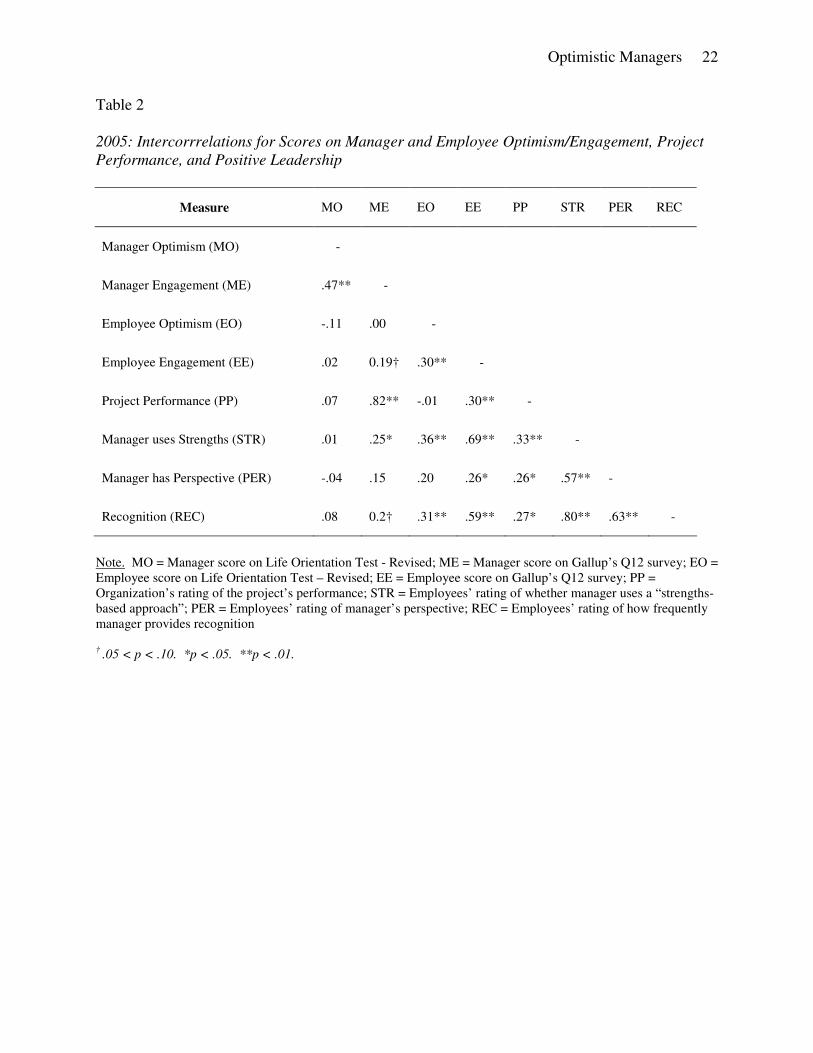
Retrospective: 2005
The sample size for the retrospective data was comprised of 86 employees and 17
managers. See Table 1 for a comparison of means and standard deviations for the data collected
in 2005; correlations are presented in Table 2. In 2005, manager optimism did not correlate with
either employee engagement (r = .02, p = ns) or project performance (r = .07, p = ns), as
originally hypothesized.
Manager optimism did, however, correlate significantly with manager engagement (r =
.47 and p < .01), and this correlation is statistically moderate to large (Cohen, 1998). Manager
engagement had a very large and significant correlation with project performance (r = .82 and p
< .01). Employee optimism correlated significantly with employee engagement (r = .30 and p <
.01), and employee engagement significantly correlated with project performance (r = .30 and p
< .01).
Managers who employ a strengths-based approach correlated significantly with manager
engagement (r = .25 and p < .05), employee optimism (r = .36 and p < .01), employee
Optimistic Managers 12
engagement (r = .69 and p < .01), project performance (r = .33 and p < .01), perspective (r = .57
and p < .01), and recognition (r = .80 and p < .01).
The degree to which managers maintained a positive correlated significantly with
employee engagement (r = .26 and p < .05), project performance (r = .26 and p < .05), and
recognition (r = .63 and p < .01).
And, the degree to which managers who frequently provide recognition correlated
significantly with employee optimism (r = .31 and p < .01), employee engagement (r = .59 and p
< .01), and project performance (r = .27 and p < .05).
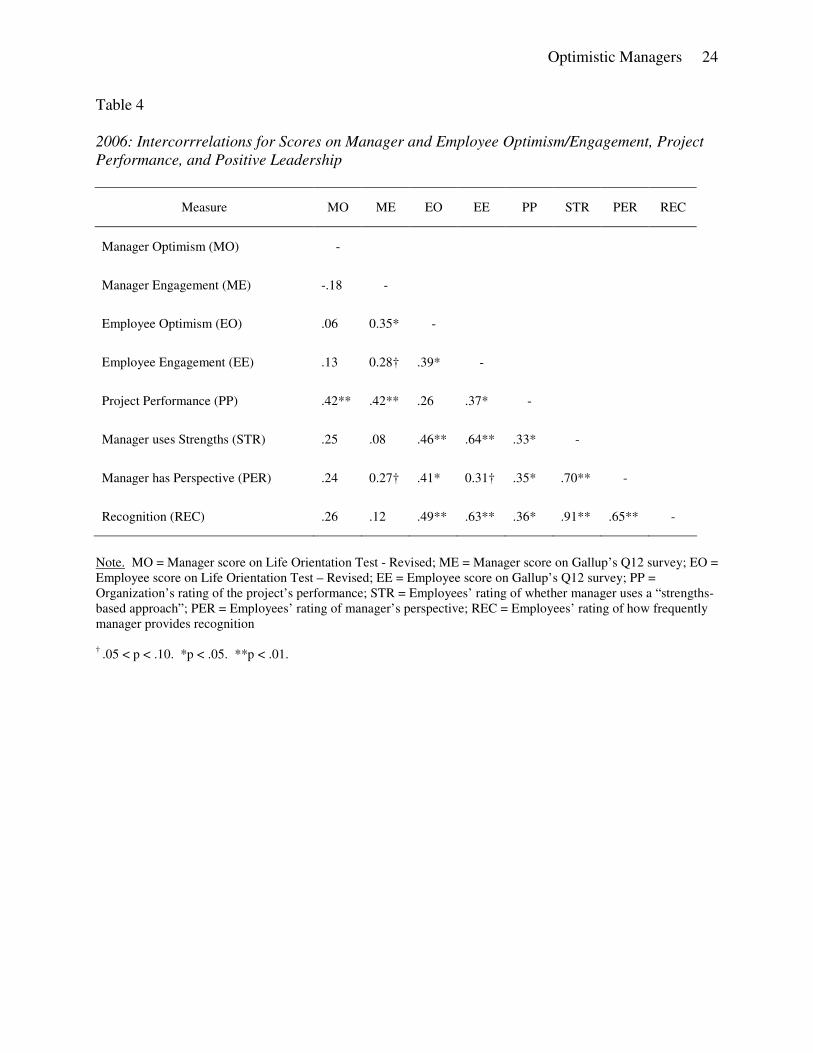
Prospective: 2006
The prospective data were comprised of 39 employees and 14 managers: a subset of the
original data with a different alignment. These data came from the same sample as the
retrospective data; however, the prospective sample is smaller because some people went to
different projects and could not be lined up. See Table 3 for a comparison of means and standard
deviations in 2006 and Table 4 for inter-correlations. In 2006, manager optimism did not
correlate with employee engagement (r = .13 and p = ns), but it did have a moderate to large
significant correlation (r = .42 and p < .01) with project performance, as originally hypothesized.
Manager engagement significantly correlated with project performance (r = .42 and p <
.01) and employee optimism (r = .35 and p < .05). Employee optimism significantly correlated
with employee engagement (r = .39 and p < .05), and employee engagement significantly
correlated with project performance (r = .37 and p < .05).
Managers who employ a strengths-based approach correlated significantly with employee
optimism (r = .46 and p < .01), employee engagement (r = .64 and p < .01), project performance
(r = .33 and p < .01), perspective (r = .70 and p < .01), and recognition (r = .91 and p < .01).
Optimistic Managers 13
The degree to which managers maintain a positive perspective correlated significantly
with employee optimism (r = .41 and p < .05), project performance (r = .35 and p < .05), and
recognition (r = .65 and p < .01).
And, managers who frequently provide recognition correlated significantly with
employee optimism (r = .49 and p < .01), employee engagement (r = .63 and p < .01), and
project performance (r = .36 and p < .05).
Discussion
The primary question of our research study was: “Are teams led by an optimistic manager
more engaged in their work, and do they produce better results than teams led by a pessimistic
manager?” In 2005, manager optimism did not result in more engaged employees and better
project performance as we expected. This finding could be due to the complexity of aligning
individual employees with only one manager in a highly matrixed organization typical of today’s
technology industry. According to Bell (2004), “Many employees now report to multiple bosses,
team leaders, or process owners.” In 2005, employees worked with up to nine managers on as
many as five projects, whereas in 2006, no one worked with more than two managers or on more
than two projects. The high amount of overlap in 2005 is evident; the mean number of managers
is almost triple the number in 2006. See the means and standard deviations for the number of
projects and managers in both 2005 and 2006 below:
Number of projects:
2005: M = 1.72, SD = .92
2006: M = 1.15, SD = .37
Number of managers:
2005: M = 3.28, SD = 1.86
2006: M = 1.33, SD = .48
Optimistic Managers 14
In 2006, we did find that manager optimism significantly correlated with project
performance, but not employee engagement. Although our sample in 2006 was smaller than in
2005, there was less overlap on the number of projects and subsequent number of managers each
employee reported to. Only five employees worked on more than one project; no one worked
with more than three managers. In comparison, in 2005, employees in our sample worked on an
average of three projects with two managers.
We were also interested in the other relationships among manager optimism, manager
engagement, employee optimism, employee engagement and project performance. In 2005 we
found that manager optimism was significantly correlated with manager engagement, which in
turn significantly correlated with project performance – this correlation was also evident in the
prospective data. This finding suggests that managers who are more engaged in their work are
more likely to manage teams that produce better results. Our findings are consistent with prior
research by Krueger & Killham (2005) and Fredrickson (1998) on the link between engagement
and productivity.
In both 2005 and 2006 employee optimism was correlated with employee engagement,
which in turn was correlated with project performance. Although it is difficult to determine
causality, this finding suggests a link between optimism, engagement, and results, consistent
with the findings of Tombaugh (2005) and Seligman and Schulman (1986). We also looked at
the role the manager plays in influencing employee engagement: in both our retrospective and
prospective data a statistically small to moderate trend emerged between manager and employee
engagement.
Finally, we were curious about how leadership style influences optimism, engagement,
and project performance, based on previous research by McColl-Kennedy & Anderson (2002),
Optimistic Managers 15
and Popper, Amit, Gal, Mishkal-Sinai & Lisak (2004). We selected three components of
positive leadership closely linked with optimism: strengths-based approach, positive
perspective, and recognition. All three measures strongly correlated with each other in both the
retrospective and prospective data. The large to very large correlations may suggest that these
measures are in fact capturing one single component – perhaps an aggregate of leadership
effectiveness.
Assuming that a strength-based approach, perspective, and recognition are all qualities of
positive leadership, in both years we found that optimistic and engaged employees were more
likely to report to a manager that valued their strengths, had a positive perspective and frequently
provided recognition. Positive leadership also predicted higher project performance in both
years. Our findings support previous research related to strengths-based leadership by The
Gallup Organization; positive perspective by Reivich and Shatte (2002) and Henry (2005); and
recognition by Kouzes and Posner (1994). With a larger sample size, path analysis might
discover that managers who employ a positive leadership style actually facilitate employee
engagement, leading to higher performance.
This finding would suggest that managers who currently embody positive leadership are
contributing to the effectiveness of not only their employees, but also the organization as a
whole. Managers who do not currently value employee strengths, nor maintain a positive
perspective, and fail to provide frequent recognition and encouragement, might benefit from
positive leadership training and development. Future research could look at the efficacy of
interventions targeting these three components. Karl (1992) found that a training program,
focusing on optimism, increased outcome expectations, self-efficacy, motivation, learning, and
transfer, when compared to standard training. As one of our participants expressed in the open-
Optimistic Managers 16
ended section of the survey, “I work with many project managers and each has a different
philosophy around how they recognize, reward, or show appreciation. Some are very good
while others fail miserably.” Our research suggests that managers who employ a positive
leadership style will have more engaged employees and produce better results.
Study Limitations and Future Research
The main limitation in our study was overlap. It was difficult to isolate which manager
the employee was thinking of when he or she completed the survey. In the retrospective 2005
data, there was a large amount of overlap between the number of managers and projects aligned
with each employee. Thus, mean scores were used to calculate manager optimism, manager
engagement, and project performance. Although the sample size of our prospective 2006 data is
smaller, there was less overlap
Due to the highly complex nature of a matrixed organization, it was difficult to align an
individual employee with just one manager. If this study was replicated, we recommend
collecting a larger sample and using more sophisticated data analysis techniques to take into
account the non-independence and hierarchal organization of the data. With a larger sample size
it would be ideal to conduct a Hierarchical Linear Modeling analysis, in addition to simple inter-
correlations, to see how different levels of management affect engagement, optimism, and
productivity.
Conclusion
According to Seligman (2002, p. 83), “optimism and hope cause better resistance to
depression when bad events strike, better performance at work, particularly in challenging jobs,
and better physical health.” In today’s rapidly changing and uncertain business environment
managers and employees need optimism more than ever before to not only cope, but to innovate
Optimistic Managers 17
and flourish. Managers have more influence, than perhaps they realize, on their employees’
engagement, optimism, and performance, and can consciously use this influence to benefit these
employees and the organization as a whole.
Optimistic Managers 18
References
Bell, Michael A. “Leading and Managing in the Virtual Matrix Organization,” Gartner Research,
ID Number: R-22-1959, March 11, 2004, pp. 4.
Clifton, Donald O. and Harter, James K. (2003). Investing in Strengths. In Cameron, Kim S.,
Dutton, Jane E., & Quinn, Robert E. (Eds.). Positive Organizational Scholarship:
Foundations of a New Discipline (p.111-121). Berrett-Koehler Publishers, 1st edition.
Cohen, J. (1988). Statistical power analysis for the behavioral sciences. (2nd ed.). New Jersey:
Lawrense Erlbaum.
Fredrickson, B. L. (1998). What good are positive emotions? Review of General Psychology, 2,
300-319. http://www.lsa.umich.edu/psych/peplab/pdf/Fredrickson_RGP_98.pdf
Fredrickson, B.L. & Losada M. F. (2005). Positive affect and the complex dynamics of human
flourishing. American Psychologist, 60(7):678-86.
Henry, Paul C. “Life Stresses, Explanatory Style, Hopelessness, and Occupational Class,”
International Journal of Stress Management. Vol 12(3), Aug 2005, pp. 241-256
Humphrey, Ronald H. “The Many Faces of Emotional Leadership,” The Leadership Quarterly,
Volume 13, Issue 5, October 2002, Pages 493-504.
Kamen, L. P. & Seligman, M.E.P. (1985). Explanatory style predicts college grade point
average. Unpublished manuscript, University of Pennsylvania, Philadelphia.
Karl, Katherine A. “Effects of Optimistic Versus Realistic Previews of Training Programs on
Self-Reported Transfer of Training.” Human Resource Development Quarterly, vol. 3,
no. 4, Winter 1992. pp. 373-384. Jossey-Bass Publishers.
Kouzes, James M., Posner, Barry Z. Encouraging the Heart: A Leader’s Guide to Rewarding
and Recognizing Others. Jossey-Bass, 1st edition, 2003.
Optimistic Managers 19
Krueger, Jerry and Killham, Emily. (2005). At Work, Feeling Good Matters: Happy employees
are better equipped to handle workplace relationships, stress, and change, according to
the latest GMJ survey. Gallup Management Journal. Retrieved February 9, 2006 from
the World Wide Web: http://gmj.gallup.com
McColl-Kennedy, Janet R. & Anderson, Ronald D. “Impact of leadership style and emotions on
subordinate performance,” The Leadership Quarterly, Volume 13, Issue 5, October 2002,
Pages 545-559
Nolen-Hoeksema, S., Girgus, J.S., & Seligman, M.E.P. (1986). Learned helplessness in children:
A longitudinal study of depression, achievement, and explanatory style. Journal of
Personality and Social Psychology, 51, 435-442.
Peterson, C. & Barrett, L.C. (1987). Explanatory style and academic performance among
university freshman. Journal of Personality and Social Psychology, 53, 603-607.
Peterson, Christopher & Seligman, Martin E. (1984). “Causal explanations as a risk factor for
depression: Theory and evidence.” Psychological Review, 91, 347-374.
Popper, Micha; Amit, Karin; Gal, Reuven; Mishkal-Sinai, Moran; Lisak, Alon, “The Capacity to
Lead: Major Psychological Differences Between Leaders and Nonleaders.” Military
Psychology, Oct2004, Vol. 16 Issue 4, p245, 19p.
Rath, Tom (2006). Vital Friends. New York: Gallup Press, p 182-183.
Reivich, Karen & Shatte, Andrew (2002). The Resilience Factor. New York: Broadway Books.
Ryan, R.M., & Deci, E.L. (2000). Self-determination theory and the facilitation of intrinsic
motivation, social development and well-being. American Psychologist, 55, pp. 70.
Scheier, Michael, Carver, Charles, & Bridges, Michael (1994). Distinguishing optimism from
neuroticism (and trait anxiety, self-mastery, and self-esteem): A reevaluation of the life
Optimistic Managers 20
orientation test. Journal of Personality and Social Psychology. Vol 67, No. 6. pp. 1063-
1078.
Seligman, Martin E. (2002). Authentic Happiness. New York: Free Press.
Seligman, Martin E; Schulman, Peter, “Explanatory style as a predictor of productivity and
quitting among life insurance sales agents.” Journal of Personality and Social
Psychology. Vol 50(4), Apr 1986, pp. 832-838
Tombaugh, Jay R. “Positive leadership yields performance and profitability: Effective
organizations develop their strengths,” Development and Learning in Organizations, June
2005 Volume: 19 Issue: 3 Page: 15 – 17

Optimistic Managers 21
Table 1
Means and Standard Deviations for 2005 Scores on Manager and Employee
Optimism/Engagement, Project Performance, and Positive Leadership
Measure M SD
Manager Optimism 20.58 3.22
Manager Engagement 3.76 0.16
Employee Optimism 17.08 4.46
Employee Engagement 3.65 0.69
Project Performance 9.40 5.00
Manager leverages Strengths 3.61 0.86
Manager has Perspective 3.73 0.85
Manager provides Recognition 3.40 0.90
Optimistic Managers 22
Table 2
2005: Intercorrrelations for Scores on Manager and Employee Optimism/Engagement, Project
Performance, and Positive Leadership
Measure MO ME EO EE PP STR PER REC
Manager Optimism (MO) -
Manager Engagement (ME) .47** -
Employee Optimism (EO) -.11 .00 -
Employee Engagement (EE) .02 0.19† .30** -
Project Performance (PP) .07 .82** -.01 .30** -
Manager uses Strengths (STR) .01 .25* .36** .69** .33** -
Manager has Perspective (PER) -.04 .15 .20 .26* .26* .57** -
Recognition (REC) .08 0.2† .31** .59** .27* .80** .63** -
Note. MO = Manager score on Life Orientation Test - Revised; ME = Manager score on Gallup’s Q12 survey; EO =
Employee score on Life Orientation Test – Revised; EE = Employee score on Gallup’s Q12 survey; PP =
Organization’s rating of the project’s performance; STR = Employees’ rating of whether manager uses a “strengths-
based approach”; PER = Employees’ rating of manager’s perspective; REC = Employees’ rating of how frequently
manager provides recognition
† .05 < p < .10. *p < .05. **p < .01.

Optimistic Managers 23
Table 3
Means and Standard Deviations for 2006 Scores on Manager and Employee
Optimism/Engagement, Project Performance, and Positive Leadership
Measure M SD
Manager Optimism 17.42 2.66
Manager Engagement 3.84 0.35
Employee Optimism 17.18 4.53
Employee Engagement 3.71 0.68
Project Performance 14.96 6.59
Manager leverages Strengths 3.77 0.89
Manager has Perspective 3.83 0.77
Manager provides Recognition 3.51 0.94
Optimistic Managers 24
Table 4
2006: Intercorrrelations for Scores on Manager and Employee Optimism/Engagement, Project
Performance, and Positive Leadership
Measure MO ME EO EE PP STR PER REC
Manager Optimism (MO) -
Manager Engagement (ME) -.18 -
Employee Optimism (EO) .06 0.35* -
Employee Engagement (EE) .13 0.28† .39* -
Project Performance (PP) .42** .42** .26 .37* -
Manager uses Strengths (STR) .25 .08 .46** .64** .33* -
Manager has Perspective (PER) .24 0.27† .41* 0.31† .35* .70** -
Recognition (REC) .26 .12 .49** .63** .36* .91** .65** -
Note. MO = Manager score on Life Orientation Test - Revised; ME = Manager score on Gallup’s Q12 survey; EO =
Employee score on Life Orientation Test – Revised; EE = Employee score on Gallup’s Q12 survey; PP =
Organization’s rating of the project’s performance; STR = Employees’ rating of whether manager uses a “strengths-
based approach”; PER = Employees’ rating of manager’s perspective; REC = Employees’ rating of how frequently
manager provides recognition
† .05 < p < .10. *p < .05. **p < .01.
Optimistic Managers 25
Authors’ Note
We would like to express our gratitude to the following people who, without their help,
this study would not have been possible: Mike Maniaci, from the University of Pennsylvania’s
Positive Psychology Center, for offering his expertise (and patience) in running our statistical
data. Emily Killham and Tom Rath, from The Gallup Organization, for granting us permission
to use Gallup’s Q12 employee engagement questionnaire. Greg Tranter, Chief Information
Officer at Hanover Insurance Group (HIG), for sparking the idea that ultimately led to this study
and for granting us permission to conduct our study in his organization. Karen Craft, Jean
Dalbec, Karen Facteau, Linda McGowan, and Kathleen Mills, employees of the HIG, for all of
their assistance in identifying participants for our study, providing performance measures and
sorting of the employee and manager data. All of the HIG employees and managers who took
the time to complete our survey. Chris Peterson, professor of psychology at the University of
Michigan, for guiding us through our research project. James, Pawelski, Karen Reivich and
Marty Seligman, professors in the Master of Applied Positive Psychology program at the
University of Pennsylvania, for sparking our interest in studying optimism and their early
guidance in helping us shape our study. Bill Robertson, Positive Organizational Leadership
instructor at the University of Pennsylvania, for exposing us to some of the greatest minds in
organizational leadership. Debbie Swick and Jaime Hernandez, from the University of
Pennsylvania, for their guidance, support, and encouragement throughout our project. Neal
Greenberg for his patience, support, and proofreading of this study. And finally, all of our
MAPP (Master in Applied Positive Psychology) classmates, especially our reviewers Gordon
Parry and Doug Turner, for their lively class discussions, abundant sharing of information, and
friendship.
Optimistic Managers 26
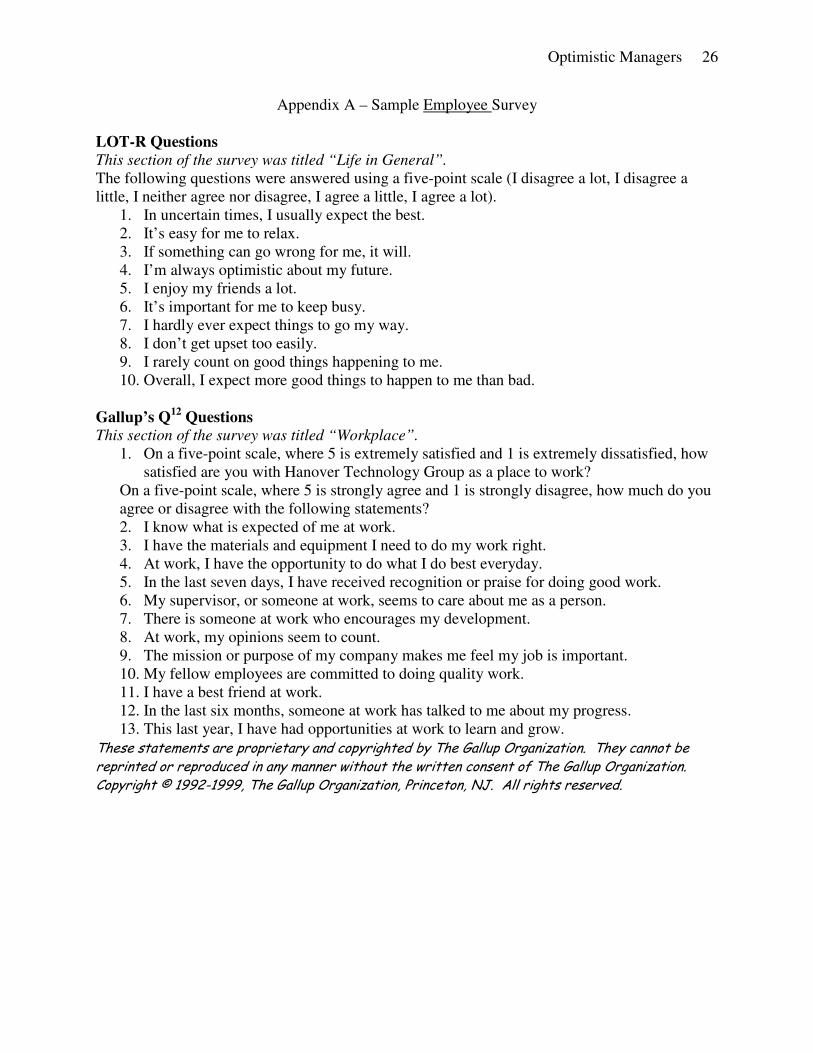
Appendix A – Sample Employee Survey
LOT-R Questions
This section of the survey was titled “Life in General”.
The following questions were answered using a five-point scale (I disagree a lot, I disagree a
little, I neither agree nor disagree, I agree a little, I agree a lot).
1. In uncertain times, I usually expect the best.
2. It’s easy for me to relax.
3. If something can go wrong for me, it will.
4. I’m always optimistic about my future.
5. I enjoy my friends a lot.
6. It’s important for me to keep busy.
7. I hardly ever expect things to go my way.
8. I don’t get upset too easily.
9. I rarely count on good things happening to me.
10. Overall, I expect more good things to happen to me than bad.
Gallup’s Q12
Questions
This section of the survey was titled “Workplace”.
1. On a five-point scale, where 5 is extremely satisfied and 1 is extremely dissatisfied, how
satisfied are you with Hanover Technology Group as a place to work?
On a five-point scale, where 5 is strongly agree and 1 is strongly disagree, how much do you
agree or disagree with the following statements?
2. I know what is expected of me at work.
3. I have the materials and equipment I need to do my work right.
4. At work, I have the opportunity to do what I do best everyday.
5. In the last seven days, I have received recognition or praise for doing good work.
6. My supervisor, or someone at work, seems to care about me as a person.
7. There is someone at work who encourages my development.
8. At work, my opinions seem to count.
9. The mission or purpose of my company makes me feel my job is important.
10. My fellow employees are committed to doing quality work.
11. I have a best friend at work.
12. In the last six months, someone at work has talked to me about my progress.
13. This last year, I have had opportunities at work to learn and grow.
These statements are proprietary and copyrighted by The Gallup Organization. They cannot be reprinted or reproduced in any manner without the written consent of The Gallup Organization. Copyright © 1992-1999, The Gallup Organization, Princeton, NJ. All rights reserved.
Optimistic Managers 27
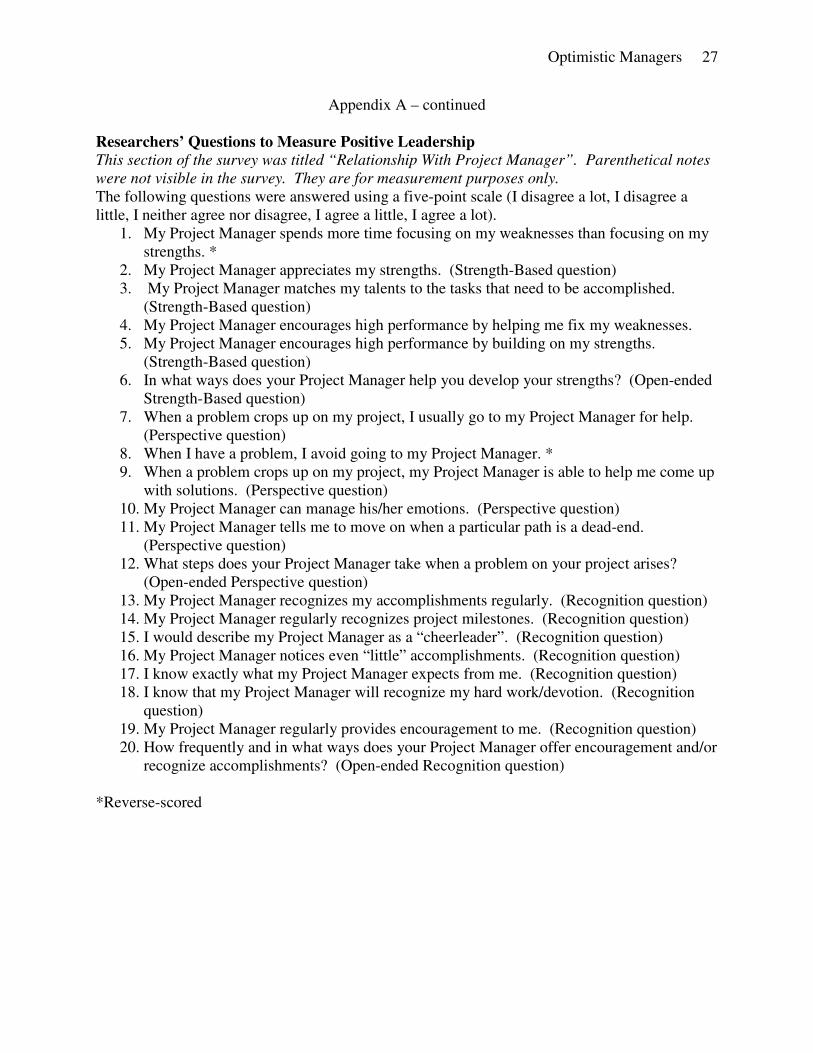
Appendix A – continued
Researchers’ Questions to Measure Positive Leadership
This section of the survey was titled “Relationship With Project Manager”. Parenthetical notes
were not visible in the survey. They are for measurement purposes only.
The following questions were answered using a five-point scale (I disagree a lot, I disagree a
little, I neither agree nor disagree, I agree a little, I agree a lot).
1. My Project Manager spends more time focusing on my weaknesses than focusing on my
strengths. *
2. My Project Manager appreciates my strengths. (Strength-Based question)
3. My Project Manager matches my talents to the tasks that need to be accomplished.
(Strength-Based question)
4. My Project Manager encourages high performance by helping me fix my weaknesses.
5. My Project Manager encourages high performance by building on my strengths.
(Strength-Based question)
6. In what ways does your Project Manager help you develop your strengths? (Open-ended
Strength-Based question)
7. When a problem crops up on my project, I usually go to my Project Manager for help.
(Perspective question)
8. When I have a problem, I avoid going to my Project Manager. *
9. When a problem crops up on my project, my Project Manager is able to help me come up
with solutions. (Perspective question)
10. My Project Manager can manage his/her emotions. (Perspective question)
11. My Project Manager tells me to move on when a particular path is a dead-end.
(Perspective question)
12. What steps does your Project Manager take when a problem on your project arises?
(Open-ended Perspective question)
13. My Project Manager recognizes my accomplishments regularly. (Recognition question)
14. My Project Manager regularly recognizes project milestones. (Recognition question)
15. I would describe my Project Manager as a “cheerleader”. (Recognition question)
16. My Project Manager notices even “little” accomplishments. (Recognition question)
17. I know exactly what my Project Manager expects from me. (Recognition question)
18. I know that my Project Manager will recognize my hard work/devotion. (Recognition
question)
19. My Project Manager regularly provides encouragement to me. (Recognition question)
20. How frequently and in what ways does your Project Manager offer encouragement and/or
recognize accomplishments? (Open-ended Recognition question)
*Reverse-scored
Optimistic Managers 28
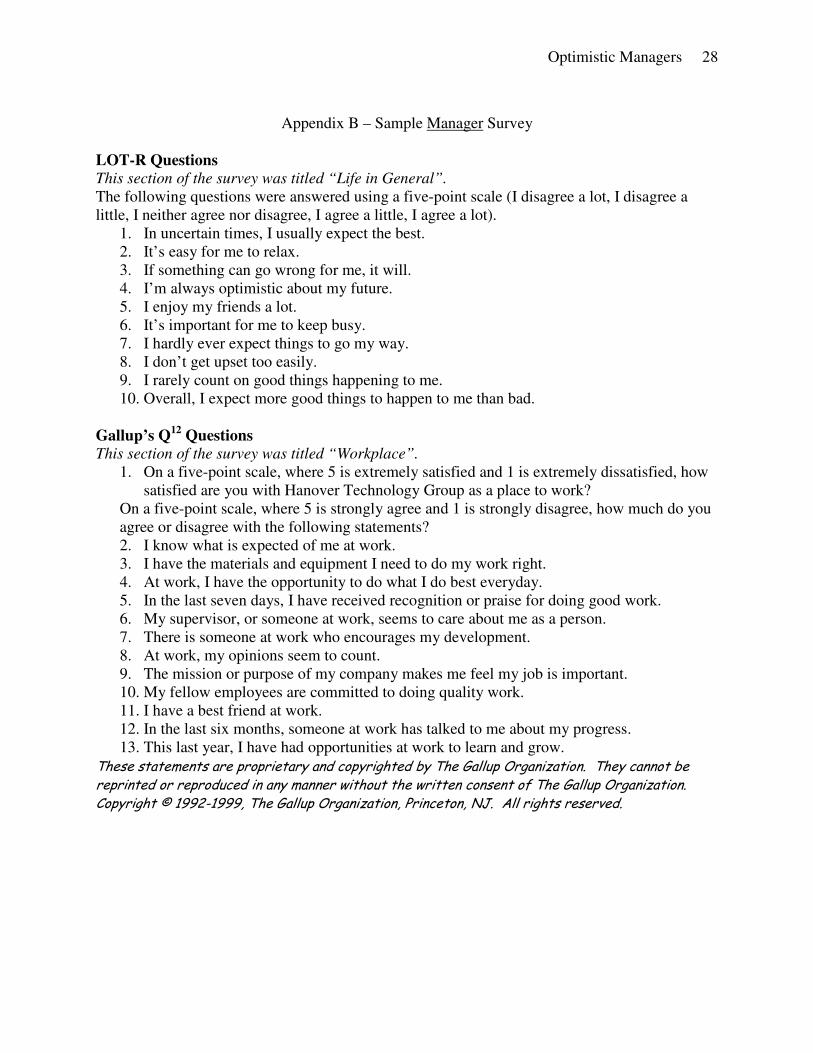
Appendix B – Sample Manager Survey
LOT-R Questions
This section of the survey was titled “Life in General”.
The following questions were answered using a five-point scale (I disagree a lot, I disagree a
little, I neither agree nor disagree, I agree a little, I agree a lot).
1. In uncertain times, I usually expect the best.
2. It’s easy for me to relax.
3. If something can go wrong for me, it will.
4. I’m always optimistic about my future.
5. I enjoy my friends a lot.
6. It’s important for me to keep busy.
7. I hardly ever expect things to go my way.
8. I don’t get upset too easily.
9. I rarely count on good things happening to me.
10. Overall, I expect more good things to happen to me than bad.
Gallup’s Q12
Questions
This section of the survey was titled “Workplace”.
1. On a five-point scale, where 5 is extremely satisfied and 1 is extremely dissatisfied, how
satisfied are you with Hanover Technology Group as a place to work?
On a five-point scale, where 5 is strongly agree and 1 is strongly disagree, how much do you
agree or disagree with the following statements?
2. I know what is expected of me at work.
3. I have the materials and equipment I need to do my work right.
4. At work, I have the opportunity to do what I do best everyday.
5. In the last seven days, I have received recognition or praise for doing good work.
6. My supervisor, or someone at work, seems to care about me as a person.
7. There is someone at work who encourages my development.
8. At work, my opinions seem to count.
9. The mission or purpose of my company makes me feel my job is important.
10. My fellow employees are committed to doing quality work.
11. I have a best friend at work.
12. In the last six months, someone at work has talked to me about my progress.
13. This last year, I have had opportunities at work to learn and grow.
These statements are proprietary and copyrighted by The Gallup Organization. They cannot be reprinted or reproduced in any manner without the written consent of The Gallup Organization. Copyright © 1992-1999, The Gallup Organization, Princeton, NJ. All rights reserved.
Optimistic Managers 29
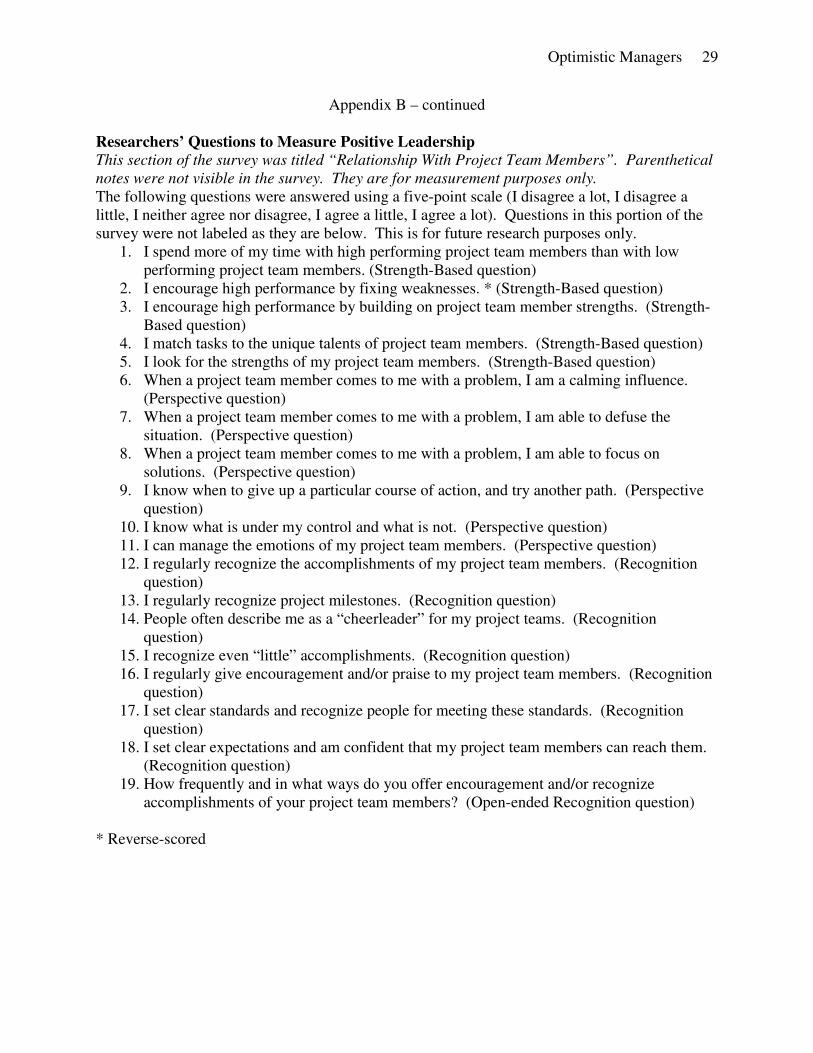
Appendix B – continued
Researchers’ Questions to Measure Positive Leadership
This section of the survey was titled “Relationship With Project Team Members”. Parenthetical
notes were not visible in the survey. They are for measurement purposes only.
The following questions were answered using a five-point scale (I disagree a lot, I disagree a
little, I neither agree nor disagree, I agree a little, I agree a lot). Questions in this portion of the
survey were not labeled as they are below. This is for future research purposes only.
1. I spend more of my time with high performing project team members than with low
performing project team members. (Strength-Based question)
2. I encourage high performance by fixing weaknesses. * (Strength-Based question)
3. I encourage high performance by building on project team member strengths. (Strength-
Based question)
4. I match tasks to the unique talents of project team members. (Strength-Based question)
5. I look for the strengths of my project team members. (Strength-Based question)
6. When a project team member comes to me with a problem, I am a calming influence.
(Perspective question)
7. When a project team member comes to me with a problem, I am able to defuse the
situation. (Perspective question)
8. When a project team member comes to me with a problem, I am able to focus on
solutions. (Perspective question)
9. I know when to give up a particular course of action, and try another path. (Perspective
question)
10. I know what is under my control and what is not. (Perspective question)
11. I can manage the emotions of my project team members. (Perspective question)
12. I regularly recognize the accomplishments of my project team members. (Recognition
question)
13. I regularly recognize project milestones. (Recognition question)
14. People often describe me as a “cheerleader” for my project teams. (Recognition
question)
15. I recognize even “little” accomplishments. (Recognition question)
16. I regularly give encouragement and/or praise to my project team members. (Recognition
question)
17. I set clear standards and recognize people for meeting these standards. (Recognition
question)
18. I set clear expectations and am confident that my project team members can reach them.
(Recognition question)
19. How frequently and in what ways do you offer encouragement and/or recognize
accomplishments of your project team members? (Open-ended Recognition question)
* Reverse-scored
Optimistic Managers 30
Appendix C – Sample Letter From Chief Information Officer
Greetings.
I’m sending this request to ask a favor of you.
Many of you may remember Margaret Greenberg, who conducted a number of management
forums for HIG over the past few years. Her efforts in those forums have been instrumental in
helping us to mature as an organization. Margaret and fellow colleague Dana Arakawa are
collaborating on a research study for their master’s thesis about attitudes and beliefs in the
workplace. They have asked to survey a group of managers and employees within HIG for the
data they need.
Although your participation in this survey is totally voluntary, I would encourage you to
consider their request for our participation in their research a complement to our organization. I
believe it is a testament to the caliber of individuals we have in our organization that Margaret
and Dana have chosen us. They know that the information they receive from you will be
thoughtful, truthful, and valuable. You can be assured of confidentiality regarding your
responses. While we will receive a copy of their report and findings, we will not receive any of
the responses.
Tomorrow you will receive e-mail from Margaret and Dana with information about the study
and how to access the on-line survey, should you decide to participate. The time commitment
from you is approximately 15 minutes to respond to the survey.
I would be immensely pleased if you give this serious consideration and decide to participate in
the study.
Sincerely,
CIO
Optimistic Managers 31
Appendix D – Sample Letter From Researchers
Dear [FirstName],
As (CIO) has already informed you, we (Margaret Greenberg and Dana Arakawa) are
collaborating on a research study about attitudes and beliefs in the workplace. This study is our
thesis for a Master's program at the University of Pennsylvania. Greg has been gracious to allow
us to conduct this study at HIG.
You are being asked to take part in this research study. Your participation is voluntary which
means you can choose whether or not to participate and either decision will not adversely impact
you or your employment at HIG. We want to be sensitive to your busy schedules, so your time
commitment is minimal (see details below). Your responses remain anonymous to Hanover
Insurance Group and we assure you that we will maintain your confidentiality.
The purpose of this study is to learn more about the attitudes and beliefs of both managers and
employees and their impact on productivity and engagement.
You were asked to participate in this study because we want to study managers and their
respective teams in an organization that has implemented sound principles and practices of the
software development lifecycle.
Your time commitment is minimal. We are asking you to complete an on-line survey, requiring
approximately 15 minutes of your time. This on-line survey can be completed at your leisure, as
long as it is completed by Tuesday, April 4, 2006.
This study does not present any risks to you, other than a possible breach of confidentiality.
However, we assure you that we will adhere to strict rules of confidentiality and honor your
confidentiality at all times. Your survey results will be combined with others and only we will
have access to this data.
Your participation in this study will not directly benefit you; however, you will be contributing
to the growing body of research on attitudes and beliefs in the workplace. If you are interested,
we will be happy to share the results of this study with you.
If you have questions about the research study, please contact Margaret
([email protected], 860-742-2380), Dana ([email protected], 808-291-
1800), or James Pawelski at the University of Pennsylvania ([email protected]). If
you have technical difficulties with the survey, please contact Margaret or Dana. If you have
questions about your rights and welfare as a volunteer in the research study, please contact the
Office of Regulatory Affairs at the University of Pennsylvania at 215-898-2614.
BY CLICKING ON THE LINK BELOW YOU ARE CONSENTING TO THE TERMS OF
THIS STUDY OUTLINED ABOVE. REMEMBER, IT TAKES APPROXIMATELY 15
MINUTES:
Optimistic Managers 32
Appendix D - continued
[SurveyLink]
IF YOU HAVE ANY QUESTIONS OR ARE UNSURE THAT YOU WANT TO
PARTICIPATE, DO NOT CLICK ON THE LINK.
Thank you in advance for your participation,
Margaret Greenberg
Dana Arakawa
If you choose not to participate in our study, please click the link below.
[RemoveLink]