Embed Size (px)
Citation preview
150 NIGERIAN JOURNAL OF TECHNOLOGICAL DEVELOPMENT, VOL. 17, NO.3, SEPTEMBER 2020
*Corresponding author: [email protected] doi: http://dx.doi.org/10.4314/njtd.v17i3.1
ABSTRACT: Hydrocarbon exploration basically requires effective drilling and efficient overpowering of frictional and
viscosity forces. Normally, frictional power losses occur in deep well systems and it is essential to analyse each
component of any well system to determine where exactly pressure is lost, and this can be done using Nodal Analysis.
In this study, nodal analysis has been carried out with the use of PROSPER, a software for well performance, design
and optimisation. Artificial lifts can then be used to solve the problem of frictional power losses. To increase the
production of Barbra 1 well in the Niger Delta and hence extend its functional life, we have applied nodal analysis.
Modelling results for three artificial lift methods; continuous gas lift, intermittent gas lift and electrical submersible
pump were found to be 1734.93 bbl/day, 451.50 bbl/day and 2869 bbl/day respectively. The output from the well
performance without artificial lift was 1370.99 bbl/day by applying Darcy’s model. Meanwhile, the output from the
well without artificial lift is 89.90 bbl/day when aided with productivity index (PI) entry, the normal model for
intermittent gas lift. Hence, from the comparative analysis of the results obtained from this study, it was deduced that
when artificial lifts are employed, the well output increases significantly from 1370.99bbl/day to 2869 bbl/day
(electrical submersible pump). This study concludes that wells such as Barbra 1 are good candidates for artificial lift,
and this is evidenced by increasing productivity.
KEYWORDS: Production optimisation, nodal analysis, prosper simulator and barbra well.
[Received December 27, 2019, Revised April 11, 2020, Accepted June 29, 2020] Print ISSN: 0189-9546 | Online ISSN: 2437-2110
I. INTRODUCTION
During hydrocarbon production, friction losses must be
effectively overcome in order for the fluid to flow to the
surface with the initial well bed pressure. The fluid travels
from the reservoir through the piping system to the surface. A
well output or production rate is its ability to deliver
hydrocarbons to the atmospheric level and it can be affected by
the performance of any of the units in the well piping system.
Therefore, there is need to analyse each unit of the system
using nodal analysis. Nodal analysis is a method of
systematically assessing a well as a complete system with
different components and analysing each component for the
pressure loss at that point. It is important to construct a model
of the well with reservoir production variables.
Pressure loss may be due to friction or viscosity of the fluid
(more pressure is required to carry a viscous fluid). When
nodal analysis has been carried out then there is need to solve
the problem that caused the pressure loss at that component to
optimize flow. Artificial lift is one of the major solutions in the
industry for solving pressure losses and heavy fluids flow
challenge. It can be applied to solve problems involving under-
or over-sized tubing or flow lines. These restrict and/or reduce
production rate. One of the most common and most applicable
lift systems is Gas lift system.
Gas lift is the method of injecting gas into the well bore
fluid in order to aerate it and make it flow easily to the surface
facility. This study is focussed on optimizing gas lift methods
to increase its efficiency in solving pressure losses in the well
using PROSPER to carry out nodal analysis in this project.
PROSPER (Productions and systems performance analysis
system) is a commercial software used in optimizing operating
conditions existing well system and predicting the effects of
future changes in various reservoir and production parameters.
Barbra 1 well has been drilled in the Niger Delta and has
been identified to have a short life span without artificial
lifting. The short life span of the well is attributed to the
decrease in reservoir energy which results in a decline in
production. In the oil and gas industry decline in production is
a serious problem which can be caused by excessive pressure
drops along the production system, bad management of wells,
usage of oversized and undersized tubing. The components in
a production system are interactive therefore when one of the
components is changed there may be a change in the pressure
drop behaviour of the other components.
A well deliverability as indicated by Amanat Chaudhry,
2003 and Belyadi et al., 2019 is the well’s capability to deliver
liquid and gas given the well reservoir’s pressure. The two
main parameters that determine a well deliverability are its
inflow and outflow performance. The inflow performance
Optimisation of Artificial Lifts Using Prosper Nodal
Analysis for BARBRA-1 Well in Niger Delta Tega Odjugo1, Yahaya Baba1*, Aliyu Aliyu2, Ndubuisi Okereke3, Lekan Oloyede4, Olabisi Onifade5
1Department of Chemical and Petroleum Engineering, Afe Babalola University, Ado-Ekiti, Nigeria 2Department of Engineering & Technology, University of Huddersfield, United Kingdom
3Department of Petroleum Engineering, Federal University of Technology, Owerri, Nigeria 4Department of Mechanical and Mechatronics Engineering, Afe Babalola University, Ado-Ekiti, Nigeria
5Department of Electrical and Computer Engineering, Afe Babalola University, Ado-Ekiti, Nigeria
.

BABA et al: OPTIMISATION OF ARTIFICIAL LIFTS USING PROSPER NODAL ANALYSIS 151
*Corresponding author: [email protected] doi: http://dx.doi.org/10.4314/njtd.v16i4.8
directly determines the reservoir’s deliverability while outflow
performance accounts for the resistance of flow during
production. The main reason why deliverability analysis is
carried out is to determine the level of achievable fluid
production rates from reservoirs given certain production
string characteristics. This analysis is otherwise known as
Nodal Analysis Clegg et al.,1993.
Nodal analysis has previously been applied for the
quantification of the performance of systems composed of
interrelating components. Examples include complex pipeline
networks, centrifugal pump systems and electrical circuits.
Application of nodal analysis to well-producing systems was
first proposed by Gilbert, 1954. Tetoros, 2015 noted that the
concept was further established (Mach et al., 1979). To carry
out nodal analysis, a specific point within the system (i.e. the
node) is selected and the system is subdivided in two
component segments. The components upstream of the node
encompass the inflow part and those downstream are the
outflow components. The behaviour of each component in the
system is then directly linked to pressure drop and flow rate.
The fluid flow rate across the entire system is then calculated
once the following requirements are met Vogel, 1968: node
inflow equals node outflow such that only one pressure can
subsist at a node. As an illustration, the numerous positions of
the nodes are as given in Figure 1.
Figure 1: Location of Various Nodes in Production System Beggs, 1991
The pressures of both reservoir and separator or wellhead,
are fixed. Since the node has a unique pressure, the following
expressions can be used (Ibrahim, 2007)
𝑃�̅� − ∆𝑝𝑢𝑝𝑠𝑡𝑟𝑒𝑎𝑚 = 𝑃𝑛𝑜𝑑𝑒 (1)
𝑃𝑤ℎ − ∆𝑝𝑑𝑜𝑤𝑛𝑠𝑡𝑟𝑒𝑎𝑚 = 𝑃𝑛𝑜𝑑𝑒 (2)
Where 𝑃�̅�: The average reservoir pressure (psi), 𝑃𝑤ℎ is the
wellhead pressure (psi), ∆𝑝𝑢𝑝𝑠𝑡𝑟𝑒𝑎𝑚 is the pressure loss as a
result of upstream components (psi), and ∆𝑝𝑑𝑜𝑤𝑛𝑠𝑡𝑟𝑒𝑎𝑚 is the
pressure loss due to upstream components (psi). The aim of
this paper is to analyse parameters that affect the production of
Barbra 1 well by modelling systems that can optimize a
continuous gas lift, intermittent gas lift and electrical
submersible pump using PROSPER software to carry out
nodal analysis. This was achieved through the following
objectives: modelling the components of a well system
separately and verifying each of the model subsystems by
performance matching using prosper which will ensure
accurate calculation, modelling the well in various scenarios
so as to calculate the future performance of the wells and
recommend the best scenario in which the well would be fully
optimised for current operating conditions.
A summary of the existing works carried out on gas lift are
given. Bieker et al. (2007) reported a technological survey on
real time production optimisation of oil and gas production
systems. Optimisation of the system was done using collected
data, processing, and model updating. Production and strategic
planning were achieved as result. Litvak & Angert (2009)
reported work on the application of field development
optimisation to large oil fields. A robust optimisation
procedure based on Genetic Algorithm which is a global
optimisation method was employed together with mixed
integer optimisation. Stephenson et al. (2010) did a case study
on utilising real-time fault detection of gas lift systems using
intelligent algorithms and was a novel method for nonstop
monitoring of wells producing by way of continuous gas lift.
Furthermore, the applying such a system in a developed
onshore gas lift fields in the western parts of the United States
of American and their findings were extensively discussed.
Ageh et al. (2010) carried out an integrated method of
production modelling for optimising field development
planning as well as management. The Petroleum experts
(PETEX) modelling tool was used for evaluating the Bonga
North deep-water subsea tie-back development, the software
allowed the incorporation of flow assurance into subsurface
deliverability and this also includes considering the effect of
both existing and envisaged topside constraints.
Tetoros, 2015 worked on the designing a continuous gas
lift system to initiate production in a dead well. The main work
was to design a gas lift system which assisted production
during current operating conditions and future forecasting.
Unlike the other works discussed above, the purpose of this
paper is to perform an optimisation on continuous and
intermittent gas lift. An electrical submersible pump for an oil
well was simulated using the flow simulator PROSPER to
comprehensively carry out nodal analysis.
II. NUMERICAL SIMULATION
This study was carried out using PROSPER software
developed for the purpose well performance design and
optimisation. PROSPER enables the modelling of most types
of well completions and artificial lift techniques. It permits the
construction of different well models and has the ability to
access all variables like well configuration, fluid PVT
characteristics, multiphase Vertical Lift Performance (VLP)
correlations and various Inflow Performance Relationship
(IPR) models. The model can be tuned by matching real field
production data aimed towards increase the accuracy of
different model scenarios. The major application of PROSPER
152 NIGERIAN JOURNAL OF TECHNOLOGICAL DEVELOPMENT, VOL. 17, NO.3, SEPTEMBER 2020
*Corresponding author: [email protected] doi: http://dx.doi.org/10.4314/njtd.v17i3.1
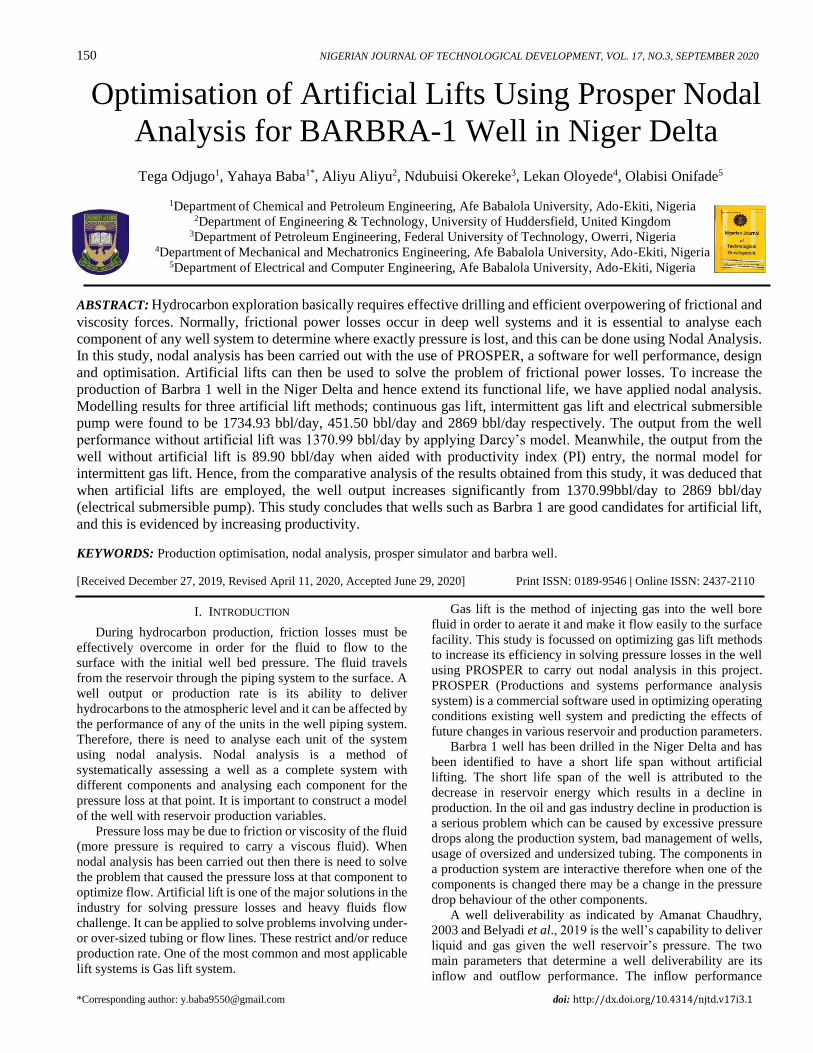
is the calculation of VLP using multiphase flow correlations
with the evaluation of the variables of VLP. Sensitivity
analysis can be easily done on forecasted changes to
parameters that influence both IPR and VLP. An illustration of
IPR input data is given in Figure 2 below. These include
specification of the PVT method for which the Black Oil
model. The fluid was assumed to display Newtonian behaviour
and effective viscosity was calculated using the correlation of
Beggs Dales, 1991. For the intermittent gas lift method, the
electrical submersible pump was used.
Figure 2: Data input interface.
A. IPR and Equipment Data
The IPR curve can be made after the PVT data has been
adequately matched. There are many models for making the
IPR. For this well, the Darcy model was selected due to its
simplicity and ease of convergence. The Productivity index
inserted is used in the calculation of IPR. Furthermore, the
liquid rates are the same as IPR rates. The IPR input as shown
in Figure 2 is based on the simulation made by the FINUS
reservoir department using Eclipse. To enable the calculation
of pressure and temperature profiles along the well, there is
need for temperature (geothermal gradient and average heat
capacity), completion (down-hole equipment) and survey data. For Electrical submersible pump or Gas lift (continuous or
intermittent) to be implemented, a full work-over is necessary.
The ESP’s is a part of the tubing and the well contains no side
pockets such that gas lift valves are connected by wireline.
PROSPER simulations therefore uses the well current
completion.
B. Building Gas Lift Models
In the modelling of a continuous gas lift model, a number
of parameters are required. The artificial lift in the system
summary is first changed to gas lift (continuous) the data was
inputted. The modelling of the intermittent gas lift model is
similar to that of the continuous lift gas model only that the
artificial lift method in the system summary for this case is
changed to gas lift (intermittent) and the appropriate
intermittent gas lift data are inputted. The modelling of an
electrical submersible pump is slightly different from that of
the continuous and intermittent gas lift models. The first step
is to change the artificial lift method in the system summary to
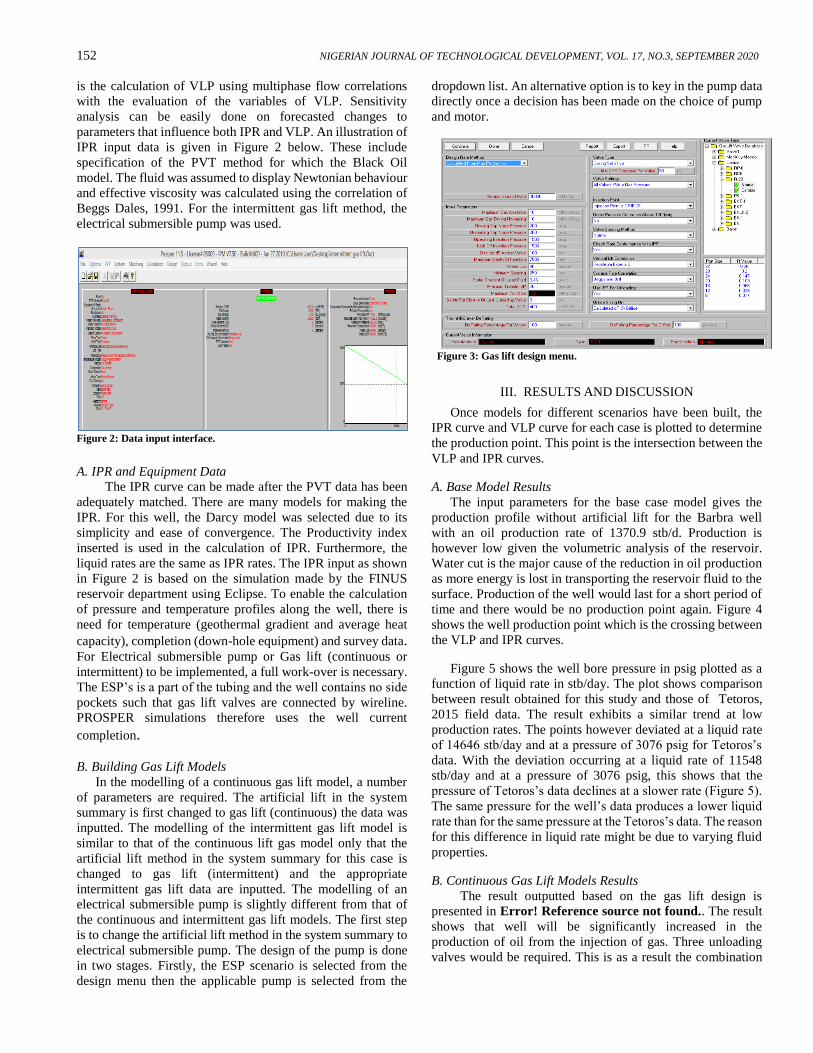
electrical submersible pump. The design of the pump is done
in two stages. Firstly, the ESP scenario is selected from the
design menu then the applicable pump is selected from the
dropdown list. An alternative option is to key in the pump data
directly once a decision has been made on the choice of pump
and motor.
Figure 3: Gas lift design menu.
III. RESULTS AND DISCUSSION
Once models for different scenarios have been built, the
IPR curve and VLP curve for each case is plotted to determine
the production point. This point is the intersection between the
VLP and IPR curves.
A. Base Model Results
The input parameters for the base case model gives the
production profile without artificial lift for the Barbra well
with an oil production rate of 1370.9 stb/d. Production is
however low given the volumetric analysis of the reservoir.
Water cut is the major cause of the reduction in oil production
as more energy is lost in transporting the reservoir fluid to the
surface. Production of the well would last for a short period of
time and there would be no production point again. Figure 4
shows the well production point which is the crossing between
the VLP and IPR curves.
Figure 5 shows the well bore pressure in psig plotted as a
function of liquid rate in stb/day. The plot shows comparison
between result obtained for this study and those of Tetoros,
2015 field data. The result exhibits a similar trend at low
production rates. The points however deviated at a liquid rate
of 14646 stb/day and at a pressure of 3076 psig for Tetoros’s
data. With the deviation occurring at a liquid rate of 11548
stb/day and at a pressure of 3076 psig, this shows that the
pressure of Tetoros’s data declines at a slower rate (Figure 5).
The same pressure for the well’s data produces a lower liquid
rate than for the same pressure at the Tetoros’s data. The reason
for this difference in liquid rate might be due to varying fluid
properties.
B. Continuous Gas Lift Models Results
The result outputted based on the gas lift design is
presented in Error! Reference source not found.. The result
shows that well will be significantly increased in the
production of oil from the injection of gas. Three unloading
valves would be required. This is as a result the combination

BABA et al: OPTIMISATION OF ARTIFICIAL LIFTS USING PROSPER NODAL ANALYSIS 153
*Corresponding author: [email protected] doi: http://dx.doi.org/10.4314/njtd.v16i4.8
of load fluid density, depth setting of the operating valve and
the injection pressure of gas lift.
Figure 4: Barbra 1 well production point (this is the intersection between
the IPR and VLP curves).
Figure 5: Comparison between present study and the work of Tetoros
(2015).
Table 1: Results from continuous gas lift design.
Result Barbra 1 well
Depth of unloading valve 1, feet MD 2980.24
Depth of unloading valve 2, feet MD 4706.51 Depth of unloading valve 3, feet MD 5544.33
Unloading valve port size, 64ths inch 14.00
Depth of operating valve, feet MD 5804.54 Injection pressure, psig 1321.08
Injected gas rate, MMscf/day 5.48
Operating valve port size, 64ths inch 14.00 Oil rate with continuous gas lift, stb/day 1734.93
Oil rate without gas lift, stb/day 1370.90
Table 2: Injection analysis of the Barbra 1 well.
Injection depth (feet, MD) Oil production (stb/day)
3280.84 960.00
4921.26 1465.80
6561.68 1857.80 7545.93 2021.60
Considering a well without depth constraints that is moved
to a 900-kg/m3 fluid instead of seawater at the start of injection,
the operating valve would be set deeper and there would be an
increase in production. In order to determine injection depth
effects on the production, a sensitivity analysis was done.
Error! Reference source not found. shows the results of the
sensitivity study in terms of oil production rate at different
tubing depths. From the table, it can be seen that the production
rate is approximately proportional to injection depth with a
near linear relationship. Figure 4 gives the tendency of several
VLP curves as a function of injection depth. From the plot, it
is seen that a higher operating valve setting depth results in
increased production.
Figure 6: Injection depth analysis on Barbra 1 well.
C. Intermittent Gas Lift Model Results
Following the design of intermittent gas lift model, the
results obtained are presented in Table 1. The oil production
rate is seen to be different from that of the continuous gas lift
because the reservoir model applied for the intermittent gas lift
in the IPR data is PI entry. This is because when the Darcy
model is used for this case, a solution point cannot be obtained
as can be seen in Figure 5. From the results it can be observed
that there are only two unloading valves needed for the
intermittent gas lift design. The increase in production is
however high when the PI model is considered. The oil
production increases from a rate of 89.9 stb/day to 451.5
stb/day as seen in Figure 8. The injection of the gas
intermittently causes spikes in the VLP curve because of the
unsteady injection of gas.
D. Result of Electrical Submersible Pump Model
Coefficients for horsepower and head received by Centrilift
is inputted into the PROSPER software’s database. With the
pump curves’ coefficients to enable simulation for any well
condition. From Figure 8 showing maximum and minimum
operating range, best efficiency line and operating ranges
denoted in red, blue and green colours respectively. It can be
seen that the least operating range of 60Hz, is 9486 bbl/day and
the top limit is 14484 bbl/day.
Table 1: Results of Intermittent gas lift design.
Result Barbra 1 Well
Depth of unloading valve 1, feet MD 3121.09
Depth of unloading valve 2, feet MD 5111.56
Depth of operating valve, feet MD 6699.45 Injection Pressure of unloading valve 1, psig 1485.70
Injection Pressure of unloading valve 2, psig 1604.13
Injection Pressure of operating valve, psig 1698.61 Closing Pressure of unloading valve 1, psig 1685.70
Closing Pressure of unloading valve 2, psig 1804.13
Closing Pressure of operating valve, psig 1898.61 Gas injection rate, Mscf/day 49.14
Oil rate with Intermittent gas lift, stb/day 451.50

154 NIGERIAN JOURNAL OF TECHNOLOGICAL DEVELOPMENT, VOL. 17, NO.3, SEPTEMBER 2020
*Corresponding author: [email protected] doi: http://dx.doi.org/10.4314/njtd.v17i3.1
Oil rate without gas lift, stb/day 89.90
Figure 7: Solution intersection point for Darcy PI model denoted in red
and VLP outflow line denoted in green.
Figure 8: Pump curves for the centrilift.
Table 4: Electrical submersible pump model result.
Result Barbra 1 Well
Oil rate with ESP, bbl/day 2869.00 Total liquid rate ESP, bbl/day 14344.90
Oil rate without artificial lift, bbl/day 1370.90
Oil rate with continuous gas lift, bbl/day 1734.93
The ideal operating point is obtained at or near the best
efficiency line. At this point, the efficiency curve for the pump
is greatest. Given the conditions of the well and ESP data, the
production in the ESP is then calculated by PROSPER and the
results are shown in Error! Reference source not found..
The well shows a significant increase in production for the
ESP case when compared with the base case and continuous
gas lift case. The total liquid rate is almost close to the
maximum operating range which means there is little capacity
to handle more fluid. Similarly, from Figure 9 which shows a
plot production rate versus pressure, the green curve is the
pump discharge pressure, which is the inlet pressure of the
pump adjusted for losses additional pump losses, while the red
curve is the VLP from wellhead to pump discharge. The
intersection of pump discharge pressure and the VLP gives the
solution rate.
Figure 9: Well ESP system.
IV. CONCLUSION
This study was carried out to design model systems in the
flow simulator PROSPER to analyse a production well: Barbra
1 using nodal analysis to solve the problem of under-utilisation
of continuous gas lift, intermittent gas lift. An electrical
submersible pumps characteristic in increasing the production
rate of the well was assessed. We created a mathematical
model that consists of several sub-models, for the prediction of
attainable fluid production rates under different operating
conditions. Modelling parameters such as the IPR curve, PVT
data, downhole equipment and temperature profile along the
well was done for both the base case model, the continuous gas
lift model, the intermittent gas lift model and the electrical
submersible pump.
The best artificial lift to be used from the modelling results
was shown to be the Electrical submersible pump. This is
because of its high production rate when applied to the well
conditions, however, there are power costs associated with its
operation. The continuous gas lift method is also applicable,
but the intermittent gas lift would not improve the conditions
of the well significantly. We note that, while the work carried
out here produced successful results, in actual fact, production
optimisation is very complex, and every well cannot be
optimised individually. In cases where more wells are
considered, optimisation software such as GAMS and GAP
from PETEX are necessary for application in order to achieve
full field optimisation and maximise income from well
operations.
REFERENCES
Ageh, E. A.; A. Adegoke and O. J. Uzoh. (2010). Using
Integrated Production Modeling IPM as an Optimisation Tool
for Field Development Planning and Management, pp 1-11, In
34th Annual SPE International Conference and Exhibition.
Calabar, Nigeria: SPE.
Ahmed, T. (2014). Reservoir Engineering Handbook 2nd
Edition, Houston, Texas: Gulf Professional Publishing.
https://doi.org/10.1007/s007690000247
Beggs, H. Dales. (1991). Production Optimisation Using
Nodal, 2nd Edition, OGCI and Petroskills Publications Tulsa,
Oklahoma, USA.
BABA et al: OPTIMISATION OF ARTIFICIAL LIFTS USING PROSPER NODAL ANALYSIS 155
*Corresponding author: [email protected] doi: http://dx.doi.org/10.4314/njtd.v16i4.8
Bieker, H. P.; O. Slupphaug, and T. A. Johansen.
(2007). Real-Time Production Optimisation of Oil and Gas
Production Systems : A Technology Survey. In SPE Intelligent
Energy Conference and Exhibition, Amsterdam, 11–13.
Chaudhry, A. (2003). Gas Well Testing Handbook
Copyright © Elsevier Inc. ISBN 978-0-7506-7705-9,
https:doi.org/10.1016/B978-0-7506-7705-9.X5000-X
Clegg, J. D.; N. W. Heln and S. M. Bucaram. (1993).
Recommendations and Comparisons for Selecting Artificial-
Lift Methods. Journal of Petroleum Technology, 45(12): 1128-
1166.
Gilbert, W. E. (1954). Flowing and Gas-lift Well
Performance. In Sprlng meeting of the Pacific Coast District,
Divlsion of Production, American Petroleum Institute, New
York, USA, 1-32.
Guo B., L. W. (2007). Petroleum Production Engineering.
A Computer-Assisted Approach (ISBN: 0750). Elsevier
Science & Technology Books.
Belyadi, H.; E. Fathi and F. Belyadi (2019) Hydraulic
Fracturing in Unconventional Reservoirs: Theories,
Operations, and Economic Analysis, 2nd Edition, Elsevier
Publishing Inc. ISBN 978-0-12-817665-8.
Ibrahim, A. T. M. (2007). Optimisation of Gas Lift
System in Varg Field. Master's Thesis, Universiteteti
Stavanger, Norway.
Litvak, M. and Angert, P. (2009). Field Development
Optimisation Applied to Giant Oil Fields. In SPE Reservoir
Simulation Symposium, Texas, USA, 2-4.
Mach J.M.; E.A. Proano and K.E. Brown. (1979) A
nodal approach for applying systems analysis to the flowing
and artificial oil and gas well, paper SPE 8025: 1082-1096.
Petex - Petroleum Experts. (2010). PROSPER. Retrieved
December 22, 2017, from
http://www.petex.com/products/?ssi=3
Petrowiki. (2015). Artificial lift. Retrieved December 27,
2017, from http://petrowiki.org/Artificial_lift
Stephenson, G.; R. Molotkov; N. D. Guzman and L.
Lafferty. (2010). Real-Time Diagnostics of Gas Lift Systems
Using Intelligent Agents : A Case Study. SPE Production &
Operations, (February), 111–123.
Tetoros, I. E. (2015). Design of a continuous gas lift
system to initiate production in a dead well. Technical
University Of Crete, Greece.
Vogel, J. V. (1968). Inflow Performance Relationships for
Solution-Gas Drive Wells. Journal of Petroleum Technology,
20(1), 83–92. https://doi.org/10.2118/1476-PA