Embed Size (px)
Citation preview

OPTIMAL LOCATION OF CAPACITOR BANK FOR POWER LOSSES
MINIMIZATION
ZIANA BT CHE ROS
A thesis report submitted in fulfillment of the requirement for the award of the Degree of
Master of Electrical Engineering
Faculty of Electrical and Electronics Engineering
Universiti Tun Hussein Onn Malaysia
JULY 2013

v
ABSTRACT
Power system consist of several components such are generations, transmission lines,
distributions and loads. Each part consist of components that might encounter losses
during their operations which then, can be divided into two categories: technical
losses and non-technical losses. The main focus of this study is the technical losses
that caused by the physical properties of components at transmission lines
especially the MW loss and the Mvar loss. This thesis focused on the 9 Bus system
analysis. Several studies have been conducted for this system which can be divided
into two categories; The original setting ( stable system ) and the modified circuit for
heavy loads setting where the loads capacity are increased to twice the value of the
original setting. The purpose is to generate greater value of power losses. Thus,
capacitor bank has been introduced to the system to minimize these losses. Several
analysis have been done to determine the impact of installing the capacitor. Firstly,
by varying the capacitor locations at all the busses in order to find the appropriate
location of capacitor that might response to the power losses minimization the most.
Record the MW losses and Mvar losses at each Busses and compare to the power
losses of the original setting. This finally will show, which bus responses to the
installed capacitor the most. Secondly, by varying the capacitor values installed at
the effected bus in order to find the optimum range of the capacitor that will reduce
Mvar losses the most. This Mvar range also can be calculated theoretically by
applying an appropriate formula. The result is depending upon which capacitor value
will decrease the power losses greatly. For acknowledgement, all the data and
analysis are being done by the Powerworld Simulator Version 14 ( student version ).
Finally, after completing all the analysis, the percentage of power losses reduction
also can be determined theoretically . In fact, it can be concluded that many aspects
to the capacitor compensation and its effects, depending on where capacitors get to
be located, their sizes, and details of the distribution circuit.

vi
ABSTRAK
Sistem kuasa terdiri daripada beberapa komponen asas seperti janakuasa, talian
penghantaran, sistem pengagihan dan beban. Setiap satunya terdiri daripada
komponen yang mungkin terdedah kepada kesan kehilangan kuasa Terdapat dua
jenis kehilangan kuasa iaitu kuasa teknikal dan kuasa bukan teknikal. Fokus utama
tesis ini adalah untuk menganalisa kehilangan kuasa teknikal yang terdapat di talian
penghantaran umumnya dan kehilangan kuasa MW dan kehilangan kuasa Mvar
khususnya pada sistem 9 bus. Pelbagai kajian telah dijalankan terhadap sistem ini
yang boleh dikelaskan kepada sistem asal ( system yang stabil ) dan sistem yang
telah diubahsuaikan dimana keperluan Mvar pada bebannya telah ditambah menjadi
dua kali ganda daripada beban sistem yang asal. Ini bertujuan untuk menjana
kehilangan kuasa yang banyak supaya kesan pemasangan kapasitor pada system
dapat dikaji dengan lebih mendalam. Kapasitor telah diperkenalkan untuk
mengurangkan kehilangan kuasa kepada system tersebut. Pelbagai analisa juga telah
dilakukan untuk mengkaji kesan kapasitor terhadap pengurangan kehilangan kuasa.
Pertama, dengan mempelbagaikan lokasi kapasitor keatas setiap bus bagi
menentukan bus yang akan memberi tindakbalas yang besar terhadap kapacitor
tersebut. Nilai kehilangan kuasa MW dan kehilangan kuasa Mvar direkodkan pada
setiap talian penghantaran dan dibandingkan dengan kehilangan kuasa pada sistem
yang asal. Kedua, dengan mempelbagaikan nilai kapasitor pada bus yang terkesan
demi mencari julat optimum kapasitor yang akan digunakan. Beberapa nilai kapasitor
telah digunakan ke atas bus yang dipilh bagi tujuan ini. Nilai kehilangan kuasa MW
dan kehilangan kuasa Mvar direkodkan melalui perisian simulasi powerworld versi
14. Di akhir kajian ini, peratusan kadar pengurangan kehilangan kuasa dan julat
Mvar yang sesuai juga dapat ditentukan melalui pengiraan berdasarkan penggunaan
rumus yang sesuai. Secara keseluruhannya, didapati bahawa kesan kapasitor adalah
bergantung kepada lokasinya dalam system kuasa,saiznya dan system pengagihan
secara terperinci.
vii
CONTENTS
TITLE i
DECLARATION ii
DEDICATION iii
ACKNOWLEDGEMENT iv
ABSTRACT v
ABSTRAK vi
CONTENTS vii
LIST OF TABLES x
LIST OF FIGURES xii
LIST OF SYMBOLS AND ABBREEATION xiii
LIST OF APPENDIX xiv
CHAPTER 1 INTRODUCTION 1
1.1 Overview 2
1.2 Motivation and problem statement 4
1.3 Research objectives 6
1.4 Research scope 6
1.5 Research limitation 7
1.6 Thesis outline 7
CHAPTER 2 LITERATURE REVIEW 8
2.1 Introduction 8
2.2 Overview of power losses 8
2.3 Optimal location of capacitor bank 10
viii
2.4 Power factor improvement 12
2.5 Calculation of KVar demand 14
CHAPTER 3 RESEARCH METHODOLOGY 18
3.1 Introduction 18
3.2 Research methodology 18
3.3 Research flow chart 20
CHAPTER 4 RESULTS AND DISCUSSION 22
4.1 Introduction 22
4.2 One-line diagram for original setting 22
4.3 Power flow result for original setting 23
4.4 Additional of MVar load demand 25
4.41 Case 1: Adding an extraMvar load deman at
Bus no 5 26
4.5 Power flow result for “ Disturbed System “ 26
4.6 Capacitor installation at power grid 29
4.7 One-line diagram for capacitor installation 29
4.8 Power flow resulted from capacitor installation 30
4.9 Variation of capacitor location 32
4.10 Power flow data for variation of capacitor location 32
4.11 Summary of power losses minimization at every busses 35
4.12 Variation of capacitor values 35
4.13 One-Line diagram for variation of capacitor values 36
4.14 Power Flow data for varioation of capacitor values 36
4.15 Summary of power flow data for variation of capacitor
values 42
4.16 Graphically data presentation of variation of capacitor
values 43
4.17 Percentage of power losses reduction 45
ix
4.18 Determination of KVar rating 46
CHAPTER 5 CONCLUSION AND FUTURE WORK 48
5.1 Introduction 48
` 5.2 Research conclusion 48
5.3 Future work 49
REFERENCES 50
APPENDIX A 52

xiii
LIST OF SYMBOLS AND ABBREVIATIONS
V - Voltage
I - Current
R - Resistance
kW - Kilo-Watt
S - Apparent Power
PF - Power Factor
Q - Reactive Power
P - Active Power
SQRT - Square Root
Pmax - Maximum Power
xii
LIST OF FIGURES
1.1 kW, kVar and kVA Vector 2
1.2 Power triangle 4
2.1 Block diagram of power system 8
2.2 Optimal location of capacitor bank 11
2.3 Improved power factor 13
3.1 Research flow chart 20
4.1 Schematic oneline diagram for the 9 busses
Power grid system 22
4.2 Graphical representation of MVAR losses at each busses 25
4.3 Schematic oneline diagram for “ disturbed system” 26
4.4 Graphical representation of the Mvar losses at each
busses for case 1 27
4.5 Schematic oneline diagram with the installation of capacitor
( 243.8 Mvar ) parallel to the load at bus no 5 30
4.6 Graphical representation of Mvar losses for the whole system 31
4.7 Graphical representation of Mvar losses for variation of
bus location 35
4.8 Schematic oneline diagram for 50 Mvar capacitor at bus 5 36
4.9 Schematic oneline diagram for 100 Mvar capacitor
at bus 5 38
4.10 Schematic oneline diagram for 150 Mvar capacitor
at bus 5 40
4.11 Schematic oneline diagram for 300 Mvar capacitor
at bus 5 41
xi
LIST OF TABLES
2.1 Kvar multiplier 17
4.1 List of component of the original setting 23
4.2 Voltage ( p.u) value at each busses 23
4.3 Power Flow ( MW & MVAR ) value at each busses 24
4.4 MVAR losses at each busses 24
4.5 Power Factor value at each busses 25
4.6 Voltage (p.u) values and the Mvar losses at each busses for case 1 27
4.7 MVA Flow at each busses for case 1 28
4.8 Power Factor at each busses for case 1 28
4.9 Comparison between Load at different MVar 29
4.10 Data for p.u voltage busses and the MVAR losses at each busses
With Caps =200 Mvar 31
4.11 Data for Power Factor for the whole system 32
4.12 Mvar losses at each busses without the capacitor 32
4.13 Mvar losses at each busses with the capacitor located at bus 4 33
4.14 Mvar losses at each busses with the capacitor located at bus 5 33
4.15 Mvar losses at each busses with the capacitor located at bus 6 33
4.16 Mvar losses at each busses with the capacitor located at bus 7 34
4.17 Mvar losses at each busses with the capacitor located at bus 8 34
4.18 Mvar losses at each busses with the capacitor located at bus 9 34
4.19 Data for 50 Mvar : voltage (p.u) and Mvar losses at bus 5 37
4.20 Data for 50 Mvar : Power Factor at bus 5 37
4.21 Data for 50 Mvar : MVA flow at bus 5 37
4.22 Data for 100 Mvar : voltage (p.u) and Mvar losses at bus 5 38
4.23 Data for 100 Mvar : Power Factor at bus 5 39
4.24 Data for 100 Mvar: MVA flow at bus 5 39
4.25 Data for 150 Mvar : voltage (p.u) and Mvar losses at bus 5 40
4.26 Data for 150 Mvar: MVA flow at bus 5 40
xi
4.27 Data for 300 Mvar : voltage (p.u) and Mvar losses at bus 5 41
4.28 Data for 300 Mvar : Power Factor at bus 5 42
4.29 Data for 300 Mvar: MVA flow at bus 5 42
4.30 The overall Power Factor data for each capacitor value 43
4.31 The overall Mvar Losses and Voltage (p.u ) values each
capacitor value 43
4.32 Graphical version for power factor 44
4.33 Graphical version for Mvar Losses 44
4.34 Graphical version for Voltage (p.u) 45
4.35 Power Factor With and Without capacitor installation 46
4.36 Data for Average value 47
1
CHAPTER 1
INTRODUCTION
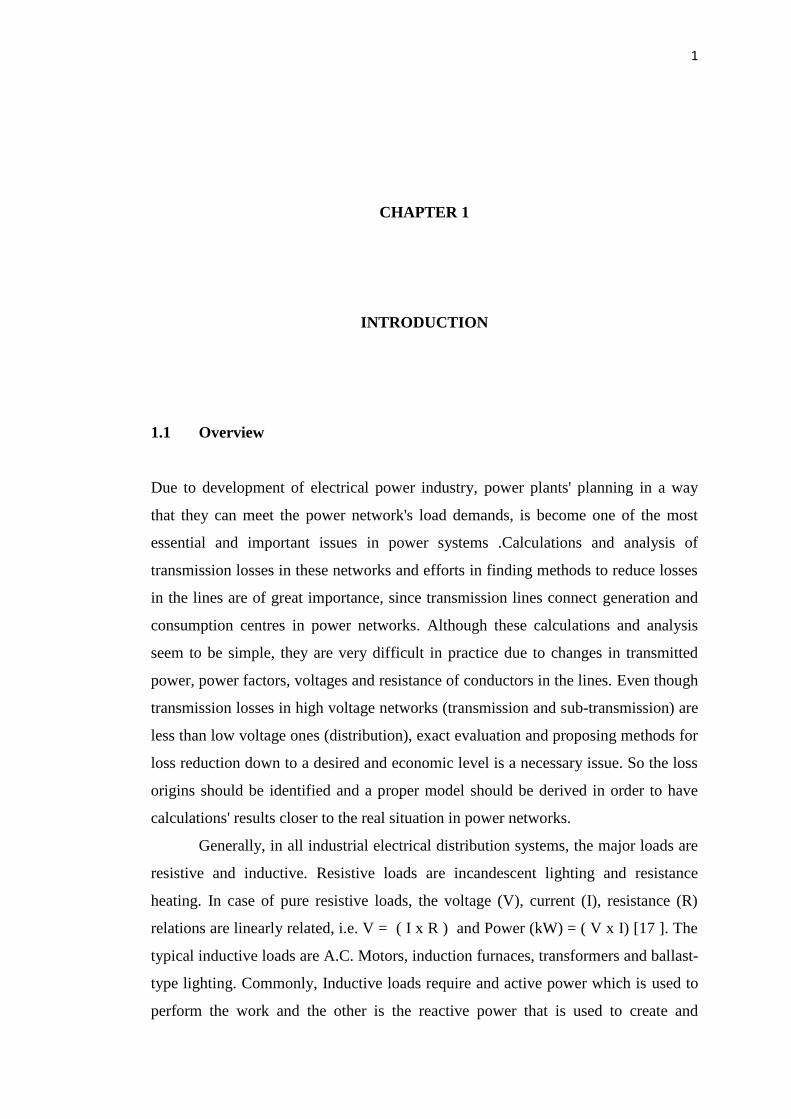
1.1 Overview
Due to development of electrical power industry, power plants' planning in a way
that they can meet the power network's load demands, is become one of the most
essential and important issues in power systems .Calculations and analysis of
transmission losses in these networks and efforts in finding methods to reduce losses
in the lines are of great importance, since transmission lines connect generation and
consumption centres in power networks. Although these calculations and analysis
seem to be simple, they are very difficult in practice due to changes in transmitted
power, power factors, voltages and resistance of conductors in the lines. Even though
transmission losses in high voltage networks (transmission and sub-transmission) are
less than low voltage ones (distribution), exact evaluation and proposing methods for
loss reduction down to a desired and economic level is a necessary issue. So the loss
origins should be identified and a proper model should be derived in order to have
calculations' results closer to the real situation in power networks.
Generally, in all industrial electrical distribution systems, the major loads are
resistive and inductive. Resistive loads are incandescent lighting and resistance
heating. In case of pure resistive loads, the voltage (V), current (I), resistance (R)
relations are linearly related, i.e. V = ( I x R ) and Power (kW) = ( V x I) [17 ]. The
typical inductive loads are A.C. Motors, induction furnaces, transformers and ballast-
type lighting. Commonly, Inductive loads require and active power which is used to
perform the work and the other is the reactive power that is used to create and
2
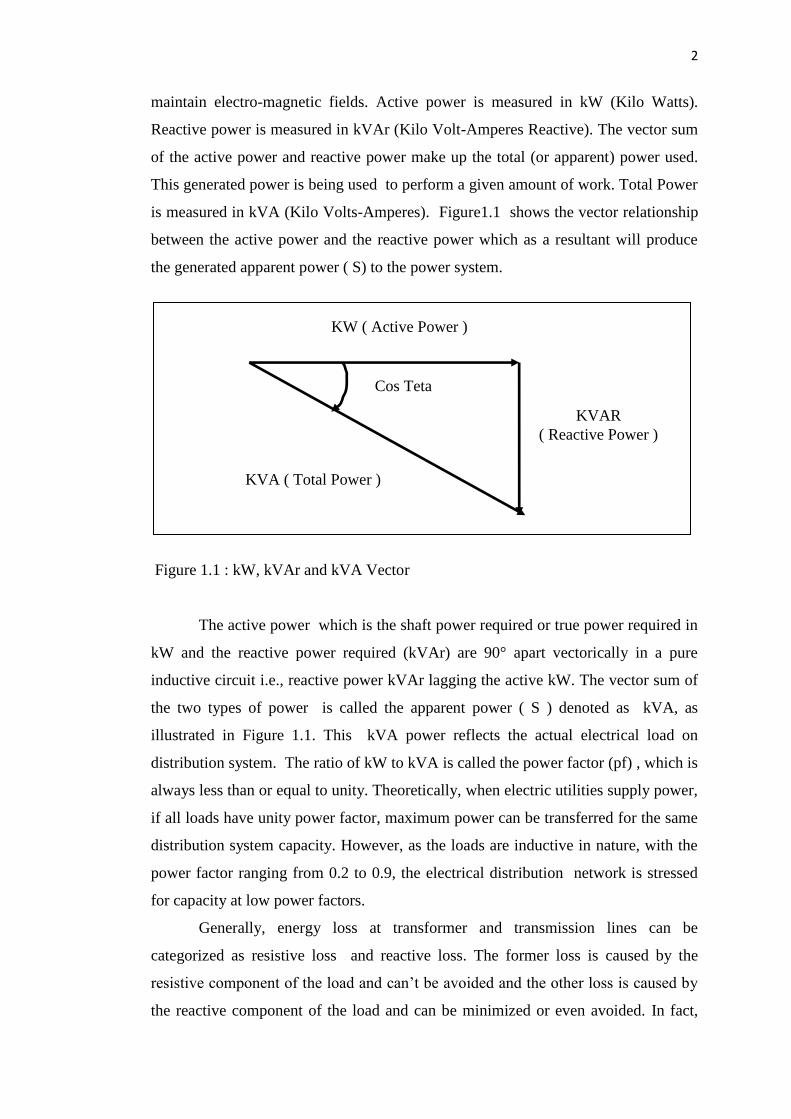
maintain electro-magnetic fields. Active power is measured in kW (Kilo Watts).
Reactive power is measured in kVAr (Kilo Volt-Amperes Reactive). The vector sum
of the active power and reactive power make up the total (or apparent) power used.
This generated power is being used to perform a given amount of work. Total Power
is measured in kVA (Kilo Volts-Amperes). Figure1.1 shows the vector relationship
between the active power and the reactive power which as a resultant will produce
the generated apparent power ( S) to the power system.
Figure 1.1 : kW, kVAr and kVA Vector
The active power which is the shaft power required or true power required in
kW and the reactive power required (kVAr) are 90° apart vectorically in a pure
inductive circuit i.e., reactive power kVAr lagging the active kW. The vector sum of
the two types of power is called the apparent power ( S ) denoted as kVA, as
illustrated in Figure 1.1. This kVA power reflects the actual electrical load on
distribution system. The ratio of kW to kVA is called the power factor (pf) , which is
always less than or equal to unity. Theoretically, when electric utilities supply power,
if all loads have unity power factor, maximum power can be transferred for the same
distribution system capacity. However, as the loads are inductive in nature, with the
power factor ranging from 0.2 to 0.9, the electrical distribution network is stressed
for capacity at low power factors.
Generally, energy loss at transformer and transmission lines can be
categorized as resistive loss and reactive loss. The former loss is caused by the
resistive component of the load and can’t be avoided and the other loss is caused by
the reactive component of the load and can be minimized or even avoided. In fact,
KW ( Active Power )
KVAR
( Reactive Power )
KVA ( Total Power )
Cos Teta
3
this study is more concerned on the reactive loss which come from circuit
capacitance and circuit inductance. For example, when a heavy inductive load is
connected to the grid, it means that a large positive reactive power component is
being added. And thereby increased the observed power ( S ). Such increased in
observed power can lead to several impact to the power system such are ;
(a) Increases losses due to reactive load current
(b) Increases in KVA demand
(c) Increases customer energy consumption
(d) Degrade voltage profile
(e) Reduce revenue.
Hence, there are several methods for this losses compensation. For example, by
improving power factor, installing capacitor bank , applying material selectivity and
FACT Device. In fact, studies have shown that when capacitors of appropriate size
are added to the grid at appropriate locations, the above mentioned losses can be
minimized by reducing the reactive power component, thereby reducing the observed
power demand [6 ]. Fortunately, the focus of this studies is to locate the optimal
location and size of the needed capacitor to be installed in the power grid in order to
reduce the unwanted power.
It goes without saying that, the most obvious power dissipated in transmission
lines are due to their internal electrical resistance which is called the technical losses
[10 ]. These losses are easy to simulate and calculate. In fact, computation tools for
calculating power flow and power losses in power systems have been developed for
some time. In this thesis, a simple power flow and power losses calculation is
simulated by a very helpful and effective software namely as Power-world Simulator
Version 14 ( Student Version ).
This user-friendly software is implemented and practically used to determine
not only the power losses at transmission lines but also to analyse the optimal
location of installing the capacitor banks in order to minimize the unwanted losses on
the 9 Bus power grid systems. Indeed, the losses are being analyzed by adding
capacitor bank to the affected Bus. The impact of adding capacitor bank is then
simulated by implementing the tools provided by Power-world simulator software.
The results of those simulations are recorded and being discussed in details on the
chapter of Data Analysis. By analyzing the gained data, not only , the optimal
location and size of the capacitor can be determined in order to minimize the power
4
losses of the system but also the percentage of power losses reductions can then be
calculated. Furthermore, in addition to that, this study also can predict the range of
the capacitor values in order to improve the demand power factor.
1.2 Motivation and problem statement
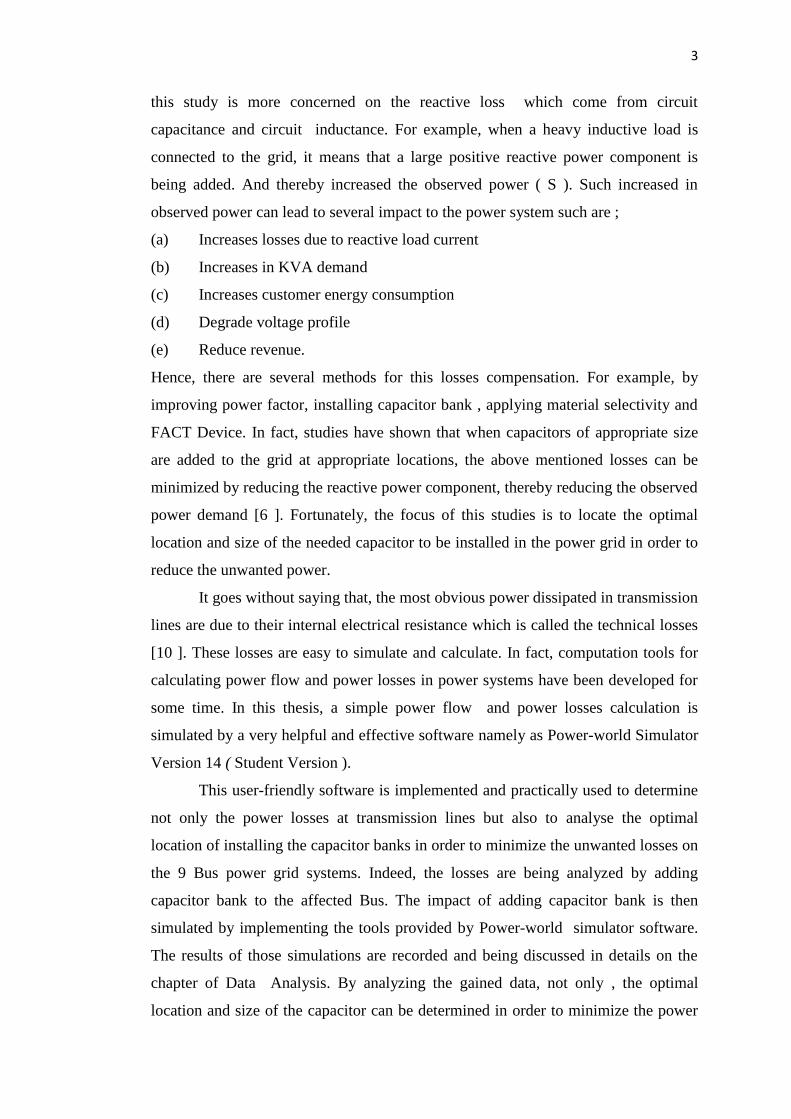
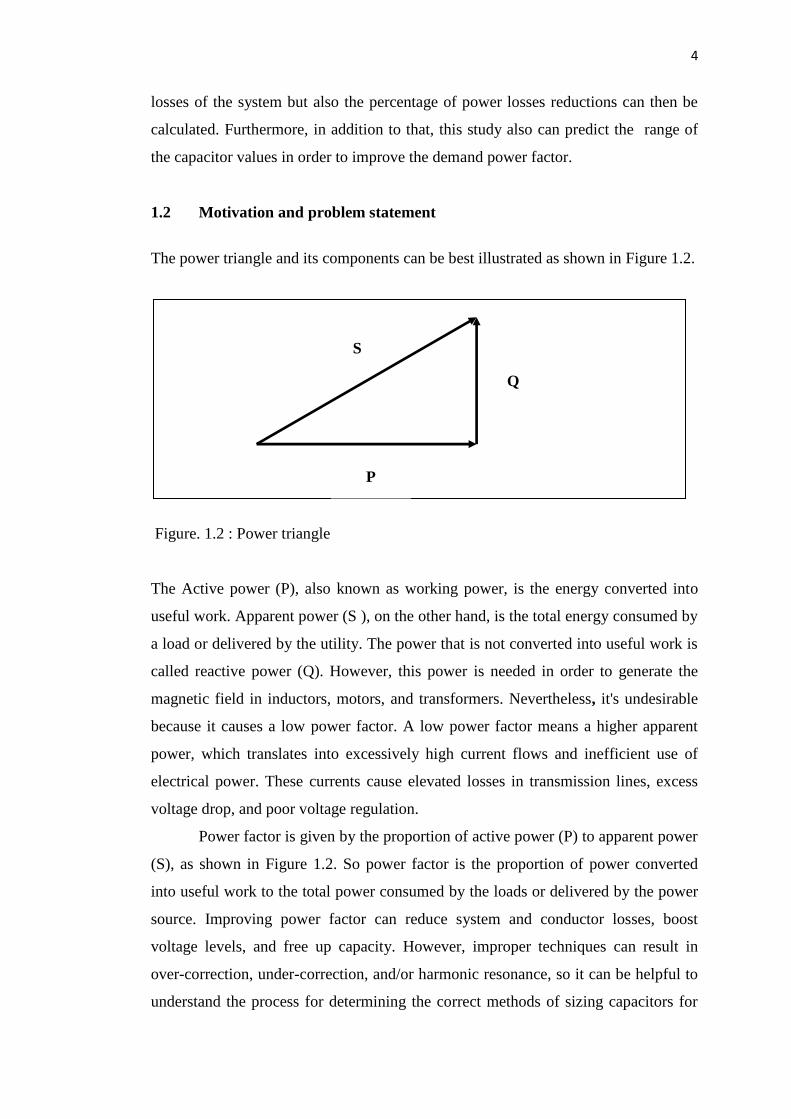
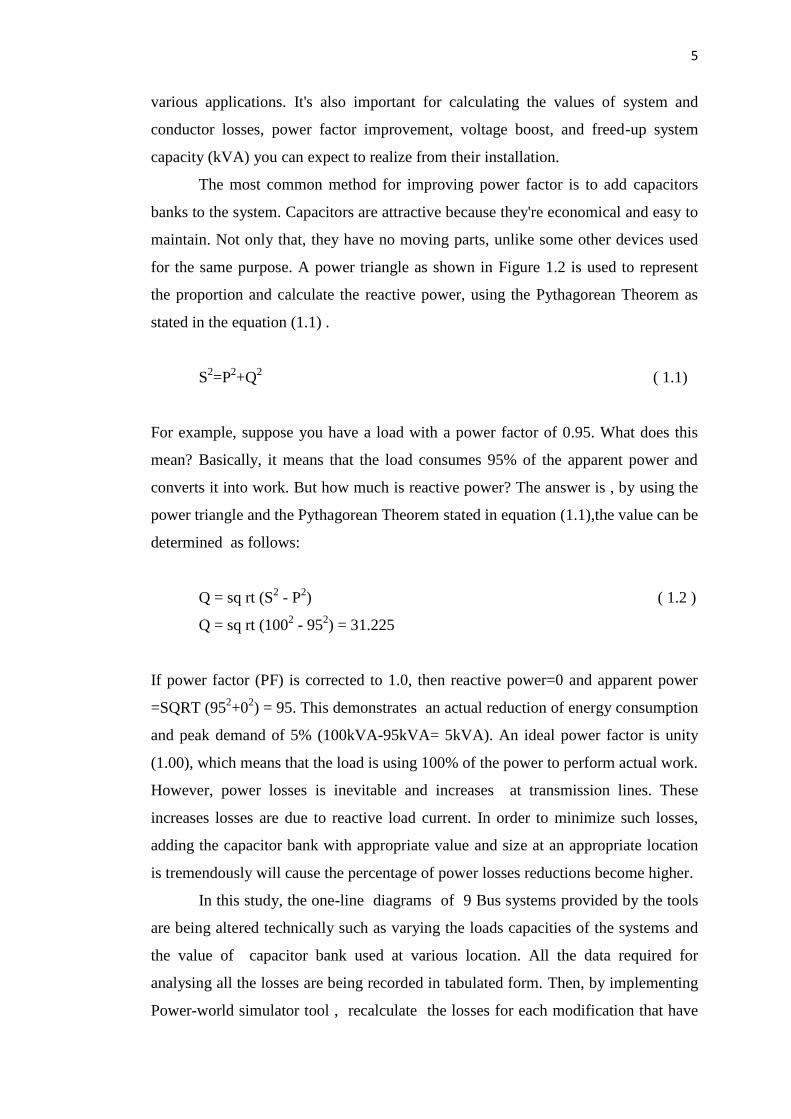
The power triangle and its components can be best illustrated as shown in Figure 1.2.
Figure. 1.2 : Power triangle
The Active power (P), also known as working power, is the energy converted into
useful work. Apparent power (S ), on the other hand, is the total energy consumed by
a load or delivered by the utility. The power that is not converted into useful work is
called reactive power (Q). However, this power is needed in order to generate the
magnetic field in inductors, motors, and transformers. Nevertheless, it's undesirable
because it causes a low power factor. A low power factor means a higher apparent
power, which translates into excessively high current flows and inefficient use of
electrical power. These currents cause elevated losses in transmission lines, excess
voltage drop, and poor voltage regulation.
Power factor is given by the proportion of active power (P) to apparent power
(S), as shown in Figure 1.2. So power factor is the proportion of power converted
into useful work to the total power consumed by the loads or delivered by the power
source. Improving power factor can reduce system and conductor losses, boost
voltage levels, and free up capacity. However, improper techniques can result in
over-correction, under-correction, and/or harmonic resonance, so it can be helpful to
understand the process for determining the correct methods of sizing capacitors for
S
Q
P
5
various applications. It's also important for calculating the values of system and
conductor losses, power factor improvement, voltage boost, and freed-up system
capacity (kVA) you can expect to realize from their installation.
The most common method for improving power factor is to add capacitors
banks to the system. Capacitors are attractive because they're economical and easy to
maintain. Not only that, they have no moving parts, unlike some other devices used
for the same purpose. A power triangle as shown in Figure 1.2 is used to represent
the proportion and calculate the reactive power, using the Pythagorean Theorem as
stated in the equation (1.1) .
S2=P
2+Q
2 ( 1.1)
For example, suppose you have a load with a power factor of 0.95. What does this
mean? Basically, it means that the load consumes 95% of the apparent power and
converts it into work. But how much is reactive power? The answer is , by using the
power triangle and the Pythagorean Theorem stated in equation (1.1),the value can be
determined as follows:
Q = sq rt (S2 - P
2) ( 1.2 )
Q = sq rt (1002 - 95
2) = 31.225
If power factor (PF) is corrected to 1.0, then reactive power=0 and apparent power
=SQRT (952+0
2) = 95. This demonstrates an actual reduction of energy consumption
and peak demand of 5% (100kVA-95kVA= 5kVA). An ideal power factor is unity
(1.00), which means that the load is using 100% of the power to perform actual work.
However, power losses is inevitable and increases at transmission lines. These
increases losses are due to reactive load current. In order to minimize such losses,
adding the capacitor bank with appropriate value and size at an appropriate location
is tremendously will cause the percentage of power losses reductions become higher.
In this study, the one-line diagrams of 9 Bus systems provided by the tools
are being altered technically such as varying the loads capacities of the systems and
the value of capacitor bank used at various location. All the data required for
analysing all the losses are being recorded in tabulated form. Then, by implementing
Power-world simulator tool , recalculate the losses for each modification that have
6
been done to the system in order to study the impact of adding the capacitor banks to
the power grid. The power flow and power losses calculation are recorded .The
analysis are done by considering the losses before installing the capacitor and after
installing the required capacitor to the grid. Technically, all the calculation and
analysis of power losses of the system will be done by using Power-world simulator
tool version 14 ( student version ).
1.3 Research objectives
There are several objectives that need to be completed at the end of this project.
(a) To determine the optimal location of Capacitor Banks in minimizing power
losses.
(b) To determine the appropriate size of the capacitor banks.
(c) To calculate the percentage of power losses reduction of the selected system.
(d) To estimate the suitable value of Kvar in order to get the desired power factor.
(e) To configure all the calculation in minimizing the power losses by applying
the tools that are provided by Power-world Version 14 ( Student version )
software.
1.4 Research scopes
This study will focus on the 9 Bus power grid system offered by the simulator tool.
The systems then, will be disturbed by introducing the heavy inductive load Kvar
demand by doubling the size of the loads capacity at the selected Bus. The study will
concentrate on the MW and Mvar Power Losses created at transmission lines.
Basically, power losses are caused by several effects such as copper loss, reactive
loss and dielectric loss. Hence, in this studies, such losses can only be minimized by
poowweerr ffaaccttoorr ccoorrrreeccttiioonn aanndd bbyy iinnssttaalllliinngg tthhee ccaappaacciittoorr bbaannkk aatt vvaarriioouuss ssiizzee aanndd
llooccaattiioonn ttoo tthhee ppoowweerr ggrriidd ssyysstteemm.. AAllll ccaallccuullaattiioonnss aanndd aannaallyyssiiss aarree bbeeiinngg pprraaccttiiccaallllyy
ddoonnee bbyy iimmpplleemmeennttiinngg tthhee Power-world simulator tool version 14 ( student Version ).
1.5 Research limitation
The following assumptions will been taken into account during simulation :

7
(a) The simulations experiment assumed perfect simulation
(b) Outside interference from other technologies are negligence.
(c) The values of the capacitor are randomly selected.
(d) The chosen bus to install the capacitor is based on the greatest losses shown by
the power world simulator.
1.6 Thesis outlines
This report is structured into five chapters.
Chapter 1 discusses the background of the research, the objectives of the
studies, the problem statements, the scope and limitation of the research and also the
expected outcomes gained from the studies.
Chapter 2 consists of the literature review of the previous researches and
findings related to the power losses minimization by capacitor installation.
Chapter 3 consists of all the research methodology that will be carried out
throughout the studies.
Chapter 4 consists of all data, analysis of the research and discussion of
thesis findings.
Chapter 5 consists of the conclusion and future work for the related studies.
8
CHAPTER 2
LITERATURE REVIEW
2.1 Intoduction
This chapter descibes some overview of power losses at power grid system. Many
researchers have done several studies regarding this power losses issues. In fact,
these issue will be discussed in detail in the following sub topics.
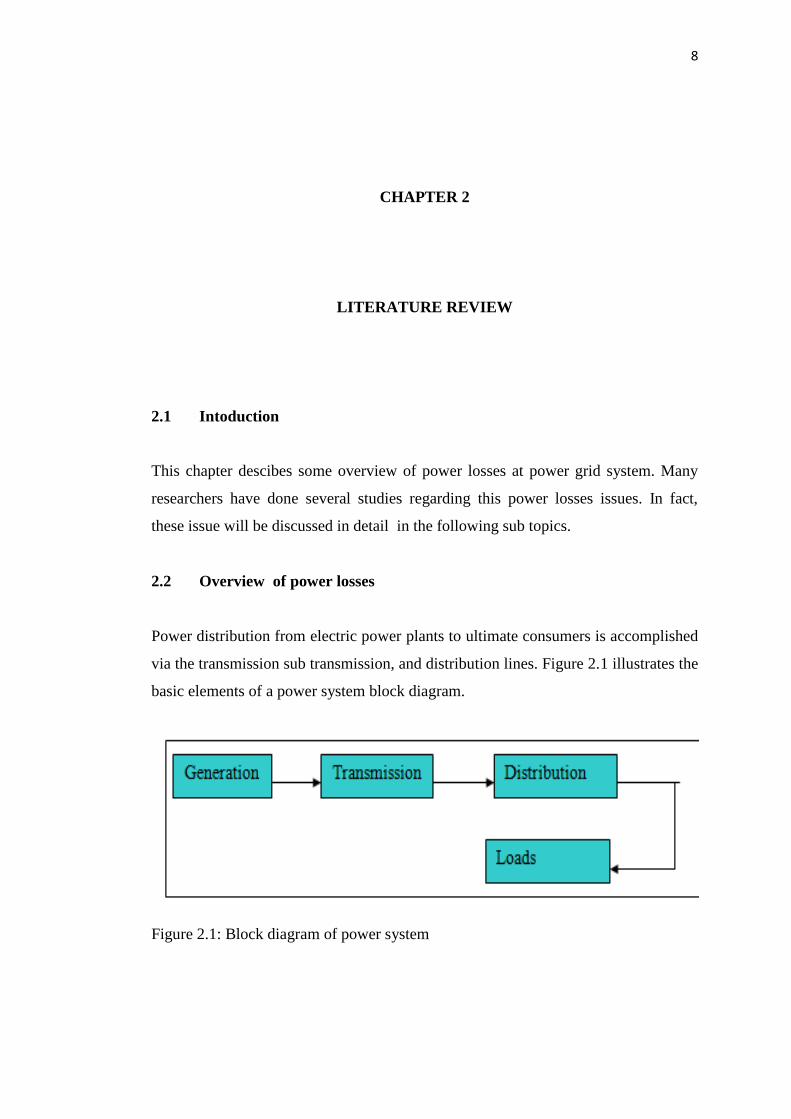
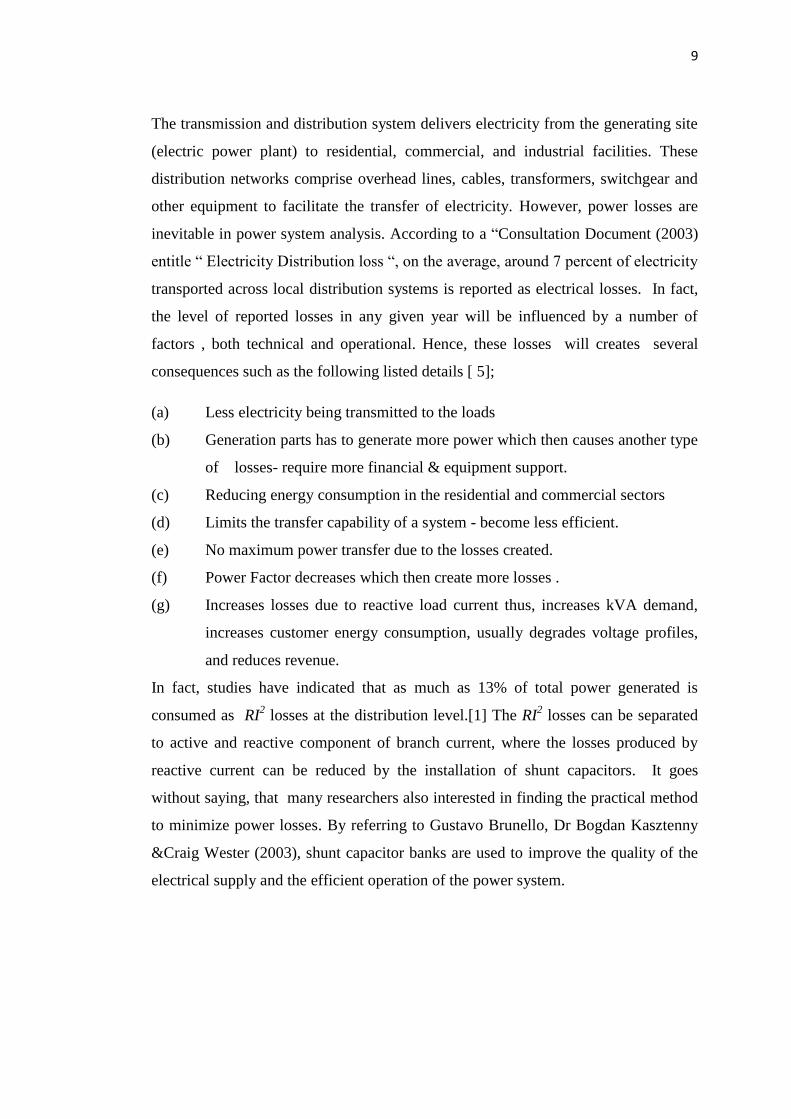
2.2 Overview of power losses
Power distribution from electric power plants to ultimate consumers is accomplished
via the transmission sub transmission, and distribution lines. Figure 2.1 illustrates the
basic elements of a power system block diagram.
Figure 2.1: Block diagram of power system
9
The transmission and distribution system delivers electricity from the generating site
(electric power plant) to residential, commercial, and industrial facilities. These
distribution networks comprise overhead lines, cables, transformers, switchgear and
other equipment to facilitate the transfer of electricity. However, power losses are
inevitable in power system analysis. According to a “Consultation Document (2003)
entitle “ Electricity Distribution loss “, on the average, around 7 percent of electricity
transported across local distribution systems is reported as electrical losses. In fact,
the level of reported losses in any given year will be influenced by a number of
factors , both technical and operational. Hence, these losses will creates several
consequences such as the following listed details [ 5];
(a) Less electricity being transmitted to the loads
(b) Generation parts has to generate more power which then causes another type
of losses- require more financial & equipment support.
(c) Reducing energy consumption in the residential and commercial sectors
(d) Limits the transfer capability of a system - become less efficient.
(e) No maximum power transfer due to the losses created.
(f) Power Factor decreases which then create more losses .
(g) Increases losses due to reactive load current thus, increases kVA demand,
increases customer energy consumption, usually degrades voltage profiles,
and reduces revenue.
In fact, studies have indicated that as much as 13% of total power generated is
consumed as RI2 losses at the distribution level.[1] The RI
2 losses can be separated
to active and reactive component of branch current, where the losses produced by
reactive current can be reduced by the installation of shunt capacitors. It goes
without saying, that many researchers also interested in finding the practical method
to minimize power losses. By referring to Gustavo Brunello, Dr Bogdan Kasztenny
&Craig Wester (2003), shunt capacitor banks are used to improve the quality of the
electrical supply and the efficient operation of the power system.
10
2.3 Optimal location of capacitor bank
Commonly, the shunt capacitors are used to supply a capacitive type-Leading VAR
reactive power to the AC Power system at the point of connection for several
advantages such are ;
(a) To reduce the lagging component of the circuit current
(b) To increase the voltage of the load bus
(c) To improve bus-voltage regulation and /or power factor
(d) To reduce transmission losses and
(e) To reduce Electricity Billing cost based on KVA Demand [1].
In addition to that, capacitors are widely used in distribution systems to reduce
energy and peak demand losses, release the KVA capacities of distribution apparatus
and to maintain a voltage profile within permissible limits. The power capacitor can
be considered to be a VAR-GEN (reactive power Source), since it actually supplies
needed-magnetizing current requirements for inductive loads.[3] The fundamental
function of power capacitor is to provide needed reactive power compensation.
Furthermore, the objective of optimal capacitor placement problem is to determine
the size, type, and location of capacitor banks to be installed on radial distribution
feeders to achieve positive economic response. The economic benefits obtained from
the loss reduction weighted against capacitors costs while keeping the operational
and power quality constraints within required limits.
The capacitor location or placement for low voltage systems determines
capacitor type, size, location and control schemes. The optimal capacitor placement
is generally a hard combinatorial optimization problem that can be formulated as a
nonlinear/search minimization problem.[6] Almost all the methods to solve capacitor
placement problems are based on the historical data of the load models and
associated cost of the energy and the cost of capacitor banks. The cost $/Kvar for
power savings and losses (power losses/energy losses) . However, historical data and
load models are uncertain and may change in reality. In general, capacitor placement
problems can be solved in two steps.[8] The first step is the use of load flow model
and find the V,P,Q at all the buses and also the feeder losses . The second step is to
minimize the cost function-Jo-min - subject to constraints, like practical limits of
voltage and capacitor size.
11
Many of the previous strategies for capacitor allocation in the literature are
also limited for the application to planning, expansion or operation of distribution
systems.[6 ] Very few of these capacitor allocation techniques have the flexibility of
being applicable to more than one of the above problems. Hence, this paper presents
a powerWorld simulation approach to determine the suitable locations for capacitor
placement and the sizing of the capacitor. This approach has the versatility of being
applied to the planning, expansion, and operation studies of distribution systems. The
proposed method was tested on electrical distribution systems consisting of 9 buses
power grid system.
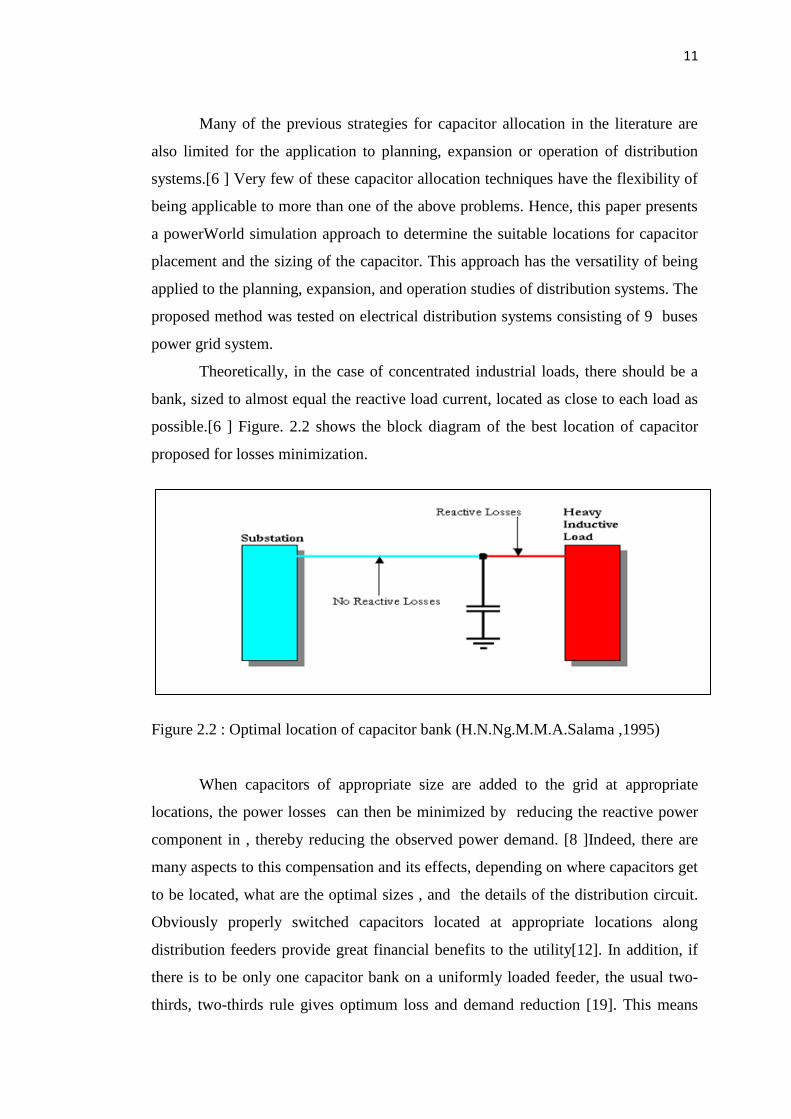
Theoretically, in the case of concentrated industrial loads, there should be a
bank, sized to almost equal the reactive load current, located as close to each load as
possible.[6 ] Figure. 2.2 shows the block diagram of the best location of capacitor
proposed for losses minimization.
Figure 2.2 : Optimal location of capacitor bank (H.N.Ng.M.M.A.Salama ,1995)
When capacitors of appropriate size are added to the grid at appropriate
locations, the power losses can then be minimized by reducing the reactive power
component in , thereby reducing the observed power demand. [8 ]Indeed, there are
many aspects to this compensation and its effects, depending on where capacitors get
to be located, what are the optimal sizes , and the details of the distribution circuit.
Obviously properly switched capacitors located at appropriate locations along
distribution feeders provide great financial benefits to the utility[12]. In addition, if
there is to be only one capacitor bank on a uniformly loaded feeder, the usual two-
thirds, two-thirds rule gives optimum loss and demand reduction [19]. This means
12
that the bank kVAr size should be two-thirds of the heavy load kVAr as measured at
the substation, and the bank should be located two-thirds the length of the feeder
from the substation. If the objective is voltage control the bank should be farther
from the substation. With several banks on a uniformly loaded feeder, the total
capacitor kVAr can more closely match the total load kVAr. Depending on the type
of the switching control used, multiple banks on a feeder can lead to ‘pumping’ as
the controls affect the operating points of each other[ 10]. Usually no more than three
or four banks are used per feeder. In fact, in the case of concentrated industrial loads,
there should be a bank, sized to almost equal the reactive load current, located as
close to each load as possible.[6 ]
2.4 Power factor improvement
The importance of installing the capacitor is also to improve the power factor. The
solution to improve the power factor is to add power factor correction capacitors to
the plant power distribution system. They act as reactive power generators, and
provide the needed reactive power to accomplish kW of work. This reduces the
amount of reactive power, and thus total power, generated by the utilities.[4 ]
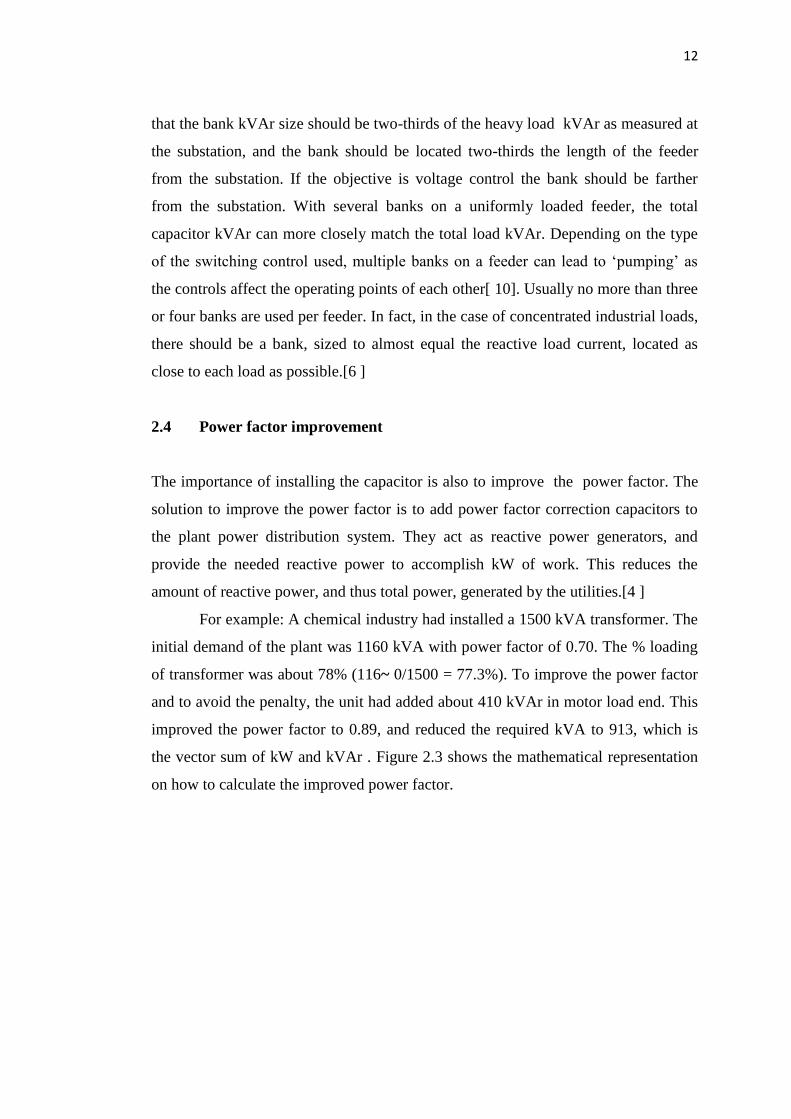
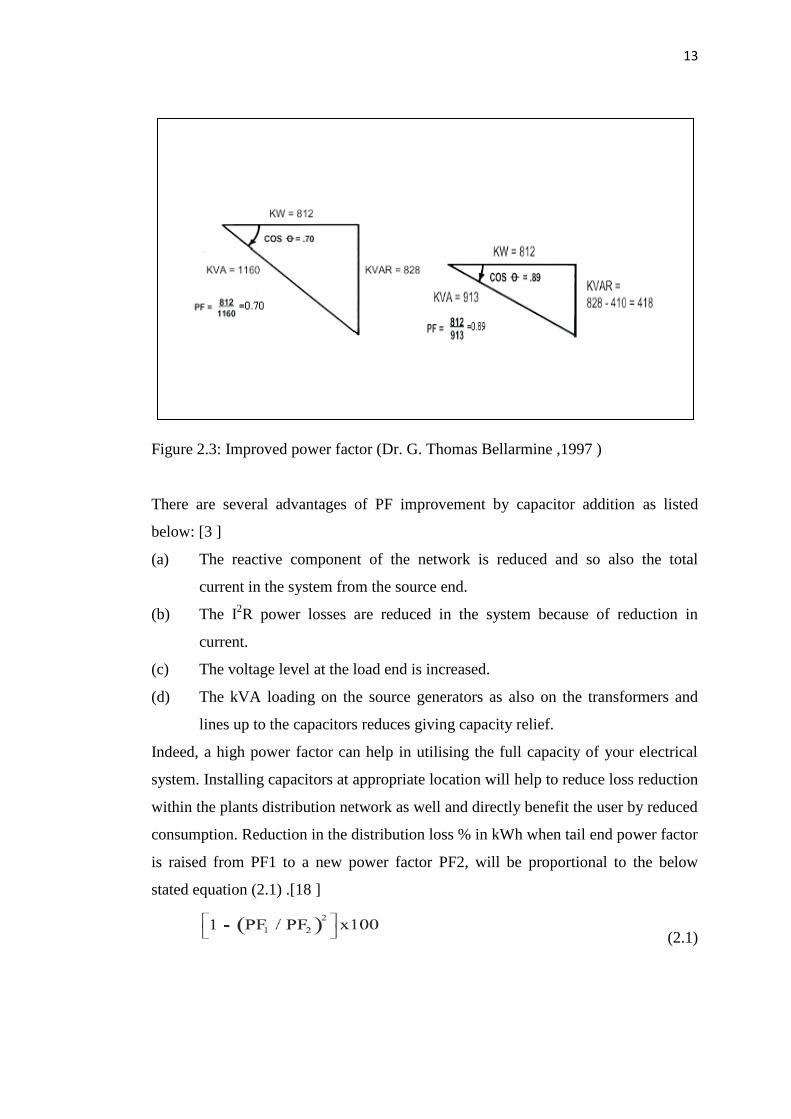
For example: A chemical industry had installed a 1500 kVA transformer. The
initial demand of the plant was 1160 kVA with power factor of 0.70. The % loading
of transformer was about 78% (116~ 0/1500 = 77.3%). To improve the power factor
and to avoid the penalty, the unit had added about 410 kVAr in motor load end. This
improved the power factor to 0.89, and reduced the required kVA to 913, which is
the vector sum of kW and kVAr . Figure 2.3 shows the mathematical representation
on how to calculate the improved power factor.
13
Figure 2.3: Improved power factor (Dr. G. Thomas Bellarmine ,1997 )
There are several advantages of PF improvement by capacitor addition as listed
below: [3 ]
(a) The reactive component of the network is reduced and so also the total
current in the system from the source end.
(b) The I2R power losses are reduced in the system because of reduction in
current.
(c) The voltage level at the load end is increased.
(d) The kVA loading on the source generators as also on the transformers and
lines up to the capacitors reduces giving capacity relief.
Indeed, a high power factor can help in utilising the full capacity of your electrical
system. Installing capacitors at appropriate location will help to reduce loss reduction
within the plants distribution network as well and directly benefit the user by reduced
consumption. Reduction in the distribution loss % in kWh when tail end power factor
is raised from PF1 to a new power factor PF2, will be proportional to the below
stated equation (2.1) .[18 ]
(2.1)
14
2.5 Calculation of KVar demand
Determining the capacitor kVAR requirement is also vital in this studies in order to
ensure that power system is operating at optimal efficiency. Generally, to calculate
the capacity, in kVAR or MVAR of the capacitor bank needed to improve power
factor from pf1 (actual power factor) to pf2 (target power factor) can be done by using
the following equation (2.2).[ 18]
Qcap = P x [(sq rt (1-pf12)/pf1) - (sq rt (1-pf2
2)/pf2)] (2.2)
The above mentioned formula can only be used if the active power is constant. But
when active power isn't constant, you must consider other factors. You should
consider the average value of the active power (P) as well as the average power
factor in the facility[ 18]. Using these two values, you can calculate the capacitor
bank for the average operating condition. You should also consider the worst case
operating conditions (highest active power and lowest power factor). All the three
mentioned methods are being discussed in detail as the following .
a) Calculating the kVAR requirement based on maximum active power.
Looking at the preceding equation, you can see that either of two factors can cause
the calculated value of reactive power of the capacitor bank to be less than the value
required: The active power (P) is higher than the average value used in equation
(2.2). The power factor (pf1) is lower than the average value used in the given
equation ( 2.2). Taking this into account, you need to re-calculate the reactive power
requirement of the capacitor bank using the maximum active power in the system
and the power factor measured under this operating condition. Equation (2.2) can
now be expressed as:
Qcap = Pmax [(sq rt (1 - pf12
-Pmax)/pf1-Pmax) - (sq rt (1 - pf22)/pf2)] ( 2.3)
where Pmax is the maximum active power in the facility and pf1-Pmax is the power
factor in the facility when the active power is Pmax [18 ] . If the reactive power
15
requirement for the capacitor bank, as calculated using equation (2.3), is greater
than the average value previously calculated using equation 1, then the capacitor
bank sized for the average value won't be sufficient for compensating the reactive
power of the load when the active power reaches its maximum value.[6 ] As a result,
the power factor in the facility won't reach the target value. In this case, you should
select the capacitor based on the maximum active power and the actual power factor
under that operating condition
b) Calculating the kVAR requirement based on minimum power factor.
The next consideration is to calculate the capacitor bank needed when the power
factor is minimum. The calculation can be done by using the following equation
(2.4).
Qcap = Ppf1min [(sq rt (1 - pf12
-min)/pf1min) - (sq rt (1 - pf22)/pf2)] (2.4)
where pf1min is the minimum power factor measured in the facility and Ppf1min is the
active power when the power factor is pf1min.If the two previously calculated values
(average and maximum active power conditions) are less than the value calculated
using equation (2.3), the capacitor bank kVAR previously determined using equation
(2.1) or equation (2.2) won't be sufficient to compensate for the reactive power of the
load when the power factor reaches its minimum value, and the power factor in the
facility won't reach the target value. In this case, you should select the capacitor
based on the minimum power factor as calculated in equation (2.4). Generally, the
best value of capacitance will be the greater of all calculations above , because the
capacitor bank will have the capacity for compensating for the maximum active
power condition as well as minimum power factor condition. Automatic capacitor
banks can ensure high power factor under widely varying operating conditions.[ 3]
c) Direct relation for capacitor sizing.
equation (2.5 ) states the formula of the kVAr Rating is equal to :
16
kVAR rating = kW [tan φ1 – tan φ2] (2.5)
Where kVAr rating is the size of the capacitor needed, kW is the average power
drawn, tan φ1 is the trigonometric ratio for the present power factor, and tan φ2 is the
trigonometric ratio for the desired PF. Equation (2.6) illustrates the meaning of all
the angles.[3]
φ1 = Existing (Cos-1 PF1) and φ2 = Improved (Cos-1 PF2) (2.6)
d) Alternatively the table 2.1 can be used for capacitor sizing.
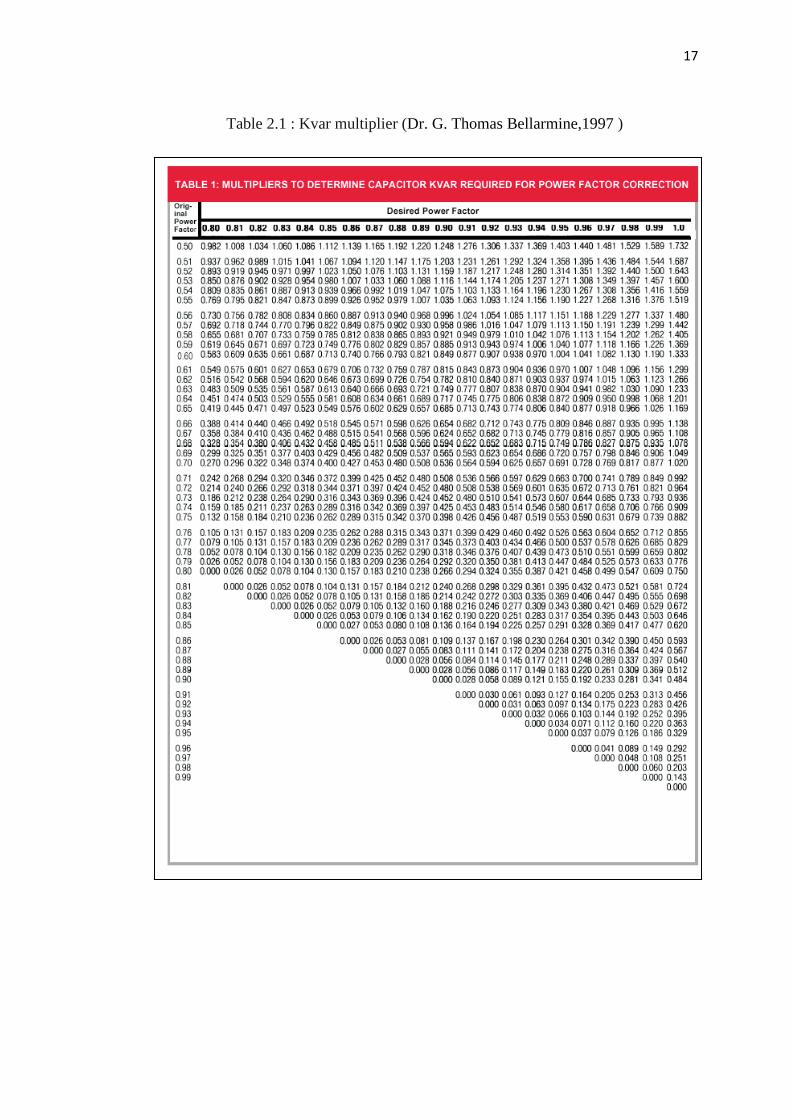
The tabulated data shown in Table 2.1 are the multiplication factors which are to be
multiplied with the input power (kW) to give the kVAr of capacitance required to
improve present power factor to a new desired power factor.[ 3 ]. Generally, the
procedure of using Table 2.1 are as follows:[22]
(a) Locate 0.72 (original power factor) in column (1).
(b) Read across desired power factor to 0.95 column. We find 0.635 multiplier
(c) Multiply 627 (average kW) by 0.635 = 398 kVAr.
(d) Install 400 kVAr to improve power factor to 95%.
17
Table 2.1 : Kvar multiplier (Dr. G. Thomas Bellarmine,1997 )
Table 1.0 : Multiplication factor of capacitor
18
CHAPTER 3
RESEARCH METHODOLOGY
3.1 Introduction
The chapter focuses on how to analyse power losses by using powerworld simulator.
It also describes general step by step methodology , designing stage , important
parameters and assumptions that are considered. The research methodology of this
studies can be illustrated as shown in Figure 3.1
3.2 Research Methodology
The project started with the initiative in drawing one-line diagram of 9 buses power
grid system with certain rated value of components needed as suggested by the
simulator tool. It consists of three units of generator and four units of load busses. All
the drawings are being done by applying the Powerworld tools. Upon completion,
record all the data regarding the Voltage (pu), Mvar losses , MW and MVA at each
busses by using Powerworld simulator version 14 .Then calculate theoretically, the
value of power factor of each busses for the whole system. As a result , the bus that
shows the greatest Mvar losses can be determined. In other words, these are the
results for the system that are originally in stable condition. The project also being
further analysed by categorizing the analysis by cases.
19
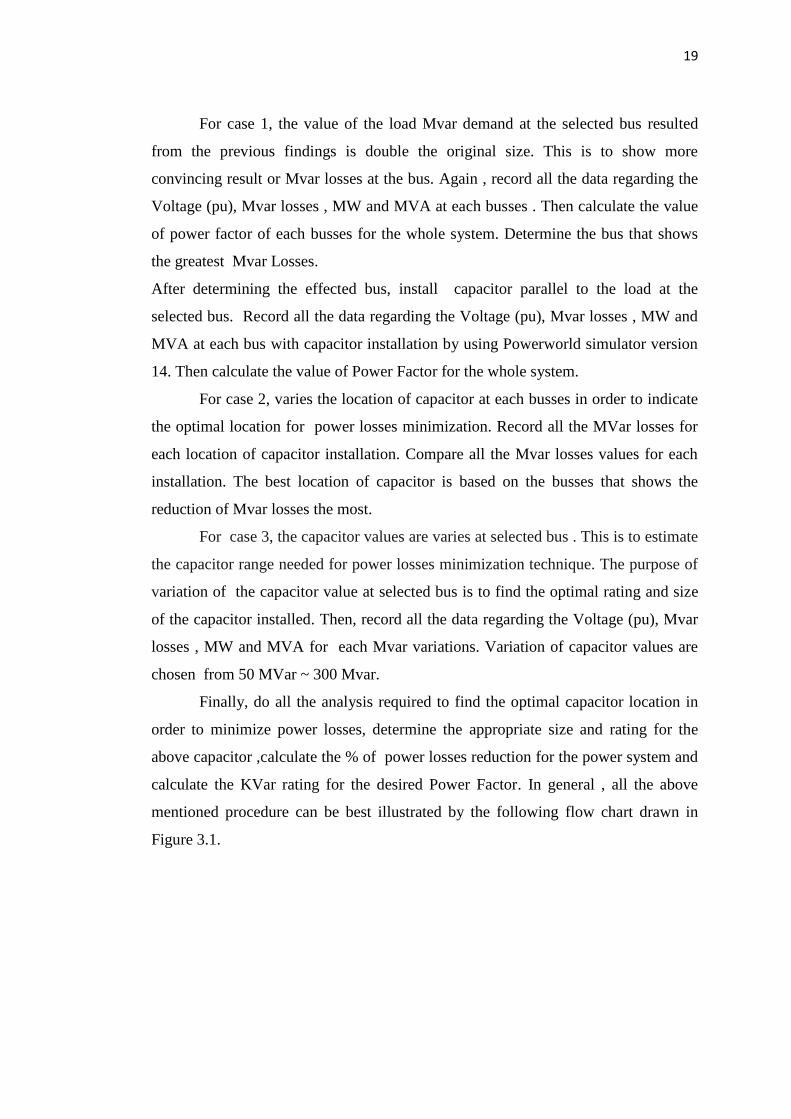
For case 1, the value of the load Mvar demand at the selected bus resulted
from the previous findings is double the original size. This is to show more
convincing result or Mvar losses at the bus. Again , record all the data regarding the
Voltage (pu), Mvar losses , MW and MVA at each busses . Then calculate the value
of power factor of each busses for the whole system. Determine the bus that shows
the greatest Mvar Losses.
After determining the effected bus, install capacitor parallel to the load at the
selected bus. Record all the data regarding the Voltage (pu), Mvar losses , MW and
MVA at each bus with capacitor installation by using Powerworld simulator version
14. Then calculate the value of Power Factor for the whole system.
For case 2, varies the location of capacitor at each busses in order to indicate
the optimal location for power losses minimization. Record all the MVar losses for
each location of capacitor installation. Compare all the Mvar losses values for each
installation. The best location of capacitor is based on the busses that shows the
reduction of Mvar losses the most.
For case 3, the capacitor values are varies at selected bus . This is to estimate
the capacitor range needed for power losses minimization technique. The purpose of
variation of the capacitor value at selected bus is to find the optimal rating and size
of the capacitor installed. Then, record all the data regarding the Voltage (pu), Mvar
losses , MW and MVA for each Mvar variations. Variation of capacitor values are
chosen from 50 MVar ~ 300 Mvar.
Finally, do all the analysis required to find the optimal capacitor location in
order to minimize power losses, determine the appropriate size and rating for the
above capacitor ,calculate the % of power losses reduction for the power system and
calculate the KVar rating for the desired Power Factor. In general , all the above
mentioned procedure can be best illustrated by the following flow chart drawn in
Figure 3.1.
20
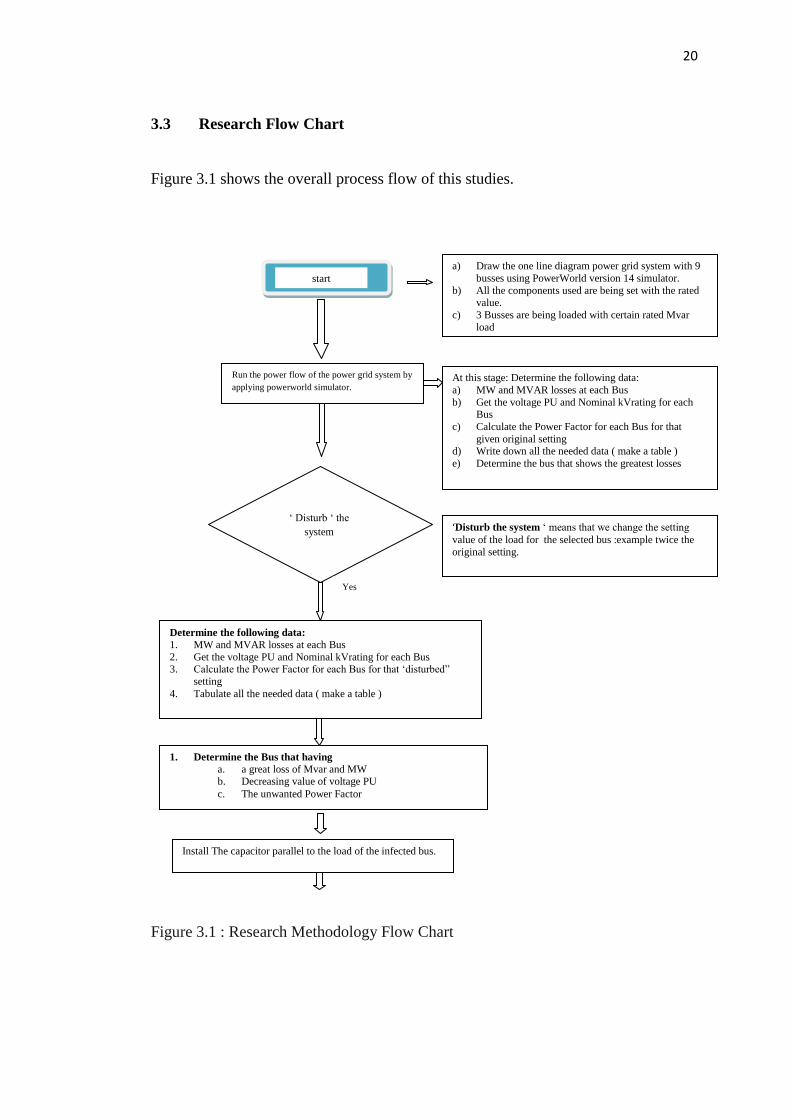
3.3 Research Flow Chart
Figure 3.1 shows the overall process flow of this studies.
Figure 3.1 : Research Methodology Flow Chart
start
Run the power flow of the power grid system by
applying powerworld simulator. At this stage: Determine the following data:
a) MW and MVAR losses at each Bus
b) Get the voltage PU and Nominal kVrating for each Bus
c) Calculate the Power Factor for each Bus for that
given original setting d) Write down all the needed data ( make a table )
e) Determine the bus that shows the greatest losses
‘ Disturb ‘ the
system ‘Disturb the system ‘ means that we change the setting
value of the load for the selected bus :example twice the
original setting.
Yes
Determine the following data:
1. MW and MVAR losses at each Bus
2. Get the voltage PU and Nominal kVrating for each Bus 3. Calculate the Power Factor for each Bus for that ‘disturbed”
setting
4. Tabulate all the needed data ( make a table )
1. Determine the Bus that having
a. a great loss of Mvar and MW b. Decreasing value of voltage PU
c. The unwanted Power Factor
a) Draw the one line diagram power grid system with 9
busses using PowerWorld version 14 simulator.
b) All the components used are being set with the rated value.
c) 3 Busses are being loaded with certain rated Mvar
load
Install The capacitor parallel to the load of the infected bus.
21
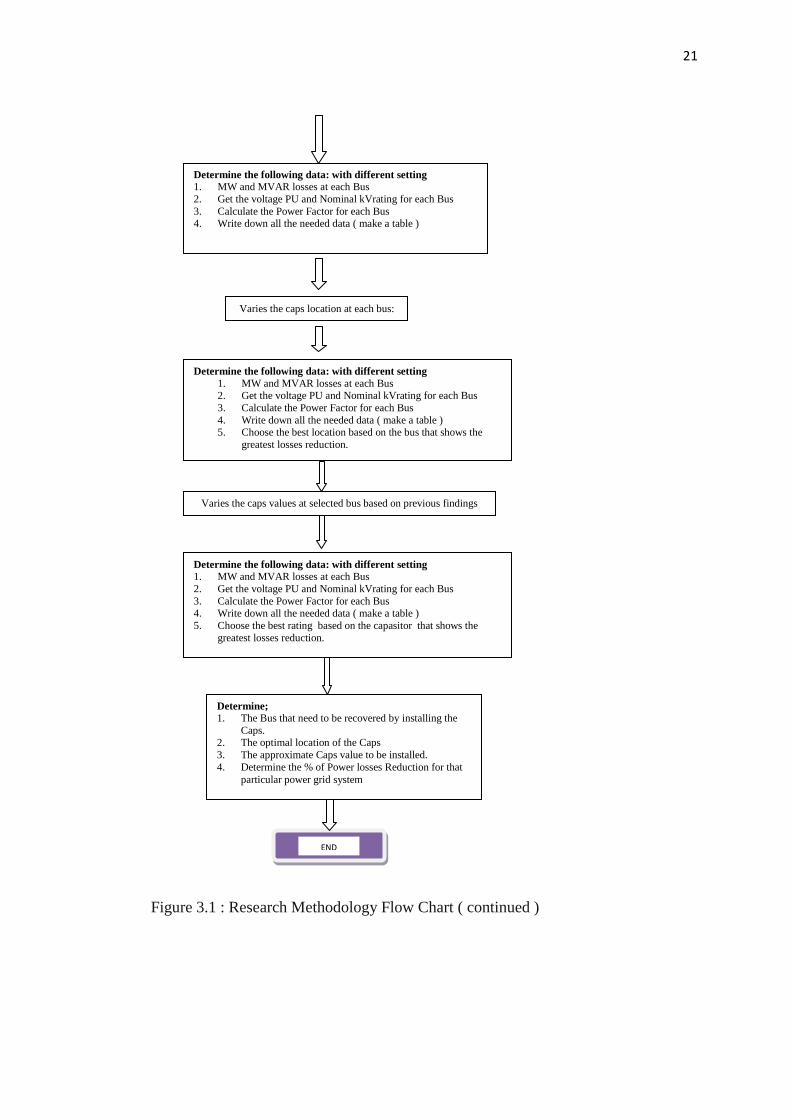
Figure 3.1 : Research Methodology Flow Chart ( continued )
Determine the following data: with different setting
1. MW and MVAR losses at each Bus
2. Get the voltage PU and Nominal kVrating for each Bus
3. Calculate the Power Factor for each Bus 4. Write down all the needed data ( make a table )
Varies the caps location at each bus:
Determine;
1. The Bus that need to be recovered by installing the
Caps. 2. The optimal location of the Caps
3. The approximate Caps value to be installed.
4. Determine the % of Power losses Reduction for that
particular power grid system
END
Determine the following data: with different setting
1. MW and MVAR losses at each Bus 2. Get the voltage PU and Nominal kVrating for each Bus
3. Calculate the Power Factor for each Bus
4. Write down all the needed data ( make a table ) 5. Choose the best location based on the bus that shows the
greatest losses reduction.
Varies the caps values at selected bus based on previous findings
Determine the following data: with different setting
1. MW and MVAR losses at each Bus
2. Get the voltage PU and Nominal kVrating for each Bus
3. Calculate the Power Factor for each Bus
4. Write down all the needed data ( make a table )
5. Choose the best rating based on the capasitor that shows the
greatest losses reduction.
22
CHAPTER 4
RESULTS AND DISCUSSION
4.1 Introduction
This chapter describes in details what are the findings outlined for this project. It
also discuses thouroughly the meaning of all the findings.
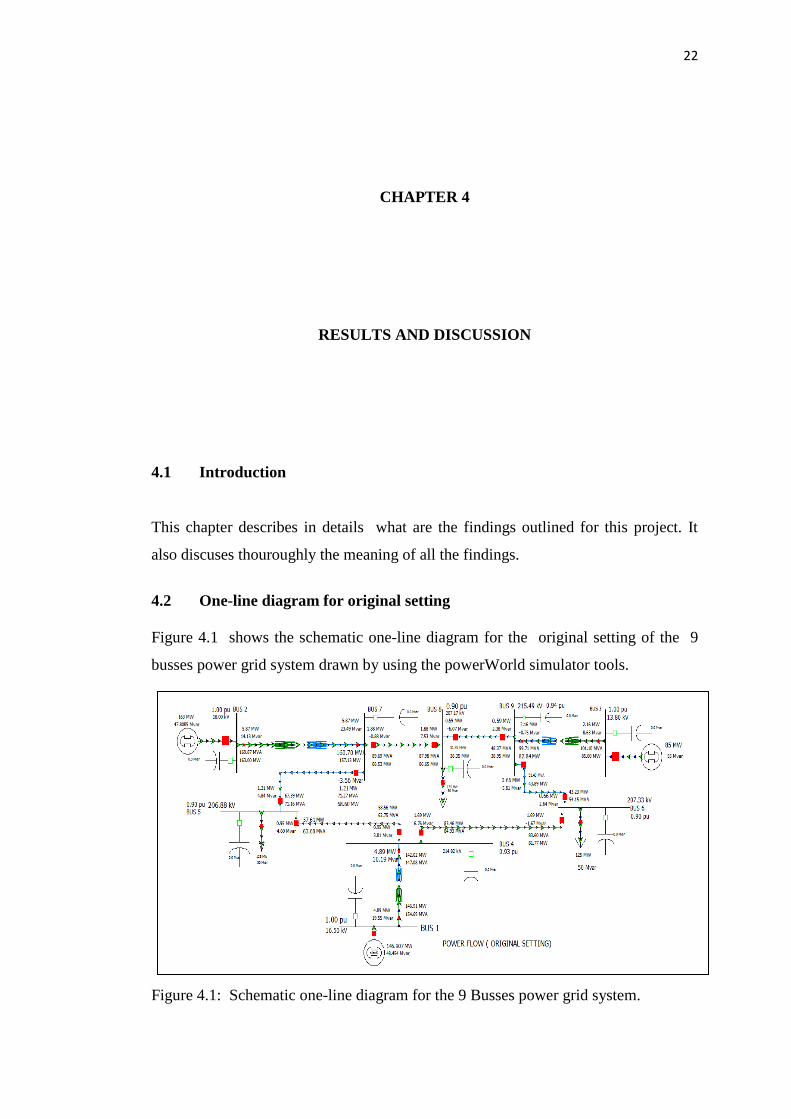
4.2 One-line diagram for original setting
Figure 4.1 shows the schematic one-line diagram for the original setting of the 9
busses power grid system drawn by using the powerWorld simulator tools.
Figure 4.1: Schematic one-line diagram for the 9 Busses power grid system.
23
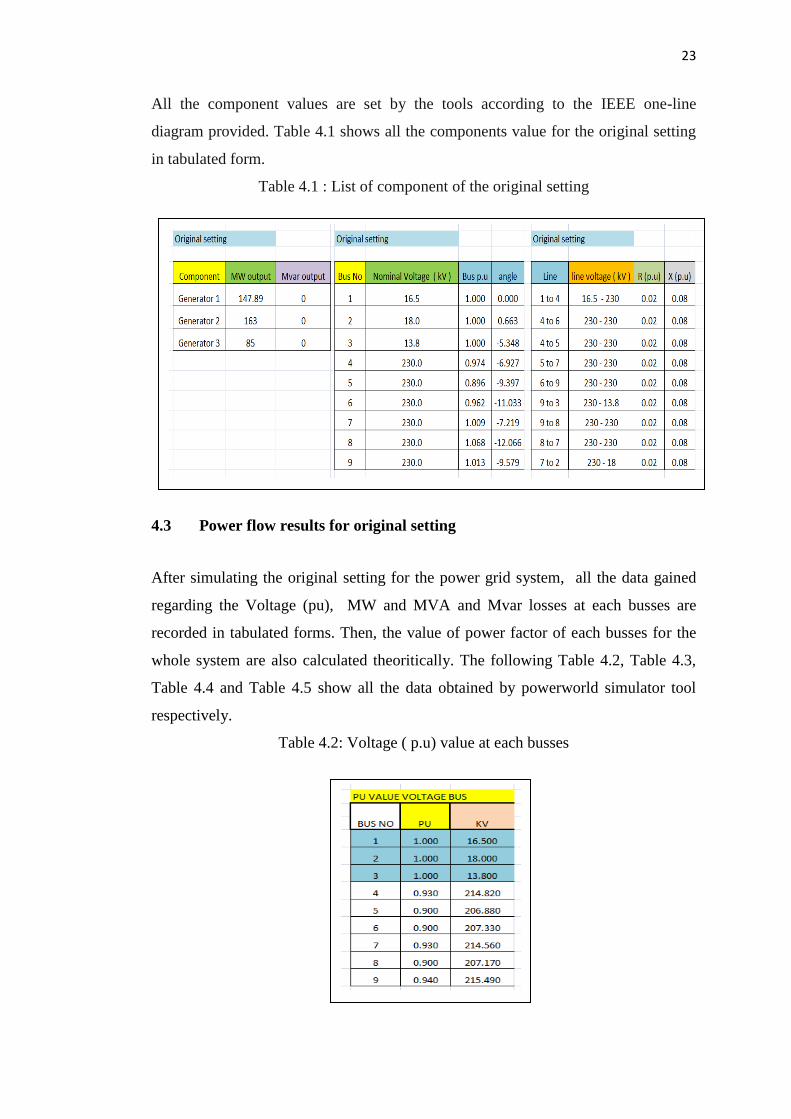
All the component values are set by the tools according to the IEEE one-line
diagram provided. Table 4.1 shows all the components value for the original setting
in tabulated form.
Table 4.1 : List of component of the original setting
4.3 Power flow results for original setting
After simulating the original setting for the power grid system, all the data gained
regarding the Voltage (pu), MW and MVA and Mvar losses at each busses are
recorded in tabulated forms. Then, the value of power factor of each busses for the
whole system are also calculated theoritically. The following Table 4.2, Table 4.3,
Table 4.4 and Table 4.5 show all the data obtained by powerworld simulator tool
respectively.
Table 4.2: Voltage ( p.u) value at each busses
24
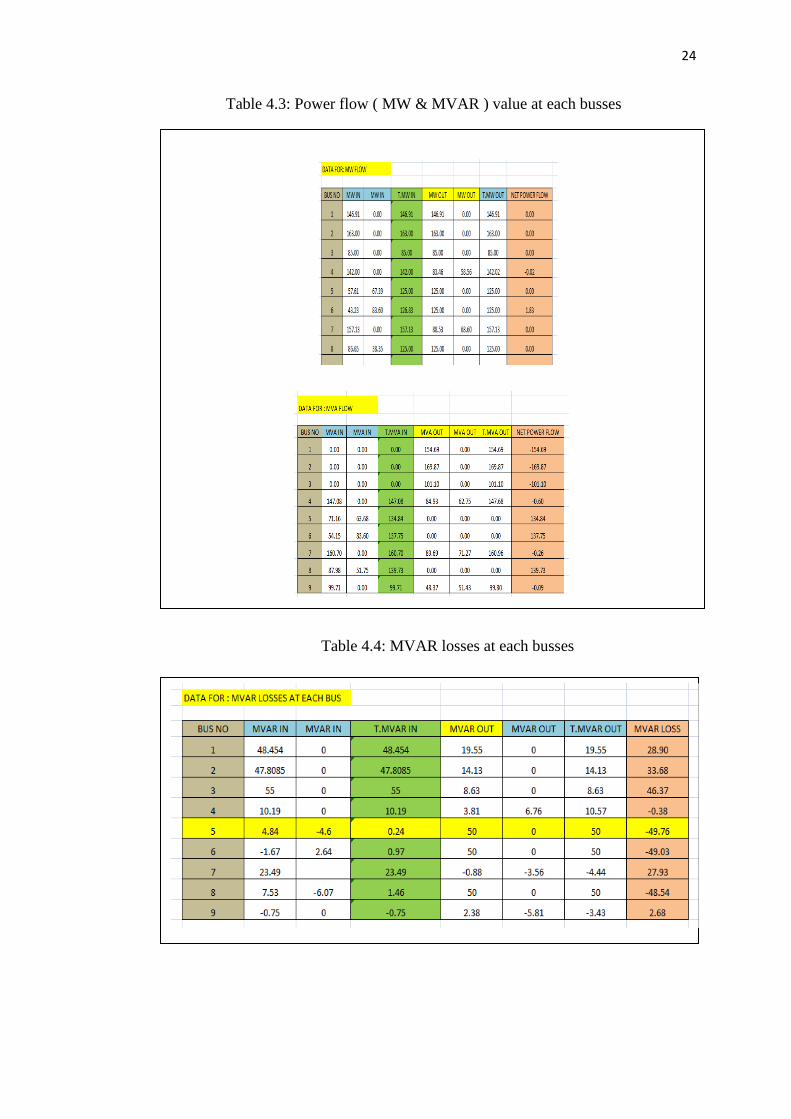
Table 4.3: Power flow ( MW & MVAR ) value at each busses
Table 4.4: MVAR losses at each busses
50
REFERENCES
[1] IEEE standards (2002). IEEE Standard for Shunt Power Capacitor. 18.
[2] M.H.Shwehdi and M.R.Sultan. Power Factor Correction Capacitors;
Essentials and Cautions. IEEE Power Engineering Society Summer Meeting
2000, Vol.3, pp.1317-1322.
[3] S.W.Cichanowaki & G.R. Newcomb.(1991). Power Capacitors, Electrical
Electronics Insulation .Proceedings of Conference of the 20th Boston '91
EEIC/ICWA Exposition .
[4] Dr. G. Thomas Bellarmine.(1997). Optimum Series Compensated High
Voltage Transmission Lines, Southeastcon '97 .Proceeding of Engineering
New Century.:IEEE, P307-309.
[5] Ramon A. Callego, Alcir Jose Monticelli & Ruben Romero.(2001). Optimal
Capacitor Placement in Radial Distribution Networks. IEEE Transactions on
power systems, Vol.16, No.4.
[6] H.N.Ng.M.M.A.Salama.(1995).Fuzzy Optimal Capacitor Sizing and
Placement. Canadian Conference on Electrical and Computer Engineering
Vol.2(5-8). P680-683
[7] A.M.Sharaf & S.T. Ibrahim.(1996). Optimal capacitor placement in
distribution networks. Electric Power System Research 37,pp. 181-187 .
[8] Songur, M and Ercan,B. POWERHU- A PC Based Electric Power System
Software Package For Electric Power System Courses,Nasar: IEEE. 1997.
[9] Hadi Saadat.(1991). Power System Analysis. New York: McGraw-
Hill.pp.142 446.
[10] Asmarashid, Erwan, Kok Boon Ching, Shamsul Aizam & Zarafi .
(2006).Electric Power System. 1st.ed. Kolej Universiti Teknologi Tun
Hussein Onn.: pp.81-199.
[11] Grainger,J.J. & Stevenson, W.D.(1994). Power System Analysis. Singapore:
McGraw- Hill.pp.329-337.
51
[12] D Goldberg .(1989). Genetic Algorithm in Search, Optimization and Machine
Learning. New York: Addison Wesley.
[13] B. Baran, J. Vallejos, R. Ramos & U. Fernandez.(2001). Reactive Power
Compensation using a Multi-objective Evolutionary Algorithm. IEEE Porto
Power Tech Conference, Porto, Portugal :IEEE.
[14] J.T. Ma &L.L. Lai. (1996).Evolutionary Programming Approach to Reactive
Power Planning. IEE Proceedings - Generation, Transmission,
Distribution:IEEE,Vol 143, No. 4.
[15] John E. Harder.(1990). Developments in Capacitor Protection. Proceedings
of the 11th IEEE/PES Transmission and Distribution Conference and
Exposition, New Orleans, Louisiana:IEEE.
[16] John Grainger, William Stevenson, Williiam Stevenson, Jr. &
Stevenson.(1994). Power System Analysis. McGraw-Hill Companies.
[17] Allen J. Wood &Bruce F. Wollenberg.(1996). Power Generation , Operation,
and Control:Wiley, John & Sons.
[18] Bergen, Arthur R. / Vittal, Vijay Bergen, Arthur R. / Vittal &Vijay.(1999).
Power System Analysis: Pearson.
[19] Prabha Kundur &P. Kundur.(1994). Power System Stability and Control.:
McGraw-Hill Companies.
[20] ANSI/IEEE Standard (1992). IEEE Standard for Shunt Power Capacitors.18.
[21] John Grainger & William Stevenson, Jr.(1994).Power System Analysis.
McGraw-Hill Companies.
[22] D. P. Kothari & I. J. Nagrath.(1994).Modern Power System Analysis, Tata
McGraw Hill Publishing Co. Ltd..New Delhi.
[23] Hadi Saadat.(2002). Power System Analysis. Tata McGraw Hill Publishing
Co. Ltd.. NewDelhi.
[24] Nasser D.Tleis.(2008). Power Systems Modelling and Fault Analysis, Theory
and Practice. London: Elsevier.
[25] D P Kothari & I J Nagrath.(2003). Modern Power System Analysis. 3rd
.ed.
Tata McGraw Hill Publishing Co. Ltd..New Delhi.