Embed Size (px)
Citation preview
1
Abstract - This paper compiled the information of some works in
which it is tried to identify the methodology to find the optimal
location of a bank of capacitors a Long a feeder of an electrical
distribution system, in function of minimizing the costs Operations
and investment. To reach the proposed objective, we took indicators
such as loss reduction and reduction of voltage drops found in a load
flow, which will be used as input logic variables to the fuzzy logic
tool, to find the most suitable node In which a bank of capacitors can
be installed.
Index of terms - algorithm, voltage drop, capacitor, fuzzy logic,
optimum node, loss reduction.
I. INTRODUCCIÓN
very enterprise needs to maximize economic benefits, so
it is generally assigned to engineers and technicians to
investigate the problems and causes in which economic losses
are incurred, looking for methods or processes that minimize
the effect of losses. In the case of electricity distribution
companies, voltage drops and energy losses are quantified and
graded by means of indices to measure the efficiency and
quality of service that the distributors must comply with
according to the regulation of national regulation determined by
the Agency of National Electricity Regulation ARCONEL,
these indices reflect a cost of benefit for the company and the
users.
Ecuadorian regulation considers technical product quality
indexes based on the ARCONEL 004-10 and 0003-99
regulations, which is why the distribution companies seek to
improve these indices, and the improvement of these indices
corresponds directly to the optimization of resources To the
distributors, for
Many distribution systems used in practice have a single main
feeder circuit and are known as radial distribution systems.
Radial systems are popular because of their simple design and
low overall price (Mekhamer, 2002).
Many solutions have been suggested such as problem
identification and decision-making techniques, large-scale
complex problem-solving techniques, non-linear mixed-integer
programming techniques, among others. The analytical
techniques (Bae, 1978), programming (Graiger, 1982),
heuristics (SF, 2002), mathematical programming (Chiang,
1993) and a number of other methods have been developed to
solve the problem.
Among these techniques evolutionary computer methods
such as Genetic Algorithm (Gringer, 1981) and ant colony
optimization (Wadhwa, 2006) have been shown to produce
superior results. Simulated annealing and Tabu searches have
also been very successful. However, a common drawback of
these techniques lies in the enormous computational task
involved in obtaining the solution; on the other hand, the efforts
of system engineers have not always been enough to avoid
complex solution applications with intensive calculation
processes. For this reason, the use of simple, physically
understandable logic to solve the problems is sought, although
such simplified solutions from time to time cannot find the best
approach in fuzzy logic, they imply a lower computational load
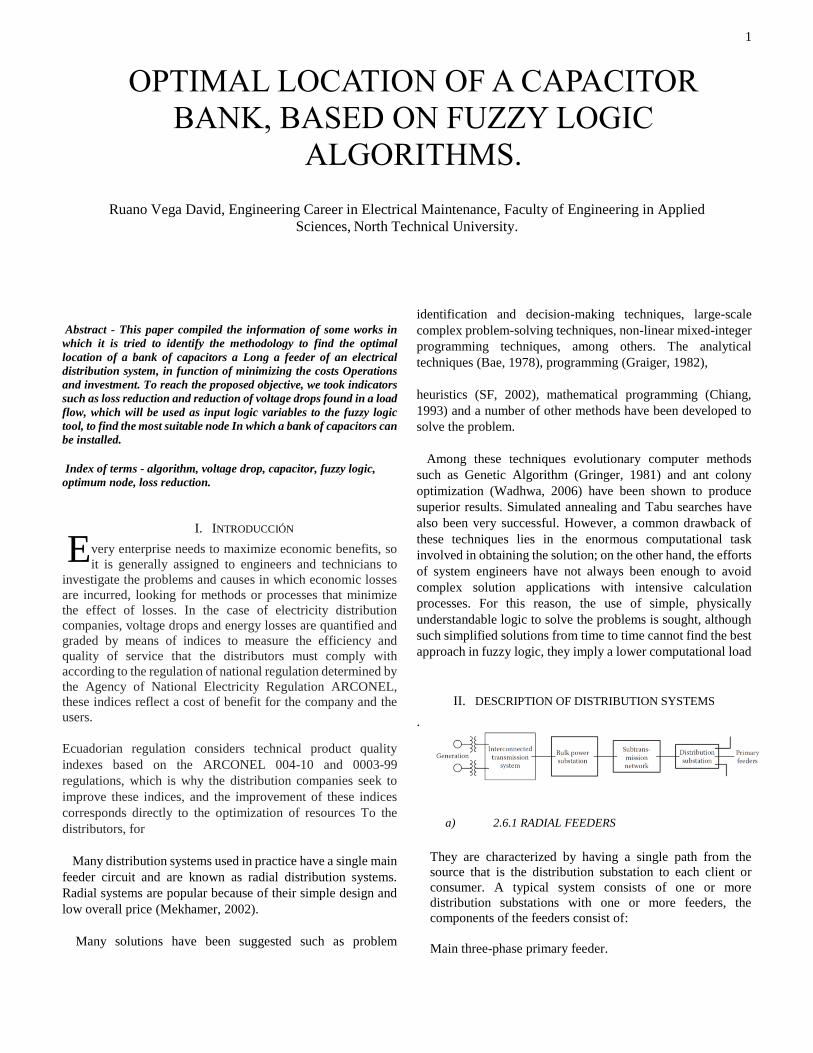
II. DESCRIPTION OF DISTRIBUTION SYSTEMS
.
a) 2.6.1 RADIAL FEEDERS
They are characterized by having a single path from the
source that is the distribution substation to each client or
consumer. A typical system consists of one or more
distribution substations with one or more feeders, the
components of the feeders consist of:
Main three-phase primary feeder.
OPTIMAL LOCATION OF A CAPACITOR
BANK, BASED ON FUZZY LOGIC
ALGORITHMS.
Ruano Vega David, Engineering Career in Electrical Maintenance, Faculty of Engineering in Applied
Sciences, North Technical University.
E

2
Single-phase, two-phase and three-phase side feeders.
Step-type voltage regulators.
Transformers Online.
Parallel capacitor banks.
Distribution transformers.
Secondary feeders.
Single-phase, two-phase and three-phase loads.
The structures are physically arranged as shown in Figure 11
Figura 1. Estructura Física de un Sistema de Distribución Aéreo Típico
(Gonzales, 2007).
The nominal voltages existing in the different components of
the distribution system in feeders or primary distribution
networks are: 6.3kV, 22.8kV GRDY / 13.2kV, 13.2kV GRDY
/ 7.6kV. At this level, special consumers such as industries and
others can be fed. The primary distribution circuits are
characterized because they are connected to a single point or
distribution substation (Radial Systems) and it is very little seen
in special cases only the connection to more than one substation
(Multiple Ring System).
The secondary ones correspond to the lower levels of power
and voltage. They are closer to the residential consumer. In
Ecuador, the voltage levels at the secondary distribution level
are those that operate at voltages below 600V. The nominal
voltages existing in the different components of the three-phase
secondary circuits system are: 220V / 127V and 210V / 121V,
for single-phase secondary circuits are: 240V / 120V.
B. PROBLEMS IN MAIN FEEDERS
A distribution feeder provides unbalanced 3-phase, biphasic
and single-phase loads on non-transposed 3-phase, biphasic and
single-phase line segments. This combination leads to three-
phase line currents and line voltages being unbalanced. In order
to analyze these conditions as accurately as possible, it will be
necessary to model the three phases of the feeder as accurately
as possible, however, often only a ball park estimate response
is required for the analysis. When this is the case, some
approximate methods of modeling and analysis may be
employed.
C. LINE IMPEDANCES.
The series impedance of a single-phase, biphasic or three-
phase distribution line consists of the resistance of the
conductors and the inductive and mutual inductive reactance’s
resulting from the magnetic fields surrounding the conductors

3
𝐼1 + 𝐼2 + ⋯ … … + 𝐼𝑖 + ⋯ … … + 𝐼𝑛 = 0
The total concatenated flux in conductor i is mathematically
given by the equation:
𝜆𝑖 = 𝑁. Φ = 2. 10−7. (𝐼1. ln1
𝐷𝑖1
+ 𝐼2. ln1
𝐷𝑖2
+ ⋯
+ 𝐼𝑖 . ln1
𝐺𝑀𝑅𝑖
+ ⋯ + 𝐼𝑛 . ln1
𝐷𝑖𝑛
)
Where:
N: Number of times the flow lines embrace the itch operator.
Din : Distance between the itch conductor and the nth
conductor in inches.
GMRi : Geometric mean radius of the itch conductor
a) 2.7.2 VOLTAGE DROPS
In a distribution system, the equivalent circuit of a three-
phase segment serving a three-phase load is shown in Figure 14
in which the Kirchoff voltage law "LVK" and its phasor
diagram have been applied in Figure 15 in which We observe
the phasor of the voltage drop that occurs in the line resistance
(IR), in phase with the current phasor, and the voltage drop
phasor in the reactance (jlx) having an annulus of 90 ° with
respect to the current
Figure 2 Line impedance components
𝑉𝑑𝑟𝑜𝑝 ≅ 𝑅𝑒𝑎𝑙 (𝑍. 𝐼)
b) 2.7.4 LOSSES
Like voltage drops, the importance of analyzing losses from
an "S" source, to the "n" node in a feeder is critical, losses must
be accounted for by the distributor, losses are divided into
technical losses And non-technical or commercial (often called
black losses) energy losses is the difference between the energy
delivered by a feeder minus the energy billed to the consumer,
for this reason the distribution companies are obliged to buy
additional energy To meet the demand of users in its concession
area, which increases the costs of managing the same, reducing
losses increases the volume of energy actually sold. The two
types of losses are detailed below:
(1) 2.7.4.1 NON-TECHNICAL LOSSES.
The energy produced is not invoiced in its entirety, within the
non-technical losses we have three large groups of losses, the
same as indicated below:
A) Accidents, are caused by unintentional faults in connections
misuse or operation of electrical service elements and
equipment.
B) Administrative, are errors produced by the administration of
the distribution company, among them are errors in taking
readings, users without meters (excluding from this group users
with contraband in their facilities), occasional services (errors
in the estimation of Energy), past due portfolio, lack of
measurement equipment in the facilities of the distribution
company itself, etc.
C) Fraudulent, referring to the energy not counted that certain
consumers with the desire to avoid charges for energy
consumed by the distributing company, manipulate the
measuring devices, connect directly to the electrical network
without the prior authorization of the distributor company and
without signing any contract with the same. These types of
cases are commonly known as contraband and often occur in
certain sectors already identified and conflicting, there are
several methods today to avoid this type of eventualities, the
most used in our country is the use of pre-assembled cable or
also known as anti-theft driver.
(2) 2.7.4.2TECHNICAL LOSSES
These constitute the portion of energy that is not supplied to the
user, but is required for its operation, this is lost in the
equipment, networks and other elements that make up the
distribution system, these serve to drive and transform energy
(transformers), These methods are measurable and estimable,
the measurement is made in the field with the specialized tool
and designated for that purpose, the estimation is done with
computer tools that the distributor company disposes for the
case of EMELNORTE uses the CYME tool. This type of losses
to be caused by the transmission of energy is normal in any
power distributor and cannot be eliminated in its entirety can
only be reduced through the topological improvement of the
network.
In order to achieve an adequate control plan and reduction of
technical losses, the following parameters must be taken into
account:
• Diagnosis of the current state of the system, • Projection of load expansion, • Studies of load flows, • Analyze the optimal location of transformers and
networks,
• Perform reconfiguration studies of primary feeders.

4
III. CAPACITOR BANKS
The pole-mounted capacitive system (Qpole) is an economical solution to compensate for reactive power in an air feeder, according to ABB's technical specifications the systems offer benefits as (ABB, 2010):
• Correction of the power factor close to the loads (consumers)
• Voltage stability Increase in network capacity
Cost savings through reduction of losses.
The banks can be installed as fixed or switched systems,
depending on the voltage profile in the feeder, in addition they
can be installed in groups called banks, when it is known that
the load is almost constant, fixed systems are used, in changes
the switches are more Used in networks with variable load.
Fixed banks can be assembled by grouping single-phase and
star-rated capacitors with floating neutral to the system voltage.
The average unit powers in the medium are 33.3, 50, 83.3, 100,
167, 200, 250, 300 and 400 KVAR, so that three-phase banks
of 100, 150, 250, 300, 500, 600, 750, 900 and 1200 KVAR, or
multiples of these powers. Its installation on overhead lines is
easy and only need a fuse and a surge arrester for protection,
few accessories for its connection.
Conventionally in Emelnorte these banks are roughly based on
the experience of their older technicians, which achieves a
significant reduction of losses and voltage drops, and a
consequent improvement in the quality of service provided to
all customers (Leyden). Pole banks in half voltage allow a high
concentration of power, achieving low-cost three-phase
equipment by KVAR.
In the country, the distribution companies installed capacitor
banks to improve the electrical system, as in the case of CNEL
EP and the El Oro business unit, installed 9 capacitor banks to
supply reagents to the distribution system, benefiting more than
45,000 inhabitants. The cantons Machala, Santa Rosa, Pinas,
Portovelo, Pasaje, Atahualpa, balao and Ponce Enríquez
according to the publication of the ministry of energy and
electricity (EP, 2017).
Therefore, the present work seeks to optimize the economic
resources in an electric power distribution company, depending
on the optimal location of capacitors in the course of a main
feeder.
IV. FUZZY LOGIC
Fuzzy logic is a method that provides a simplified conclusion
from inaccurate, ambiguous, incomplete, or noisy inputs (also
called fuzzy logic) that generally mimics a person's decisions
based on things seen from a position Relative It allows to work
with information with a high degree of imprecision, which
makes the difference with the conventional logic that always
needs well defined and precise information. This logic has
many intermediate values within the classic logic range that
come true / false, hot / cold, on / off, open / closed, etc.
It is necessary to understand that it is a fuzzy set to infer in the
values of the logic, if we call U to the set of several values,
which are in a range and within a space of n dimensions, then
to U is called Universe of Discourse, which contains one or
more diffuse subsets of Values called F, which is characterized
by a membership function uf such that uf: U -> [0,1], Where the
function uf(u) Represents the degree of belonging that one u
belongs to U in the diffuse subset F.
The fuzzy sets theory also defines the operations of union,
intersection, difference, negation or complement, and other
operations on sets, on which this logic is based.
Fuzzy logic is used when the complexity of the process in
question is very high and there are no precise mathematical
models for highly nonlinear processes and when definitions and
knowledge are not strictly defined (imprecise or subjective). On
the other hand, it is not a good idea to use it when some
mathematical model already solves the problem efficiently,
when the problems are linear or when there is no solution.
V. DETERMINATION OF THE LOCATION
In order to determine the suitability of capacitor placement at a
particular node, a set of multiple background diffuse rules has
been established. The inputs to the rules are the voltage indexes
and the loss of power which can also be integrated into energy
losses, and the resulting output is the suitability of the capacitor
positioning.
CONSIDERATIONS FOR SIMPLIFICATION OF THE
PROBLEM
Capacitors or fixed capacitors. - Installation of capacitors in
parallel (shunt) as points of injection of reactive power in the
nodes that require it.
• Strictly radial feeder. - For each simulation, the
voltage can be in per unit (pu) between a value of
0.95 and a maximum of 1.05.
Fig. 1. Feeder with N nodes and evenly distributed loads including the
installation of a capacitor.

5
• The largest reduction of losses was assigned to the
'1' and the remaining reduction of losses of energy
will be placed on the basis of the greater reduction
of losses.
• Analysis in the trunk, without considering the
branch circuits. - Power flow analysis in the study
feeder to find the parameters of observation, for this
item will be used the computer tool of CYME used
in real feeders.
To experience the functions studied in the applications
developed for this work we have the system of a radial feeder
with a voltage level of 13800 Volts, frequency of 60 Hz and is
understood as infinite bar for analysis, in which loads have been
distributed Specified in Table 1.
The variables of the analysis are defined as, voltage drops,
power or power losses, and the suitability of a node to be
located in a capacitor bank, following the methods investigated,
many authors consider measurement indices for these variables
which will be used as inputs Logical to the fuzzy logic tool, as
will be explained below.
The load flow is in agreement with the found in the CYMDIST
simulation:
Figure 3. Load flow at node 1
Figure 4. Load flow at node 2
Figure 5. Load flow at node 3
Figure 6. Load flow at node 4
Figure 7. Load flow at node 5
TABLE I
INFORMATION ON LOADS ON EACH NODE
Barra o nodo Potencia activa
[kW]
Potencia Reactiva
[kVAR]
1 1840 460
2 980 340
3 1790 446
4 1598 1840
5 1610 600
6 780 110
7 1150 60
8 980 130
9 1640 200
TABLE 2 LINES INFORMATION ON EACH LINE
Tramo Impedancia R
[ohmio]
Impedancia X
[ohmio]
0-1 0,1233 0,4127
1-2 0,0140 0,6051
2-3 0,7463 1,2050
3-4 0,6984 0,6084
4-5 1,9831 1,7276
5-6 0,9053 0,7886
6-7 2,0552 1,1640
7-8 4,7953 2,7160
8-9 5,3434 3,0264

6
Figure 8. Load flow at node 6
Figure 9. Load flow at node 7
Figure 10. Load flow at node 8
Figure 11. Load flow at node 9
The membership functions for the power loss reduction
indexes (IRPP) or energy loss reduction index (IRPE), voltage
reduction index (IV), and capacitance bank location suitability
index (IIUC) , Were created to provide a classification.
Therefore, the partitions of the membership functions for the
power, voltage and suitability indices are equally spaced.
Diffuse variables are:
• Energy Loss Reduction Index (IRPE)
• Reduction of voltage falls (VI)
• Optimal condenser location (CI)
They are described by the fuzzy terms of:
• Alto (High)
• Medio-Alto (High Medium)
• Medio/Normal (Medium)
• Medio-Bajo (Low Medium)
• Bajo. (Low)
Once the terms and diffuse variables are indicated, the
variables are identified or fuzzified as follows:
IRPE:
L = 0.00
LM = 0.25
M = 0.50
HM = 0.75
H = 1.00
VI:
VL = 0.95
L = 0.975
LN = 0.987
N = 1.00
HN = 1.025
H = 1.05
TABLE 2 INFORMATION OF THE LOSSES OF POWER AND VOLTAGE IN EACH PATH
Tramo
Perdida de
potencia
[kW]
Caída de voltaje Vl
[V]
0-1 - 13.200,0000
1-2 46,6432 13.106,2800
2-3 1.840,9200 13.033,6800
3-4 3,0188 12.716,8800
4-5 1.157,0405 12.513,6000
5-6 1.904,1093 12.107,0400
6-7 1.787,8096 11.975,0400
7-8 1.657,2840 11.734,8000
8-9 855,3879 11.336,1600
9-10 1.237,8555 11.056,3200
TABLE 3
INFORMATION ON PU POWER AND VOLTAGE LOSSES PU
Tramo
Perdida de
potencia
[pu]
Caída de voltaje
[pu]
0-1 - 1
1-2 0,0245 0,9929
2-3 0,9668 0,9874
3-4 0,0016 0,9634
4-5 0,6077 0,9480
5-6 1,0000 0,9172
6-7 0,9389 0,9072
7-8 0,8704 0,8890
8-9 0,4492 0,8588
9-10 0,6501 0,8376
7
Now we have the elaboration of the logic of belonging, as
follows:
yes (IRPE is L) y (VI es VL) so (IC es M)
yes (IRPE is L) y (VI es L) so (IC es LM)
yes (IRPE is L) y (VI es LN) so (IC es LM)
yes (IRPE is L) y (VI es N) so (IC es L)
yes (IRPE is L) y (VI es HN) so (IC es L)
yes (IRPE is L) y (VI es H) so (IC es L)
yes (IRPE is LM) y (VI es VL) so (IC es HM)
yes (IRPE is LM) y (VI es L) so (IC es M)
yes (IRPE is LM) y (VI es LN) so (IC es LM)
yes (IRPE is LM) y (VI es N) so (IC es LM)
yes (IRPE is LM) y (VI es HN) so (IC es L)
yes (IRPE is LM) y (VI es H) so (IC es L)
yes (IRPE is M) y (VI es VL) so (IC es H)
yes (IRPE is M) y (VI es L) so (IC es HM)
yes (IRPE is M) y (VI es LN) so (IC es M)
yes (IRPE is M) y (VI es N) so (IC es LM)
yes (IRPE is M) y (VI es HN) so (IC es L)
yes (IRPE is M) y (VI es H) so (IC es L)
yes (IRPE is HM) y (VI es VL) so (IC es H)
yes (IRPE is HM) y (VI es L) so (IC es HM)
yes (IRPE is HM) y (VI es LN) so (IC es HM)
yes (IRPE is HM) y (VI es N) so (IC es M)
yes (IRPE is HM) y (VI es HN) so (IC es LM)
yes (IRPE is HM) y (VI es H) so (IC es L)
yes (IRPE is H) y (VI es VL) so (IC es H)
yes (IRPE is H) y (VI es L) so (IC es H)
yes (IRPE is H) y (VI es LN) so (IC es HM)
yes (IRPE is H) y (VI es N) so (IC es M)
yes (IRPE is H) y (VI es HN) so (IC es LM)
yes (IRPE is H) y (VI es H) so (IC es LM)
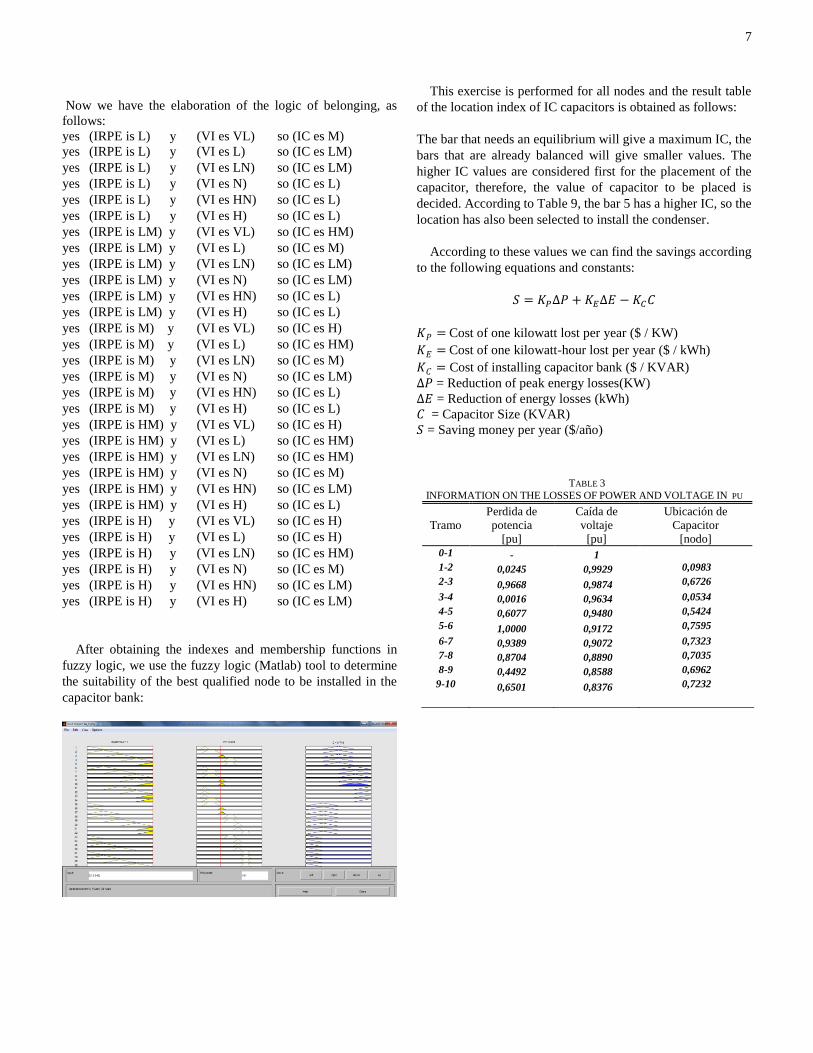
After obtaining the indexes and membership functions in
fuzzy logic, we use the fuzzy logic (Matlab) tool to determine
the suitability of the best qualified node to be installed in the
capacitor bank:
This exercise is performed for all nodes and the result table
of the location index of IC capacitors is obtained as follows:
The bar that needs an equilibrium will give a maximum IC, the
bars that are already balanced will give smaller values. The
higher IC values are considered first for the placement of the
capacitor, therefore, the value of capacitor to be placed is
decided. According to Table 9, the bar 5 has a higher IC, so the
location has also been selected to install the condenser.
According to these values we can find the savings according
to the following equations and constants:
𝑆 = 𝐾𝑃∆𝑃 + 𝐾𝐸∆𝐸 − 𝐾𝐶𝐶
𝐾𝑃 = Cost of one kilowatt lost per year ($ / KW)
𝐾𝐸 = Cost of one kilowatt-hour lost per year ($ / kWh)
𝐾𝐶 = Cost of installing capacitor bank ($ / KVAR)
∆𝑃 = Reduction of peak energy losses(KW)
∆𝐸 = Reduction of energy losses (kWh)
𝐶 = Capacitor Size (KVAR)
𝑆 = Saving money per year ($/año)
TABLE 3
INFORMATION ON THE LOSSES OF POWER AND VOLTAGE IN PU
Tramo
Perdida de
potencia
[pu]
Caída de
voltaje
[pu]
Ubicación de
Capacitor
[nodo] 0-1 - 1
1-2 0,0245 0,9929 0,0983
2-3 0,9668 0,9874 0,6726
3-4 0,0016 0,9634 0,0534
4-5 0,6077 0,9480 0,5424
5-6 1,0000 0,9172 0,7595
6-7 0,9389 0,9072 0,7323
7-8 0,8704 0,8890 0,7035
8-9 0,4492 0,8588 0,6962
9-10 0,6501 0,8376 0,7232

8
VI. CONCLUSION
• When performing calculations and simulations in feeders with
a small number of nodes, the results are more accurate, which
shows that the factors that alter the optimal location of a
capacitor bank are the number of nodes or the complexity of the
distribution system in which it is desired to investigate.
• Voltage profiles in the feeder are compensated, complying
with the restriction given and with a considerable loss
percentage, when presenting quality indices.
• In the calculation of loss reduction index, it can be automated
according to the sensitivity of each node for its load and its
components of the section.
• The problem It can be further complicated in reality, if you
consider the derivation capacitances in the PI model of the
feeder line, everything will depend on the level of voltage with
which you are working, because at higher voltage capacitances
Can increase and be representative for the analysis, which may
be an additional topic for research.
• Voltage stabilization. - There is a considerable improvement
in the voltage profile after system compensation, conditions and
restrictions if they can meet the voltage constraint.
• Loss of power and energy results in the placement of
compensated reactive power capacitor as a power factor,
resulting in an improvement of the system. The data are
obtained from the load flow program in CYME.
VII. REFERENCIAS
ABB, C. (2010). Qpole, Pole Mounted Capacitor System.
Catalog power capacitors. Bae, Y. G. (1978). Analitic. IEEE Transaction, 1232-1238.
Chiang, D. (1993). Optimal capacitor placement in
distribution system by genetic algorithm. IEEE
electrical power & Energy Sistems, 155-162.
EP, C. (9 de enero de 2017). www.energia.gob.ec. Obtenido
de http://www.energia.gob.ec/cnel-ep-instala-bancos-
de-capacitores-para-mejorar-sistema-electrico/:
http://www.energia.gob.ec/category/comunicamos/no
ticias/
Gonzales, F. (2007). Introducción a los Sistemas de
Transmisión. SISTEMAS DE TRANSMISIÓN, 1-13.
Graiger, J. (1982). Capacity release by shunt capacitor
placement on distribution feeder. IEEE transaction
and distribution, 1236-1244.
Gringer, J. (1981). Optimun size and location of shunt
capacitors for reducction of losses on distribution
feeders. Transactions on power apparatus and
systems IEEE, 1105-1118.
Leyden. (s.f.). Bancos de capacitores para montaje en poste.
Obtenido de http://www.leyden.com.ar:
http://www.leyden.com.ar/esp/pdf/bancos_poste.pdf
Mekhamer, S. (2002). Load flow solution of radial distribuiton
feeder. International Journal of Electrical Power &
Energy System, 701-707.
SF, M. (2002). New hwuristic strategies for reactive power
compensation of radial distribution feeders. IEEE
transactions on Power Delivery, 1128-1135.
Wadhwa, C. (2006). En Electrical power systems. Delhi: New
age international.