Embed Size (px)
Citation preview
8/11/2019 Optical trapping and acoustic excitation of microbubbles in a micro uidic system
http://slidepdf.com/reader/full/optical-trapping-and-acoustic-excitation-of-microbubbles-in-a-micro-uidic 1/1
© Q u e e n ’ s P r i n t e r a n d C o n t r o l l e r o f
H M S O , 2 0 1 4 .
1 0 9 6 9 / 0 7 1 4
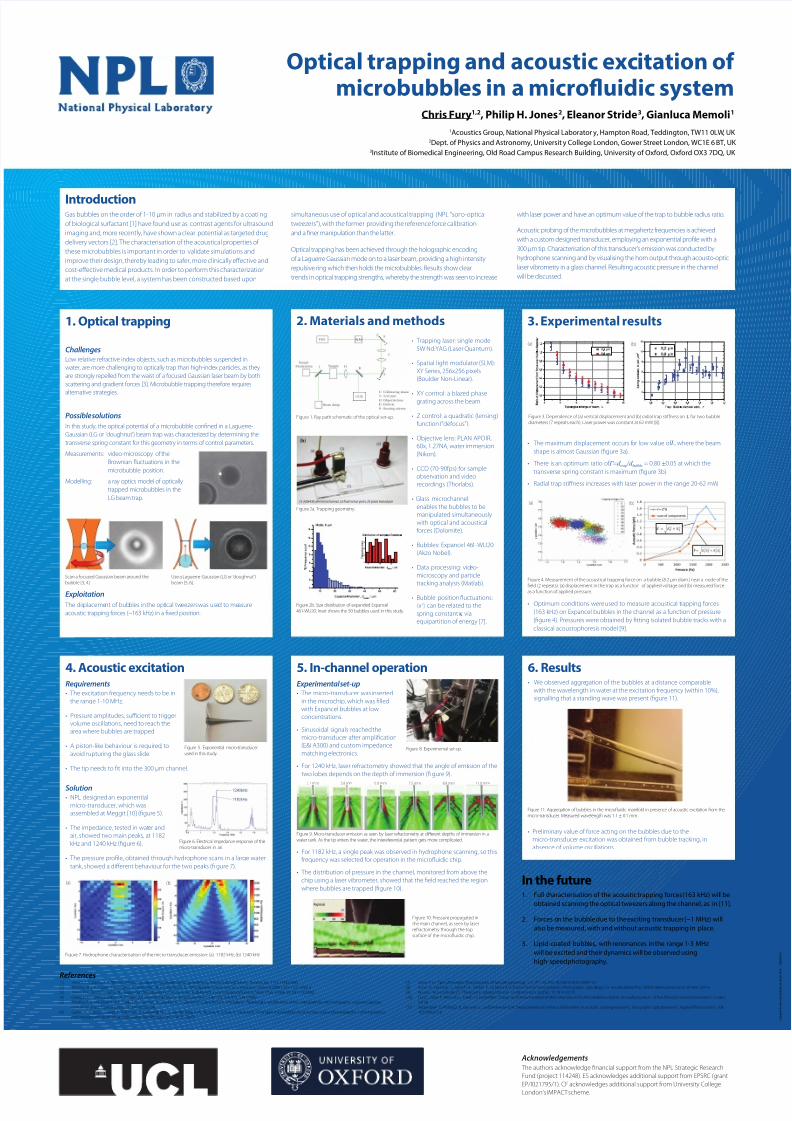
Optical trapping and acoustic excitation ofmicrobubbles in a microfluidic system
Chris Fury1,2, Philip H. Jones2, Eleanor Stride3, Gianluca Memoli1
1Acoustics Group, National Physical Laborator y, Hampton Road, Teddington, TW11 0LW, UK 2Dept. of Physics and Astronomy, Universit y College London, Gower Street London, WC1E 6 BT, UK
3Institute of Biomedical Engineering, Old Road Campus Research Building, University of Oxford, Oxford OX3 7DQ, UK
Acknowledgements The authors acknowledge financial support from the NPL Strategic Research
Fund (project 114248). ES acknowledges additional support from EPSRC (grant
EP/I021795/1). CF acknowledges additional support from University College
London’s IMPACT scheme.
References[1] Hernot, S., Klibanov, A. L., “Microbubblesin ultrasound-triggereddrugand genedelivery,”AdvancedDrugDelivery Reviews, 60, 1153-1166(2008).[2] Blomley, M. J. K., Cooke, J. C., Unger, E. C., Monaghan, M. J., Cosgrove, D. O., “Microbubblecontrast agents: a newera in ultrasound,”BMJ, 322, 1222 (2001).[
[3] Jones, P. H. , Stride, E. , Saffari. N., “Trappingandmanipulation of microscopic bubbleswith a scanningopticaltweezer,”Appl. Phys. Letters, 89, 081113(2006).
[4] Gahagan, K.T. , Swartzlander, G.A., “Trappingof lowindexparticles in an opticalvortex,”J. Opt. Soc. Am. B15, 524 (1998).
[5] Prentice, P. A., MacDonald, M. P., Frank, T. G., Cuschieri, A., Spalding, G. C., Sibbett, W., Campbell, P. A., Dholakia, K.. “Manipulation andfiltration of low indexparticles with holographic Laguerre-Gaussian
opticaltrap arrays,”OpticsExpress, 12, 593-600(2004).
[6] Garbin, V. , Cojoc, D. , Ferrari, E., Di Fabrizio, E., Overvelde, M. L. J., van der Meer, S. M., deJong, N., Lohse, D., Versluis, M., “Changesin microbubble dynamicsnear a boundaryrevealedby combinedoptical
micromanipulation andhigh-speedimaging,”ApplPhysLett, 90, 114103 (2007).
[7] Jones. P. H., “OpticalTweezers,”[Encyclopedia of OpticalEngineering], 172, PP 1-16, DOI 10.1081/E-EOE-120047157[8] FuryC. R., HarfieldC. J., JonesP. H., StrideE. P. J. & Memoli G., “Experimentalcharacterisation of holographic opticaltraps for microbubbles”, Proc SPIE9126NanophotonicsV, 91263L (2014)
[9] BruusH. “Acoustofluidics7: Theacoustic radiation forceon smallparticles”, LabChip, 12, 1014 (2012)
[10] FuryC., Gélat P., Memoli G., JonesP. H., HodnettM., “Design andCharacterisation of a Microtransducer for MicrobubbleExcitation, AnnualSymposium of theUltrasonic IndustryAssociation”, in press
(2014)
[11] BassindaleP. G., PhillipsD. B., BarnesA. C., andDrinkwater B. W., “Measurementsof theforce fieldswithin an acoustic standingwaveusing holographic opticaltweezers”, AppliedPhysicsLetters, 104,
163504(2014)
3. Experimental results
• The maximum displacement occurs for low value of L, where the beam
shape is almost Gaussian (figure 3a).
• There is an optimum ratio of Γ =d trap / d bubble = 0.80 ±0.05 at which the
transverse spring constant is maximum (figure 3b).
• Radial trap stiffness increases with laser power in the range 20-62 mW.
• Optimum conditions were used to measure acoustical trapping forces
(163 kHz) on Expancel bubbles in the channel as a function of pressure
(figure 4). Pressures were obtained by fitting isolated bubble tracks with a
classical acoustophoresis model [9].
Figure 3. Dependence of (a) vertical displacement and (b) radial trap stiffness on L for two bubble
diameters (7 repeats each). Laser power was constant at 62 mW [8].
2. Materials and methods
Figure 1. Ray path schematic of the optical set-up.
Figure 2a. Trapping geometry.
Figure 2b. Size distribution of expanded Expancel
461-WU20. Inset shows the 50 bubbles used in this study.
• Trapping laser: single mode
5W Nd:YAG (Laser Quantum).
• Spatial light modulator (SLM):
XY Series, 256x256 pixels
(Boulder Non-Linear).
• XY control: a blazed phasegrating across the beam.
• Z control: a quadratic (lensing)
function (“defocus”).
• Objective lens: PLAN APO IR,
60x, 1.27NA, water immersion
(Nikon).
• CCD (70-90fps): for sample
observation and video
recordings (Thorlabs).
• Glass microchannel:
enables the bubbles to be
manipulated simultaneously
with optical and acoustical
forces (Dolomite).
• Bubbles: Expancel 461-WU20
(Akzo Nobel).
• Data processing: video-
microscopy and particle
tracking analysis (Matlab).
• Bubble position fluctuations:
<x2> can be related to the
spring constant κ via
equipartition of energy [7].
1. Optical trapping
ChallengesLow relative refractive index objects, such as microbubbles suspended in
water, are more challenging to optically trap than high-index particles, as they
are strongly repelled from the waist of a focused Gaussian laser beam by both
scattering and gradient forces [3]. Microbubble trapping therefore requires
alternative strategies.
Possible solutions
In this study, the optical potential of a microbubble confined in a Laguerre-
Gaussian (LG or ‘doughnut’) beam trap was characterized by determining the
transverse spring constant for this geometry in terms of control parameters.
Measurements: video-microscopy of the
Brownian fluctuations in the
microbubble position.
Modelling: a ray optics model of optically
trapped microbubbles in the
LG beam trap.
Exploitation
The displacement of bubbles in the optical tweezers was used to measure
acoustic trapping forces (~163 kHz) in a fixed position.
4. Acoustic excitationRequirements• The excitation frequency needs to be in
the range 1-10 MHz.
• Pressure amplitudes, suffi cient to trigger
volume oscillations, need to reach the
area where bubbles are trapped.
• A piston-like behaviour is required, to
avoid rupturing the glass slide.
• The tip needs to fit into the 300 m channel.
Solution• NPL designed an exponential
micro-transducer, which was
assembled at Meggit [10] (figure 5).
• The impedance, tested in water and
air, showed two main peaks, at 1182
kHz and 1240 kHz (figure 6).
• The pressure profile, obtained through hydrophone scans in a large water
tank, showed a different behaviour for the two peaks (fi gure 7).
5. In-channel operationExperimental set-up• The micro-transducer was inserted
in the microchip, which was filled
with Expancel bubbles at low
concentrations.
• Sinusoidal signals reached the
micro-transducer after amplification
(E&I A300) and custom impedance
matching electronics.
• For 1240 kHz, laser refractometry showed that the angle of emission of the
two lobes depends on the depth of immersion (fi gure 9).
• For 1182 kHz, a single peak was observed in hydrophone scanning, so this
frequency was selected for operation in the microfluidic chip.
• The distribution of pressure in the channel, monitored from above the
chip using a laser vibrometer, showed that the field reached the region
where bubbles are trapped (figure 10).
6. Results• We observed aggregation of the bubbles at a distance comparable
with the wavelength in water at the excitation frequency (within 10%),
signalling that a standing wave was present (figure 11).
• Preliminary value of force acting on the bubbles due to the
micro-transducer excitation was obtained from bubble tracking, in
absence of volume oscillations.
Scan a focused Gaussian beam around the
bubble [3, 4].
Use a Laguerre-Gaussian (LG or ‘doughnut’)
beam [5, 6].
IntroductionGas bubbles on the order of 1-10 m in radius and stabilized by a coati ng
of biological surfactant [1] have found use as contrast agents for ultrasound
imaging and, more recently, have shown a clear potential as targeted drug
delivery vectors [2]. The characterisation of the acoustical properties of
these microbubbles is important in order to validate simulations and
improve their design, thereby leading to safer, more clinically effective and
cost-effective medical products. In order to perform this characterization
at the single bubble level, a system has been constructed based upon
simultaneous use of optical and acoustical trapping (NPL “sono-optical
tweezers”), with the former providing the reference force calibration
and a finer manipulation than the latter.
Optical trapping has been achieved through the holographic encoding
of a Laguerre Gaussian mode on to a laser beam, providing a high intensity
repulsive ring which then holds the microbubbles. Results show clear
trends in optical trapping strengths, whereby the strength was seen to increase
with laser power and have an optimum value of the trap to bubble radius ratio.
Acoustic probing of the microbubbles at megahertz frequencies is achieved
with a custom designed transducer, employing an exponential profile with a
300 m tip. Characterisation of this transducer’s emission was conducted by
hydrophone scanning and by visualising the horn output through acousto-optic
laser vibrometry in a glass channel. Resulting acoustic pressure in the channel
will be discussed.
In the future1. Full characterisation of the acoustic trapping forces (163 kHz) will be
obtained scanning the optical tweezers along the channel, as in [11].
2. Forces on the bubble due to the exciting transducer (~1 MHz) will
also be measured, with and without acoustic trapping in place.
3. Lipid-coated bubbles, with renonances in the range 1-3 MHz
will be excited and their dynamics will be observed using
high-speed photography.
(a) (b)
Figure 5. Exponential micro-transducer
used in this study.
Figure 6. Electrical impedance response of the
micro-transducer in air.
Figure 7. Hydrophone characterisation of the micro-transducer emission: (a) 1182 kHz; (b) 1240 kHz.
Figure 11. Aggregation of bubbles in the microfluidic manifold in presence of acoustic excitation from the
micro-transducer. Measured wavelength was 1.1 ± 0.1 mm.
Figure 8: Experimental set-up.
(a) (b)
Figure 9. Micro-transducer emission as seen by laser refractometry at different depths of immersion in a
water tank. As the tip enters the water, the intereferential pattern gets more complicated.
5.7 mm 5.8 mm 6.6 mm 7.5 mm 8.8 mm 11.0 mm
Figure 10. Pressure propagated in
the main channel, as seen by laser
refractometry through the top
surface of the microfluidic chip.
Figure 4. Measurement of the acoustical trapping force on a bubble (8.2 m diam.) near a node of the
field (2 repeats): (a) displacement in the trap as a function of applied voltage and (b) measured force
as a function of applied pressure.
(a) (b)