Embed Size (px)
Citation preview

Optical Transition Radiation
~ e t h ~itter*
UCLA Department of Physias Center For Advanced Accelerators
Particle Beam Physics Lab
Los Angeles, CA 90024
Abstract The use of Optical Transition Radiation (OTR) as an on-line
diagnostic system for the UCLA Particle Beam Physics Lab electron
beam has been investigated. Beam divergence, energy and profile
are some of the properties which have been theoretically and
experimentally (past works) shown to be analyzable and measurable
from OTR patterns. Calculations regarding the survivability of
both the beam and the OTR target are made for various beam
energies and target materials. It is found that a 20 MeV beam
passing through a thin aluminum target will be unperturbed, in
terms of energy and angular divergence, and the target will not
be destroyed. Finally, the use of an OTR double-foil
interferometer, as a more precise diagnostic tool, is presented
for future consideration.
'work supported by UCIA Physics department

Contents
Introduction
Theory
Transition Radiation In General
Model Of Dispersion
OTR In Metals, Relativistic Limit
Why Metals
Frequencies Above Optical
Experimental considerations OTR Arrangement and Beam Parameters for UCLA
Yeild Of Optical Photons
How will OTR Affect the Beam?
(1) Beam Energy Loss
(2) Beam Divergence
How Will the Beam Affect the Target Material?
(1) Temperature Rise of Material Per Pulse
(2) Long Term Heating
OTR Interferometry
Conolusions
References

Introduction
A low-emittance, high-brightness electron beam is being
constructed at the UCLA Center for Advanced Accelerators (CAA), a
Particle Beam Physics Lab (PBPL). The beam will be used to drive
a Free-Electron LASER^^^ and a Plasma Wake-Field Accelerator (PWFA)~~'. The laser-driven photo-cathode RF electron gun is
expected to produce a 4.5 MeV beam, which when directed through a
Plane-Wave Transformer (PWT) linacL3] will achieve energies of
about 20 MeV.
It is desired to implement a diagnostic tool to determine
the characteristics of the beam before (4.5 MeV) and after (20
MeV) linac. A charge collecting phosphor screen monitored by a CCD camera has been employed for beam observation. However, due
to its integrating nature, in addition to registering the charge of the photo-electron bunch, the phosphor also collects the
undesirable dark current which can exceed the photo-electrons.
Another possible diagnostic system is Cerenkov radiation
(produced when a charge passes through a medium at velocities greater than the phase velocity of light in that medium) emitted
from a target material such as quartz. Typically the light
produced in this process is emitted at angles around 45' with
respect to the beam axis. Such radiation can be difficult to
image (via video) because of limited admittance and inherent
divergenceH1.
This paper presents a study of the characteristics of
Transition Radiation (TR), with emphasis on use with the UCLA
electron beam. Transition Radiation has a broad spectrum which
can extend from microwave to x-ray frequencies with substantial
intensities. For electron beam monitoring we would like to exploit the optical (visible) portion of the electromagnetic
spectrum since cameras and other optical equipment are readily
available at these wavelengths. With appropriate implementation
of the device, Optical Transition Radiation can provide an on- line (non-destructive) diagnostic tool that gives information

about the beam's profile, energy and divergence. The theoretical background will be developed, and the parameters relevant to both the 4.5 MeV and 20 MeV beams will be considered for quantitative
experimental analysis.
Theory
Transition Radiation In General
The existence of transition radiation was theoretically
predicted by Frank and Ginzburg in 1946151. The effect can be
understood by considering the electromagnetic fields that a
moving charged particle carries with it. These fields are media
dependent on the dielectric constant e . As a moving charge
approaches and crosses the boundary between two different media
the fields must somehow reorganize themselves. It is in this process of reorganization that some of the fields are "shaken
offM as transition radiation.
Figure 1. Photons are generated in both forward and backward directions. The
radiation propagates away from the boundary into both media.
The radiation pattern produced by a beam of electrons

traversing a boundary can be analyzed to yield information about
the beam.
The angular distribution of the radiation can be understood
by a "phase coherencew argument given by ~ackson~~~. The driving
fields of the incident particle penetrate into medium 2 as the
particle approaches the boundary (see figure 1). For appreciable
radiation to be emitted there must be coherent superposition of
the fields (particle fields and radiation fields) from different
points in the medium. This will occur provided that the product of the driving fields of the particle and the generated wave does
not experience a significant change in phase over the region of
medium 2. This results in the condition for appreciable
transition radiation to occur when medium 1 is vacuum:
where y is the Lorentz factor, 8 is the angle of radiation emission with respect to the beam axis, e is the dielectric
constant of medium 2, and u is the radiation frequency. The characteristic angular distribution for the emission of transition radiation is that of a narrow cone with apex angle
e - 1/y. The general approach to finding a relation for the intensity
of TR involves using Maxwell's equations to solve for the
radiation fields in the two media, applying the necessary
boundary conditions, and calculating the intensity of the emitted
radiation. The most general result for the case of an electron
passing from medium 1 (with dielectric constant e l ) into medium 2 (with dielectric constant e,) at normal incidence to the boundary
is presented (equation 2) by ~er-~ikaelian~']. Similar results
are derived by Ginzburg and ~sytovich~'~ and ~afomov~~~. The
spectral intensity, I, of the radiation emitted forward (into

medium 2) in the frequency range da and into a solid angle dn is
given by:
where 0, is the angle between the forward T.R. wave-vector and
the beam axis, B is the normalized electron velocity, e is the charge on the electron, and a is the frequency of radiation. The
radiation propagating in the backward direction is given by the
same equation with the permutation of subscripts 1 - 2 and 0 +
-j9. The dependence on the parameters included in equation (2)
will be determined in a specific instance by the values el(a) and
&;(a). It is necessary, therefore, to understand something about
dispersion in materials.
Model of D i S ~ e r ~ i ~ n ~ ~ ~ '
The atomic contribution to the dielectric constant of a material
in the presence of an external electric field, E, is given by:
where xe is the electric susceptibility and P is the macroscopic polarization. The dipole moment contributed by a single electron
is pi = -exj, so we need to determine the displacement xi. The
equation of motion for
material by a harmonic
is written as
an electron bound to an atom of the
force and acted on by an electric field
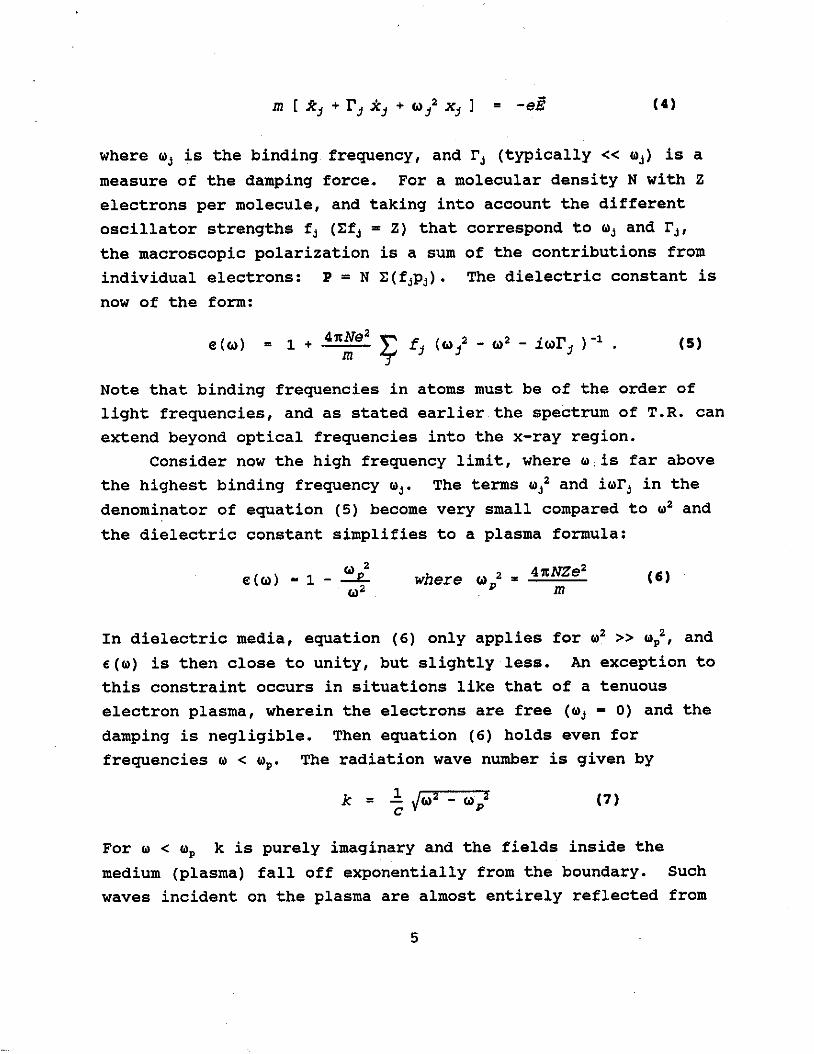
where aj is the binding frequency, and rj (typically à aj) is a
measure of the damping force. For a molecular density N with Z electrons per molecule, and taking into account the different
oscillator strengths f, (Sf, = Z) that correspond to uj and F,,
the macroscopic polarization is a sum of the contributions from
individual electrons: P = N 2(fjpj). The dielectric constant is
now of the form:
Note that binding frequencies in atoms must be of the order of light frequencies, and as stated earlier the spectrum of T.R. can
extend beyond optical frequencies into the x-ray region.
Consider now the high frequency limit, where u is far above the highest binding frequency a,. The terms uj2 and iwrj in the
denominator of equation (5) become very small compared to u2 and
the dielectric constant simplifies to a plasma formula:
2
eta) - 1 - where a2 = 4 i t N Z e 2 m
( 6 ) a2
In dielectric media, equation (6) only applies for a2 >> up2, and €( is then close to unity, but slightly less. An exception to
this constraint occurs in situations like that of a tenuous
electron plasma, wherein the electrons are free (aj = 0) and the
damping is negligible. Then equation (6) holds even for
frequencies a < up. The radiation wave number is given by
For a < ap k is purely imaginary and the fields inside the
medium (plasma) fall off exponentially from the boundary. Such
waves incident on the plasma are almost entirely reflected from

the surface.
In metals there are free electrons, and at optical
frequencies the response of these free electrons to an external
field dominates dispersion. This constitutes a situation like
that of the plasma described above which is why metals appear
shiny in light. Optical frequencies are of the order 10" Hz,
and for most metals the plasma frequency is on the order of lo1'
Hz. For optical frequencies in metals the dielectric constant is
large and negative:
e - 1 - (10~'/10~~)~ - -100
Radiation at optical frequencies does not penetrate far into
a metal from the boundary. When the complex wave number is
written in the form k = f l + ia/2, the attenuation constant is given by the parameter a. The attenuation length, l/a, is in
this case
For a metal foil of thickness larger than a-'the OTR produced by
an electron beam, passing from vacuum into the foil and emerging
again in vacuum, will be primarily emitted into the vacuum.
Further explanation as to why it is desirable to use a metal
boundary to attain this situation will be given, but first the
spectral intensity of OTR in such a case is analyzed.
OTR In Metals, Relativistic Limit
As the charge moves from the medium (el= e) into vacuum (6,
= I), the radiation emitted forward is given by equation (2):
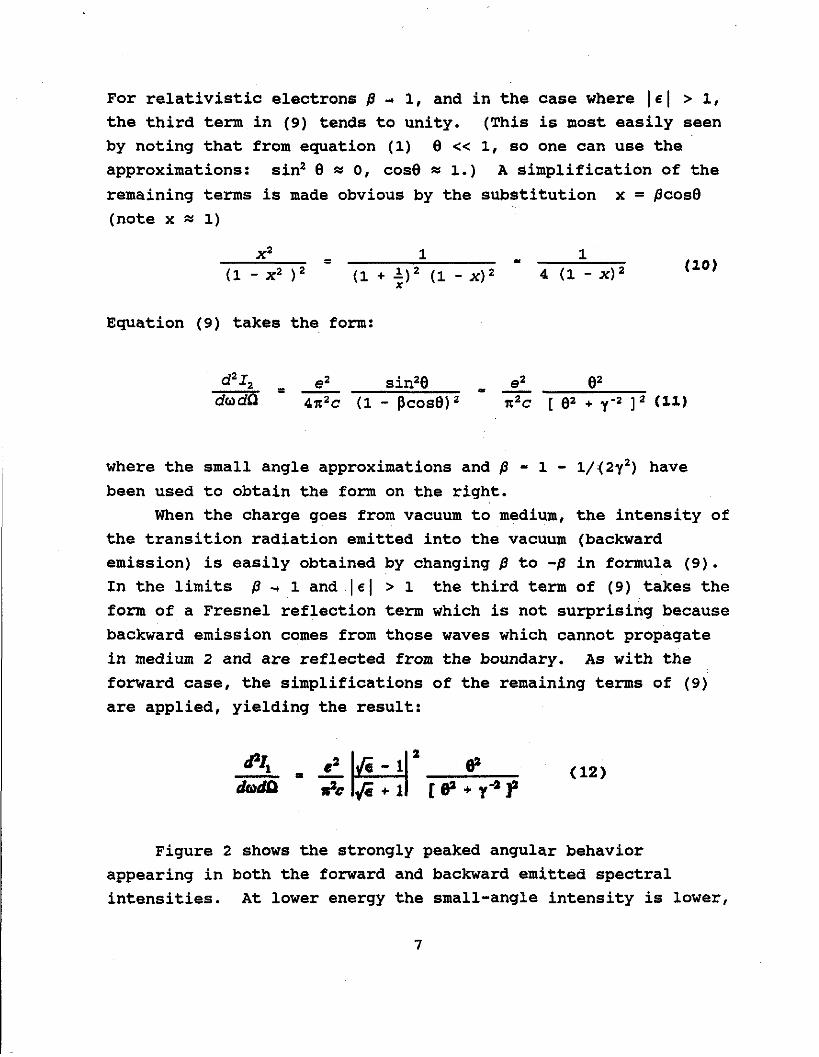
For relativistic electrons fi -i 1, and in the case where 161 > 1, the third term in (9) tends to unity. (This is most easily seen
by noting that from equation (1) 0 << 1, so one can use the approximations: sin2 6 s 0, cose s 1.) A simplification of the
remaining terms is made obvious by the substitution x = ficos8
(note x s 1)
Equation (9) takes the form:
where the small angle approximations and f3 - 1 - l/(2y2) have been used to obtain the form on the right.
When the charge goes from vacuum to medium, the intensity of
the transition radiation emitted into the vacuum (backward
emission) is easily obtained by changing f3 to -p in formula (9).
In the limits f3 -. 1 and 161 > 1 the third term of (9) takes the
form of a Fresnel reflection term which is not surprising because
backward emission comes from those waves which cannot propagate
in medium 2 and are reflected from the boundary. As with the
forward case, the simplifications of the remaining terms of (9)
are applied, yielding the result:
Figure 2 shows the strongly peaked angular behavior
appearing in both the forward and backward emitted spectral
intensities. At lower energy the small-angle intensity is lower,

but still peaks at 6 - 1/y. I
Figure 2. Angular dependence of the spectral intensity per unit solid angle
of TR for two different energies.. .4.5 and 20 MeV.
Equations (11) and (12) are valid whenever relativistic electrons
are normally incident on the boundary between vacuum and a medium
of dielectric constant e, when lei > 1. The forms (11) and (12)
also correctly reveal the angular behavior when e is close to
unity, but slightly less, as is the case for frequencies far
above the plasma frequency.
The integration of (11) over 6 in the angular interval (0 - Om-) gives the energy dependence of the spectral intensity:
e2 -a : 2!L - - (ye",$ for fl..B=y dm, 2uc

From (13) and (14), and as can be seen in figure 2, the
intensity of TR emitted into very small angles increases with ,$-
energy as y4, while the total intensity has a logarithmic r dependence on energy.
m r As was shown earlier, for optical frequencies in metals,
e l >> 1. In this case the reflection term in equation (12)
tends to unity, and the intensities of forward and backward
emission (into the vacuum) are of the same order of magnitude.
BACKWARD (Â¥:{ FORWARD
Figure 3. Radiation patterns resulting for the case of normal electron
incidence to a metal boundary along with a typical Cerenkov pattern for
comparison. These pictures were taken from a paper by Lumpkin et al.['ll.
Clearly, the radiation pattern emerging from this
arrangement is not conducive to non-destructive detection
(neither for the beam nor for the detector), because a detector
would have to have radiaiton collecting components h the path of the beam. Consider then the case in which the electron is
incident on the boundary at an angle of 45'. This is where the
importance of a metal boundary comes into play; the radiation
emitted as the electron enters the foil (from vacuum) propagates
primarily backward as a reflection from the boundary. One might

already expect that the backward emission, resulting from a 45'
incidence o n a metal, would occur about an axis perpendicular to
the electron's direction of motion, as is the case for, say,
light reflected from the surface of a mirror.
The general formulae for the case of oblique incidence are
rather cumbersome and have been investigated extensively by
~ a f o r n o v ~ ~ ~ . However, for the case of ~ v t i ~ c a frequencies in
metals, the treatment of the problem is greatly simplified by
considering the model of a perfectly conducting metallic foil
using image charge theory. Transition radiation is then just the
radiation emitted in a pair annihilation (or creation) process
taking place on the boundary:
where 9' is the angle of emission with respect to the direction
of the image charge velocity (see figure 4).
Figure 4. Back radiation for the
case of 45O incidence. From
equation (1) we know that for
relativistic electrons the relevant
back emission angle, V , must be
small.
For relativistic electrons (/3 4 1) the first tern in equation
(15) may be ignored as it tends to unity (6 u w / 2 ) while the
second term blows up (81 is very small). In this case the back
emitted intensity per unit solid angle given by equation (15)

reduces precisely to the form derived in equation (11).
In the medium-to-vacuum case and for relativistic electrons,
the second term in (15) may be ignored and the TR is then
directed forward into small angles 8 with respect to the electron velocity. The forward emission does not strongly depend on the
incidence angle, while the backward emission is directed about an
axis corresponding to the image charge direction of motion.
These assumptions are only valid for the optical range of
frequencies emitted from metal boundaries and for non-grazing
incidence of electrons with high Lorentz factors. The need for
the last condition of large y can be understood from figure 5,
taken from a paper by Wartski st alsc13'.
Figure 5. The evolution with 7 of the backward OTR (computed from Pafomov's
formula) for an electron incident on aluminum at a 45' angle. (a) 7 - 1.05; (b) 7 - 2; (c) -y - 10; (d) 7 - 100 (not to scale).

When y is small, the back-emission angles (relative to the axis perpendicular to the electron velocity) are not necessarily
small. As y reaches values on the order of 10 and higher, the
backward radiation exhibits the characteristic peaked angular
behavior and the asymmetry between the lobes of emitted radiation
becomes weak.
Figure 6. Radiation pattern
made by a relativistic elec-
tron beam passing through a
metal foil at an angle of 450 BACK WARD taken from Lumpkin a t al. ll'l.
Hopefully, it is now apparent why this configuration is
desired; the back radiation can be easily monitored from a
direction perpendicular to the beam axis, without obstructing the
beam and making possible the use of cameras and other optical
equipment. Also, the image preserves perspective and time
structure.
Fremenaies Above O ~ t u
The above considerations for metal boundaries were in the
limit u < up, which includes optical frequencies, where the dielectric constant (6) is negative. As the frequency of
radiation rises above the plasma frequency, e becomes positive
and the metal no longer reflects the radiation. Note further
that at high frequencies, u >> up, we have e -* 1 and in this
limit, the back emitted intensity given by equation (12) tends to
zero. At high frequencies (in metals and dielectrics) the main
part of the energy emitted as transition radiation is in the

forward direction.
It is important to know if there will be harmful radiation
(e.g. hard x-rays) emerging from this process. In order to
analyze the frequency dependence of the transition radiation, it
is necessary to start at equation (2) and retain the relevant
dependence on €(a For high frequencies a >> up, again the plasma formula (6) applies and e is very nearly 1. Since in this
limit the radiation is mostly forward, the formula for T.R. in
the medium-to-vacuum case (equation 9) will suffice to reveal the
frequency dependence. With the additional limits: /3 -. 1 and 6 <<
1, the spectral intensity per unit solid angle takes the form
Integrating equation (16) over the angles 0, and defining
ucr = yap yields:
dl e2 - - - du nc
The spectrum of frequencies emitted extends up to the order of
act, whereas emission at frequencies a > acr is strongly suppressed by a dependence on frequency as a"4
For the arrangement at UCLA the upper limit ucr = 4 x 10" Hz occurs for a 20 MeV beam (y = 40) incident on metals an = 10'' Hz.
The spectral intensity (normalized to optical intensities) in the
high frequency limit of the TR spectrum for the UCLA parameters
is plotted in figure 7.

High Frequency intensity (scaled to optical intensity)
Figure 7 . The radiation
intensity i n the so f t x-
ray range is already dim- - inished to thousandths of
that of the optical range.
High frequency TR w i l l not
pose a problem for us.
1o16 10" I ola Radiation Frequency
Experimental Considerations OTR A r r a uement and Beam m e t e r s for U C U
An initial OTR configuration for the UCLA beam line is shown
in figure 8, and the parameters, relevant to OTR, for the
electron beam operating in the single shot mode are given
Table 1.
UCLA
in
From electron
gun
retractable OTR foil electron beam axis 1
/ ^ '^ Â¥ ̂ To FEL If" \ wiggler
beam pipe 7 o focusing lens
0 camera
I Figure 8

Table 1 Parameters for the UCLA electron beam.
Pulse repetition rate (fr.J 5 Hz
Peak current 200 Amp
Bunch length (FWHM) 5 psec
Number of electrons per bunch (Me) 1 6 x 10' Typical beam radius (a,) 0.25 mm
Cross-sectional beam area (Ab = 2va-t) 0.39 mm2
(minimum) OTR target radius (R) 0.5 cm
xeild of O~tiaal Photons
The choice of optical detector is determined by the number
of optical photons emitted. Once these radiometric values are
determined they must be compared with the photometric sensitivity
of the detector. Consider a typical camera such as the CoHu CCD
4910 series (I chose this one because we have them immediately
available to us at UCLA). These cameras are substantially
sensitive to light only in the frequency range (2.7 - 4.7) x 10" Hz (see fiugure 9), and have an image area of 6.4 mm x 4.8 nun.
Figure 9. Cohu 4910 sensor spectral response

The luminous sensitivity (photometric units) is rated as follows:
Full video 1.3 lux
80% video 0.1 lux
30% video 0.016 lux
where the 30% video rating is the minimum illuminance that can be
imaged by the camera with the gain amplifier fully on.
The number of photons, generated in the frequency interval
(aI, 0,) from a single electron incident on a metal foil, is
obtained by dividing equation (14) by Tm and integrating over 0:
where a is the fine-structure constant. To obtain the photon
yield per pulse equation (19) is multiplied by N.. For the
frequency range of camera sensitivity, the total number of
photons per pulse
at 20 MeV is 4.9 x lo7,
and at 4.5 MeV is 2.6 x lo7.
The conversion of these values to units of lux (= lumens/m2) is
not straightforward; it involves determining the radiant flux,
@,(Watts), and scaling this value by an efficacy factor K(A) to
find the luminous flux @..(lumens). Then the illuminance (lux) is
the luminous flux per unit projected area, A. An approximate determination of these factors done by ~ o s e n z w e i g ~ ~ ~ ~ yields the
following values for use of the CoHu cameras (standard video RS-
170 scan time = 1/30 sec.) :
/ @. = @,(A) dA(visib1e) = N(photons) x 2.5 eV / (scan time) K(A) - 1/2 K(A),,., = 337 (lumens/Watts)
Since the resolution (vertical direction) is 350 lines (pixels),
the beam spot image area, A, is chosen so that the image size is
at least 10 lines tall. (This is not a very good resolution, but

it will allow us to see something.)
A - 1/30 area of CCJI = 1.02 x 10"~ m2
Finally, the illuminance is given by:
#,,/A = K ( A ) t . / A - N X 8.2 x 10"' lux.
At 20 MeV the illuminance is about 0.2 lux, and at 4.5 MeV it is
about 0.1 lux. With the use of the gain amplifier our cameras
should be able to view a beam spot by focusing on the foil
target. However, in order to observe the angular distribution of
OTR the camera must focus at infinity which greatly decreases the
illuminance. This makes it necessary to use an intensified
camera to image angular distributions.
To give an idea of what the image of an OTR pattern is like,
pictures taken from a paper by Maruyama 9t al.-c161 are included.
Figure 10(a) showa the angular distribution of OTR produced by an
80 MeV electron beam incident on an aluminized quartz plate at an
angle of 45'. Figure 10(b) shows the angular distribution
resulting from the same OTR target, but in this case, the beam
was first passed through a scattering foil to increase the beam
divergence by 1.5 mad.
Figure 10(a) Figure 10(b)
In figure 10(a), the null central intensity is well defined
yielding a 'doughnut' shaped pattern. For the increased

divergence case of figure 10(b), the central 'hole1 is smaller
and the pattern appears more blurred. We see that comparisons of
OTR patterns can provide a means of tuning the angular divergence
of the beam; in this case differences of angular divergences of
only 1.5 mrad can be discriminated with a single OTR foil. A
single OTR pattern can be analyzed to measure the angle at which
the peak intensity occurs, thus providing a fairly close estimate
of the beam energy.
If two foils are used as an OTR interferometer, the beam's
energy and divergence can be measured with much greater
precision. The basic concepts of this mechanism will be
presented at the end of this paper; it is a more involved set-up
than a single foil, and requires an intensified camera. At UCLA
we will start with one foil, and consider interferometry for the
future.
How will OTR affect the beam? (1) Beam Energy Loss
We must consider the energy lost by the beam upon traversing
the target material. There are three principal mechanisms by
which the beam looses energy:
(A) Transition Radiation
The energy lost per electron as TR per interface is found by integrating the total spectral intensity, equation (14), over
frequencies in the interval 0 - t)., (the contribution from higher
frequencies is small) :
For electrons with energies in the MeV range, this is a
negligible energy loss.

(B) Bremsstrahlung Radiation
This is the radiation emitted when moving electrons are
slowed by Coulomb collisions with the atomic nuclei of the
medium. The energy lost by an electron in traversing a thickness
dx of medium is given by ~erkins[~"(valid for relativistic
electrons) :
Where E is the electron energy and Xo is the radiation length of the material. The calculated values of this energy loss in 4
different metals are given in table 2.
(C) Ionization of atoms in the target material
In this process moving electrons transfer energy to the
material by either ionizing or exciting the atoms there. The
energy lost by an electron crossing a thickness dx of medium is
given by the Bethe-Bloch formulat181:
where m, el and v are the mass, charge and velocity of the
electron, respectively, MA is Avogadrots number, Z and A are the
atomic number and mass number of the atoms in the medium, I is an
effective ionization potential (=lo2 eV), p = v/c, and x is the
path length in the medium measured in g/cm2. Equation (22) must
be multiplied by the mass density, p , of the material to obtain a
value in units of energy lost per unit distance of material.
Numerically, (dE/d~)~~" m 1.5 MeV cm^/q, and values for 4
different metals and the plastic, Mylar, are given in table 2.

Also, figure 11 shows the behavior of the three energy loss
mechanisms at higher energies (up to 10 GeV).
Table 2 Beam Energy Losses (values are per electron)
I I I I I I
Beam Energy (MeV)
Figure 11. Beam Energy Loss for the range of energies 10 Mev - 10 GeV.
Polyethylene Terephlalates (CsHiOz), more commonly known by
the commercial name Mylar, is a highly flexible plastic made by
DuPont. This substance may be of interest for OTR because it can

be stretched into very thin sheets with smooth reflecting
surfaces. Also, extremely thin layers ( < 0.5 pm) of any of the metals above (table 2) can be achieved by vacuum deposition of
the substances on the surface of Mylar foils (a few pm thick).
However, the effects of Mylar on the beam, in terms of
Bremsstrahlung radiation and angular divergence (presented next),
have to be investigated further, as a value for the radiation
length, X,, is unknown at this time. Another material which has
not been investigated is Nitro Cellulose. It is brought to
attention by the fact that there are companies which make optical
quality sufaces out of the stuff.
The lower limit on thicknesses of pure metal foils used in
past experiments, was quoted by Wartski et alLtl" at 0.75 pm for
aluminum (manufactured by Goodfellow CO.[~~~).
It is clear that for foil thicknesses of a few microns or
less, the energy losses per electron are not significant,
especially in the lower density materials. - Another affect on the beam that is of critical importance to
the construction of a non-destructive OTR set-up is the
contribution of scattering in the material to the beam's angular
divergence. Obviously we want to maintain a low-divergence beam
for optimal functioning of the FEL and PWFA systems. The
trnsverse dynamics of an electron beam need to be analyzed.
Following a treatment by ~ o s e n z w e i g ~ ~ ~ ~ , the horizontal beam size
at a some point s along the beam line is given by
where fix is a Twiss parametertz2' and ex is the beam emittance. A
similar definition applies for the vertical dimension. The beam

quality aspect of small beam size is small emittance, ex, which
is defined as the area in phase space occupied by the electron
bunch. The nns emittance is defined as:
where the averages (<>) are performed over the beam distribution,
and 6 = dx/ds. With an rms definition of emittance the rms beam
size and inherent beam divergence are, respectively,
The statistical definition of px is therefore B, = <x2>/ex , and the value at the beam waist is denoted by the symbol 6". The rms
divergence can be expressed as
S. Hartmanos simulationc231 of the UCLA gun and linac using
PAKMELA gives a particle distribution from which ex and px can be calculated. It is convenient to work with the normalized
emittance, enom = pfe^, which is a constant with /3 = v/c and f is
the Lorentz factor. For the UCLA electron beam,
enom = 6 x 10'~ m-rad and p' = 0.01 m.
Thus, the inherent beam divergence has the values:
6-(4.5 MeV) 9 8 mrad, and 6,,(20 MeV) 9 4 mrad.
Scattering contributions to the beam angular divergence will add
in squares to the inherent beam divergence for a Gaussian
distribution:
The inherent beam divergence actually goes through a range
of values as the bearnos focus evolves and is controlled by

quadrupole magnets. The positioning of the OTR screen, relative
to the beam focus, can be chosen in a way that minimizes the
perturbation of the beam.
The transverse motion of the electrons, and hence the divergence,
is high when the beam is being focused down in size. This is the
best place for an OTR target to be, because the ratio eScatt / On is a minimum. Whereas, after the focus the electron bunch
profile grows larger decreasing the individual transverse motions
and the inherent divergence, eO. The relative contribution from
target scattering to the total nus divergence, em, is thus
minimized when the target is traversed on the way to a focus;
the total divergence will be closer in value to the inherent
divergence, and the perturbation of the beam will be minimized.
Figure 12. As the electron
bunch passes through a
focus, the beam size
decreases, reaching a
minimum at the focus, and
then increases with
distance from the focus.
As a high-energy charged particle passes through a material,
it experiences some scattering from Coulomb interactions with the
atoms of the material. For an electron of momentum p, traversing
a path length s of material, the nns Coulomb scattering
contribution to angular divergence, is given by ~erkins~~'':
x
where pc is in MeV, p = v/c, and Xn is the radiation length of
the material. Values for different thicknesses of material and

for the two energies relevant at UCLA are given in table 3.
Table 3 Angular divergence from Coulomb scattering
energy+
thickness+
Clearly, at 4.5 MeV we can not hope to preserve a low-divergence
beam, however at 20 MeV foils of aluminum or titanium will
scatter the beam very little, providing a non-perturbative
diagnostic. Note, though, that it is difficult to obtain such
thin samples of titanium, so it seems that aluminum, or perhaps
aluminum-coated Mylar, is the way to go.
Aluminum
Titanium
Silver
feet the taraet m a t e r i m
For the first two processes of beam energy loss considered,
the energy is radiated away from the target. In the third
4.5 MeV
0.5 pm 1 1
process, though, the energy lost by the beam is deposited in the
target and this will have the effect of heating up the material.
Referring to figure 13, the para-
meter, a, represents an effective
radius of the cylindrical volume
intercepted by the beam, such
that 2iru: = ira2. L and R are
the thickness and radius of the
target.
Figure 13. @ Geometry of OTR target.
20 MeV
0.5 pm 1 1
( mrad )
7.8
12.3
25.6
(mrad)
11.1
17.4
36.2
( mrad )
1.8
2.8
5.7
(mrad)
2.5
3.9
8.1

The problem of determining the survivability of the material
is approached by considering two mechanisms: (1) the heat
generated in the target area intercepted by the beam per pulse,
(2) the transfer of heat throughout the target with the average
current density taken into account. Figure 13 is the relevant
geometry for both cases.
(1) Temperature rise of material per pulse The energy deposited in the material must equal the change
in internal energy of the material:
Mylar, Al, and Ti experience only small temperature rises, but we
might be wary of Ag and Au targets.
where p and c are the density and specific heat of the material,
V = ira*~ is the volume of material into which the energy is
deposited, and AT is the change in temperature arising in V. In
(29) AE is the energy deposited by the beam to be found from the
Bethe-Bloch equation, (22):
AE = Ne (dE/dx) inn pL.
AT is then independent of the parameters p and L. Values
calculated for the various materials are presented in table 4.
Table 4 Temperature rise of material per pulse
material
Mylar
Aluminum
Titanium
Silver
Gold
C (J / g°K
1.17
0.897
0.523
0.235
0.129
AT (OK)
0.31
0.41
0.70
1.56
2.84

(2) Long term heating
We treat the problem of heat transfer by conduction in a
cylindrical system with heat source, q. Since we are dealing
with thin targets the temperature dependence along the height of
the cylinder may be neglected. The heat transfer equation that
must be solved for the temperature, T(r), is:
The radius, r, measures the distance from the beam axis in the
range 0 - R, k is the thermal conductivity of the material, and the source q is to be determined as the power per unit volume
that is generated in the material. The power is just the energy
deposited in the material per pulse (from equation (22)) times
the frequency of pulse repetition.
The heat is generated only where the beam intersects the target,
effectively out to a radius r = a, and q = 0 for r > a. Thus,
equation (30) can be solved piece-wise in two regions:
The following boundary conditions are imposed:

Solving for Ti(r) and Ti(r) yields for the temperature change in
region 1:
and in region 2:
The temperature rise in the target is greatest at the beam center
(r = 0); these values are given for various materials in table 5
along with their thermal conductivities, k (Watts / cm°K) The
material densities, p , are also involved in this calculation, and
were presented in table 2.
Table 5 . Temperature rise of material
(due to 1 nC macropulses at 5 Hz)
1 Aluminum .I 2.37 1 0.004 1
material
Mylar
1 Titanium 1 0.22 1 0.07 1 1 silver I 4.27 1 0.009 1
k (W/cm°K
0.003
Over many pulses the metals have no problem because they
conduct the heat appearing in the beam area very quickly to the rest of the target. Mylar has a relatively low specific heat
(see table 4), so in a single pulse not much heat is generated in
a Mylar target. However, Mylar is a very poor conductor, so over
many pulses the heat generated in the beam area is not
transferred to the rest of the target as well as in metals. The
AT(r=O) (OK)
1.83

full solution, combining equations (34) and ( 3 5 ) , is plotted
numerically in figure 14(a) with a log scale in 14(b) to include
Mylar.
1.125 2.25 3.375 4.5
Distance From Beam Center (mm)
Figure
f o i l s .
Radial dependence of temperature rise in
Ã
^ 0.0,
0.009
0) L 3 *
a E i2 1.125 2.25 3.375 4.5
Distance from beam center (mm)
various' OTR target
Figure 14(b). Log scale radial dependence of temperature r ise in various OTR
target f o i l s .

OTB. Interferoaetry Consider the arrangement of two parallel foils at an angle
of 45' to the beam axis. The front face of the second foil acts
as a mirror for the forward OTR produced by the first foil.
These waves will combine in phase with those of the backward OTR
of the second foil since both are produced by the same traversing
electron. What results is an interference pattern of radiation
centered around the direction of specular reflection. The phase
difference between the forward OTR from the first foil and the
backward OTR from the second is
where L is the foil separation, and X is the OTR photon wavelength. The effect is depicted in figure 15, taken from
Feldman pt alG 1251.
PARALLEL FOILS
Figure 15. OTR
interference and
angular dependent
spectral intensity
patterns.
For relativistic electrons the spectral intensity per unit solid angle of the combined radiation from two interfaces is that

of a single foil multiplied by a Fresnel reflection term F($,u)
and by an interference term:
where IJ is the incidence angle. The interference order is:
p = (L/2A) (02 + Y " ~ ) (38)
Figure 16. An example
of a'n OTR interferometer
image, taken from Lumpkin
et al . lZ6' .
The intensity minimum correspond to integer values of p, and the
maximum to half-integer values. The angular radii of the minima
and maxima of the interference fringes is:
For each maximum and minimum of the radiation pattern a value of
the beam energy can be estimated.
If a Gaussian distribution of beam angles, a, is folded in
with equation (37) (or with equation (12)), the spectral
intensity per unit solid angle becomes a function of 6 - a multiplied by a normalized Gaussian distribution term1271:

The integral can be solved analytically to obtain numerical
values of the beam characteristics (for use with either single or
double foil) .

Conclusions
OTR looks promising as an effective non-destructive
diagnostic mechanism for the UCLA electron beam that avoids some
of the short-comings of methods such as phosphor screens and
Cerenkov radiation. Measurements of the beam profile can be
obtained with ordinary CCD cameras, and beam energy and
divergence may be determined by using intensified cameras to
image the OTR angular distribution patterns. Aluminum target
foils of a few pm or less are suitable for use. At 20 MeV such
targets are predicted to survive long-term beam exposure, while
being non-destructive to the beam. At 4.5 MeV, OTR (in any
material) will be useful for beam observation, but not in a non-
destructive manner. A test OTR arrangement using a mirrored
surface quartz plate, inclined at 45' to the beam axis, is
already installed for use with the 4.5 MeV beam. OTR
interferometry is an appealing future option, because much more
information can be extracted from a radiation pattern of many
fringes, than from a single doughnut-shaped ring.
Ackn0WledcreÑanl- The author would like to thank James Rosenzweig for guidance
towards relevant problems considered in the preliminary
calculations for the implementation of OTR, and numerous brief,
and insightful, consultations. Also, thanks to Gil Travish for
help with organization of ideas, guidance in theoretical
development with the utmost of patience, and proof-reading.

References
33
F. Aghamir st alL, Nucl. Inst. and Meth. (1991) NIMO435F.
J.W. Dodd et alc,Intense Laser Beams, Proc. SPIE 1628 (1992)
D.A. Swensen, European Particle Accel. Conf., ed. S.
Tazzari, 2 (Rome, Italy, 1988) 1418-20.
M. Hogan, CAA-TECH-NOTE. June, 1992.
V.L Ginzburg and I.M. Frank, Sov. Phys. JETP 16 (1946), 15.
J.D. Jackson, ~ c t r o d v n a m i c ~ , Wiley (New York,
1975) , 685-6. M.L Ter-Mikaelian, a a h - Enerav E l e c t r w t i c Processes in
Condensed Me-, Wiley-Interscience (New York, 19721, 207.
V.L Ginzburg and V.N. Tsytovich, Phys. Rep. 49 (1979) 1.
V.E. Pafomov, Proceedings P.N. Lebedev Physics Institute,
ed. by D.V. Skolbel'tsyn, Vol 44 (Consultants Bureau, New
York, 1971) 25-157.
J.D. Jackson, pp. 285-9.
A.H. Lumpkin et al%, Nucl. Inst. and Meth. A296 (1990) 151.
V.E. Pafomov, u. L. Wartski 9t alc J. Appl. Phys. 48 (1975) 3646.
A.H. Lumpkin et al., &&. J.B. Rosenzweig, private communication.
X.K. Maruyama, R.B. Fiorito, and D.W. Rule, Nucl. Inst. and
Meth. A272 (1988) 238.
D. Perkins, Introduction To High Enerav Phvsics, Addison-
Wesley (Reading, Massl, 1982) 43.
D. Perkins, &&., 39. L. Wartski u., &j& 3648.
Goodfellow Metals Limited, Ruxley Tower, Claygate-Esher,
Surrey, England.
J.B. Rosenzweig, private communication.
E. Courant and H.S. Snyder, Ann. Phys. 3 (1958) 1.
S. Hartman, CAA-TECH-NOTE-3/91. February, 1991.
D. Perkins, 42.
R.B. Feldman, et ale, Nucl. Inst. and Meth. A296 (1990)194.
A.H. Lumpkin et ale, &j&, 155.