Embed Size (px)
Citation preview

Optical Imaging with HER2-targeted Affibody Molecules can
monitor Hsp90 treatment response in a breast cancer xenograft
mouse model
Stephanie M.W.Y. van de Ven1,2,3, Sjoerd G. Elias1,2,4, Carmel T. Chan1,2, Zheng Miao1,2, Zhen Cheng1,2, Abhijit
De1,2,5, Sanjiv S. Gambhir1,2,6*
1 Department of Radiology, Stanford University Medical Center, Stanford, California, USA
2 Molecular Imaging Program at Stanford (MIPS), Stanford University Medical Center, Stanford, California, USA
3 Department of Radiology, University Medical Center Utrecht, Utrecht, The Netherlands
4 Julius Center for Health Sciences and Primary Care, University Medical Center Utrecht, Utrecht, The Netherlands
5 De Lab, ACTREC, Tata Memorial Centre, Navi Mumbai, Maharashtra, India
6 Department of Bioengineering, Department of Materials Science & Engineering, Stanford University, Stanford, California, USA
Running Title: HER2-targeted optical imaging for treatment monitoring
Type of Manuscript: Original Research
*Corresponding author:
Sanjiv S. Gambhir
Molecular Imaging Program at Stanford
The James H Clark Center
318 Campus Drive; East Wing, 1st Floor
Stanford, CA 94305-5427
Phone: 650-725-2309
Fax: 650-724-4948
Email: [email protected]
Keywords: Optical imaging, molecular imaging, HER2, treatment monitoring, Affibody
Grant support: Dutch Cancer Society (SMWYvdV supported by a travel grant; SGE supported by a fellowship),
NCI ICMIC P50CA114747 (SSG), and NCI RO1 CA082214 (SSG)
Research. on January 6, 2019. © 2012 American Association for Cancerclincancerres.aacrjournals.org Downloaded from
Author manuscripts have been peer reviewed and accepted for publication but have not yet been edited. Author Manuscript Published OnlineFirst on January 10, 2012; DOI: 10.1158/1078-0432.CCR-10-3213

1
Optical Imaging with Her2-targeted Affibody Molecules can
monitor Hsp90 treatment response in a breast cancer xenograft
mouse model
Running Title: Her2-targeted optical imaging for treatment monitoring
Type of Manuscript: Original Research
Keywords: Optical imaging, molecular imaging, Her2, treatment monitoring, Affibody
Research. on January 6, 2019. © 2012 American Association for Cancerclincancerres.aacrjournals.org Downloaded from
Author manuscripts have been peer reviewed and accepted for publication but have not yet been edited. Author Manuscript Published OnlineFirst on January 10, 2012; DOI: 10.1158/1078-0432.CCR-10-3213
2
Translational Relevance:
We showed that optical imaging with Her2-targeted affibody molecules can be used for non-
invasive in vivo imaging of Her2 expression and for monitoring the changes in Her2 expression
as a response to treatment. This emphasizes the potential of optical molecular imaging in high
throughput screening and testing of new drugs in preclinical models. In addition, optical imaging
can play a key role in rapid drug response evaluation in human neoadjuvant breast cancer
treatment both in trials as eventual routine practice, and is likely to outperform treatment
response evaluation based on anatomic changes (RECIST criteria).
Research. on January 6, 2019. © 2012 American Association for Cancerclincancerres.aacrjournals.org Downloaded from
Author manuscripts have been peer reviewed and accepted for publication but have not yet been edited. Author Manuscript Published OnlineFirst on January 10, 2012; DOI: 10.1158/1078-0432.CCR-10-3213
3
Abstract
Purpose: To determine if optical imaging can be used for in vivo therapy response monitoring as
an alternative to radionuclide techniques. For this we evaluated the known Her2 response to 17-
DMAG treatment, a Hsp90 inhibitor.
Experimental design: After in vitro 17-DMAG treatment response evaluation of MCF7 parental
cells and two HER2 transfected clones (Clone A medium, B high Her2 expression), we
established human breast cancer xenografts in nude mice (only parental and clone B) for in vivo
evaluation. Mice received 120 mg/kg of 17-DMAG in 4 doses at 12 hour intervals i.p. (n=14), or
PBS as carrier control (n=9). Optical images were obtained both pre-treatment (day 0) and post-
treatment (day 3, 6, and 9), always 5 hours post-injection of 500 pmol of anti-Her2 Affibody-
AlexaFluor680 via tail vein (with pre-injection background subtraction). Day 3 and 9 in vivo
optical imaging signal was further correlated with ex vivo Her2 levels by western blot after
sacrifice.
Results: Her2 expression decreased with 17-DMAG dose in vitro. In vivo optical imaging signal
was reduced by 22.5% in Clone B (p=0.003) and by 9% in MCF7 parental tumors (p=0.23) at 3
days after 17-DMAG treatment; optical imaging signal recovered in both tumor types at day 6-9.
In the carrier group no signal reduction was observed. Pearson correlation of in vivo optical
imaging signal with ex vivo Her2 levels ranged from 0.73 to 0.89.
Conclusion: Optical imaging with an affibody can be used to non-invasively monitor changes in
Her2 expression in vivo as a response to treatment with an Hsp90 inhibitor, with results similar
to response measurements in PET imaging studies.
Research. on January 6, 2019. © 2012 American Association for Cancerclincancerres.aacrjournals.org Downloaded from
Author manuscripts have been peer reviewed and accepted for publication but have not yet been edited. Author Manuscript Published OnlineFirst on January 10, 2012; DOI: 10.1158/1078-0432.CCR-10-3213
4
Introduction
Molecular imaging is likely to become increasingly important in the drug development process,
both preclinical and clinical, and eventually in treatment response monitoring in routine clinical
practice. Treatment monitoring is of key importance in patient management and drug
development. As contemporary drug development is particularly focussed on targeted drugs,
which are often more cytostatic than cytotoxic, response to treatment as determined by changes
in the anatomy, e.g. shrinkage of tumor size on computed tomography (CT) as commonly
assessed by the Response Evaluation Criteria in Solid Tumors (RECIST) (1), is insufficient.
Furthermore, any anatomical changes occur relatively late in the treatment process and do not
necessarily provide specific information on tissue function and viability. Magnetic resonance
imaging (MRI) can provide additional functional information on blood flow and water diffusion,
but no specific molecular information on early treatment response (2). Radionuclide imaging
techniques such as positron emission tomography (PET) and single photon emission computed
tomography (SPECT) with the use of selective radiotracers could partly offer a solution (3), but
its radioactive components hinder repetitive imaging and tracers are relatively difficult to
generate and expensive. Optical imaging could be a valuable tool for treatment monitoring at the
molecular level. Optical molecular imaging is not yet available as a routine clinical modality,
however optical breast imaging devices using diffuse near-infrared light are currently under
evaluation in clinical studies (4-11). The breast is an accessible target organ for diffuse optical
imaging since light can penetrate deep enough (~5 to 15 cm) into the tissue without having to
pass through other highly absorbing or scattering tissues (such as bone or lung) (12). Optical
imaging is widely used in the preclinical setting and new molecular imaging agents, specifically
targeting cancer-associated molecules, are rapidly being developed (13). The major advantages
Research. on January 6, 2019. © 2012 American Association for Cancerclincancerres.aacrjournals.org Downloaded from
Author manuscripts have been peer reviewed and accepted for publication but have not yet been edited. Author Manuscript Published OnlineFirst on January 10, 2012; DOI: 10.1158/1078-0432.CCR-10-3213
5
of optical imaging are that it uses no ionizing radiation and that the optical imaging probes are
much cheaper and easier to generate than PET tracers. However, optical signal quantification is
challenging and more complex than in PET imaging. We established a preclinical model to study
the feasibility of optical imaging as a molecular imaging tool for treatment monitoring. If signal
quantification is accurate enough to measure known treatment effects, optical imaging of
putative drug targets can play a key role in high throughput screening and testing of new drugs in
preclinical models, an important application area that may help to streamline and speed up the
drug development process. In addition, optical imaging has great potential to be used in clinical
studies for the evaluation of drug treatment. For instance, in the neoadjuvant setting optical
imaging could be used to verify if the tumor responds to the targeted therapy. Optical imaging
could serve as a surrogate endpoint for the evaluation of response to treatment at a very early
stage, and could obviate the need to wait for the RECIST criteria at a later stage. Measuring the
response to treatment is very important in the clinical setting. Not all tumors expressing a certain
target will respond to targeted therapy. For example in a subset of highly human epidermal
growth factor receptor-2 (HER2) positive tumors the response rate to trastuzumab was less than
35% (14). Besides anti-Her2 drugs, one could also apply this strategy to other targeted treatments
and for example use the individual’s response to treatment as an indicator for continued therapy
after surgery (in order to reduce recurrence rate and improve survival). When applied as a
treatment monitoring tool in phase III clinical studies, optical imaging could be used as a
secondary outcome and evaluated as a predictive biomarker for survival.
We decided to use a well-established preclinical model with known variables to evaluate optical
imaging in the application of treatment monitoring. For our xenografts we chose human
epidermal growth factor receptor-2 (Her2) positive human breast cancer cell lines. Her2
Research. on January 6, 2019. © 2012 American Association for Cancerclincancerres.aacrjournals.org Downloaded from
Author manuscripts have been peer reviewed and accepted for publication but have not yet been edited. Author Manuscript Published OnlineFirst on January 10, 2012; DOI: 10.1158/1078-0432.CCR-10-3213

6
overexpression (up to 40-100 fold) is seen in approximately 25-30% of breast cancers and is
associated with aggressive biological behavior (15). Her2 has been thoroughly studied and there
are various imaging agents available that target Her2 (16). In our imaging experiments we chose
to use an affibody for its small size (7KDa) and favorable pharmacokinetic characteristics (17-
19). Recently, this affibody was used to image metastatic breast cancer in humans (20). To
influence the Her2 levels expressed by the tumor cells we decided to use a heat shock protein 90
(Hsp90) inhibitor. Hsp90 is a molecular chaperone responsible for the correct folding,
intracellular disposition, and function of a range of proteins, including oncoproteins (such as
Her2) that are highly expressed or mutated in cancer cells (21). Hsp90 inhibition can induce a
transient degradation of Her2 as has been reported previously (22, 23).
The goal of this study is to determine if optical imaging can be used for in vivo therapy response
monitoring as an alternative to radionuclide techniques. We were able to show in a preclinical
model that optical imaging with a Her2-targeted affibody molecule can be used for non-invasive
assessment of Her2 expression in vivo and for monitoring the Hsp90 treatment effect on Her2
expression in mice bearing human breast cancer xenografts.
Research. on January 6, 2019. © 2012 American Association for Cancerclincancerres.aacrjournals.org Downloaded from
Author manuscripts have been peer reviewed and accepted for publication but have not yet been edited. Author Manuscript Published OnlineFirst on January 10, 2012; DOI: 10.1158/1078-0432.CCR-10-3213

7
Methods
Overview
The affibody was labeled with a fluorophore and cell lines with different levels of Her2
expression were established. In vitro flow cytometry and western blotting experiments were
performed to determine Her2 expression and the effect of the Hsp90 inhibitor on Her2 levels.
Tumor xenografts were then established in mice and in vivo optical imaging experiments were
executed before, and 3, 6, and 9 days after mice were treated with the Hsp90 inhibitor or a carrier
control. At 9 days post-treatment tumors were excised and western blotting was performed to
correlate in vivo optical imaging signal with Her2 expression levels. In a subgroup of 8 mice,
tumors were excised at day 3 to correlate the in vivo imaging signal with Her2 levels when
treatment effect was maximal.
Affibody labeling
The anti-Her2 imaging agent, Affibody molecule ZHer2:342 (7 KDa; Affibody AB, Stockholm,
Sweden) was conjugated with Alexa Fluor 680 C2 Maleimide (Invitrogen, Carlsbad, CA)
following the manufacturer’s protocol (see also supplementary information). The affibody
molecules contain a unique COOH-terminal cysteine residue that allows for site-specific labeling
in a 1:1 ratio. High Performance Liquid Chromatography (HPLC) was used to purify the end
product.
Cell culture
Research. on January 6, 2019. © 2012 American Association for Cancerclincancerres.aacrjournals.org Downloaded from
Author manuscripts have been peer reviewed and accepted for publication but have not yet been edited. Author Manuscript Published OnlineFirst on January 10, 2012; DOI: 10.1158/1078-0432.CCR-10-3213
8
Human breast cancer (MCF7) cells (American Tissue Type Collection, Manassas, VA) innately
expressing low levels of Her2 were transfected with a pcDNA 3.1-puromycin based plasmid
containing full length human HER2/neu cDNA by using superfect and selected with 1 μg/ml
puromycin. After 2 weeks, thirty single colonies were picked, populated separately and screened
for Her2 expression by ELISA, using 15 μg of total protein lysates and following the
manufacturer recommended protocol. Two clones were selected with a medium (Clone A) and a
high (Clone B) expression level of Her2, respectively.
Flow cytometry
MCF7 parental, Clone A, and Clone B cells were characterized using a FACS Calibur system
(Becton Dickinson, San Jose, CA) and the data was analyzed using FlowJo Software (TreeStar,
Inc, Ashland, OR). For each sample, 10 000 events were recorded and the population
corresponding to viable single cells was gated and analyzed as a histogram plot. Experiments
were performed in triplicates (see also supplementary information).
Western Blot
Cell lysis and drug treatment
Approximately 4*106 cells of each cell line were plated overnight in 6 dishes of 10 cm diameter
in 10 ml medium. The following day medium was aspirated and the cells were washed once with
PBS. In 5 dishes of each cell line the Hsp90 inhibitor 17-Dimethylaminoethylamino-17-
demethoxygeldanamycin hydrochloride (17-DMAG, LC Laboratories, Woburn, MA) dissolved
in PBS was added in 5 doses in media, i.e. concentrations of 0.15, 0.30, 0.45, 0.60, and 0.90 µM
Research. on January 6, 2019. © 2012 American Association for Cancerclincancerres.aacrjournals.org Downloaded from
Author manuscripts have been peer reviewed and accepted for publication but have not yet been edited. Author Manuscript Published OnlineFirst on January 10, 2012; DOI: 10.1158/1078-0432.CCR-10-3213
9
respectively, and in the sixth dish medium only was added (dose 0 µM). The drug was allowed to
incubate for 24 hours. After 24 hours, cells were lysed using 300 μL of NP-40 lysis buffer (Cell
Signaling Technology Inc., Danvers, MA) with 1 tablet of protease inhibitor cocktail per 10.5 ml
added (Roche Diagnostic Corporation, Indianapolis, IN). Cells with lysis buffer were incubated
for 10 minutes at 4°C on ice. The cells/lysates were pipetted out of the dishes, transferred into
microcentrifuge tubes and centrifuged at 10 000 g at 4°C for 30 minutes. The supernatant was
collected and the protein concentration was quantified by Protein Dc assay (Bio-Rad
Laboratories, Hercules, CA). Three independent experiments were performed for every treatment
condition.
Tissue lysis
Xenograft tumor tissue from the animal experiments was also lysed and then homogenized and
centrifuged. The supernatant was collected and the protein concentration was quantified by
Protein Dc assay.
SDS PAGE and Blotting
Equal amount of protein from cell or tumor lysates (~30 μg) was used for SDS PAGE and
western blotting (see supplementary information). After incubation with primary antibodies
against Her2 (c-erbB-2 Ab-17, Thermo Fisher Scientific, Fremont, CA) and α-Tubulin (clone B-
5-1-2, Sigma-Aldrich Inc. ), and development of the blot, the protein density bands were
analyzed using ImageJ software (Version 1.41, National Institutes of Health, Bethesda, MD). To
evaluate the protein expression in the different samples, ratios of Her2 and α-Tubulin density
were compared.
Research. on January 6, 2019. © 2012 American Association for Cancerclincancerres.aacrjournals.org Downloaded from
Author manuscripts have been peer reviewed and accepted for publication but have not yet been edited. Author Manuscript Published OnlineFirst on January 10, 2012; DOI: 10.1158/1078-0432.CCR-10-3213
10
Tumor xenografts
All animal experiments were performed in accordance with the federal and local institutional
rules for animal experimentation. Approximately 8 x 10⁶ MCF7 Clone B cells and 5 x 10⁶ MCF7
parental cells in 40 μl PBS were separately suspended with 50 μl Matrigel (BD Biosciences, San
Jose, CA) and implanted subcutaneously on the shoulder region of a female athymic nude mouse
(nu/nu, 6-10 weeks old, Charles River Laboratories, Inc., Wilmington, MA). For each mouse,
Clone B cells were inoculated on the right or the left side, and MCF7 parental cells on the other
side; a β-estradiol 17-valerate pellet (0.5 mg, 60 day release, Innovative Research of America)
was implanted subcutaneously on the neck region to support tumor growth. Tumors were
allowed to grow to a size of 5-10 mm diameter (2-4 weeks) before the mice (28 in total) were
subjected to imaging studies. Tumor sizes were monitored at the imaging days by caliper
measurements of the largest longitudinal (length) and transverse (width) diameter; tumor volume
was then calculated by the formula: tumor volume = 1/2(length × width2). In 8 mice (each with 2
tumors), micro-ultrasound (Vevo 2100, Visualsonics, Toronto, Canada) was performed to obtain
more accurate volume measurements of the tumors. Tumors were measured in three orthogonal
directions at 4 time points up to imaging day 3, and tumor volume was then calculated using the
formula: tumor volume = πxyz/6.
Fluorescence Optical Imaging
Mice were anesthetized with 2% isoflurane in oxygen at 2 l/minute and placed on a heating pad.
Mice were maintained under anesthesia during fluorescence imaging using a time-domain in vivo
small animal fluorescence imager (eXplore Optix, ART Advanced Research Technlogies,
Research. on January 6, 2019. © 2012 American Association for Cancerclincancerres.aacrjournals.org Downloaded from
Author manuscripts have been peer reviewed and accepted for publication but have not yet been edited. Author Manuscript Published OnlineFirst on January 10, 2012; DOI: 10.1158/1078-0432.CCR-10-3213
11
Montreal, Canada)(24). A 670 nm pulsed diode laser was used for excitation. The average power
of the laser was kept at approximately 1 mW at a repetition frequency of 80 MHz. The full width
at half maximum (FWHM) of the laser pulse was approximately 100 ps. A 693 nm long-pass
filter was used to let the emitted fluorescent signal pass through. The eXplore Optix detector is a
fast photomultiplier tube coupled to a time-correlated single-photon counting system for time-
resolved measurements. The overall time resolution of the detection module was approximately
250 ps.
Before injection of the fluorescently labeled affibody, pre-injection images were acquired in
order to remove the auto-fluorescence or background signal later. Mice were injected
intravenously (via the tail vein) with 500 pmol of Affibody-AlexaFluor680 dissolved in PBS in a
total volume of 150 µl. Post-injection images were acquired after 5 hours as based on pilot data
(best signal-to-background ratios). Mice were positioned on their left and right sides
successively, each time adjusting the table height to allow for optimal fluorescence imaging of
each tumor. The field of view was adjusted for each scan so that the entire tumor including some
surrounding tissue was imaged (~200 - 300 mm2). The scan resolution was 1.0 x 1.0 mm (i.e.
scan step size of 1.0 mm in both x and y directions). Acquisition time varied between 3 and 9
minutes for each scan.
Images were analyzed using the Optiview software, Version 2.02 (ART Advanced Research
Technlogies, Montreal, Canada). First, the pre-injection image was used to remove the
background auto fluorescence signal. Then, a region of interest (ROI) was drawn around the
tumor. Average normalized counts were calculated for each ROI. In pilot studies the coefficient
of variation (COV) for the average normalized counts was determined. In six imaging sessions,
Research. on January 6, 2019. © 2012 American Association for Cancerclincancerres.aacrjournals.org Downloaded from
Author manuscripts have been peer reviewed and accepted for publication but have not yet been edited. Author Manuscript Published OnlineFirst on January 10, 2012; DOI: 10.1158/1078-0432.CCR-10-3213
12
Clone B xenografts were imaged thrice at approximately 5 hours after a single affibody injection.
For each scan the mice were repositioned, the imaging system was readjusted, and average
normalized counts were independently assessed.
Imaging procedures were started when tumors were ~5-10 mm in size. First, pre-treatment
images were taken (Day 0). Then, mice were divided into two groups. One group (n=14)
received treatment with 17-DMAG, 120 mg/kg dissolved in PBS in 4 doses intraperitoneal at 12
hour intervals, as described in Schwock et al. (25). The other group (n=9) received only the
carrier, PBS, intraperitoneally in an equal volume. After treatment, fluorescence optical imaging
was performed at Days 3 (60 hours after the first treatment injection), 6, and 9. This time interval
ensured complete clearance of previous affibody injections as determined in a pilot study and as
confirmed on the pre-injection images performed on each imaging day. A subgroup of 5 mice
were only imaged once and did not undergo any treatment; these were used to collect more data
for the correlation of the in vivo imaging signal with the Her2 expression as measured ex vivo.
After the study procedures, the mice were euthanized by cervical dislocation and the tumors
were isolated, frozen on dry ice, and stored at -80°C for tissue lysis and western blotting. At day
3, 8 mice (4 received the treatment and 4 the carrier) were sacrificed to correlate the in vivo
imaging signal with the Her2 expression ex vivo. At day 9, we experienced difficulties
performing the tail vein injection in one of the mice in the carrier group, leading to
administration of only a small amount of the imaging agent. Also, two Clone B tumors in the 17-
DMAG treated group had shrunken to volumes too small to measure by caliper (< 10 mm3) at
day 9. Therefore, the respective images and tissue samples were left out of further analyses.
Research. on January 6, 2019. © 2012 American Association for Cancerclincancerres.aacrjournals.org Downloaded from
Author manuscripts have been peer reviewed and accepted for publication but have not yet been edited. Author Manuscript Published OnlineFirst on January 10, 2012; DOI: 10.1158/1078-0432.CCR-10-3213

13
Statistical Analysis
Data are presented as absolute numbers and means ± standard errors. For in vitro analyses,
independent samples T-tests were used to test the differences within the cell lines for each drug
dose compared to the non-treated cells. For in vivo analyses, independent samples T-tests were
used to test the difference in optical imaging signal between the carrier and the 17-DMAG
treated groups. Paired samples T-tests were used to test the differences within groups between
imaging days (pre- and post-treatment). Correlation was determined with Pearson’s correlation
coefficient after the data was log transformed to obtain a normal distribution. All tests were two-
sided and a p-value ≤ 0.05 was considered significant. The software package SPSS 16.0 (SPSS
Inc., Chicago, IL, USA) was used for the statistical computations.
Research. on January 6, 2019. © 2012 American Association for Cancerclincancerres.aacrjournals.org Downloaded from
Author manuscripts have been peer reviewed and accepted for publication but have not yet been edited. Author Manuscript Published OnlineFirst on January 10, 2012; DOI: 10.1158/1078-0432.CCR-10-3213

14
Results
In vitro Her2 expression levels are down-regulated by 17-DMAG
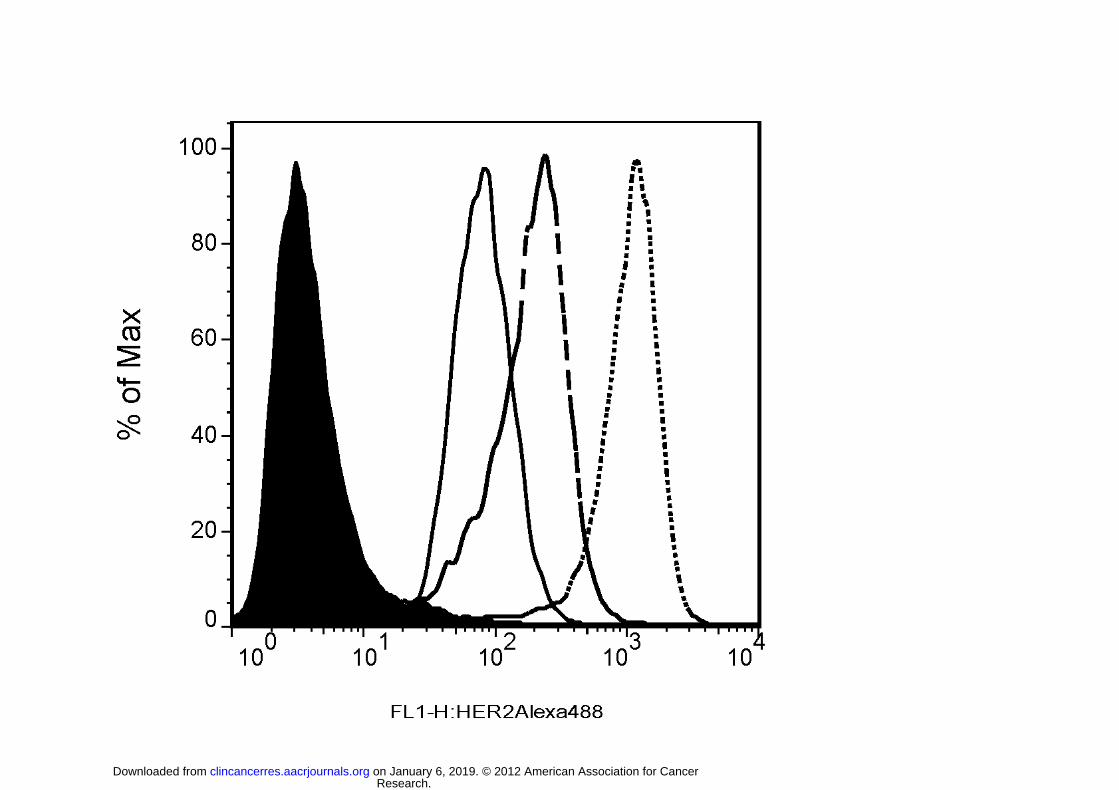
Flow cytometry results showed that the three cell lines, MCF7 parental, Clone A, and Clone B,
have low, intermediate, and high expression levels of Her2, respectively, and consist of pure
populations (Figure 1). Western blot results confirmed these relative Her2 protein differences.
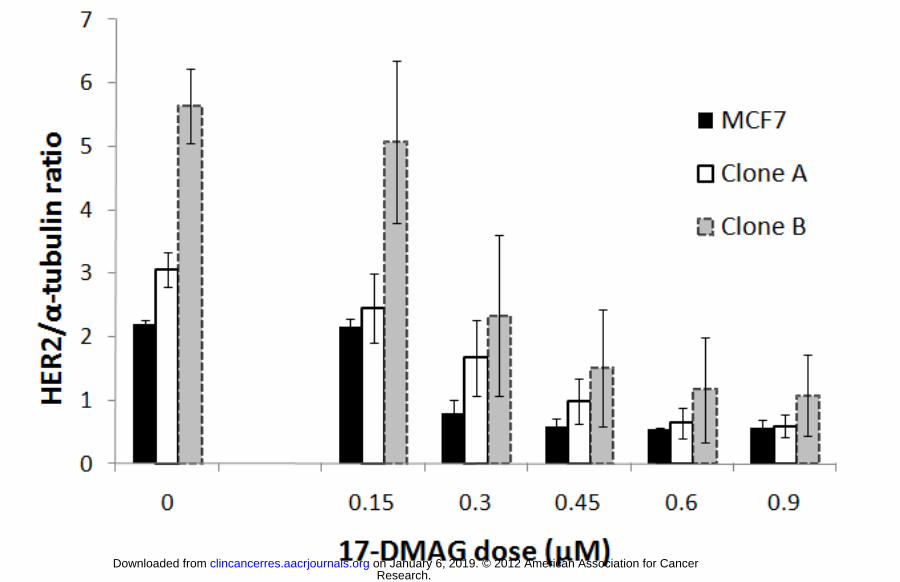
Furthermore, Her2 expression decreased dependent on the 17-DMAG dose (Figure 2). Her2
down-regulation at 0.45 µM 17-DMAG compared to non-treated cells was 74 ± 5% for MCF7
parental cells (p = 0.0003), 66 ± 14% for Clone A cells (p = 0.010), and 72 ± 17% for Clone B
cells (p = 0.019).
Optical imaging signal transiently decreases in living mice in response to 17-DMAG treatment
Before treatment was initiated, optical imaging confirmed that the overall mean optical imaging
signal (average counts) was significantly higher for Clone B tumors than for MCF7 parental
tumors (6402 vs. 2759 counts/mm2; p = 0.0008). Furthermore, imaging each tumor thrice, 5
hours after a single injection of affibody and after repositioning the mice, re-adjusting the
imaging device and independently assessing the average counts for each exam, yielded an
average coefficient of variation of 5.9% (N=6) supporting the reproducibility of the optical
imaging technique.
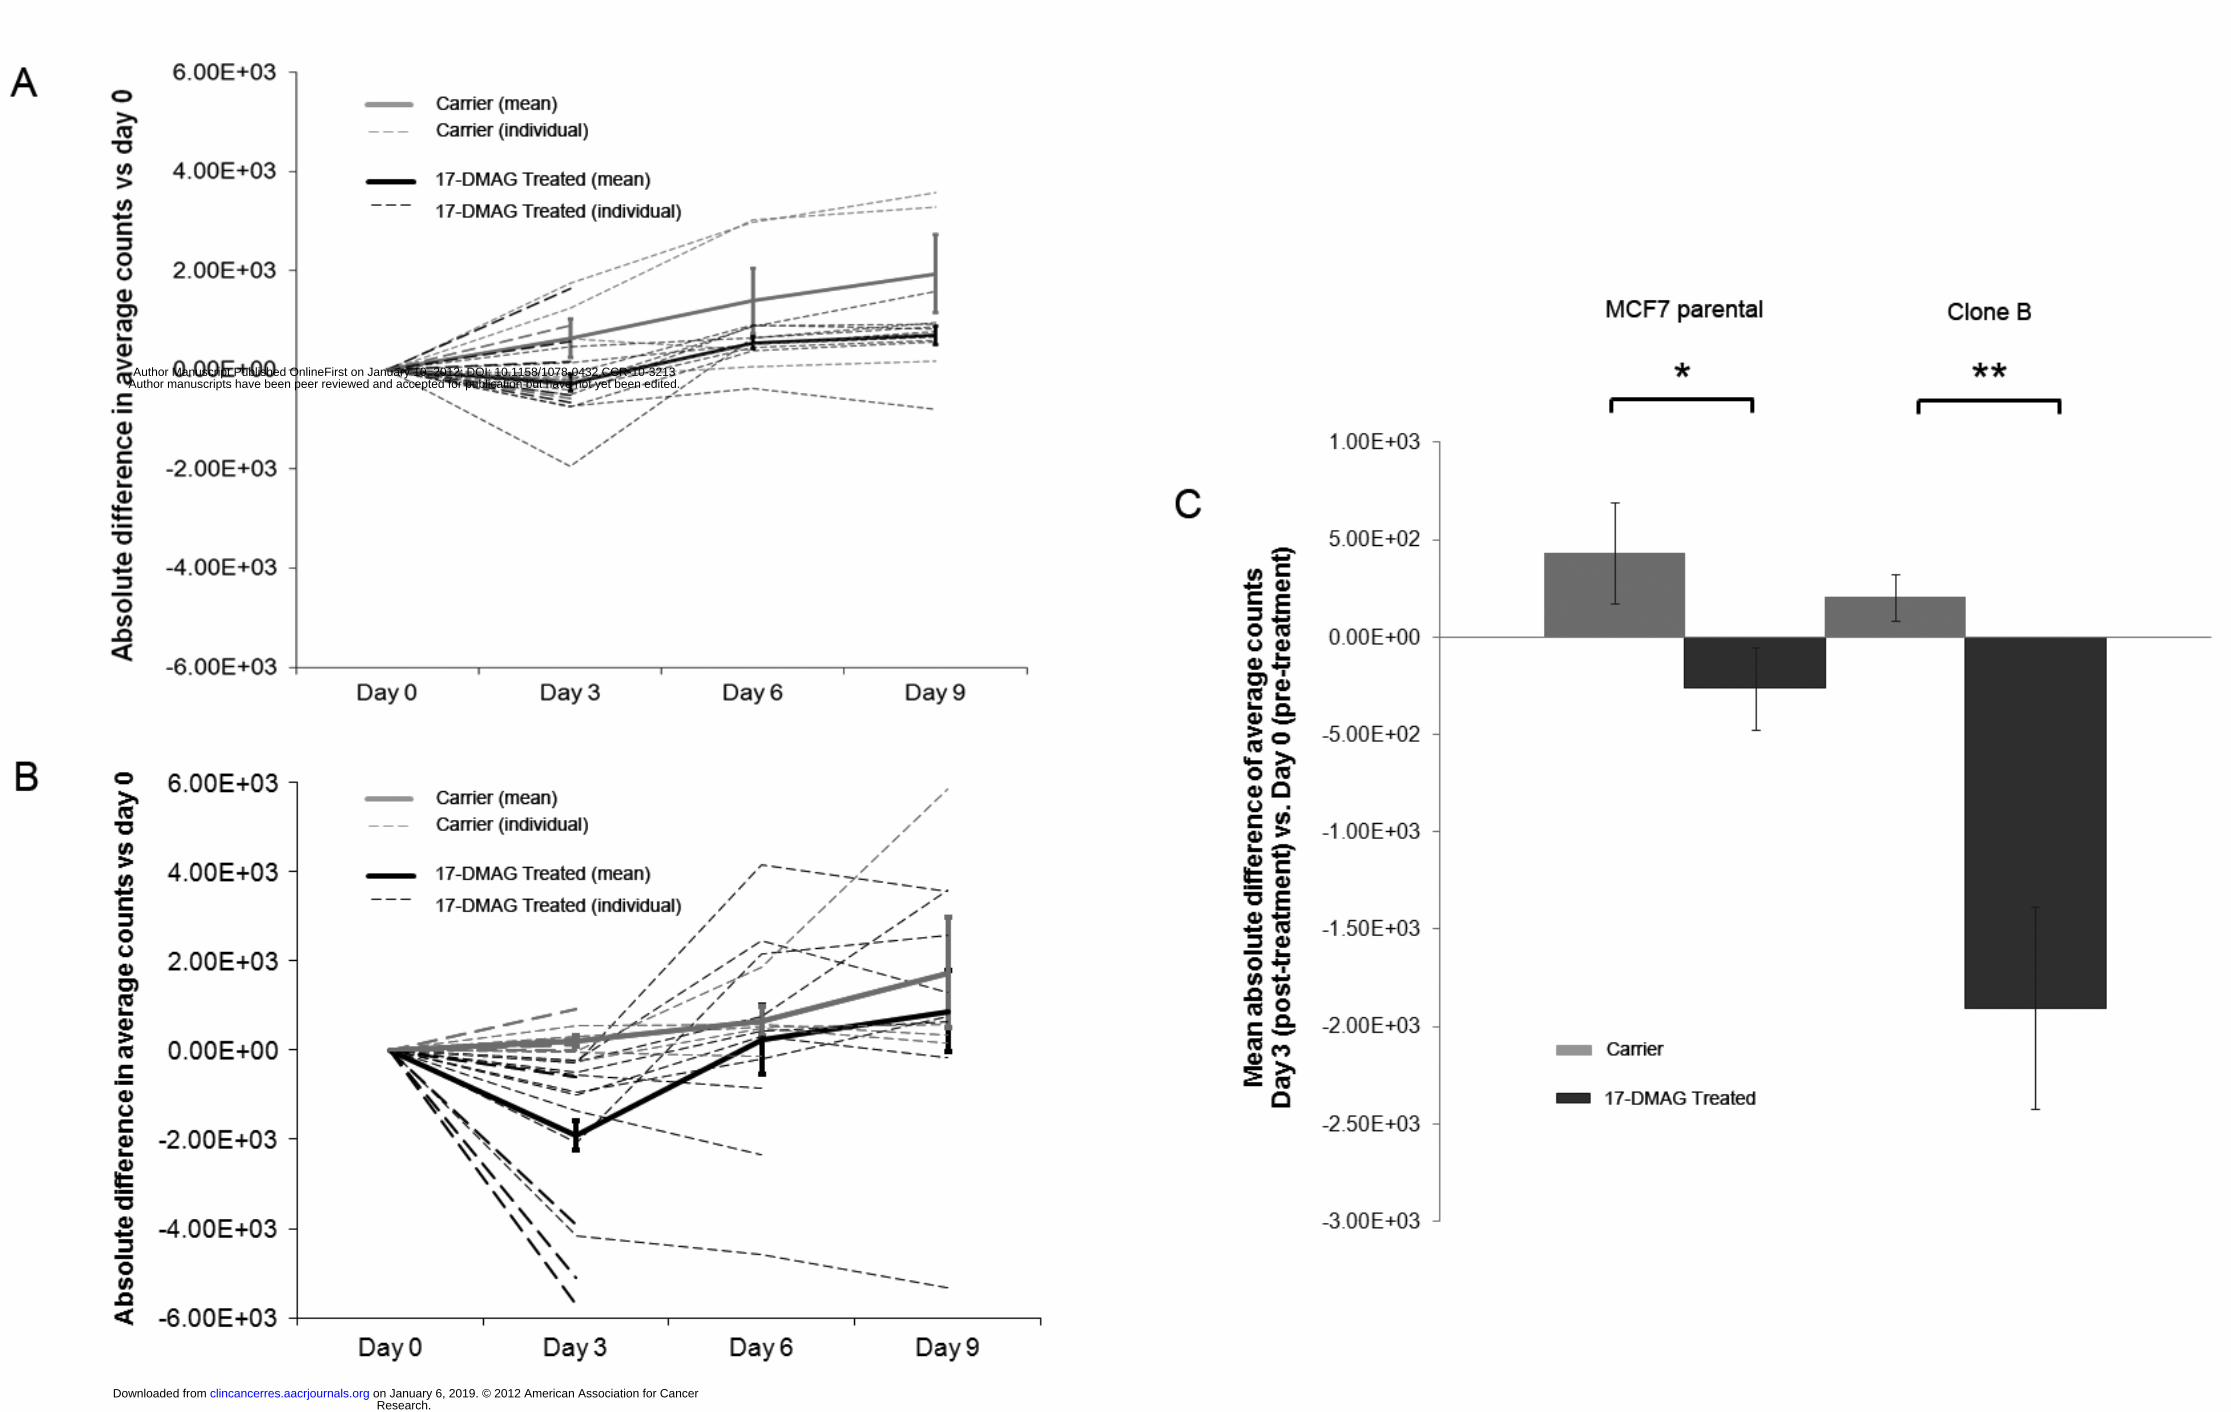
Optical imaging signal for Clone B tumors dropped significantly in the 17-DMAG treated group
to 77.5 ± 4% at day 3 compared to pre-treatment (p = 0.003), then increased again to 106 ± 14%
at day 6 and 135 ± 22% at day 9. In the carrier group, the optical imaging signal did not drop
after carrier treatment but slightly increased to 109 ± 5% at day 3 compared to pre-treatment (p =
0.128), 123 ± 10% at day 6, and 142 ± 17% at day 9 (Figure 3B). The same trend, although not
Research. on January 6, 2019. © 2012 American Association for Cancerclincancerres.aacrjournals.org Downloaded from
Author manuscripts have been peer reviewed and accepted for publication but have not yet been edited. Author Manuscript Published OnlineFirst on January 10, 2012; DOI: 10.1158/1078-0432.CCR-10-3213
15
statistically significant, was seen for the MCF7 parental tumors. MCF7 parental signal decreased
compared to pre-treatment in the 17-DMAG treated group to 91 ± 6% at day 3 (p = 0.23), then
increased again to 128 ± 7% at day 6, and 134 ± 9% at day 9 (Figure 3A). In the carrier group the
optical imaging signal increased to 118 ± 10% at day 3 compared to pre-treatment (p = 0.137),
153 ± 24% at day 6, and 172 ± 30% at day 9. Figure 3C summarizes the statistically significant
17-DMAG treatment effect (day 3 post vs. day 0 pre) between the 17-DMAG treated group and
the carrier group for both MCF7 parental (p = 0.05) and Clone B (p = 0.004) tumors.
Comparisons between the treatment and carrier groups for both tumor types at later time-points
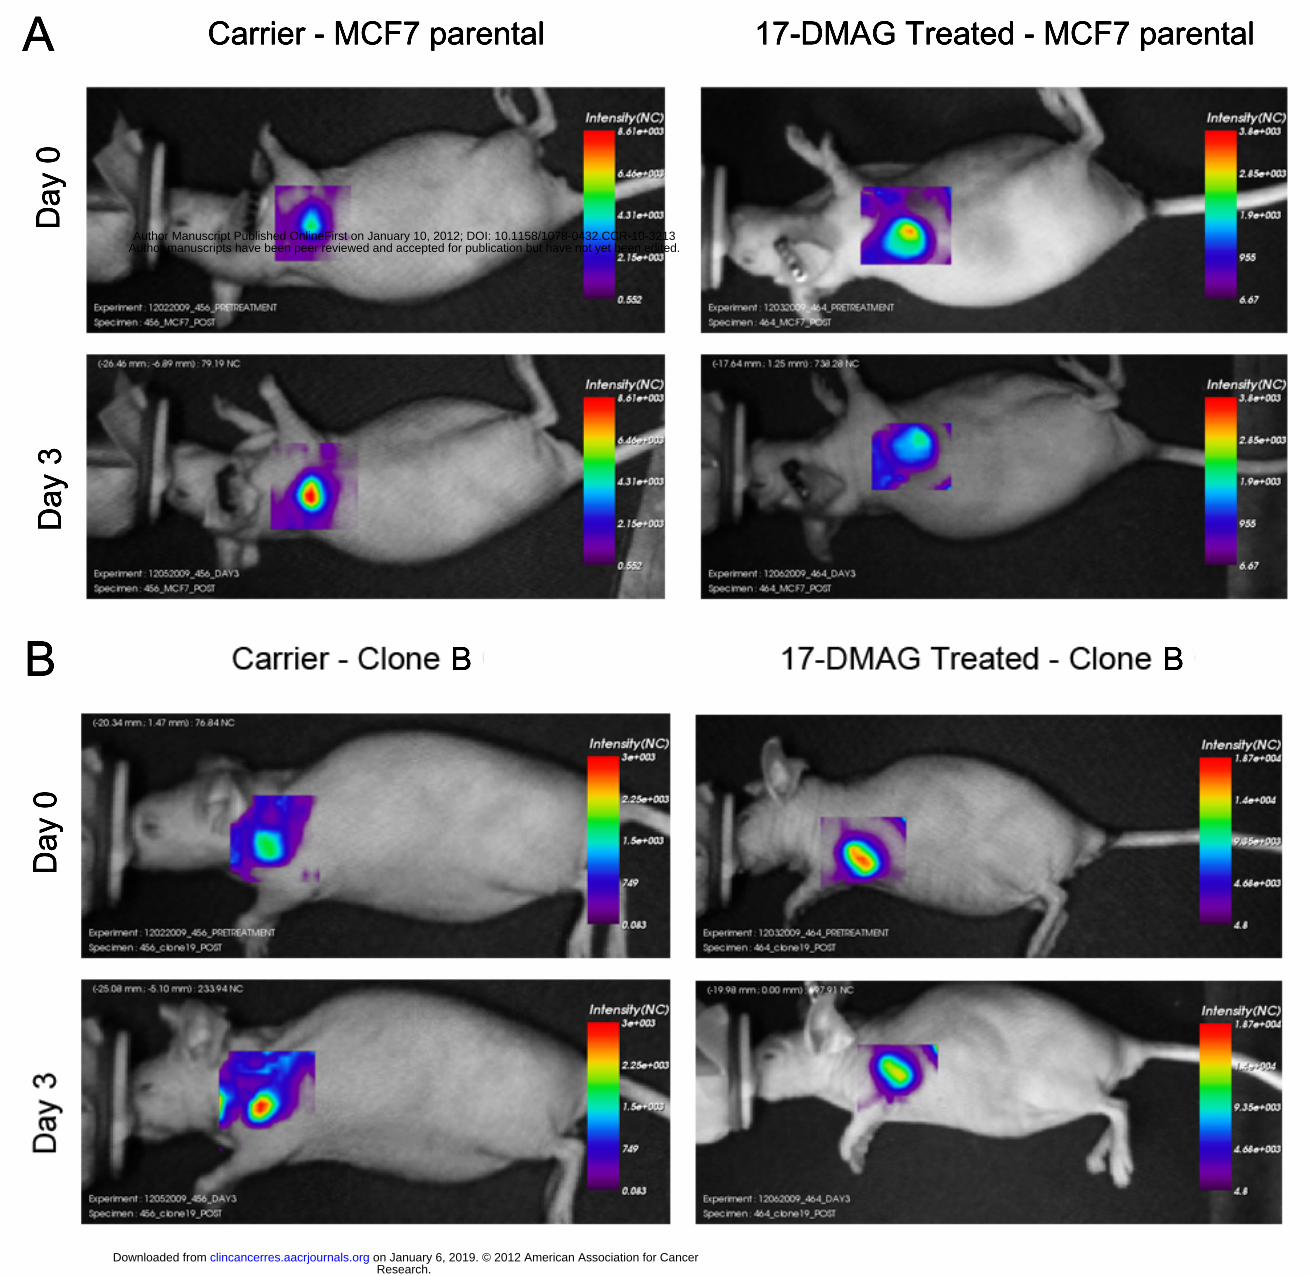
were not statistically significant. Figures 4A (MCF7 parental) and 4B (Clone B) exemplify the in
vivo optical images pre- and post-treatment, showing a decrease in optical imaging signal for the
17-DMAG treated mice and an increase in optical imaging signal for the carrier mice on day 3
compared to day 0.
In contrast to the significant effects as assessed by in vivo molecular imaging, no significant
changes in tumor volume were measured after 17-DMAG treatment up to 9 days post treatment,
neither for Clone B, nor for MCF7 parental tumors (see supplementary information).
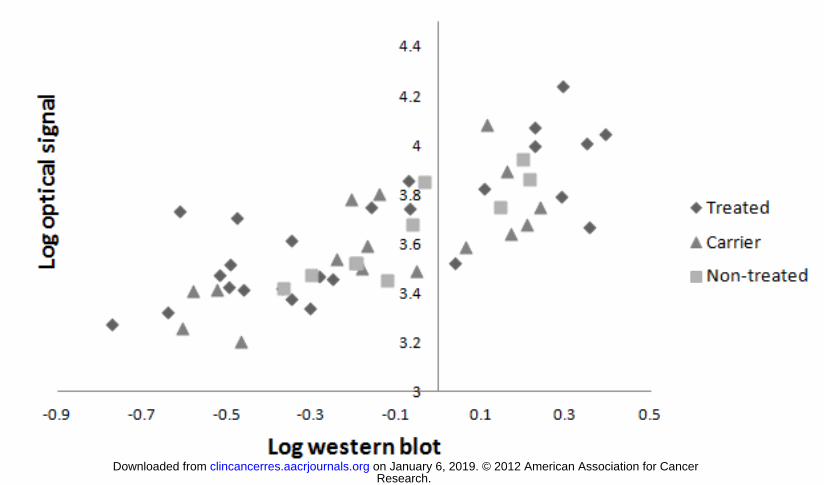
Ex vivo Her2 expression levels correlate with in vivo optical imaging signal
In a total of 28 mice with two tumors each (MCF7 parental and Clone B) were sacrificed and the
tumor tissue was surgically removed and processed for western blotting. A total of 52 tumors
were available for determining the correlation of ex vivo Her2 levels with in vivo optical imaging
signal (see methods); 16 tumors were removed at day 3 after treatment, and 36 at day 9 after
treatment. The overall Pearson correlation was 0.77, and for subgroups it ranged from 0.73 to
0.89; correlation was 0.73 for the treated and 0.85 for the carrier group at day 3 (Figure 5).
Research. on January 6, 2019. © 2012 American Association for Cancerclincancerres.aacrjournals.org Downloaded from
Author manuscripts have been peer reviewed and accepted for publication but have not yet been edited. Author Manuscript Published OnlineFirst on January 10, 2012; DOI: 10.1158/1078-0432.CCR-10-3213

16
Discussion
We have shown that optical imaging with an affibody can be used to non-invasively monitor
changes in Her2 expression in vivo as a response to treatment with a specific Hsp90 inhibitor,
whereas effects of the therapy on tumor volume were limited during the study period and
statistically non-significant. Results of this study are very promising for the use of optical
imaging as a molecular imaging tool for treatment monitoring in a clinical setting. This is the
first work we know of to show the feasibility of optical imaging in the visualization of the
response to Hsp90 therapy at a molecular level in living subjects. Affibody molecules have been
used successfully in optical imaging studies before, for instance by Lee et al. targeting Her2 in a
mouse model (26), but the feasibility of treatment monitoring with the affibody in optical
imaging studies has not been addressed yet. Other research groups have demonstrated the
potential of target-specific radiotracers in PET imaging to measure the treatment effects on
molecular targets (27-29). Smith-Jones et al. monitored Her2 changes after treatment with a
Hsp90 inhibitor (17-AAG) using PET imaging with 68Ga-labelled trastuzumab F(ab’)2 fragments
(27). They found a reduction in tumor uptake of 70% in BT474 breast tumor xenografts. The
reduced uptake lasted until 5 days after treatment. Her2 levels were not determined ex vivo, only
imaging studies were performed. Oude Munnink et al. used PET imaging with full length 89Zr-
labelled trastuzumab to measure Her2 down-regulation after treatment with a Hsp90 inhibitor
(NVP-AUY922) in SKOV-3 ovarian tumor xenografts (28). They reported a reduction in tumor
uptake of 41%. Immunohistochemistry confirmed the decrease in Her2 expression ex vivo in a
qualitative way only. Kramer-Marek et al. measured changes in Her2 expression after 17-DMAG
treatment using the same affibody as we used in our study, but instead of using optical imaging
they labeled the affibody with 18F for PET imaging and only performed a single pre- and post-
Research. on January 6, 2019. © 2012 American Association for Cancerclincancerres.aacrjournals.org Downloaded from
Author manuscripts have been peer reviewed and accepted for publication but have not yet been edited. Author Manuscript Published OnlineFirst on January 10, 2012; DOI: 10.1158/1078-0432.CCR-10-3213

17
treatment scan (29). They reported a reduction of 33% in a MCF7 cell line transfected with Her2
(Clone 18) and of 71% in BT474 breast tumor xenografts. Her2 downregulation was confirmed
ex vivo by western blot and ELISA.
Both Oude Munnink et al. and Kamer-Marek et al. compared a single post-treatment
measurement with pre-treatment. Her2 expression was not monitored over a longer period of
time. The strength of our study is that we followed each mouse over 10 days, which enabled us
to see the Her2 levels decrease after treatment and recover after the treatment was stopped
(which is in line with data from Smith-Jones et al. (27)). This indicates that we can monitor the
molecular changes non-invasively over time with our optical imaging strategy, whereas we did
not observe significant changes in tumor volume during the study. Our in vivo results of 22.5%
signal reduction are consistent with the previous reports, considering that different cell lines were
used for the tumor xenografts and that the imaging technique used was also different. In addition,
correlating in vivo optical imaging signal with ex vivo Her2 levels by western blotting further
supported our results. Although tumor volume did not change significantly after 17-DMAG
treatment, in 2 of the 17-DMAG treated mice the Clone B tumors shrunk to very small volumes
at day 9. To confirm that the changes in optical imaging signal were due to a decrease in Her2
expression levels and not caused by other non-specific anti-tumor effects of the drug, we
correlated the in vivo optical imaging signal with the ex vivo Her2 expression levels not only at
day 9, but also at day 3 in a subgroup of 8 mice. In that group we also closely monitored the
tumor volume by ultrasound measurements up to day 3, and confirmed that there was no
decrease in tumor volume after treatment (supplementary information). Results indicate that the
measured changes in optical imaging signal reflect the changes in Her2 expression after drug
treatment.
Research. on January 6, 2019. © 2012 American Association for Cancerclincancerres.aacrjournals.org Downloaded from
Author manuscripts have been peer reviewed and accepted for publication but have not yet been edited. Author Manuscript Published OnlineFirst on January 10, 2012; DOI: 10.1158/1078-0432.CCR-10-3213
18
An important advantage of optical imaging in comparison with PET imaging is that it does not
use radioactive components or ionizing radiation and can thus be used more frequently. An
additional advantage is that optical imaging agents are easier to generate and much cheaper than
PET tracers. In contrast to radionuclide imaging approaches where over time the imaging signal
disappears as a result of natural decay in addition to clearance from the subject, in optical
imaging the clearance of the imaging signal is predominantly dependent on clearance of the
imaging probe from the body. For this reason, small molecules with quick clearance, such as
affibody molecules, may be preferable over large molecules in optical imaging. In addition, pre-
injection optical signal can be measured and subtracted from subsequent imaging exams in
optical imaging to adjust for the residual signal as done in this work.
Limitations of optical imaging include its limited spatial resolution and the complexity of its
image reconstruction/quantitation. These aspects make it difficult to draw ROIs precisely around
the tumor border. Chances are that different observers would draw ROIs differently. To evaluate
if this would influence the results of our study, two different sizes of ROIs were also drawn
besides the medium ROI we used for the primary results (an ROI drawn as accurately as possible
around the apparent tumor border): a very small ROI in the center of the tumor, and a very large
ROI around the entire tumor including some surrounding normal tissue. Average counts of all of
these ROIs were calculated at all imaging time points. We found comparable differences in
optical imaging signal post- and pre-treatment for all ROI sizes (see supplementary information).
This implies that the interpretation of the signal changes was not importantly influenced by the
manner in which the ROI was drawn. Another limitation of the relatively low spatial resolution is
that partial volume effects can lead to inaccurate optical imaging signals in very small lesions
compared to the system’s spatial resolution.
Research. on January 6, 2019. © 2012 American Association for Cancerclincancerres.aacrjournals.org Downloaded from
Author manuscripts have been peer reviewed and accepted for publication but have not yet been edited. Author Manuscript Published OnlineFirst on January 10, 2012; DOI: 10.1158/1078-0432.CCR-10-3213
19
Quantification of optical imaging signal is more complicated as compared to PET imaging in
which percentage injected dose per gram of tissue can be calculated. Due to the fairly large
background signal (noise) in vivo, the correlation between in vivo and in vitro results is relatively
limited. However, our results support that relative signal quantification with the right optical
imaging set up is achievable and in the range of Oude Munnink et al. and Kamer-Marek et al.
(28, 29), and that it is thus feasible to semi-quantitatively measure molecular changes over time
using optical imaging.
In ongoing studies we are evaluating other molecular imaging agents, such as engineered
antibodies and peptides, in the same xenograft model to make better comparisons between the
different imaging agents. We aim to translate (one or more of) these molecular imaging agents to
clinical studies. For clinical applications, deeper light penetration is required and therefore it will
be advantageous to conjugate the targeted agents to a near-infrared dye with excitation
wavelengths above 700-750 nm, for example IRdye 800CW (LI-COR Biosciences, Lincoln,
NE), which has already been registered with the European regulatory authorities and the United
States Food and Drug Administration in anticipation of clinical trials. Future preclinical studies
will also include administering 17-DMAG more than once to repeatedly monitor the transient
effect on Her2 expression over time, and investigating whether repeated probe injection within
hours yields reproducible imaging results after pre-injection background subtraction to adjust for
residual probe levels. If possible, we will be able to show the reproducibility of the entire optical
imaging procedure, and not only from probe injection onwards which we showed to be highly
reproducible (average COV 5.9%). This will give a better understanding of the magnitude of
effects that can be measured with this optical imaging assay.
Research. on January 6, 2019. © 2012 American Association for Cancerclincancerres.aacrjournals.org Downloaded from
Author manuscripts have been peer reviewed and accepted for publication but have not yet been edited. Author Manuscript Published OnlineFirst on January 10, 2012; DOI: 10.1158/1078-0432.CCR-10-3213

20
In conclusion, optical imaging with an affibody can be used for non-invasive in vivo imaging of
Her2 expression and for monitoring the changes in Her2 expression as a response to treatment.
This makes optical imaging a promising molecular imaging tool for treatment monitoring in
preclinical models and potentially in patients.
Research. on January 6, 2019. © 2012 American Association for Cancerclincancerres.aacrjournals.org Downloaded from
Author manuscripts have been peer reviewed and accepted for publication but have not yet been edited. Author Manuscript Published OnlineFirst on January 10, 2012; DOI: 10.1158/1078-0432.CCR-10-3213

21
Acknowledgements We would like to thank the Dutch Cancer Society (SMWYvdV supported by a travel grant; SGE
supported by a fellowship), NCI ICMIC P50CA114747 (SSG), and NCI RO1 CA082214 (SSG)
for financial support.
Research. on January 6, 2019. © 2012 American Association for Cancerclincancerres.aacrjournals.org Downloaded from
Author manuscripts have been peer reviewed and accepted for publication but have not yet been edited. Author Manuscript Published OnlineFirst on January 10, 2012; DOI: 10.1158/1078-0432.CCR-10-3213

22
Figure Legends Figure 1. Flow cytometry results showed low (MCF7 parental; ���), intermediate (Clone A;
���), and high (Clone B; ∙∙∙∙∙) expression levels of Her2, respectively, in comparison with the
control MCF7 parental cells (filled black) that were only stained with the secondary
(nonspecific) antibody. The single peaks for each sample indicate pure cell populations.
Figure 2. Western blots confirmed low (MCF7 parental) intermediate (Clone A) and high (Clone
B) Her2 expression. On the left (no 17-DMAG, dose 0), samples of 3 experiments were loaded
into 1 gel to show the standard error of the mean. Her2 expression decreased dependent on the
17-DMAG dose added to the cells (incubation time was 24 hours). Data was normalized to the
mean Her2 expression for each cell line at dose 0 in the same gel. All experiments were repeated
3 times. Results are statistically significant (p < 0.05) from 0.45 µM for Clone B and Clone A,
and from 0.30 µM for MCF7 parental cells. Error bars represent the standard error of the mean.
Figure 3. Absolute difference in average counts for MCF parental (A) and Clone B tumors (B):
Treatment vs. Carrier compared to Day 0 (pre-treatment). At Day 0, mean average counts/mm2
were 2759 for MCF7 parental (A) and 6402 for Clone B tumors (B). Dashed lines represent the
individual mice, solid lines the mean and error bars the standard error of the mean. Both MCF7
parental tumors (A) and Clone B tumors (B) showed a significant decrease in average counts at
Day 3 for the 17-DMAG treated compared to the carrier group (p = 0.05 and p = 0.004,
respectively). At day 3, optical imaging signal was reduced by 9% in 17-DMAG treated MCF7
parental tumors (p = 0.23) and by 22.5% in Clone B tumors (p = 0.003); signal recovered at day
6-9. Mean absolute difference in average counts of Day 3 (post-treatment) vs. Day 0 (pre-
treatment) is also shown separately (C). Optical imaging signal decreased significantly for the
Research. on January 6, 2019. © 2012 American Association for Cancerclincancerres.aacrjournals.org Downloaded from
Author manuscripts have been peer reviewed and accepted for publication but have not yet been edited. Author Manuscript Published OnlineFirst on January 10, 2012; DOI: 10.1158/1078-0432.CCR-10-3213

23
17-DMAG treated mice compared to the carrier mice for both MCF7 parental (* p = 0.05) and
Clone B (** p = 0.004) tumors. Error bars represent the standard error of the mean.
Figure 4. Examples of in vivo optical imaging results of mice bearing MCF7 parental (A) and
Clone B tumor xenografts (B). Images were obtained before (day 0) and after (day 3) treatment
with 17-DMAG or carrier control.
Figure 5. Correlation between ex vivo Her2 levels by Western and in vivo optical imaging signal.
Pearson’s correlation coefficient was 0.77 (y = 0.60x + 3.72) for the total group of tumors
(n=52); 0.74 (y = 0.52x + 3.75) for the treated group at day 9 (n=18); 0.84 (y = 0.82x + 3.80) for
the carrier group at day 9 (n=8); 0.73 (y = 1.01x +3.69) for the treated group at day 3 (n=8); 0.85
(y = 0.45x + 3.62) for the carrier group at day 3 (n=8); and 0.89 (y = 0.74x + 3.70) for the non-
treated group (n=10).
Research. on January 6, 2019. © 2012 American Association for Cancerclincancerres.aacrjournals.org Downloaded from
Author manuscripts have been peer reviewed and accepted for publication but have not yet been edited. Author Manuscript Published OnlineFirst on January 10, 2012; DOI: 10.1158/1078-0432.CCR-10-3213

24
References
1. Eisenhauer EA, Therasse P, Bogaerts J, Schwartz LH, Sargent D, Ford R, et al. New
response evaluation criteria in solid tumours: revised RECIST guideline (version 1.1). Eur J
Cancer. 2009;45: 228-47.
2. Woodhams R, Kakita S, Hata H, Iwabuchi K, Kuranami M, Gautam S, et al.
Identification of residual breast carcinoma following neoadjuvant chemotherapy: diffusion-
weighted imaging--comparison with contrast-enhanced MR imaging and pathologic findings.
Radiology.254: 357-66.
3. Wahl RL, Jacene H, Kasamon Y, Lodge MA. From RECIST to PERCIST: Evolving
Considerations for PET response criteria in solid tumors. J Nucl Med. 2009;50 Suppl 1: 122S-
50S.
4. van de Ven S, Wiethoff A, Nielsen T, Brendel B, van der Voort M, Nachabe R, et al. A
novel fluorescent imaging agent for diffuse optical tomography of the breast: first clinical
experience in patients. Mol Imaging Biol. 2010;12: 343-8.
5. van de Ven SM, Elias SG, Wiethoff AJ, van der Voort M, Nielsen T, Brendel B, et al.
Diffuse optical tomography of the breast: preliminary findings of a new prototype and
comparison with magnetic resonance imaging. Eur Radiol. 2009;19: 1108-13.
6. Zhu Q, Cronin EB, Currier AA, Vine HS, Huang M, Chen N, et al. Benign versus
malignant breast masses: optical differentiation with US-guided optical imaging reconstruction.
Radiology. 2005;237: 57-66.
Research. on January 6, 2019. © 2012 American Association for Cancerclincancerres.aacrjournals.org Downloaded from
Author manuscripts have been peer reviewed and accepted for publication but have not yet been edited. Author Manuscript Published OnlineFirst on January 10, 2012; DOI: 10.1158/1078-0432.CCR-10-3213

25
7. Cerussi A, Hsiang D, Shah N, Mehta R, Durkin A, Butler J, et al. Predicting response to
breast cancer neoadjuvant chemotherapy using diffuse optical spectroscopy. Proceedings of the
National Academy of Sciences of the United States of America. 2007;104: 4014-9.
8. Rinneberg H, Grosenick D, Moesta KT, Mucke J, Gebauer B, Stroszczynski C, et al.
Scanning time-domain optical mammography: detection and characterization of breast tumors in
vivo. Technol.Cancer Res.Treat. 2005;4: 483-96.
9. Floery D, Helbich TH, Riedl CC, Jaromi S, Weber M, Leodolter S, et al. Characterization
of benign and malignant breast lesions with computed tomography laser mammography
(CTLM): initial experience. Invest Radiol. 2005;40: 328-35.
10. Jiang S, Pogue BW, Carpenter CM, Poplack SP, Wells WA, Kogel CA, et al. Evaluation
of breast tumor response to neoadjuvant chemotherapy with tomographic diffuse optical
spectroscopy: case studies of tumor region-of-interest changes. Radiology. 2009;252: 551-60.
11. Intes X. Time-domain optical mammography SoftScan: initial results. Acad.Radiol.
2005;12: 934-47.
12. Weissleder R, Ntziachristos V. Shedding light onto live molecular targets. Nature
Medicine. 2003;9: 123.
13. Pierce MC, Javier DJ, Richards-Kortum R. Optical contrast agents and imaging systems
for detection and diagnosis of cancer. Int J Cancer. 2008;123: 1979-90.
14. Vogel CL, Cobleigh MA, Tripathy D, Gutheil JC, Harris LN, Fehrenbacher L, et al.
Efficacy and safety of trastuzumab as a single agent in first-line treatment of HER2-
overexpressing metastatic breast cancer. J Clin Oncol. 2002;20: 719-26.
15. Moasser MM. The oncogene HER2: its signaling and transforming functions and its role
in human cancer pathogenesis. Oncogene. 2007;26: 6469-87.
Research. on January 6, 2019. © 2012 American Association for Cancerclincancerres.aacrjournals.org Downloaded from
Author manuscripts have been peer reviewed and accepted for publication but have not yet been edited. Author Manuscript Published OnlineFirst on January 10, 2012; DOI: 10.1158/1078-0432.CCR-10-3213

26
16. Capala J, Bouchelouche K. Molecular imaging of HER2-positive breast cancer: a step
toward an individualized 'image and treat' strategy. Curr Opin Oncol 2010; Epub Sept 14.
17. Orlova A, Wallberg H, Stone-Elander S, Tolmachev V. On the selection of a tracer for
PET imaging of HER2-expressing tumors: direct comparison of a 124I-labeled affibody
molecule and trastuzumab in a murine xenograft model. J Nucl Med. 2009;50: 417-25.
18. Cheng Z, De Jesus OP, Namavari M, De A, Levi J, Webster JM, et al. Small-animal PET
imaging of human epidermal growth factor receptor type 2 expression with site-specific 18F-
labeled protein scaffold molecules. J Nucl Med. 2008;49: 804-13.
19. Ren G, Zhang R, Liu Z, Webster JM, Miao Z, Gambhir SS, et al. A 2-helix small protein
labeled with 68Ga for PET imaging of HER2 expression. J Nucl Med. 2009;50: 1492-9.
20. Baum RP, Prasad V, Muller D, Schuchardt C, Orlova A, Wennborg A, et al. Molecular
imaging of HER2-expressing malignant tumors in breast cancer patients using synthetic 111In-
or 68Ga-labeled affibody molecules. J Nucl Med. 2010;51: 892-7.
21. Whitesell L, Lindquist SL. HSP90 and the chaperoning of cancer. Nat Rev Cancer.
2005;5: 761-72.
22. Zsebik B, Citri A, Isola J, Yarden Y, Szollosi J, Vereb G. Hsp90 inhibitor 17-AAG
reduces ErbB2 levels and inhibits proliferation of the trastuzumab resistant breast tumor cell line
JIMT-1. Immunol Lett. 2006;104: 146-55.
23. Solit DB, Zheng FF, Drobnjak M, Munster PN, Higgins B, Verbel D, et al. 17-
Allylamino-17-demethoxygeldanamycin induces the degradation of androgen receptor and HER-
2/neu and inhibits the growth of prostate cancer xenografts. Clin Cancer Res. 2002;8: 986-93.
Research. on January 6, 2019. © 2012 American Association for Cancerclincancerres.aacrjournals.org Downloaded from
Author manuscripts have been peer reviewed and accepted for publication but have not yet been edited. Author Manuscript Published OnlineFirst on January 10, 2012; DOI: 10.1158/1078-0432.CCR-10-3213

27
24. Keren S, Gheysens O, Levin CS, Gambhir SS. A comparison between a time domain and
continuous wave small animal optical imaging system. IEEE Trans Med Imaging. 2008;27: 58-
63.
25. Schwock J, Dhani N, Cao MP, Zheng J, Clarkson R, Radulovich N, et al. Targeting focal
adhesion kinase with dominant-negative FRNK or Hsp90 inhibitor 17-DMAG suppresses tumor
growth and metastasis of SiHa cervical xenografts. Cancer Res. 2009;69: 4750-9.
26. Lee SB, Hassan M, Fisher R, Chertov O, Chernomordik V, Kramer-Marek G, et al.
Affibody molecules for in vivo characterization of HER2-positive tumors by near-infrared
imaging. Clin Cancer Res. 2008;14: 3840-9.
27. Smith-Jones PM, Solit D, Afroze F, Rosen N, Larson SM. Early tumor response to Hsp90
therapy using HER2 PET: comparison with 18F-FDG PET. J Nucl Med. 2006;47: 793-6.
28. Oude Munnink TH, Korte MA, Nagengast WB, Timmer-Bosscha H, Schroder CP, Jong
JR, et al. (89)Zr-trastuzumab PET visualises HER2 downregulation by the HSP90 inhibitor
NVP-AUY922 in a human tumour xenograft. Eur J Cancer. 2010; 46:678-684.
29. Kramer-Marek G, Kiesewetter DO, Martiniova L, Jagoda E, Lee SB, Capala J.
[18F]FBEM-Z(HER2:342)-Affibody molecule-a new molecular tracer for in vivo monitoring of
HER2 expression by positron emission tomography. Eur J Nucl Med Mol Imaging. 2008;35:
1008-18.
Research. on January 6, 2019. © 2012 American Association for Cancerclincancerres.aacrjournals.org Downloaded from
Author manuscripts have been peer reviewed and accepted for publication but have not yet been edited. Author Manuscript Published OnlineFirst on January 10, 2012; DOI: 10.1158/1078-0432.CCR-10-3213
Carrier - MCF7 parentalDay 0
Day 3
17-DMAG Treated - MCF7 parentalADay 0
BBB
Research. on January 6, 2019. © 2012 American Association for Cancerclincancerres.aacrjournals.org Downloaded from
Author manuscripts have been peer reviewed and accepted for publication but have not yet been edited. Author Manuscript Published OnlineFirst on January 10, 2012; DOI: 10.1158/1078-0432.CCR-10-3213

Published OnlineFirst January 10, 2012.Clin Cancer Res Stephanie M.W.Y. Van de Ven, Sjoerd G Elias, Carmel T Chan, et al. mouse modelmonitor Hsp90 treatment response in a breast cancer xenograft Optical Imaging with HER2-targeted Affibody Molecules can
Updated version
10.1158/1078-0432.CCR-10-3213doi:
Access the most recent version of this article at:
Material
Supplementary
http://clincancerres.aacrjournals.org/content/suppl/2012/01/10/1078-0432.CCR-10-3213.DC1
Access the most recent supplemental material at:
Manuscript
Authoredited. Author manuscripts have been peer reviewed and accepted for publication but have not yet been
E-mail alerts related to this article or journal.Sign up to receive free email-alerts
Subscriptions
Reprints and
To order reprints of this article or to subscribe to the journal, contact the AACR Publications
Permissions
Rightslink site. Click on "Request Permissions" which will take you to the Copyright Clearance Center's (CCC)
.http://clincancerres.aacrjournals.org/content/early/2012/01/10/1078-0432.CCR-10-3213To request permission to re-use all or part of this article, use this link
Research. on January 6, 2019. © 2012 American Association for Cancerclincancerres.aacrjournals.org Downloaded from
Author manuscripts have been peer reviewed and accepted for publication but have not yet been edited. Author Manuscript Published OnlineFirst on January 10, 2012; DOI: 10.1158/1078-0432.CCR-10-3213


![Hsp90 Inhibitors Are Efficacious against Kaposi Sarcoma by ......Hsp90 is an emerging therapeutic target for cancer [8,9,10]. The newer class of Hsp90 inhibitors bind to the ATP-binding](https://img.pdfslide.us/doc/110x75/60bea423374b8000d05be373/hsp90-inhibitors-are-efficacious-against-kaposi-sarcoma-by-hsp90-is-an-emerging.jpg)