Embed Size (px)
Citation preview
Opportunities in Statistical Software:
Phystat Workshop
Jim LinnemannMSU
March 1 , 2004
Preliminaries• Be sure to get a parking permit from
Lorie Neuman (room 4218, X 2180)
• Wireless: Tom Rockwell can help if you can’t get access; you should just get a direct connection to outside world– Dhcp with an address starting with 10.– If you need to print something, email to
• Introductions
Why you?• You—developers—can actually change things!• I would personally like a better analysis
environment for HEP.• I keep hearing about R from statisticians!• I am convinced astronomers and HEP together will
get something better than either has alone. • And maybe we will have some things that
statisticians can use, too.– Suggested to Brad Efron using arxiv.org for statistics
• I subscribe to the “right people in a room” theory.
What Can We Accomplish?
• We won’t convince anyone to drop what they do now and adopt product xxx instead!
• But we might benefit from seeing different development cultures, work styles, or interesting ideas
• We might find ways to make interfaces across projects, or identify common projects
• If this starts to look interesting, we can spend more time on sharpening this up
• The “agenda” can be revised at any time!
Sociology• HEP experiments: own data reduction software (C++)
– Usually develop common tools used by whole collaboration– Use more generic software as tools, and final data analysis– Particle Astrophysics similar, but more Fortran/C
• HEP lab-dominated in cross-experiment software• CERN, Fermilab, SLAC, DESY, KEK, Brookhaven
– Some instances of cross-lab collaboration– Grid computing is one of few non-lab major software projects– Some tools are university based (specific simulations)– Typically free to community, but not gnu…– Smaller packages: repositories not that well developed
• Not much commercial software – Office; mathematica/maple; some mathcad/matlab/kaleidagraph
• IDL much less used than in astronomy: not as image-oriented
– Latex; ghostview; gnuplot-like
• Statistics: more distributed?• Astronomy: more large software grants?
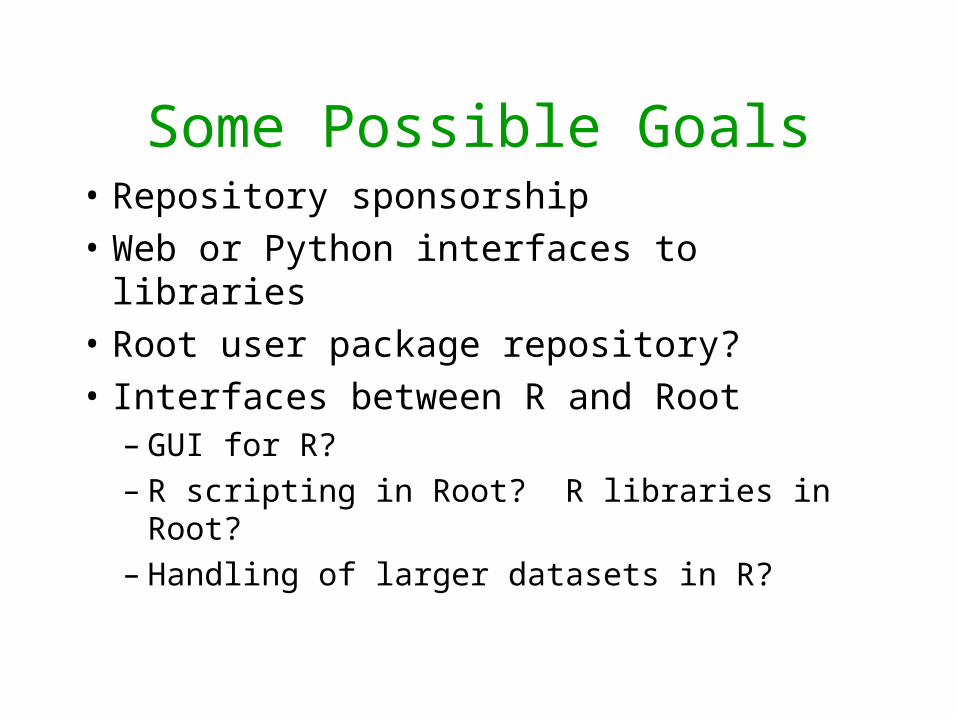
Some Possible Goals• Repository sponsorship
• Web or Python interfaces to libraries
• Root user package repository?
• Interfaces between R and Root– GUI for R?– R scripting in Root? R libraries in Root?– Handling of larger datasets in R?
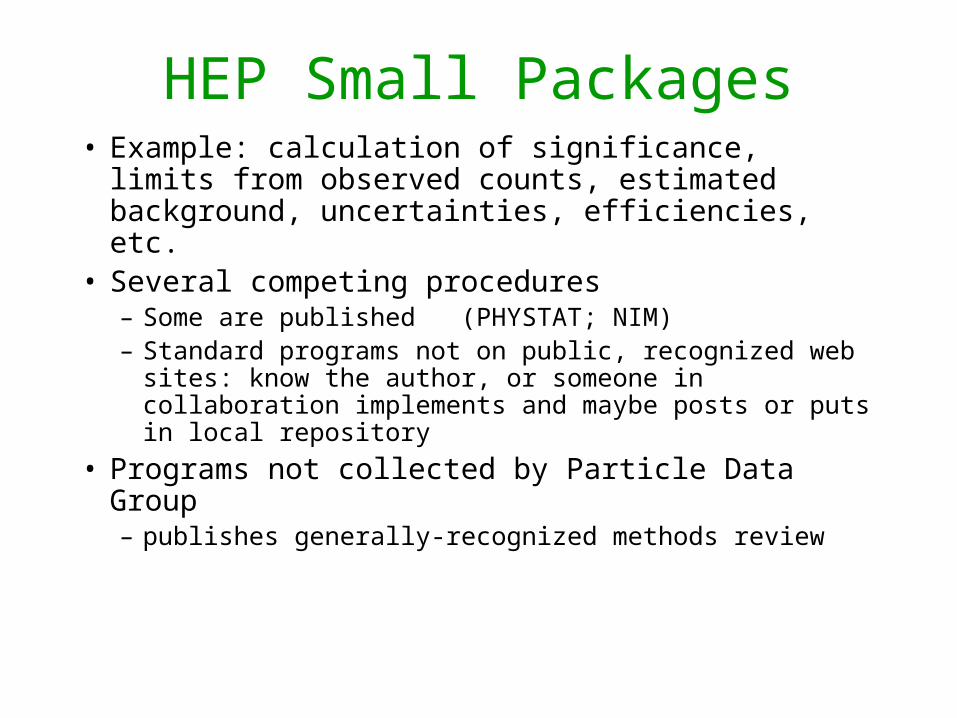
HEP Small Packages• Example: calculation of significance, limits from
observed counts, estimated background, uncertainties, efficiencies, etc.
• Several competing procedures– Some are published (PHYSTAT; NIM)– Standard programs not on public, recognized web sites:
know the author, or someone in collaboration implements and maybe posts or puts in local repository
• Programs not collected by Particle Data Group – publishes generally-recognized methods review
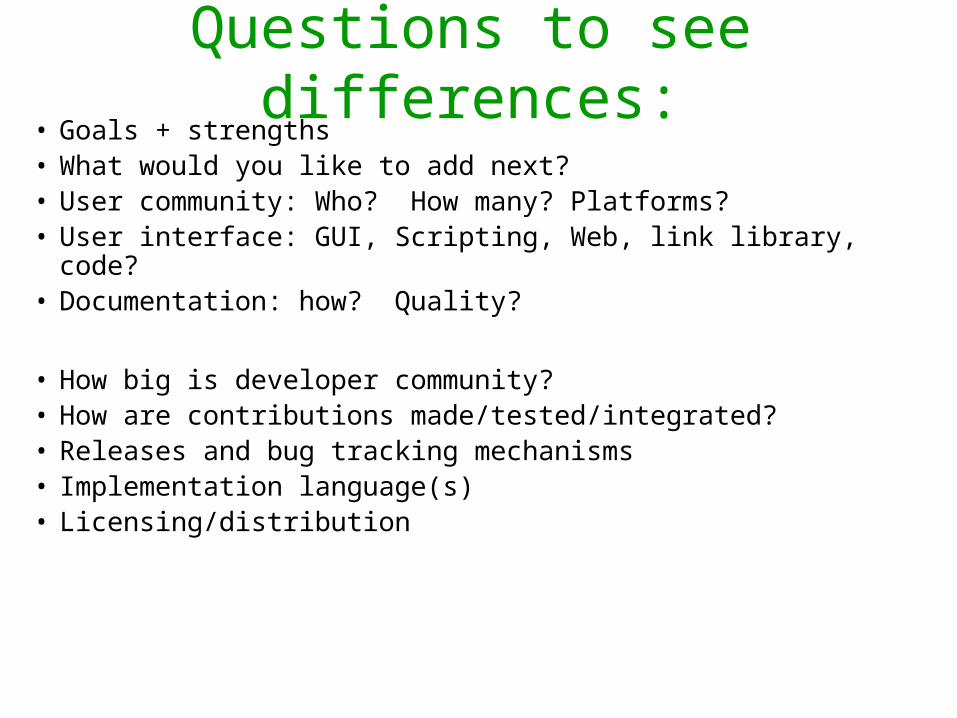
Questions to see differences:• Goals + strengths • What would you like to add next?• User community: Who? How many? Platforms?• User interface: GUI, Scripting, Web, link library, code?• Documentation: how? Quality?
• How big is developer community?• How are contributions made/tested/integrated?• Releases and bug tracking mechanisms• Implementation language(s)• Licensing/distribution
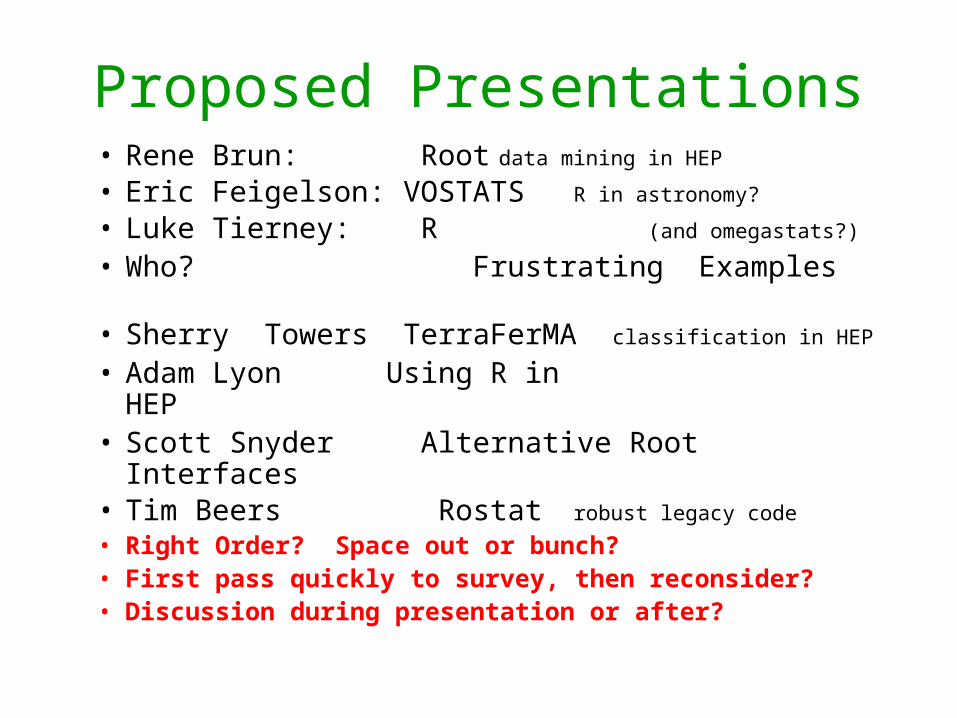
Proposed Presentations• Rene Brun: Root data mining in HEP
• Eric Feigelson: VOSTATS R in astronomy?
• Luke Tierney: R (and omegastats?)
• Who? Frustrating Examples • Sherry Towers TerraFerMA classification in HEP
• Adam Lyon Using R in HEP • Scott Snyder Alternative Root Interfaces • Tim Beers Rostat robust legacy code
• Right Order? Space out or bunch?• First pass quickly to survey, then
reconsider?• Discussion during presentation or after?
Other possible activities• Discussion/panel:
– What do users want?– How could projects reinforce one another– Selecting achievable goals– What are options for Fermilab projects?
• Technical Working Group(s)– Specifics, e.g. root/R interface (brass tacks)– Planning of joint projects?– Planning of further workshops?
• Developer or user oriented?
• Post Talks to web?– Semi-private (developer use)? – Or public, with publicity to users
Some projects that got awayParticularly Python-based
• StatPy—Tom Loredo
• Python interface to Root—Harrison Prosper
• Orange and related: Python--Aleks Jakulin
• Jas—Java analysis framework
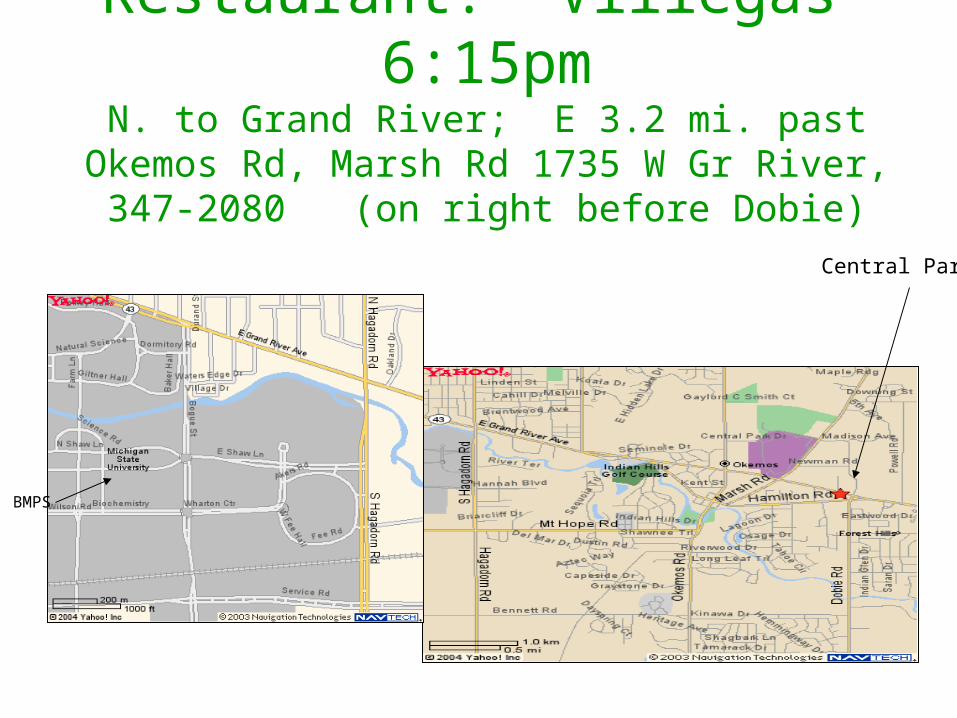
Restaurant: Villegas 6:15pmN. to Grand River; E 3.2 mi. past Okemos Rd, Marsh Rd
1735 W Gr River, 347-2080 (on right before Dobie)
BMPS
Central Park
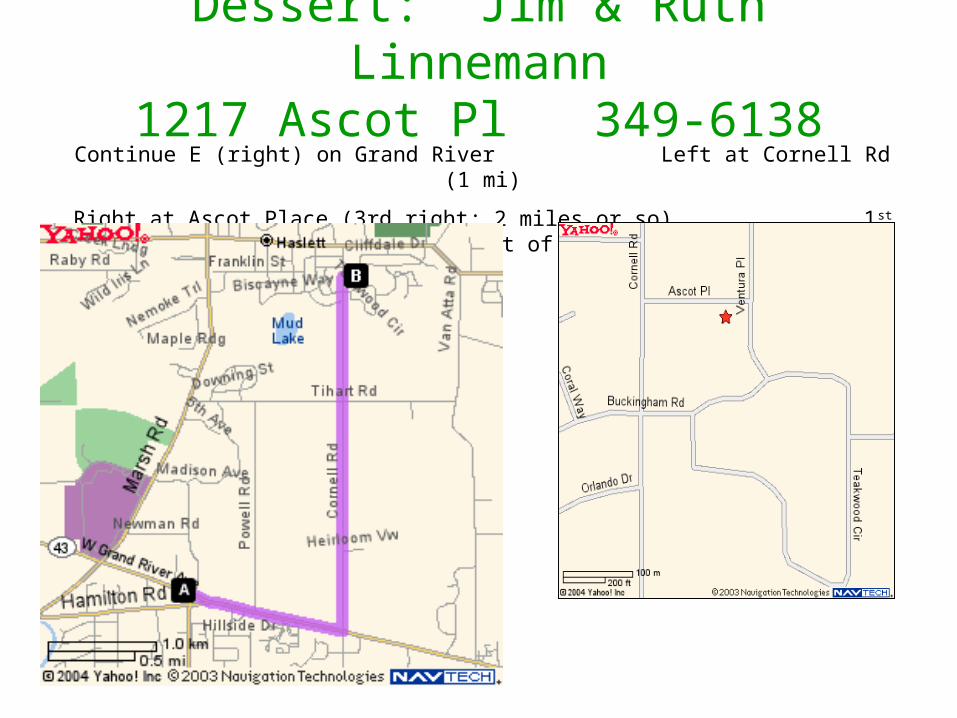
Dessert: Jim & Ruth Linnemann1217 Ascot Pl 349-6138
Continue E (right) on Grand River Left at Cornell Rd (1 mi)
Right at Ascot Place (3rd right; 2 miles or so) 1st drive on right of Ascot
Example 1: 2 sample classification • Plot signal efficiency vs background rejection curves (ROC)
• Selection based on a set of variables (or combinations of variables).
• Click on efficiency value to find value selection criterion in original variables.
• Superimpose curves for several candidate variable selections.
• Data:
• Look in a coordinated fashion at two separate data sets with related but non-identical data structures
• HEP data usually tree-structured: – many instances, each including variable number of lower-level objects
• Typically 2 or more levels down ,
• I might analyze these by forming a variable number of derived variables from the low level objects.
• Much of this process is algorithmic, but I wind up re-doing it by hand each time I try it.
Ex 2: No integrated repsository
• End of an analysis: sample of data events, and an expected set of possible backgrounds, each with an uncertainty.
• Want to calculate a statistical significance (or 90% CL) for these.
• Usually have to extract these numbers and then find a completely separate
piece of software, either in someone's private area, or on the web, or if
• I'm really lucky, in a macro someone's written.
• There aren't good central mechanisms (repositories or interactive web sites)
or for sharing such algorithms, either.
Ex 3: New Statistical Methods
• While the environment I'm used to is good at exploring and fitting large data sets, the number of statistical methods part of that framework is limited.
• I'd like to be able to apply many of the tests I might find in a textbook to comparing two distributions.
• Or I’d like to perform bootstrap calculations or “ensemble tests” without writing from scratch a “toy Monte Carlo”: to identify the statistical uncertainty of my fitting results with simulated experiments.
• These tests exist in R, but my data is in Root.
Root: key features
• GUI for presentation graphics and selection (“cuts”)
• I/O for tree-structured data: scales to petabytes
• Histogram as base metaphor (akin to vector)• Sophisticated nonlinear fitting• C++ at command line, macros, compiled
macros
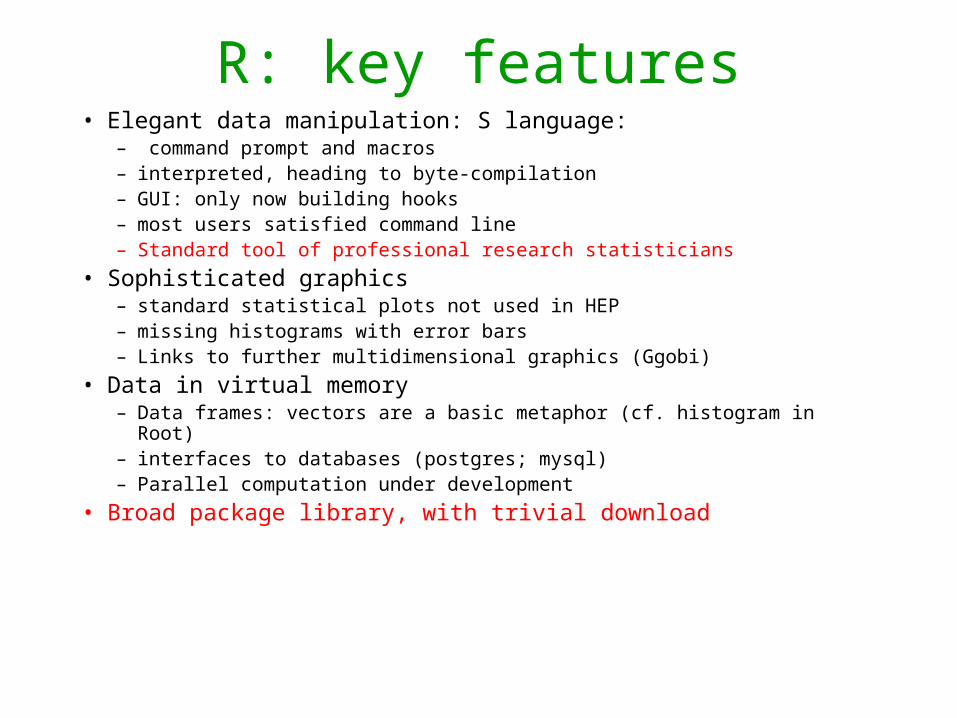
R: key features• Elegant data manipulation: S language:
– command prompt and macros– interpreted, heading to byte-compilation– GUI: only now building hooks– most users satisfied command line– Standard tool of professional research statisticians
• Sophisticated graphics– standard statistical plots not used in HEP– missing histograms with error bars– Links to further multidimensional graphics (Ggobi)
• Data in virtual memory– Data frames: vectors are a basic metaphor (cf. histogram in Root)– interfaces to databases (postgres; mysql)– Parallel computation under development
• Broad package library, with trivial download