Embed Size (px)
Citation preview
Opportunities for Canadian
energy technologies in
global markets
© Her Majesty the Queen in right of Canada (2012)
This analysis was commissioned by Natural Resources Canada, and performed by McKinsey & Co. It does not
necessarily represent the views of the Government of Canada.
Cat. No. M34-19/2013E-PDF (Online)
ISBN 978-1-100-22652-1
|
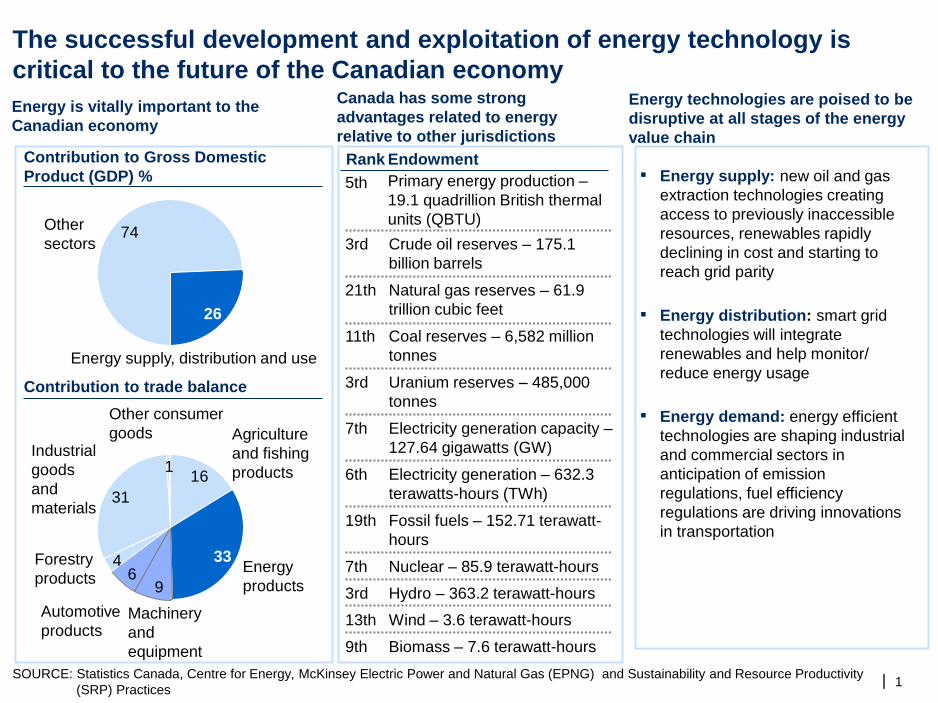
The successful development and exploitation of energy technology is
critical to the future of the Canadian economy
1 SOURCE: Statistics Canada, Centre for Energy, McKinsey Electric Power and Natural Gas (EPNG) and Sustainability and Resource Productivity
(SRP) Practices
Energy is vitally important to the
Canadian economy
Canada has some strong
advantages related to energy
relative to other jurisdictions
Energy technologies are poised to be
disruptive at all stages of the energy
value chain
31
69
16
Other consumer
goods
1 Industrial
goods
and
materials
Forestry
products 4
Automotive
products Machinery
and
equipment
Energy
products
33
Agriculture
and fishing
products
▪ Energy supply: new oil and gas
extraction technologies creating
access to previously inaccessible
resources, renewables rapidly
declining in cost and starting to
reach grid parity
▪ Energy distribution: smart grid
technologies will integrate
renewables and help monitor/
reduce energy usage
▪ Energy demand: energy efficient
technologies are shaping industrial
and commercial sectors in
anticipation of emission
regulations, fuel efficiency
regulations are driving innovations
in transportation
Rank Endowment
5th Primary energy production –
19.1 quadrillion British thermal
units (QBTU)
3rd Crude oil reserves – 175.1
billion barrels
21th Natural gas reserves – 61.9
trillion cubic feet
11th Coal reserves – 6,582 million
tonnes
3rd Uranium reserves – 485,000
tonnes
7th Electricity generation capacity –
127.64 gigawatts (GW)
6th Electricity generation – 632.3
terawatts-hours (TWh)
19th Fossil fuels – 152.71 terawatt-
hours
7th Nuclear – 85.9 terawatt-hours
3rd Hydro – 363.2 terawatt-hours
13th Wind – 3.6 terawatt-hours
9th Biomass – 7.6 terawatt-hours
Contribution to trade balance
Contribution to Gross Domestic
Product (GDP) %
74
26
Other
sectors
Energy supply, distribution and use
|
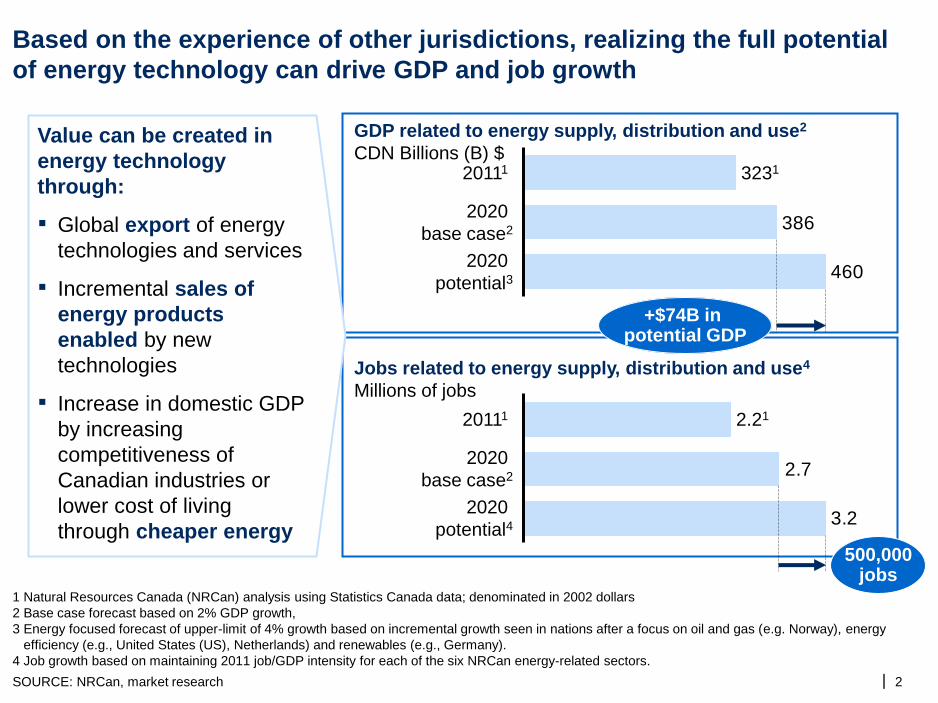
Based on the experience of other jurisdictions, realizing the full potential
of energy technology can drive GDP and job growth
2
460
386
+$74B in potential GDP
2020
potential3
2020
base case2
20111 3231
3.2
2.7
500,000 jobs
2020
potential4
2020
base case2
20111 2.21
1 Natural Resources Canada (NRCan) analysis using Statistics Canada data; denominated in 2002 dollars
2 Base case forecast based on 2% GDP growth,
3 Energy focused forecast of upper-limit of 4% growth based on incremental growth seen in nations after a focus on oil and gas (e.g. Norway), energy
efficiency (e.g., United States (US), Netherlands) and renewables (e.g., Germany).
4 Job growth based on maintaining 2011 job/GDP intensity for each of the six NRCan energy-related sectors.
GDP related to energy supply, distribution and use2
CDN Billions (B) $
Jobs related to energy supply, distribution and use4
Millions of jobs
SOURCE: NRCan, market research
Value can be created in
energy technology
through:
▪ Global export of energy
technologies and services
▪ Incremental sales of
energy products
enabled by new
technologies
▪ Increase in domestic GDP
by increasing
competitiveness of
Canadian industries or
lower cost of living
through cheaper energy
|
Yet there are a number of unique characteristics and challenges related to
the development of energy technologies
3
Energy projects require high capital investments (up to multi billion
dollars for major pilots) and have long term payouts (10-20 years)
Energy technology investments are also high risk, and subject to:
▪ Energy price volatility
▪ Shifts in global market demand and supply
▪ Policy regulatory uncertainty (e.g., carbon price)
▪ Environmental risk (e.g., pipeline safety) and social license to operate
The energy sector is multi-faceted and complex
▪ Technologies develop from a multitude of basic science areas
▪ The sector encompasses many disparate industries, companies, and
stakeholders including public utilities
| 4
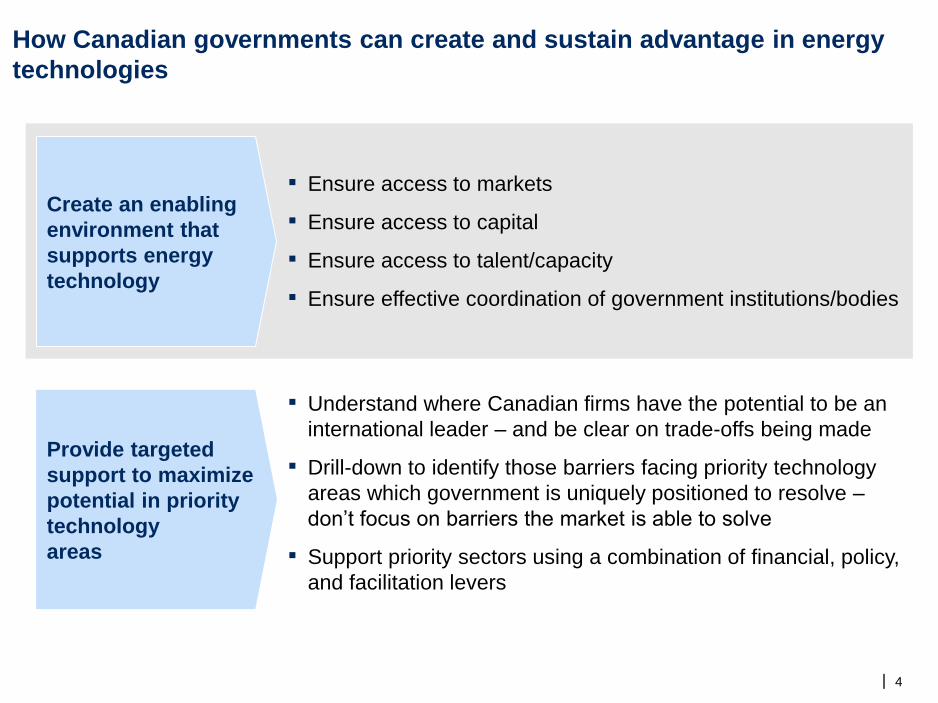
How Canadian governments can create and sustain advantage in energy
technologies
▪ Understand where Canadian firms have the potential to be an
international leader – and be clear on trade-offs being made
▪ Drill-down to identify those barriers facing priority technology
areas which government is uniquely positioned to resolve –
don’t focus on barriers the market is able to solve
▪ Support priority sectors using a combination of financial, policy,
and facilitation levers
▪ Ensure access to markets
▪ Ensure access to capital
▪ Ensure access to talent/capacity
▪ Ensure effective coordination of government institutions/bodies
Create an enabling
environment that
supports energy
technology
Provide targeted
support to maximize
potential in priority
technology
areas
|
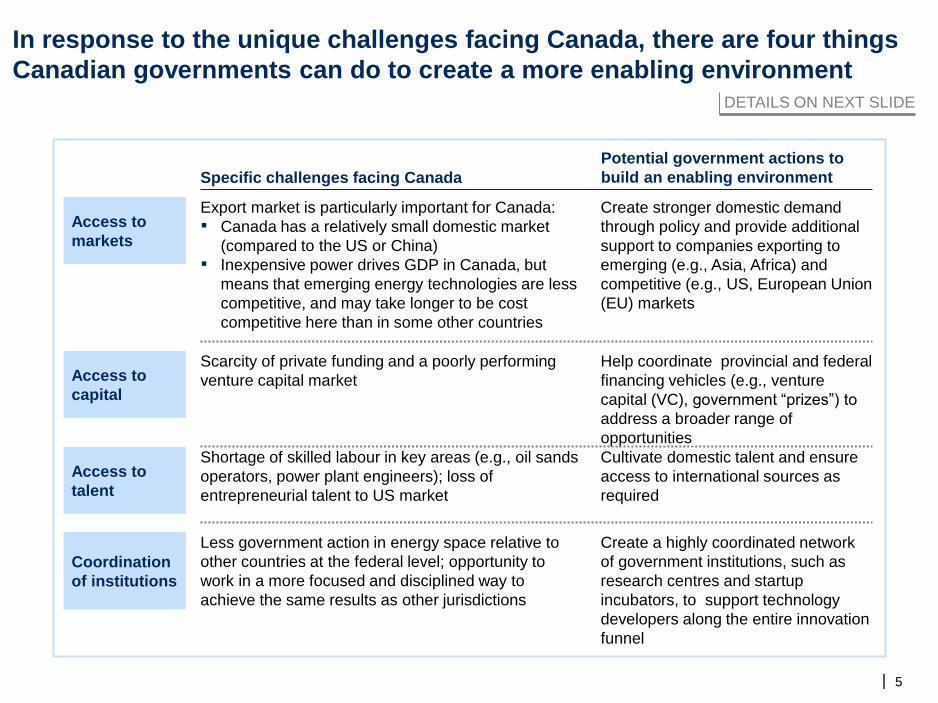
In response to the unique challenges facing Canada, there are four things
Canadian governments can do to create a more enabling environment
5
DETAILS ON NEXT SLIDE
Specific challenges facing Canada
Potential government actions to
build an enabling environment
Scarcity of private funding and a poorly performing
venture capital market Access to
capital
Help coordinate provincial and federal
financing vehicles (e.g., venture
capital (VC), government “prizes”) to
address a broader range of
opportunities
Create stronger domestic demand
through policy and provide additional
support to companies exporting to
emerging (e.g., Asia, Africa) and
competitive (e.g., US, European Union
(EU) markets
Export market is particularly important for Canada:
▪ Canada has a relatively small domestic market
(compared to the US or China)
▪ Inexpensive power drives GDP in Canada, but
means that emerging energy technologies are less
competitive, and may take longer to be cost
competitive here than in some other countries
Access to
markets
Shortage of skilled labour in key areas (e.g., oil sands
operators, power plant engineers); loss of
entrepreneurial talent to US market
Access to
talent
Cultivate domestic talent and ensure
access to international sources as
required
Create a highly coordinated network
of government institutions, such as
research centres and startup
incubators, to support technology
developers along the entire innovation
funnel
Coordination
of institutions
Less government action in energy space relative to
other countries at the federal level; opportunity to
work in a more focused and disciplined way to
achieve the same results as other jurisdictions
|
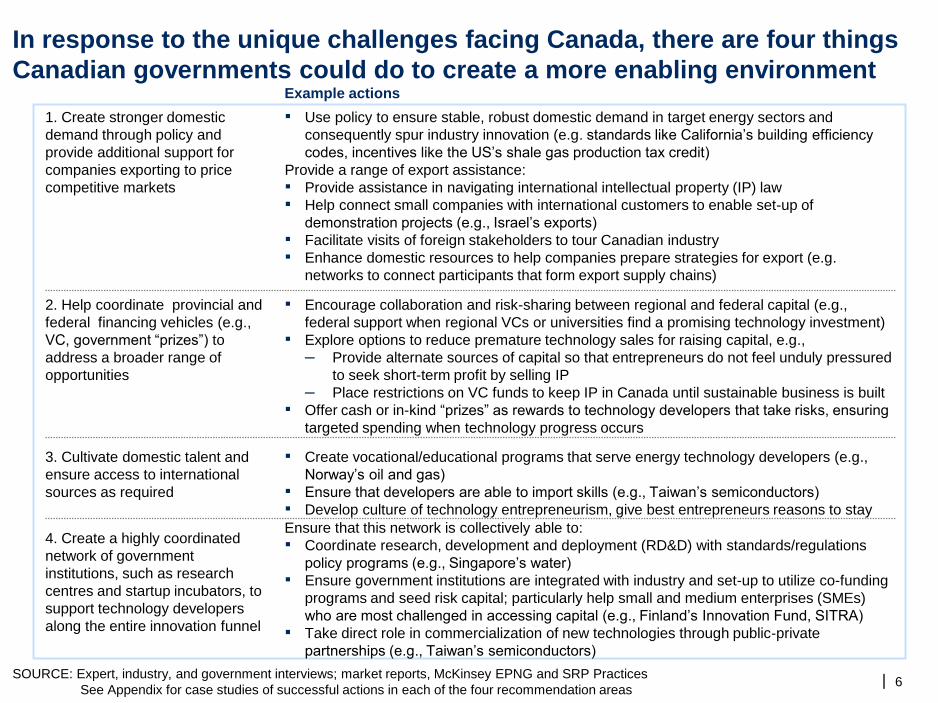
In response to the unique challenges facing Canada, there are four things
Canadian governments could do to create a more enabling environment
6 SOURCE: Expert, industry, and government interviews; market reports, McKinsey EPNG and SRP Practices
See Appendix for case studies of successful actions in each of the four recommendation areas
Example actions
4. Create a highly coordinated
network of government
institutions, such as research
centres and startup incubators, to
support technology developers
along the entire innovation funnel
Ensure that this network is collectively able to:
▪ Coordinate research, development and deployment (RD&D) with standards/regulations
policy programs (e.g., Singapore’s water)
▪ Ensure government institutions are integrated with industry and set-up to utilize co-funding
programs and seed risk capital; particularly help small and medium enterprises (SMEs)
who are most challenged in accessing capital (e.g., Finland’s Innovation Fund, SITRA)
▪ Take direct role in commercialization of new technologies through public-private
partnerships (e.g., Taiwan’s semiconductors)
▪ Encourage collaboration and risk-sharing between regional and federal capital (e.g.,
federal support when regional VCs or universities find a promising technology investment)
▪ Explore options to reduce premature technology sales for raising capital, e.g.,
– Provide alternate sources of capital so that entrepreneurs do not feel unduly pressured
to seek short-term profit by selling IP
– Place restrictions on VC funds to keep IP in Canada until sustainable business is built
▪ Offer cash or in-kind “prizes” as rewards to technology developers that take risks, ensuring
targeted spending when technology progress occurs
2. Help coordinate provincial and
federal financing vehicles (e.g.,
VC, government “prizes”) to
address a broader range of
opportunities
▪ Use policy to ensure stable, robust domestic demand in target energy sectors and
consequently spur industry innovation (e.g. standards like California’s building efficiency
codes, incentives like the US’s shale gas production tax credit)
Provide a range of export assistance:
▪ Provide assistance in navigating international intellectual property (IP) law
▪ Help connect small companies with international customers to enable set-up of
demonstration projects (e.g., Israel’s exports)
▪ Facilitate visits of foreign stakeholders to tour Canadian industry
▪ Enhance domestic resources to help companies prepare strategies for export (e.g.
networks to connect participants that form export supply chains)
1. Create stronger domestic
demand through policy and
provide additional support for
companies exporting to price
competitive markets
3. Cultivate domestic talent and
ensure access to international
sources as required
▪ Create vocational/educational programs that serve energy technology developers (e.g.,
Norway’s oil and gas)
▪ Ensure that developers are able to import skills (e.g., Taiwan’s semiconductors)
▪ Develop culture of technology entrepreneurism, give best entrepreneurs reasons to stay
|
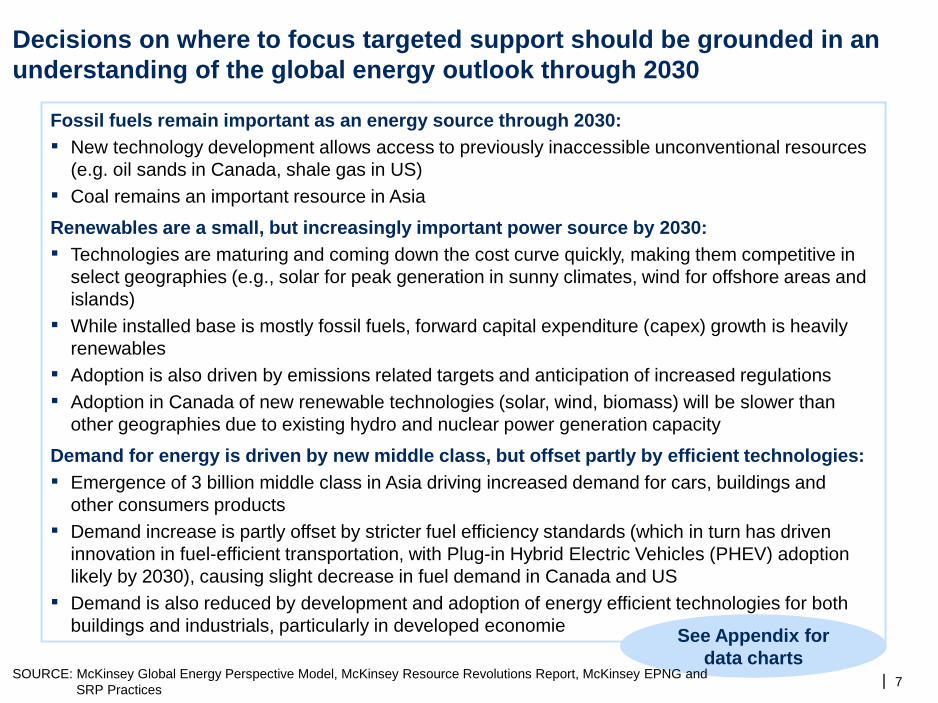
Decisions on where to focus targeted support should be grounded in an
understanding of the global energy outlook through 2030
7
Fossil fuels remain important as an energy source through 2030:
▪ New technology development allows access to previously inaccessible unconventional resources
(e.g. oil sands in Canada, shale gas in US)
▪ Coal remains an important resource in Asia
Renewables are a small, but increasingly important power source by 2030:
▪ Technologies are maturing and coming down the cost curve quickly, making them competitive in
select geographies (e.g., solar for peak generation in sunny climates, wind for offshore areas and
islands)
▪ While installed base is mostly fossil fuels, forward capital expenditure (capex) growth is heavily
renewables
▪ Adoption is also driven by emissions related targets and anticipation of increased regulations
▪ Adoption in Canada of new renewable technologies (solar, wind, biomass) will be slower than
other geographies due to existing hydro and nuclear power generation capacity
Demand for energy is driven by new middle class, but offset partly by efficient technologies:
▪ Emergence of 3 billion middle class in Asia driving increased demand for cars, buildings and
other consumers products
▪ Demand increase is partly offset by stricter fuel efficiency standards (which in turn has driven
innovation in fuel-efficient transportation, with Plug-in Hybrid Electric Vehicles (PHEV) adoption
likely by 2030), causing slight decrease in fuel demand in Canada and US
▪ Demand is also reduced by development and adoption of energy efficient technologies for both
buildings and industrials, particularly in developed economieSee Appendix for
data charts SOURCE: McKinsey Global Energy Perspective Model, McKinsey Resource Revolutions Report, McKinsey EPNG and
SRP Practices
|
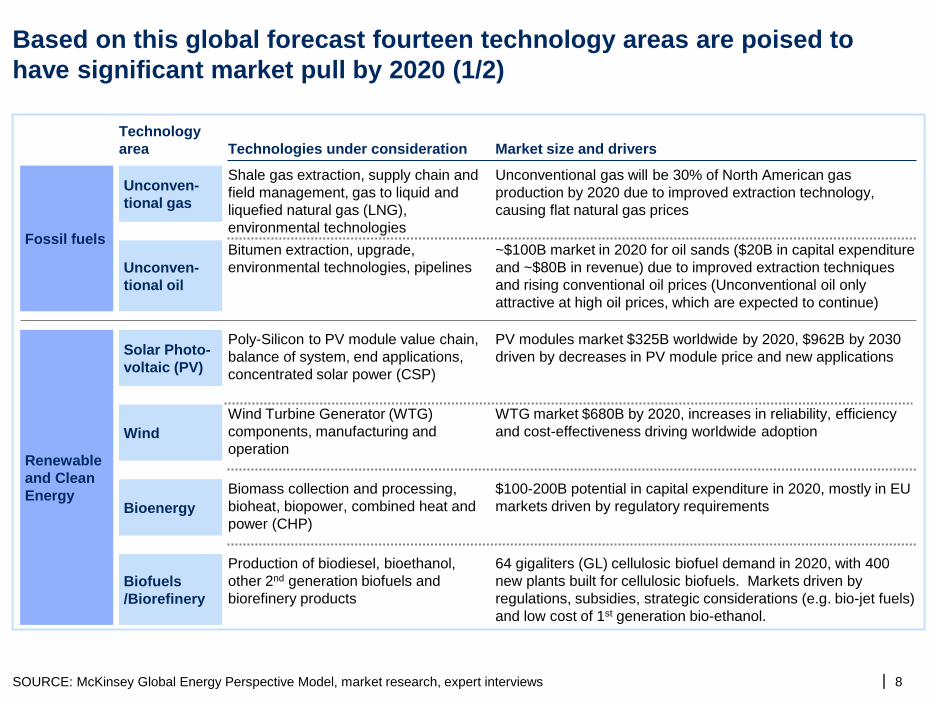
Based on this global forecast fourteen technology areas are poised to
have significant market pull by 2020 (1/2)
8 SOURCE: McKinsey Global Energy Perspective Model, market research, expert interviews
Fossil fuels
Renewable
and Clean
Energy
Shale gas extraction, supply chain and
field management, gas to liquid and
liquefied natural gas (LNG),
environmental technologies
Unconventional gas will be 30% of North American gas
production by 2020 due to improved extraction technology,
causing flat natural gas prices
Unconven-
tional gas
Unconven-
tional oil
Bitumen extraction, upgrade,
environmental technologies, pipelines
~$100B market in 2020 for oil sands ($20B in capital expenditure
and ~$80B in revenue) due to improved extraction techniques
and rising conventional oil prices (Unconventional oil only
attractive at high oil prices, which are expected to continue)
Wind
Wind Turbine Generator (WTG)
components, manufacturing and
operation
WTG market $680B by 2020, increases in reliability, efficiency
and cost-effectiveness driving worldwide adoption
Bioenergy
Biomass collection and processing,
bioheat, biopower, combined heat and
power (CHP)
$100-200B potential in capital expenditure in 2020, mostly in EU
markets driven by regulatory requirements
Solar Photo-
voltaic (PV)
Poly-Silicon to PV module value chain,
balance of system, end applications,
concentrated solar power (CSP)
PV modules market $325B worldwide by 2020, $962B by 2030
driven by decreases in PV module price and new applications
Biofuels
/Biorefinery
Production of biodiesel, bioethanol,
other 2nd generation biofuels and
biorefinery products
64 gigaliters (GL) cellulosic biofuel demand in 2020, with 400
new plants built for cellulosic biofuels. Markets driven by
regulations, subsidies, strategic considerations (e.g. bio-jet fuels)
and low cost of 1st generation bio-ethanol.
Technology
area Technologies under consideration Market size and drivers
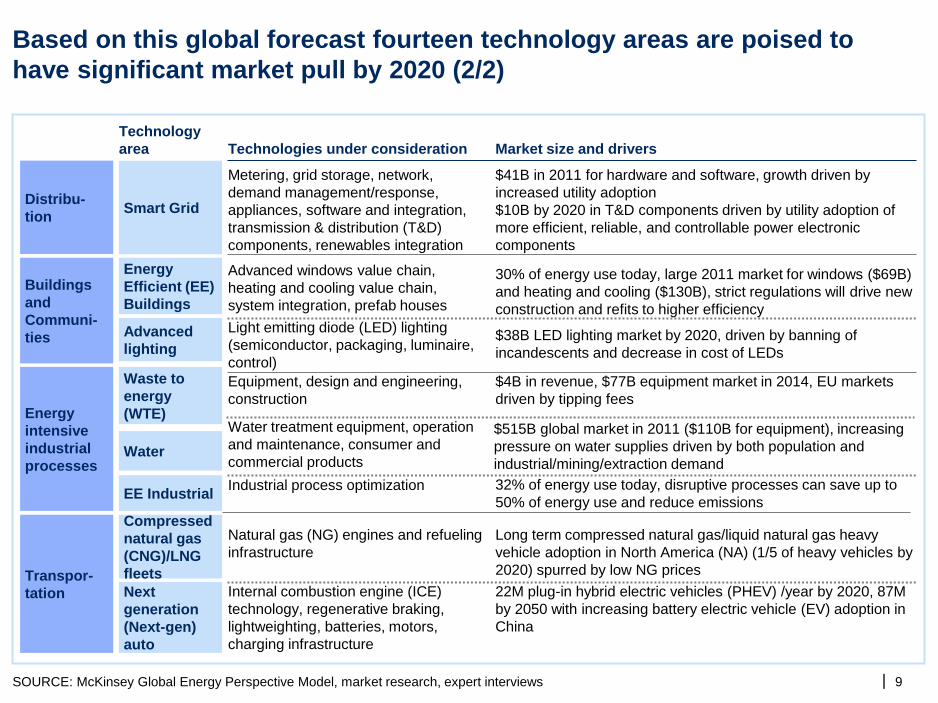
| 9
Buildings
and
Communi-
ties
Energy
intensive
industrial
processes
Transpor-
tation
Energy
Efficient (EE)
Buildings
Advanced windows value chain,
heating and cooling value chain,
system integration, prefab houses
30% of energy use today, large 2011 market for windows ($69B)
and heating and cooling ($130B), strict regulations will drive new
construction and refits to higher efficiency
Advanced
lighting
Light emitting diode (LED) lighting
(semiconductor, packaging, luminaire,
control)
$38B LED lighting market by 2020, driven by banning of
incandescents and decrease in cost of LEDs
Next
generation
(Next-gen)
auto
Internal combustion engine (ICE)
technology, regenerative braking,
lightweighting, batteries, motors,
charging infrastructure
22M plug-in hybrid electric vehicles (PHEV) /year by 2020, 87M
by 2050 with increasing battery electric vehicle (EV) adoption in
China
Natural gas (NG) engines and refueling
infrastructure
Long term compressed natural gas/liquid natural gas heavy
vehicle adoption in North America (NA) (1/5 of heavy vehicles by
2020) spurred by low NG prices
Compressed
natural gas
(CNG)/LNG
fleets
Technology
area Technologies under consideration Market size and drivers
Waste to
energy
(WTE)
Equipment, design and engineering,
construction
$4B in revenue, $77B equipment market in 2014, EU markets
driven by tipping fees
Water
Water treatment equipment, operation
and maintenance, consumer and
commercial products
$515B global market in 2011 ($110B for equipment), increasing
pressure on water supplies driven by both population and
industrial/mining/extraction demand
Industrial process optimization 32% of energy use today, disruptive processes can save up to
50% of energy use and reduce emissions EE Industrial
Distribu-
tion Smart Grid
Metering, grid storage, network,
demand management/response,
appliances, software and integration,
transmission & distribution (T&D)
components, renewables integration
$41B in 2011 for hardware and software, growth driven by
increased utility adoption
$10B by 2020 in T&D components driven by utility adoption of
more efficient, reliable, and controllable power electronic
components
SOURCE: McKinsey Global Energy Perspective Model, market research, expert interviews
Based on this global forecast fourteen technology areas are poised to
have significant market pull by 2020 (2/2)
|
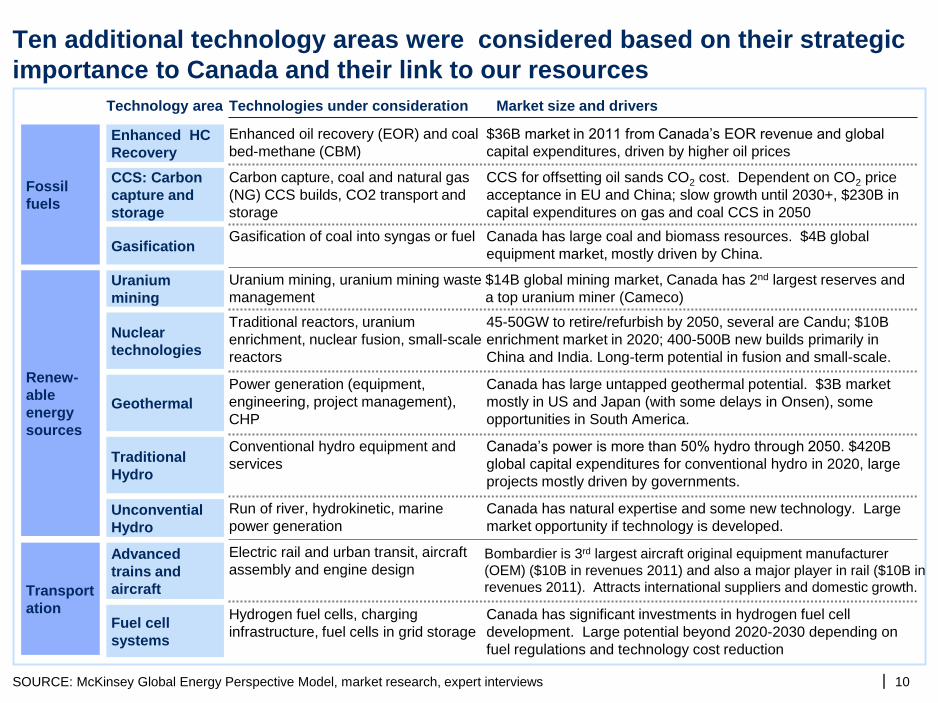
Ten additional technology areas were considered based on their strategic
importance to Canada and their link to our resources
10 SOURCE: McKinsey Global Energy Perspective Model, market research, expert interviews
Fossil
fuels
Renew-
able
energy
sources
Technology area Technologies under consideration Market size and drivers
CCS: Carbon
capture and
storage
Carbon capture, coal and natural gas
(NG) CCS builds, CO2 transport and
storage
CCS for offsetting oil sands CO2 cost. Dependent on CO2 price
acceptance in EU and China; slow growth until 2030+, $230B in
capital expenditures on gas and coal CCS in 2050
Enhanced oil recovery (EOR) and coal
bed-methane (CBM)
$36B market in 2011 from Canada’s EOR revenue and global
capital expenditures, driven by higher oil prices Enhanced HC
Recovery
Gasification Gasification of coal into syngas or fuel Canada has large coal and biomass resources. $4B global
equipment market, mostly driven by China.
Geothermal
Power generation (equipment,
engineering, project management),
CHP
Canada has large untapped geothermal potential. $3B market
mostly in US and Japan (with some delays in Onsen), some
opportunities in South America.
Nuclear
technologies
Traditional reactors, uranium
enrichment, nuclear fusion, small-scale
reactors
45-50GW to retire/refurbish by 2050, several are Candu; $10B
enrichment market in 2020; 400-500B new builds primarily in
China and India. Long-term potential in fusion and small-scale.
Traditional
Hydro
Conventional hydro equipment and
services
Canada’s power is more than 50% hydro through 2050. $420B
global capital expenditures for conventional hydro in 2020, large
projects mostly driven by governments.
Fuel cell
systems
Hydrogen fuel cells, charging
infrastructure, fuel cells in grid storage
Canada has significant investments in hydrogen fuel cell
development. Large potential beyond 2020-2030 depending on
fuel regulations and technology cost reduction
Advanced
trains and
aircraft
Electric rail and urban transit, aircraft
assembly and engine design Bombardier is 3rd largest aircraft original equipment manufacturer
(OEM) ($10B in revenues 2011) and also a major player in rail ($10B in
revenues 2011). Attracts international suppliers and domestic growth. Transport
ation
Unconvential
Hydro
Run of river, hydrokinetic, marine
power generation
Canada has natural expertise and some new technology. Large
market opportunity if technology is developed.
Uranium
mining
Uranium mining, uranium mining waste
management
$14B global mining market, Canada has 2nd largest reserves and
a top uranium miner (Cameco)
| 11
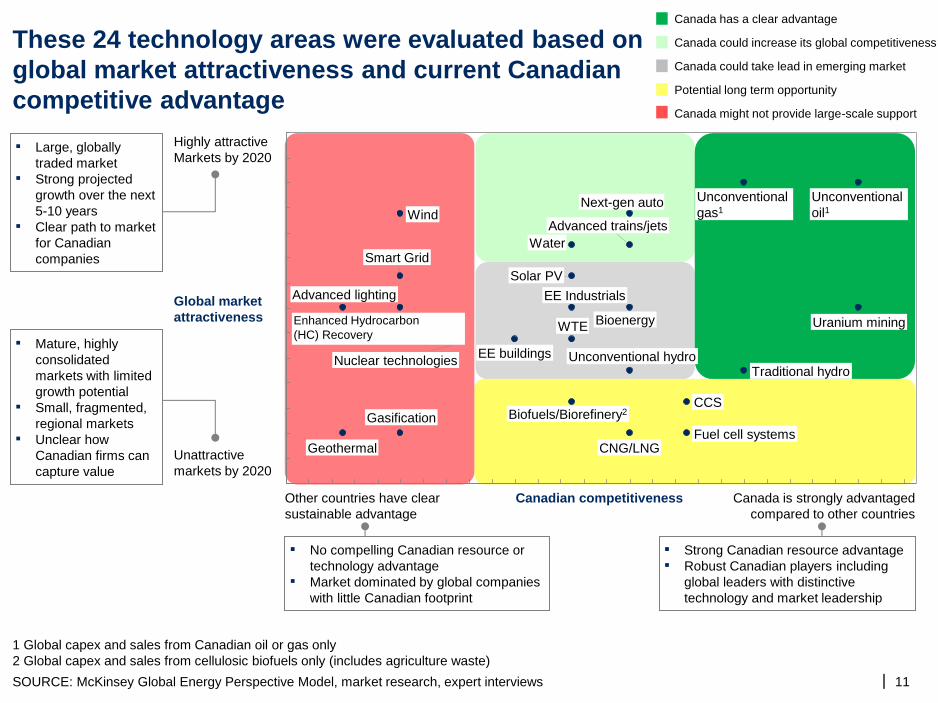
These 24 technology areas were evaluated based on
global market attractiveness and current Canadian
competitive advantage
Potential long term opportunity
Canada could take lead in emerging market
Canada could increase its global competitiveness
Canada has a clear advantage
Canada might not provide large-scale support
1 Global capex and sales from Canadian oil or gas only
2 Global capex and sales from cellulosic biofuels only (includes agriculture waste)
SOURCE: McKinsey Global Energy Perspective Model, market research, expert interviews
Other countries have clear
sustainable advantage
Canada is strongly advantaged
compared to other countries
Canadian competitiveness
▪ No compelling Canadian resource or
technology advantage
▪ Market dominated by global companies
with little Canadian footprint
▪ Strong Canadian resource advantage
▪ Robust Canadian players including
global leaders with distinctive
technology and market leadership
Highly attractive
Markets by 2020 ▪ Large, globally
traded market
▪ Strong projected
growth over the next
5-10 years
▪ Clear path to market
for Canadian
companies
Global market
attractiveness
Unattractive
markets by 2020
▪ Mature, highly
consolidated
markets with limited
growth potential
▪ Small, fragmented,
regional markets
▪ Unclear how
Canadian firms can
capture value
Fuel cell systems
Advanced trains/jets
Next-gen auto
CNG/LNG
EE Industrials
Water
WTE
EE buildings
Advanced lighting
Smart Grid
Unconventional hydro Traditional hydro
Geothermal
Nuclear technologies
Uranium mining
Wind
Solar PV
Biofuels/Biorefinery2
Bioenergy Enhanced Hydrocarbon
(HC) Recovery
Gasification CCS
Unconventional
oil1
Unconventional
gas1
|
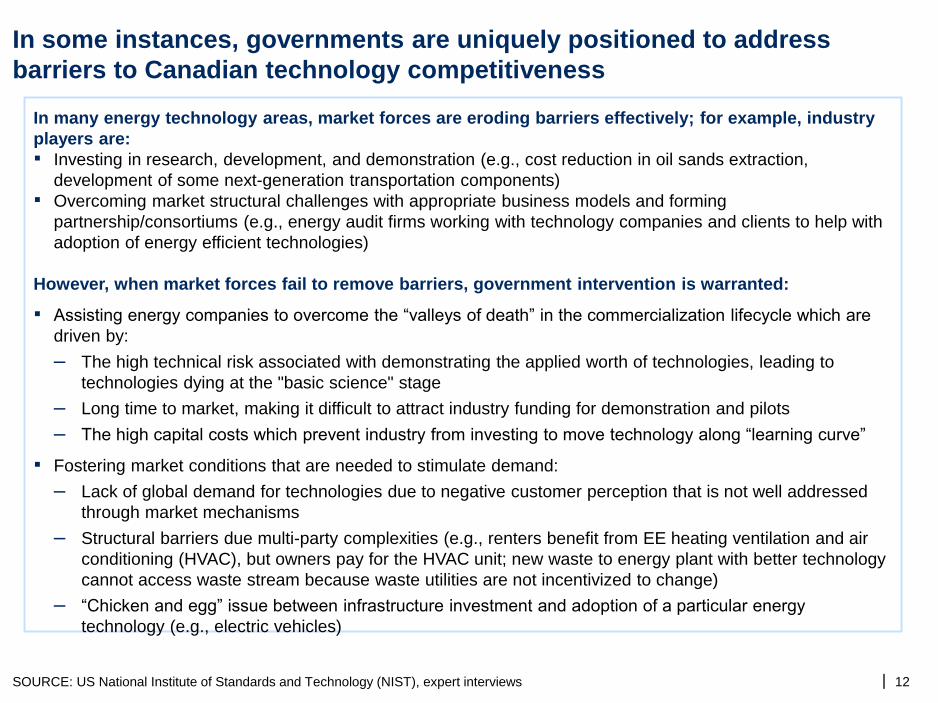
In some instances, governments are uniquely positioned to address
barriers to Canadian technology competitiveness
12
In many energy technology areas, market forces are eroding barriers effectively; for example, industry
players are:
▪ Investing in research, development, and demonstration (e.g., cost reduction in oil sands extraction,
development of some next-generation transportation components)
▪ Overcoming market structural challenges with appropriate business models and forming
partnership/consortiums (e.g., energy audit firms working with technology companies and clients to help with
adoption of energy efficient technologies)
However, when market forces fail to remove barriers, government intervention is warranted:
▪ Assisting energy companies to overcome the “valleys of death” in the commercialization lifecycle which are
driven by:
– The high technical risk associated with demonstrating the applied worth of technologies, leading to
technologies dying at the "basic science" stage
– Long time to market, making it difficult to attract industry funding for demonstration and pilots
– The high capital costs which prevent industry from investing to move technology along “learning curve”
▪ Fostering market conditions that are needed to stimulate demand:
– Lack of global demand for technologies due to negative customer perception that is not well addressed
through market mechanisms
– Structural barriers due multi-party complexities (e.g., renters benefit from EE heating ventilation and air
conditioning (HVAC), but owners pay for the HVAC unit; new waste to energy plant with better technology
cannot access waste stream because waste utilities are not incentivized to change)
– “Chicken and egg” issue between infrastructure investment and adoption of a particular energy
technology (e.g., electric vehicles)
SOURCE: US National Institute of Standards and Technology (NIST), expert interviews
|
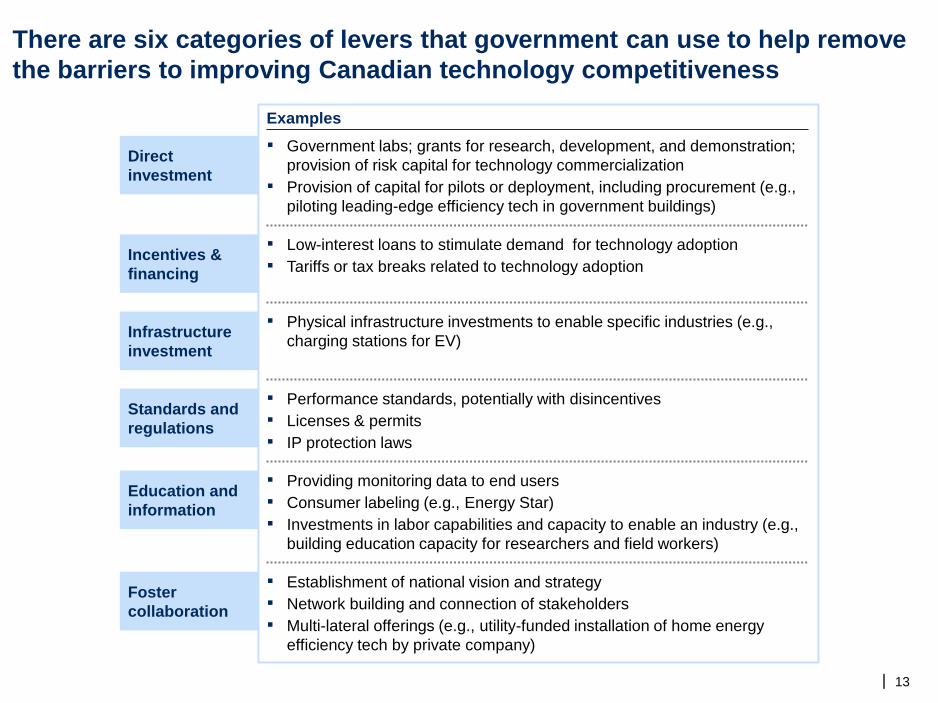
There are six categories of levers that government can use to help remove
the barriers to improving Canadian technology competitiveness
Direct
investment
▪ Government labs; grants for research, development, and demonstration;
provision of risk capital for technology commercialization
▪ Provision of capital for pilots or deployment, including procurement (e.g.,
piloting leading-edge efficiency tech in government buildings)
▪ Low-interest loans to stimulate demand for technology adoption
▪ Tariffs or tax breaks related to technology adoptionIncentives &
financing
Infrastructure
investment
▪ Physical infrastructure investments to enable specific industries (e.g.,
charging stations for EV)
Education and
information
▪ Providing monitoring data to end users
▪ Consumer labeling (e.g., Energy Star)
▪ Investments in labor capabilities and capacity to enable an industry (e.g.,
building education capacity for researchers and field workers)
Foster
collaboration
▪ Establishment of national vision and strategy
▪ Network building and connection of stakeholders
▪ Multi-lateral offerings (e.g., utility-funded installation of home energy
efficiency tech by private company)
Standards and
regulations
▪ Performance standards, potentially with disincentives
▪ Licenses & permits
▪ IP protection laws
Examples
13
|
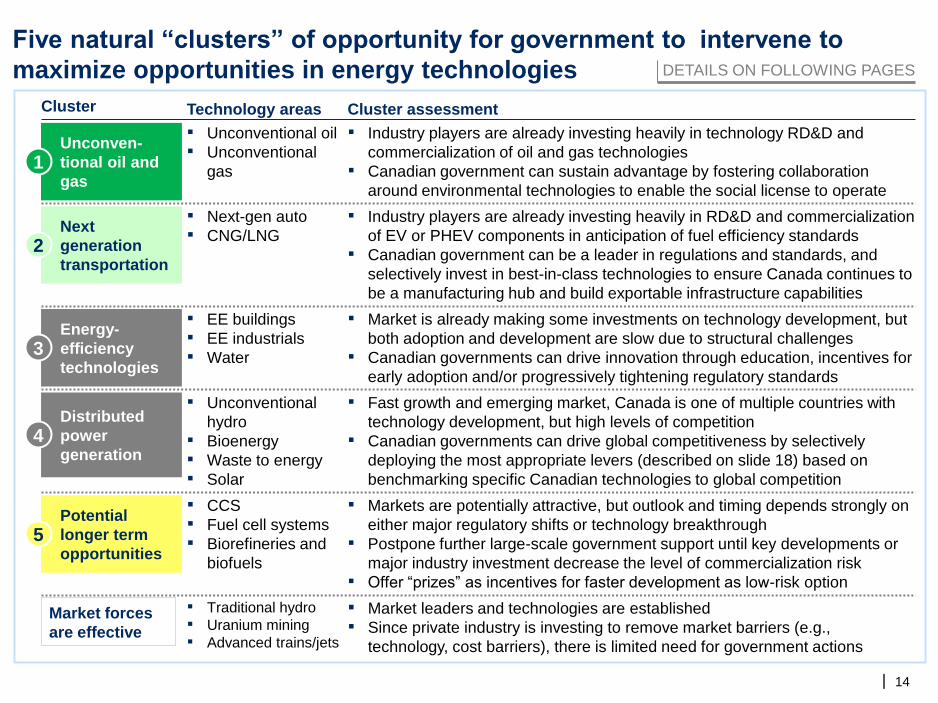
Five natural “clusters” of opportunity for government to intervene to
maximize opportunities in energy technologies
14
Cluster Technology areas Cluster assessment
▪ Unconventional oil
▪ Unconventional
gas
Unconven-
tional oil and
gas 1
▪ Industry players are already investing heavily in technology RD&D and
commercialization of oil and gas technologies
▪ Canadian government can sustain advantage by fostering collaboration
around environmental technologies to enable the social license to operate
▪ Next-gen auto
▪ CNG/LNGNext
generation
transportation 2
▪ Industry players are already investing heavily in RD&D and commercialization
of EV or PHEV components in anticipation of fuel efficiency standards
▪ Canadian government can be a leader in regulations and standards, and
selectively invest in best-in-class technologies to ensure Canada continues to
be a manufacturing hub and build exportable infrastructure capabilities
▪ EE buildings
▪ EE industrials
▪ Water
Energy-
efficiency
technologies 3
▪ Market is already making some investments on technology development, but
both adoption and development are slow due to structural challenges
▪ Canadian governments can drive innovation through education, incentives for
early adoption and/or progressively tightening regulatory standards
▪ Unconventional
hydro
▪ Bioenergy
▪ Waste to energy
▪ Solar
Distributed
power
generation 4
▪ Fast growth and emerging market, Canada is one of multiple countries with
technology development, but high levels of competition
▪ Canadian governments can drive global competitiveness by selectively
deploying the most appropriate levers (described on slide 18) based on
benchmarking specific Canadian technologies to global competition
▪ CCS
▪ Fuel cell systems
▪ Biorefineries and
biofuels
Potential
longer term
opportunities 5
▪ Markets are potentially attractive, but outlook and timing depends strongly on
either major regulatory shifts or technology breakthrough
▪ Postpone further large-scale government support until key developments or
major industry investment decrease the level of commercialization risk
▪ Offer “prizes” as incentives for faster development as low-risk option
DETAILS ON FOLLOWING PAGES
Market forces
are effective
▪ Traditional hydro
▪ Uranium mining
▪ Advanced trains/jets
▪ Market leaders and technologies are established
▪ Since private industry is investing to remove market barriers (e.g.,
technology, cost barriers), there is limited need for government actions
|
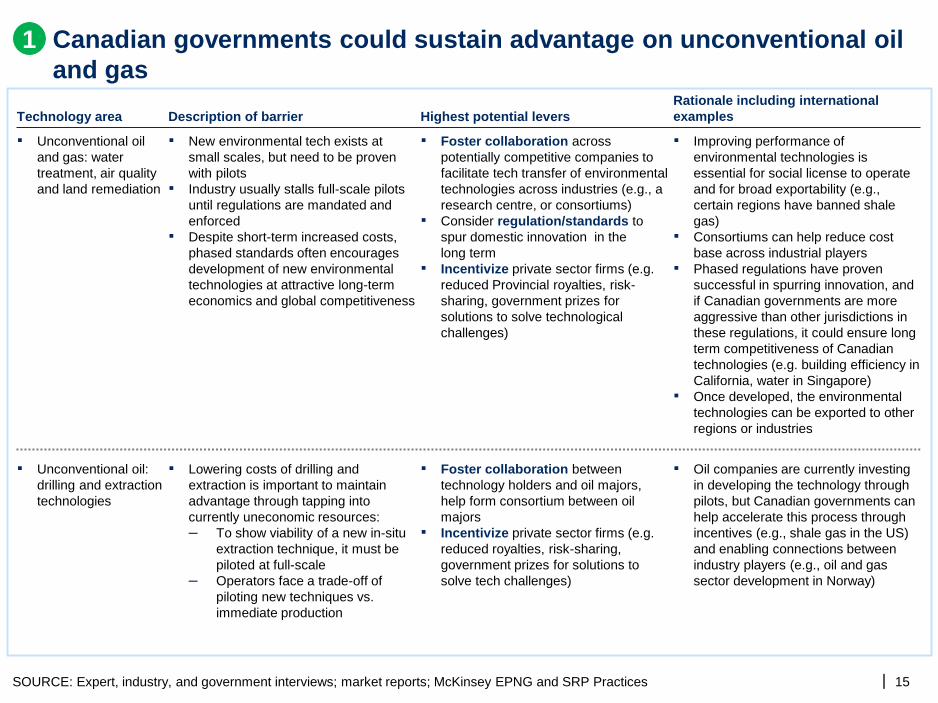
Canadian governments could sustain advantage on unconventional oil
and gas
15 SOURCE: Expert, industry, and government interviews; market reports; McKinsey EPNG and SRP Practices
1
▪ Improving performance of
environmental technologies is
essential for social license to operate
and for broad exportability (e.g.,
certain regions have banned shale
gas)
▪ Consortiums can help reduce cost
base across industrial players
▪ Phased regulations have proven
successful in spurring innovation, and
if Canadian governments are more
aggressive than other jurisdictions in
these regulations, it could ensure long
term competitiveness of Canadian
technologies (e.g. building efficiency in
California, water in Singapore)
▪ Once developed, the environmental
technologies can be exported to other
regions or industries
▪ Unconventional oil
and gas: water
treatment, air quality
and land remediation
▪ Foster collaboration across
potentially competitive companies to
facilitate tech transfer of environmental
technologies across industries (e.g., a
research centre, or consortiums)
▪ Consider regulation/standards to
spur domestic innovation in the
long term
▪ Incentivize private sector firms (e.g.
reduced Provincial royalties, risk-
sharing, government prizes for
solutions to solve technological
challenges)
▪ New environmental tech exists at
small scales, but need to be proven
with pilots
▪ Industry usually stalls full-scale pilots
until regulations are mandated and
enforced
▪ Despite short-term increased costs,
phased standards often encourages
development of new environmental
technologies at attractive long-term
economics and global competitiveness
▪ Oil companies are currently investing
in developing the technology through
pilots, but Canadian governments can
help accelerate this process through
incentives (e.g., shale gas in the US)
and enabling connections between
industry players (e.g., oil and gas
sector development in Norway)
▪ Unconventional oil:
drilling and extraction
technologies
▪ Foster collaboration between
technology holders and oil majors,
help form consortium between oil
majors
▪ Incentivize private sector firms (e.g.
reduced royalties, risk-sharing,
government prizes for solutions to
solve tech challenges)
▪ Lowering costs of drilling and
extraction is important to maintain
advantage through tapping into
currently uneconomic resources:
– To show viability of a new in-situ
extraction technique, it must be
piloted at full-scale
– Operators face a trade-off of
piloting new techniques vs.
immediate production
Rationale including international
examples Technology area Highest potential levers Description of barrier
|
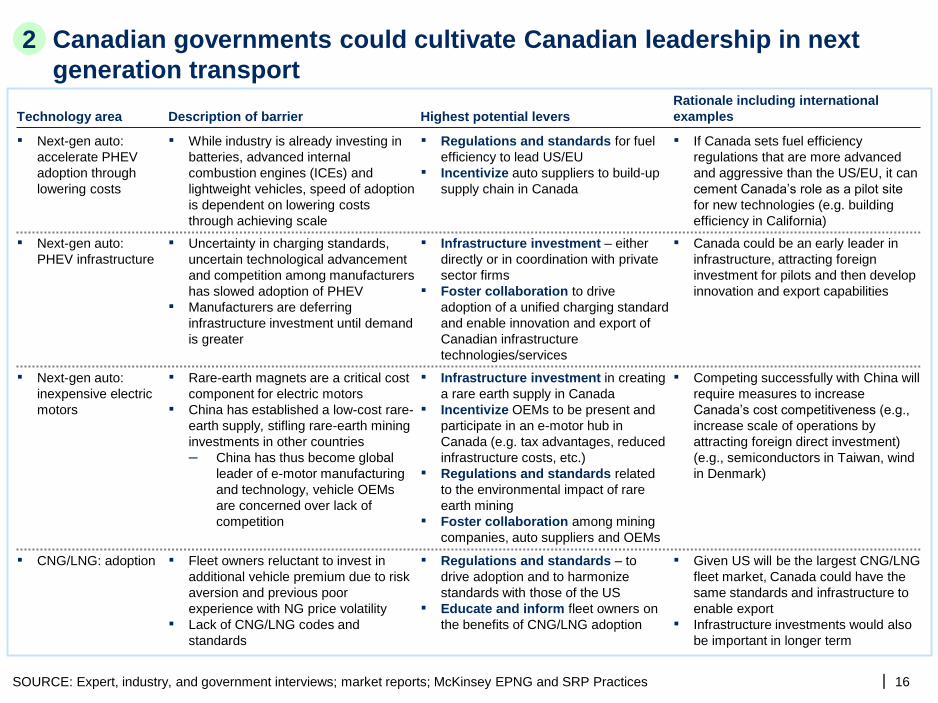
Canadian governments could cultivate Canadian leadership in next
generation transport
16 SOURCE: Expert, industry, and government interviews; market reports; McKinsey EPNG and SRP Practices
▪ While industry is already investing in
batteries, advanced internal
combustion engines (ICEs) and
lightweight vehicles, speed of adoption
is dependent on lowering costs
through achieving scale
▪ If Canada sets fuel efficiency
regulations that are more advanced
and aggressive than the US/EU, it can
cement Canada’s role as a pilot site
for new technologies (e.g. building
efficiency in California)
▪ Next-gen auto:
accelerate PHEV
adoption through
lowering costs
▪ Regulations and standards for fuel
efficiency to lead US/EU
▪ Incentivize auto suppliers to build-up
supply chain in Canada
▪ Fleet owners reluctant to invest in
additional vehicle premium due to risk
aversion and previous poor
experience with NG price volatility
▪ Lack of CNG/LNG codes and
standards
▪ Given US will be the largest CNG/LNG
fleet market, Canada could have the
same standards and infrastructure to
enable export
▪ Infrastructure investments would also
be important in longer term
▪ CNG/LNG: adoption ▪ Regulations and standards – to
drive adoption and to harmonize
standards with those of the US
▪ Educate and inform fleet owners on
the benefits of CNG/LNG adoption
▪ Next-gen auto:
inexpensive electric
motors
▪ Rare-earth magnets are a critical cost
component for electric motors
▪ China has established a low-cost rare-
earth supply, stifling rare-earth mining
investments in other countries
– China has thus become global
leader of e-motor manufacturing
and technology, vehicle OEMs
are concerned over lack of
competition
▪ Competing successfully with China will
require measures to increase
Canada’s cost competitiveness (e.g.,
increase scale of operations by
attracting foreign direct investment)
(e.g., semiconductors in Taiwan, wind
in Denmark)
▪ Infrastructure investment in creating
a rare earth supply in Canada
▪ Incentivize OEMs to be present and
participate in an e-motor hub in
Canada (e.g. tax advantages, reduced
infrastructure costs, etc.)
▪ Regulations and standards related
to the environmental impact of rare
earth mining
▪ Foster collaboration among mining
companies, auto suppliers and OEMs
Technology area Description of barrier
2
Rationale including international
examples Highest potential levers
▪ Uncertainty in charging standards,
uncertain technological advancement
and competition among manufacturers
has slowed adoption of PHEV
▪ Manufacturers are deferring
infrastructure investment until demand
is greater
▪ Next-gen auto:
PHEV infrastructure
▪ Infrastructure investment – either
directly or in coordination with private
sector firms
▪ Foster collaboration to drive
adoption of a unified charging standard
and enable innovation and export of
Canadian infrastructure
technologies/services
▪ Canada could be an early leader in
infrastructure, attracting foreign
investment for pilots and then develop
innovation and export capabilities
|
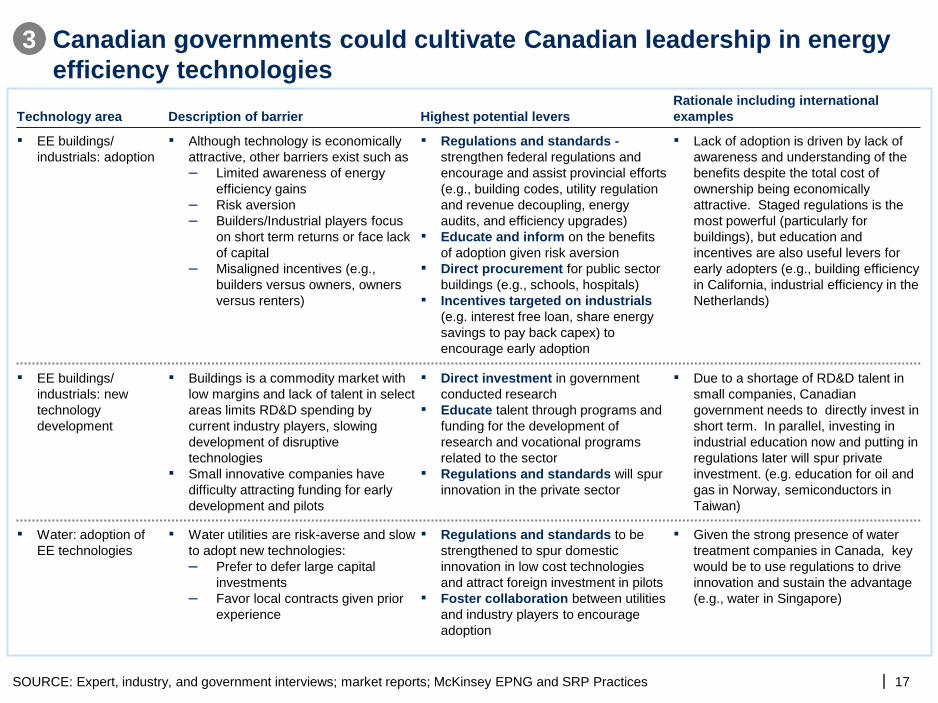
Technology area Description of barrier
Canadian governments could cultivate Canadian leadership in energy
efficiency technologies
17 SOURCE: Expert, industry, and government interviews; market reports; McKinsey EPNG and SRP Practices
▪ Buildings is a commodity market with
low margins and lack of talent in select
areas limits RD&D spending by
current industry players, slowing
development of disruptive
technologies
▪ Small innovative companies have
difficulty attracting funding for early
development and pilots
▪ Due to a shortage of RD&D talent in
small companies, Canadian
government needs to directly invest in
short term. In parallel, investing in
industrial education now and putting in
regulations later will spur private
investment. (e.g. education for oil and
gas in Norway, semiconductors in
Taiwan)
▪ EE buildings/
industrials: new
technology
development
▪ Direct investment in government
conducted research
▪ Educate talent through programs and
funding for the development of
research and vocational programs
related to the sector
▪ Regulations and standards will spur
innovation in the private sector
▪ EE buildings/
industrials: adoption
▪ Although technology is economically
attractive, other barriers exist such as
– Limited awareness of energy
efficiency gains
– Risk aversion
– Builders/Industrial players focus
on short term returns or face lack
of capital
– Misaligned incentives (e.g.,
builders versus owners, owners
versus renters)
▪ Lack of adoption is driven by lack of
awareness and understanding of the
benefits despite the total cost of
ownership being economically
attractive. Staged regulations is the
most powerful (particularly for
buildings), but education and
incentives are also useful levers for
early adopters (e.g., building efficiency
in California, industrial efficiency in the
Netherlands)
▪ Regulations and standards -
strengthen federal regulations and
encourage and assist provincial efforts
(e.g., building codes, utility regulation
and revenue decoupling, energy
audits, and efficiency upgrades)
▪ Educate and inform on the benefits
of adoption given risk aversion
▪ Direct procurement for public sector
buildings (e.g., schools, hospitals)
▪ Incentives targeted on industrials
(e.g. interest free loan, share energy
savings to pay back capex) to
encourage early adoption
▪ Water utilities are risk-averse and slow
to adopt new technologies:
– Prefer to defer large capital
investments
– Favor local contracts given prior
experience
▪ Given the strong presence of water
treatment companies in Canada, key
would be to use regulations to drive
innovation and sustain the advantage
(e.g., water in Singapore)
▪ Water: adoption of
EE technologies
▪ Regulations and standards to be
strengthened to spur domestic
innovation in low cost technologies
and attract foreign investment in pilots
▪ Foster collaboration between utilities
and industry players to encourage
adoption
3
Rationale including international
examples Highest potential levers
|
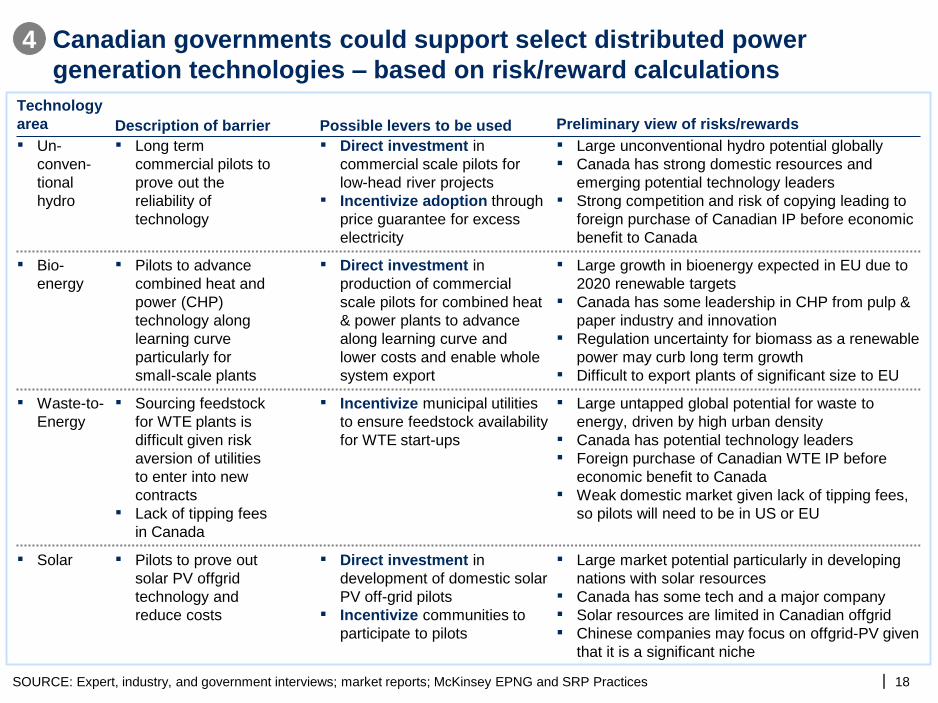
Canadian governments could support select distributed power
generation technologies – based on risk/reward calculations
18 SOURCE: Expert, industry, and government interviews; market reports; McKinsey EPNG and SRP Practices
4
Technology
area Preliminary view of risks/rewards
▪ Bio-
energy
▪ Large growth in bioenergy expected in EU due to
2020 renewable targets
▪ Canada has some leadership in CHP from pulp &
paper industry and innovation
▪ Regulation uncertainty for biomass as a renewable
power may curb long term growth
▪ Difficult to export plants of significant size to EU
▪ Direct investment in
production of commercial
scale pilots for combined heat
& power plants to advance
along learning curve and
lower costs and enable whole
system export
▪ Pilots to advance
combined heat and
power (CHP)
technology along
learning curve
particularly for
small-scale plants
▪ Waste-to-
Energy
▪ Large untapped global potential for waste to
energy, driven by high urban density
▪ Canada has potential technology leaders
▪ Foreign purchase of Canadian WTE IP before
economic benefit to Canada
▪ Weak domestic market given lack of tipping fees,
so pilots will need to be in US or EU
▪ Incentivize municipal utilities
to ensure feedstock availability
for WTE start-ups
▪ Sourcing feedstock
for WTE plants is
difficult given risk
aversion of utilities
to enter into new
contracts
▪ Lack of tipping fees
in Canada
▪ Solar ▪ Large market potential particularly in developing
nations with solar resources
▪ Canada has some tech and a major company
▪ Solar resources are limited in Canadian offgrid
▪ Chinese companies may focus on offgrid-PV given
that it is a significant niche
▪ Direct investment in
development of domestic solar
PV off-grid pilots
▪ Incentivize communities to
participate to pilots
▪ Pilots to prove out
solar PV offgrid
technology and
reduce costs
▪ Un-
conven-
tional
hydro
▪ Direct investment in
commercial scale pilots for
low-head river projects
▪ Incentivize adoption through
price guarantee for excess
electricity
▪ Large unconventional hydro potential globally
▪ Canada has strong domestic resources and
emerging potential technology leaders
▪ Strong competition and risk of copying leading to
foreign purchase of Canadian IP before economic
benefit to Canada
▪ Long term
commercial pilots to
prove out the
reliability of
technology
Possible levers to be used Description of barrier
|
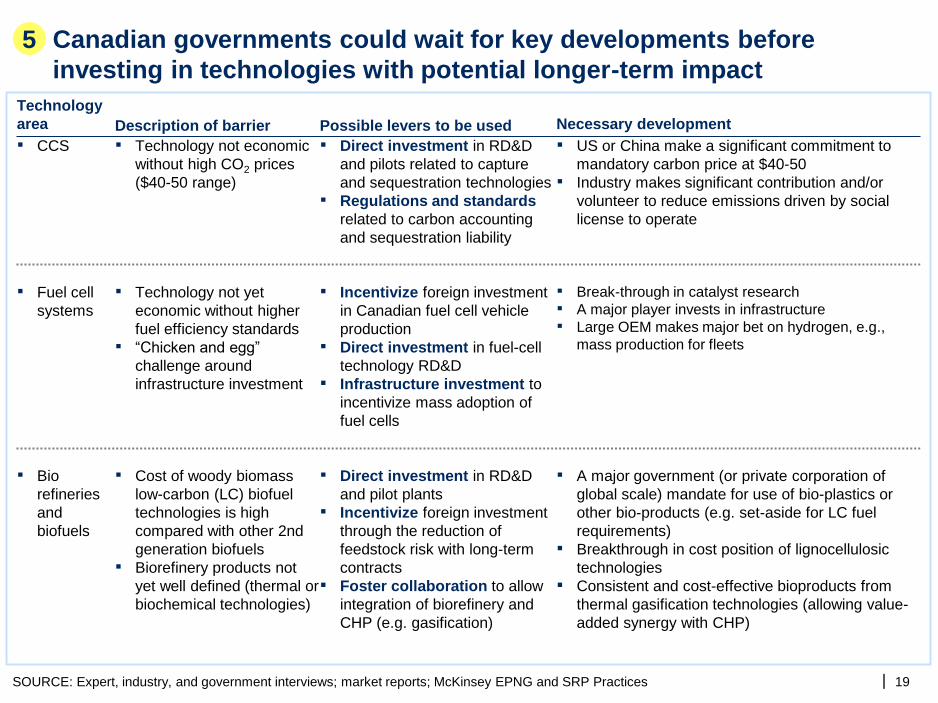
Technology
area Necessary development
Canadian governments could wait for key developments before
investing in technologies with potential longer-term impact
19 SOURCE: Expert, industry, and government interviews; market reports; McKinsey EPNG and SRP Practices
5
Possible levers to be used Description of barrier
▪ CCS ▪ US or China make a significant commitment to
mandatory carbon price at $40-50
▪ Industry makes significant contribution and/or
volunteer to reduce emissions driven by social
license to operate
▪ Direct investment in RD&D
and pilots related to capture
and sequestration technologies
▪ Regulations and standards
related to carbon accounting
and sequestration liability
▪ Technology not economic
without high CO2 prices
($40-50 range)
▪ Fuel cell
systems
▪ Break-through in catalyst research
▪ A major player invests in infrastructure
▪ Large OEM makes major bet on hydrogen, e.g.,
mass production for fleets
▪ Incentivize foreign investment
in Canadian fuel cell vehicle
production
▪ Direct investment in fuel-cell
technology RD&D
▪ Infrastructure investment to
incentivize mass adoption of
fuel cells
▪ Technology not yet
economic without higher
fuel efficiency standards
▪ “Chicken and egg”
challenge around
infrastructure investment
▪ Bio
refineries
and
biofuels
▪ Direct investment in RD&D
and pilot plants
▪ Incentivize foreign investment
through the reduction of
feedstock risk with long-term
contracts
▪ Foster collaboration to allow
integration of biorefinery and
CHP (e.g. gasification)
▪ A major government (or private corporation of
global scale) mandate for use of bio-plastics or
other bio-products (e.g. set-aside for LC fuel
requirements)
▪ Breakthrough in cost position of lignocellulosic
technologies
▪ Consistent and cost-effective bioproducts from
thermal gasification technologies (allowing value-
added synergy with CHP)
▪ Cost of woody biomass
low-carbon (LC) biofuel
technologies is high
compared with other 2nd
generation biofuels
▪ Biorefinery products not
yet well defined (thermal or
biochemical technologies)

| 20
Appendix – case studies, individual technologies
| 21
In the 1980s, Denmark’s government recognized the need for greater energy independence and
lower GHG emissions
▪ Made a decision to accept short-term economic pain for longer-term benefit
Government used multiple levers to establish and grow its wind industry
▪ Investment in R&D including testing centers for new technologies
▪
▪
Gradually decreasing subsidies, a carbon tax, and a Feed-in Tariff (FIT) with guaranteed grid
connection reduced risk to investors by ensuring reliable revenues
Technology standards to ensure quality
▪ Stable demand has reduced regulatory risk and matured the wind industry, encouraging Danish
pension funds to invest
Today, Denmark is energy independent and holds 40% market share in the wind industry
Case study – Wind power in Denmark
SOURCE: Government websites, press search
| 22
Ministry of Economic Affairs makes Long Term Agreements (LTAs) with industry, which are voluntary,
collaborative compacts to reduce energy intensity of operations and feedstock
▪
▪
▪
▪
Companies perform EE assessments, draw plans for reduction and expected impact, and monitor
and report progress
New plans are submitted every 4 years to push continual improvement and provide consistency to
companies and the efficiency industry
Efficiency measures are required to be economical with payback periods of 5 years or less
Government agency, Senternovem, assists companies in creating plans, navigating policy, and
sharing best practices
Since its inception in 1990s, LTA program has:
▪
▪
Signed on over 1,000 companies representing 90% of industrial energy consumption
Yielded a ~20% increase in efficiency
Case study – Industrial energy efficiency in the Netherlands
SOURCE: Government websites, press search
| 23
National agency, Institute of Sugar and Alcohol, created to manage ethanol industry
▪
▪
▪
▪
▪
▪
▪
Direct investment in infrastructure projects
Low-cost credit and financing to sugarcane industry to grow feedstock supply
Mandatory ethanol blending in vehicle fuels; voluntary and then mandatory manufacturing targets
of ethanol-only vehicles; provided industry time to adapt
Ethanol-only government fleets provide consistent demand
Education to create consumer demand
Collaboration with US government to share technology and create international standards
In response to rising prices in 2011, government implemented a temporary reduction in the fuel-
blending minimum from 25% to 18%
Brazil has captured a strong share of ethanol market
▪
▪
Second largest producer behind US
For several years, was largest exporter
Case study – Ethanol in Brazil
SOURCE: Government websites, press search

| 24
Case study – Water efficiency in Singapore
SOURCE: Government websites, press search
Despite limited natural resources, Singapore has become increasingly efficient due to the
government’s holistic approach to management:
▪
▪
▪▪
▪
▪
National supply is provided by the “Four Taps” – local water catchments, imports, reclaimed water,
and desalination
Three agencies dominate water management – the Ministry of the Environment and Water
Resources (MEWR), the Public Utilities Board (PUB), and the National Environment Agency (NEA)
Regulations: Careful land management by PUB protects reservoirs from pollution
Government has funded R&D, facilities, and marketing campaigns for reclaimed water, called
NEWater, which is fed into industrial uses and drinking supplies; also funded R&D and facilities for
desalination
Incentives: Pricing was adjusted to remove subsidies and reflect the full cost of supplying water,
encouraging conservation
Foster collaboration: The Environment and Water Industry Development Council was established
to support the development of Singapore as a water research hub, including attracting foreign and
private sector investment
Singapore is on-track to becoming water-independent
▪▪
Water agreements with Malaysia have been allowed to expire due to Singapore’s lower needs
Reclaimed water provides 30% of demand and desalination supplies 10%; these numbers are
expected to grow to 50% and 30%, respectively, within the next few decades
| 25
California’s Title 24 code is on the leading edge of building efficiency standards1
▪
▪
Standards & regulations: 2014 code update will make California standards among the most
efficient in the US and world
The code is expected to continue increasing in stringency over time, offering both consistency and
time to adapt
– Independent panel of engineers decide net present value (NPV) and payback of new efficiency
technologies
– Technologies with payback of 7 years or less are included in code; builders given 3 years to
adopt newly-included technologies
▪
▪
Performance-based standards allow flexibility in implementation
– Builders can either adopt designated technologies or show, using government-approved
models, equivalent performance of alternative technologies, which motivates innovation
Pairs with appliance efficiency standards and more stringent voluntary standards
▪ “Public goods fee” on utility bills used to fund efficiency programs and updates to the building code;
reliable funding ensures continuation of efficiency efforts and consistency for the industry
Due to building codes, other energy efficiency measures, and some climate effects, California:
▪
▪
Has second-lowest per capita energy consumption of the US states
Has experienced lower growth in total energy consumption than most other US states
Case study – Energy efficient buildings in California
1 Comparisons of codes are complicated by climate differences, but California's standards are used as a model by other jurisdictions, including US
states and other countries
SOURCE: Government websites, press search
| 26
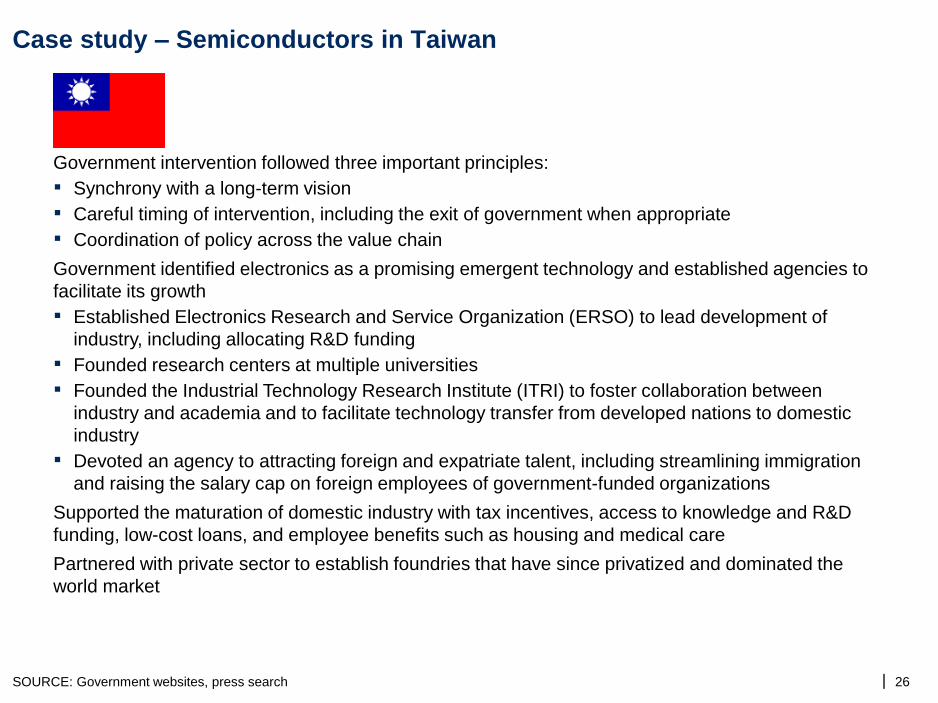
Government intervention followed three important principles:
▪▪▪
Synchrony with a long-term vision
Careful timing of intervention, including the exit of government when appropriate
Coordination of policy across the value chain
Government identified electronics as a promising emergent technology and established agencies to
facilitate its growth
▪
▪▪
Established Electronics Research and Service Organization (ERSO) to lead development of
industry, including allocating R&D funding
Founded research centers at multiple universities
Founded the Industrial Technology Research Institute (ITRI) to foster collaboration between
industry and academia and to facilitate technology transfer from developed nations to domestic
industry
▪ Devoted an agency to attracting foreign and expatriate talent, including streamlining immigration
and raising the salary cap on foreign employees of government-funded organizations
Supported the maturation of domestic industry with tax incentives, access to knowledge and R&D
funding, low-cost loans, and employee benefits such as housing and medical care
Partnered with private sector to establish foundries that have since privatized and dominated the
world market
Case study – Semiconductors in Taiwan
SOURCE: Government websites, press search
| 27
Case study – Exporting in Israel
SOURCE: Statistics Canada, Israel Central Bureau of Statistics, expert interview
Israel exports high-value-add goods (24% chemicals, 20% electronics1) to a diverse set of
markets (24% US, 30% EU, 22% Asia, 24% other2)
A number of government agencies offer support to domestic companies selling abroad
▪
▪
▪
Foreign Ministry sets up representative offices in target markets to introduce Israeli companies to
potential trading partners and offer resources and infrastructure(e.g., office space, assistance
navigating immigration law)
America-Israel Chambers of Commerce introduce US companies and investors to Israeli industries
in order to attract trade and investment
Israel Export and International Cooperation Institute (IEICI) founded by government and private
sector to facilitate exports
Israel’s annual exports are worth C$80 billion
1 Includes office equipment and appliances
2 Excludes diamonds
| 28
Government has provided support at each stage of the shale gas industry’s development
▪
▪
▪
▪
▪
Mineral-rights law gives landowners rather than government consistent rights to resources,
encouraging exploration and exploitation of resources
Government-funded research produced necessary equipment and processes
Public-private partnerships demonstrated commercial-scale operations
Production tax credit lasting ~20 years incented production before it was independently
economical
Regulations are transparent and largely standardized with some variation among States
▪ There is room for further research and environmental regulations to improve public acceptance
US has become a global leader in shale gas
▪
▪
US companies and operations are on leading edge of technology development
Rapid increase in production dropped natural gas prices, encouraging NG consumption, and
spurred interest in exploiting shale gas resources outside the US
Case study – Shale gas in the US
SOURCE: Government websites, press search

| 29
Case study – Oil and gas in Norway
SOURCE: McKinsey EPNG Practice, press search
Government identified four tasks for itself:
▪▪
▪▪
Establish long term vision, aligned with key stakeholders, and manifested in proactive adjustments to regulations
Leverage experience of international oil companies through a thoughtful resource access policy for frontier
exploration
Ensure competition among companies
Support local R&D
Government used four primary instruments:
▪▪
Access to Norwegian Continental Shelf to bring in foreign players with knowledge
Support domestic players (including government-owned Statoil)
– Education system was adjusted to train locals and build training capacity
– Licensing system required involvement of national players in all oil and gas (O&G) operations
– Policies (e.g., recommendations in licenses, joint ventures facilitating knowledge transfer) encouraged
contracting of domestic oil field service and equipment (OFSE) players
– Gradually decreasing support gave national players time to develop and establish strong domestic presences
before extending operations internationally
▪
▪
Frequent adjustments to fiscal regime incents research, exploration, development (e.g., investments in R&D are
deducted from taxable income)
Support for innovation using a combination of levers (e.g., Statoil program provided technical and financial
expertise, piloting, and mentorship for startups with O&G technologies)
Today, Norway is third largest exporter of oil and sixth largest producer of gas
▪▪
Revenues from O&G industry fed into large Petroleum Fund and pension funds
Norwegian OFSE sector is a key exporter with nearly half of revenue ($45 billion in 2009) from international sales
| 30
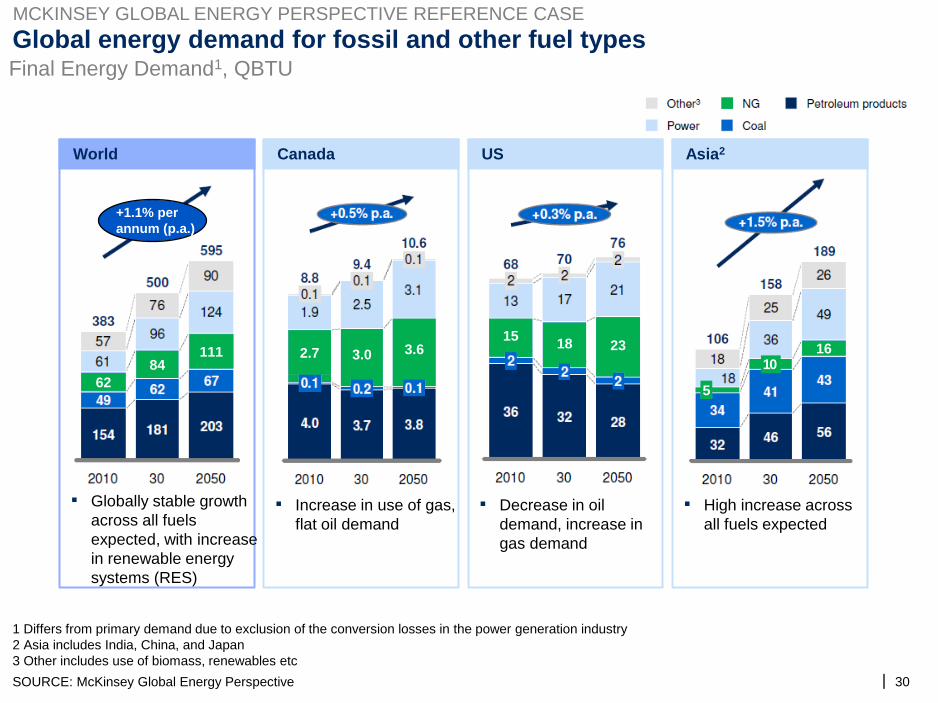
Global energy demand for fossil and other fuel types
1 Differs from primary demand due to exclusion of the conversion losses in the power generation industry
2 Asia includes India, China, and Japan
3 Other includes use of biomass, renewables etc
SOURCE: McKinsey Global Energy Perspective
Final Energy Demand1, QBTU
World
▪ Globally stable growth
across all fuels
expected, with increase
in renewable energy
systems (RES)
Canada US Asia2
▪ Increase in use of gas,
flat oil demand
▪ Decrease in oil
demand, increase in
gas demand
▪ High increase across
all fuels expected
MCKINSEY GLOBAL ENERGY PERSPECTIVE REFERENCE CASE
5
10 16
62
84 111 3.0 3.6 2.7
15 18 23
+1.1% per
annum (p.a.)
| 31
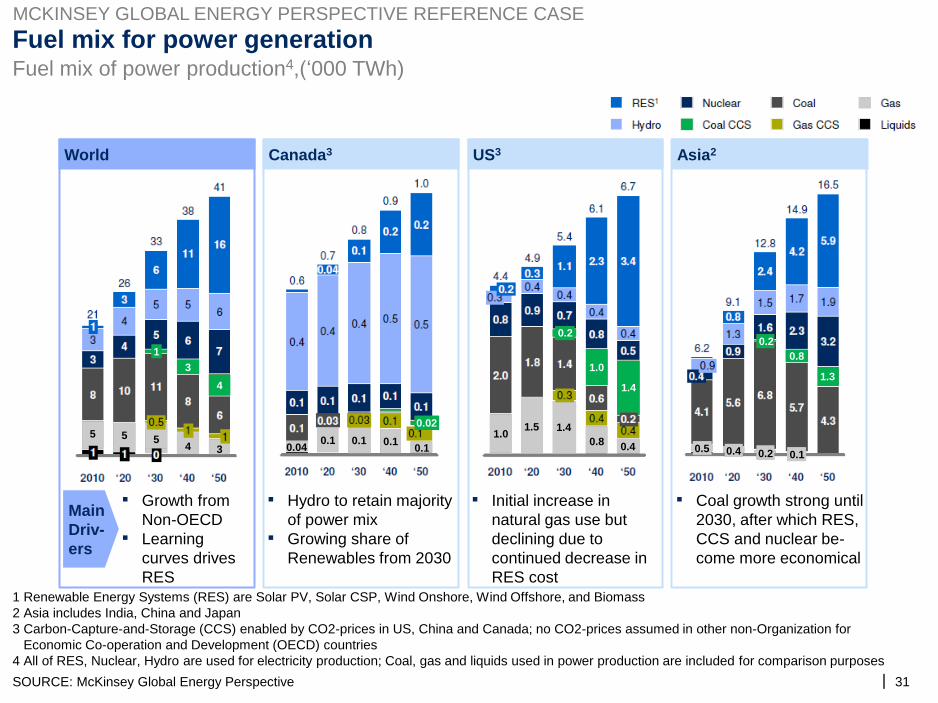
Fuel mix for power generation
1 Renewable Energy Systems (RES) are Solar PV, Solar CSP, Wind Onshore, Wind Offshore, and Biomass
2 Asia includes India, China and Japan
3 Carbon-Capture-and-Storage (CCS) enabled by CO2-prices in US, China and Canada; no CO2-prices assumed in other non-Organization for
Economic Co-operation and Development (OECD) countries
4 All of RES, Nuclear, Hydro are used for electricity production; Coal, gas and liquids used in power production are included for comparison purposes
SOURCE: McKinsey Global Energy Perspective
Fuel mix of power production4,(‘000 TWh)
World Canada3 US3 Asia2
▪ Growth from
Non-OECD
▪ Learning
curves drives
RES
▪ Hydro to retain majority
of power mix
▪ Growing share of
Renewables from 2030
▪ Initial increase in
natural gas use but
declining due to
continued decrease in
RES cost
▪ Coal growth strong until
2030, after which RES,
CCS and nuclear be-
come more economical
Main
Driv-
ers
1
3
4
5 5 5 4 3
0.02
0.04 0.1 0.1 0.1
0.1
1.0
1.4
0.2
1.0 1.5 1.4
0.8 0.4
0.2
0.8
1.3
0.5 0.4 0.2 0.1
MCKINSEY GLOBAL ENERGY PERSPECTIVE REFERENCE CASE
| 32
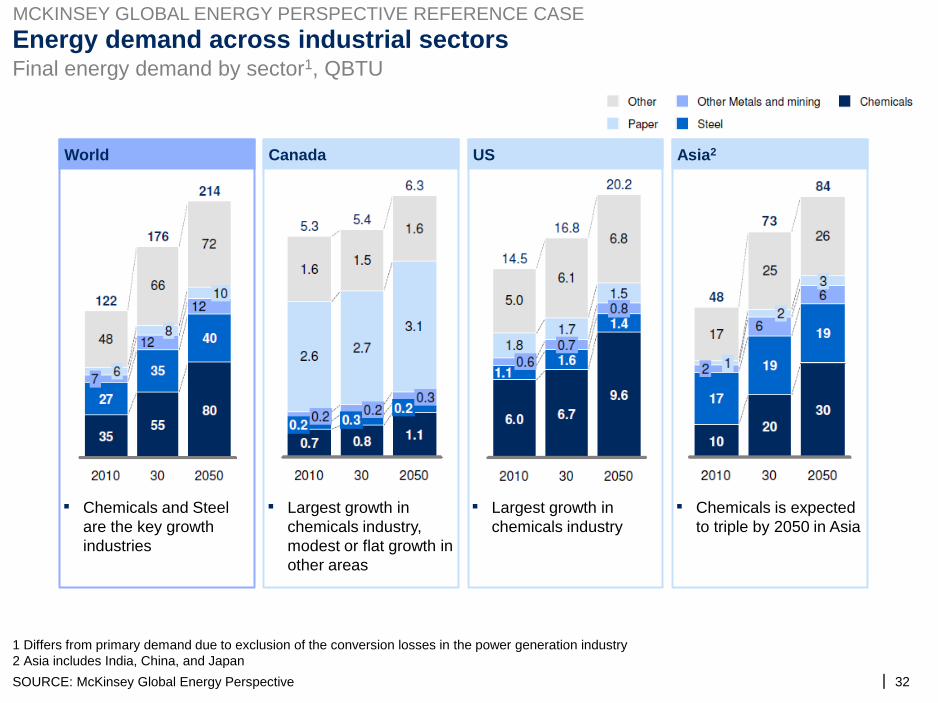
Energy demand across industrial sectors
1 Differs from primary demand due to exclusion of the conversion losses in the power generation industry
2 Asia includes India, China, and Japan
SOURCE: McKinsey Global Energy Perspective
Final energy demand by sector1, QBTU
World Canada US Asia2
▪ Chemicals and Steel
are the key growth
industries
▪ Largest growth in
chemicals industry,
modest or flat growth in
other areas
▪ Largest growth in
chemicals industry
▪ Chemicals is expected
to triple by 2050 in Asia
MCKINSEY GLOBAL ENERGY PERSPECTIVE REFERENCE CASE

| 33
Energy demand across transportation sectors
1 Differs from primary demand due to exclusion of the conversion losses in the power generation industry
2 Asia includes India, China, and Japan
SOURCE: McKinsey Global Energy Perspective
Final energy demand by sector1, QBTU
MCKINSEY GLOBAL ENERGY PERSPECTIVE REFERENCE CASE
Global Canada US Asia2
▪ Light vehicles (LV) and
hybrid vehicles (HV)
constitute ~ 80% of
total transport
▪ HV is expected to grow
more than the LV
sector due to EV
▪ Decrease in demand
across LV, due to
increase in efficiency
and tech development
▪ Decrease in demand
across LV, due to
increase in efficiency
and tech development
▪ Large increases in
demand across LV, HV
and Aviation sectors
driven by economic
growth
31
40
54
11 15
23
0.6 0.7 0.7
0.2 0.2 0.2
5.7 5.6 5.9
3.0 2.8 3.1
12
9
5 3
6
2
| 34
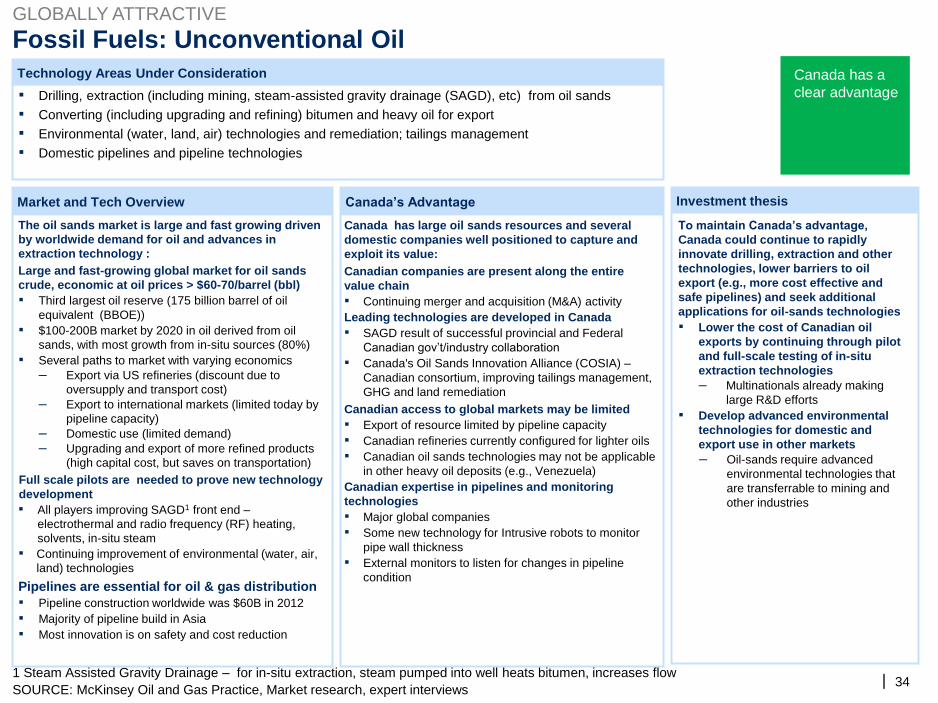
Market and Tech Overview Canada’s Advantage Investment thesis
Technology Areas Under Consideration
Fossil Fuels: Unconventional Oil
SOURCE: McKinsey Oil and Gas Practice, Market research, expert interviews
1 Steam Assisted Gravity Drainage – for in-situ extraction, steam pumped into well heats bitumen, increases flow
▪ Drilling, extraction (including mining, steam-assisted gravity drainage (SAGD), etc) from oil sands
▪ Converting (including upgrading and refining) bitumen and heavy oil for export
▪ Environmental (water, land, air) technologies and remediation; tailings management
▪ Domestic pipelines and pipeline technologies
To maintain Canada’s advantage,
Canada could continue to rapidly
innovate drilling, extraction and other
technologies, lower barriers to oil
export (e.g., more cost effective and
safe pipelines) and seek additional
applications for oil-sands technologies
▪ Lower the cost of Canadian oil
exports by continuing through pilot
and full-scale testing of in-situ
extraction technologies
– Multinationals already making
large R&D efforts
▪ Develop advanced environmental
technologies for domestic and
export use in other markets
– Oil-sands require advanced
environmental technologies that
are transferrable to mining and
other industries
Canada has large oil sands resources and several
domestic companies well positioned to capture and
exploit its value:
Canadian companies are present along the entire
value chain
▪ Continuing merger and acquisition (M&A) activity
Leading technologies are developed in Canada
▪ SAGD result of successful provincial and Federal
Canadian gov’t/industry collaboration
▪ Canada's Oil Sands Innovation Alliance (COSIA) –
Canadian consortium, improving tailings management,
GHG and land remediation
Canadian access to global markets may be limited
▪▪▪
Export of resource limited by pipeline capacity
Canadian refineries currently configured for lighter oils
Canadian oil sands technologies may not be applicable
in other heavy oil deposits (e.g., Venezuela)
Canadian expertise in pipelines and monitoring
technologies
▪▪
▪
Major global companies
Some new technology for Intrusive robots to monitor
pipe wall thickness
External monitors to listen for changes in pipeline
condition
GLOBALLY ATTRACTIVE
The oil sands market is large and fast growing driven
by worldwide demand for oil and advances in
extraction technology :
Large and fast-growing global market for oil sands
crude, economic at oil prices > $60-70/barrel (bbl)
▪
▪
▪
Third largest oil reserve (175 billion barrel of oil
equivalent (BBOE))
$100-200B market by 2020 in oil derived from oil
sands, with most growth from in-situ sources (80%)
Several paths to market with varying economics
– Export via US refineries (discount due to
oversupply and transport cost)
– Export to international markets (limited today by
pipeline capacity)
– Domestic use (limited demand)
– Upgrading and export of more refined products
(high capital cost, but saves on transportation)
Full scale pilots are needed to prove new technology
development
▪ All players improving SAGD1 front end –
electrothermal and radio frequency (RF) heating,
solvents, in-situ steam
▪ Continuing improvement of environmental (water, air,
land) technologies
Pipelines are essential for oil & gas distribution
▪▪▪
Pipeline construction worldwide was $60B in 2012
Majority of pipeline build in Asia
Most innovation is on safety and cost reduction
Canada has a
clear advantage
| 35
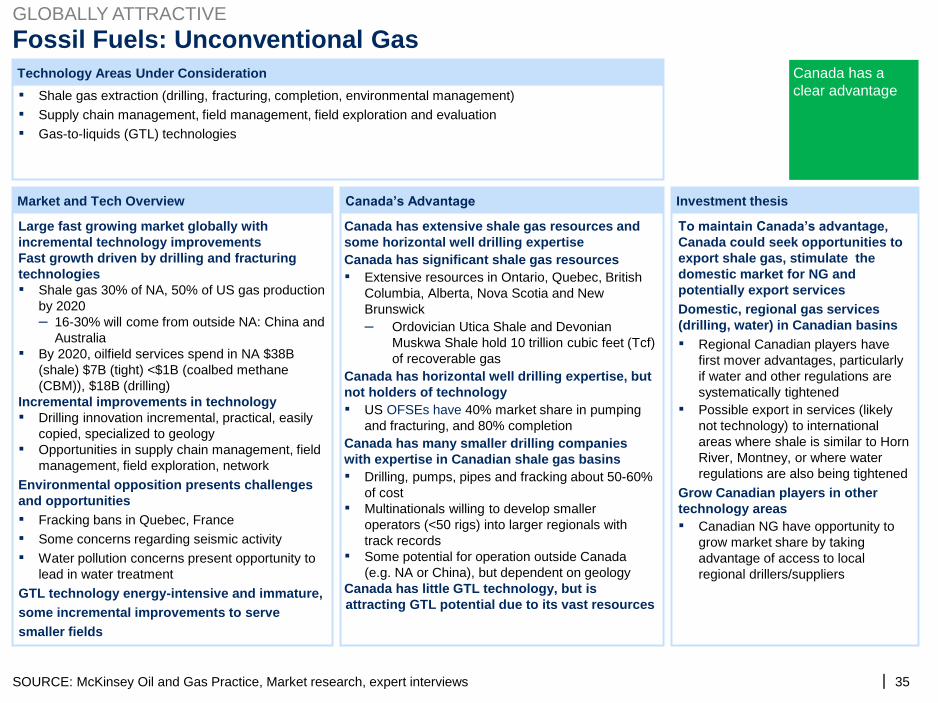
Investment thesis
Fossil Fuels: Unconventional Gas
SOURCE: McKinsey Oil and Gas Practice, Market research, expert interviews
▪▪▪
Shale gas extraction (drilling, fracturing, completion, environmental management)
Supply chain management, field management, field exploration and evaluation
Gas-to-liquids (GTL) technologies
Canada has extensive shale gas resources and
some horizontal well drilling expertise
Canada has significant shale gas resources
▪ Extensive resources in Ontario, Quebec, British
Columbia, Alberta, Nova Scotia and New
Brunswick
– Ordovician Utica Shale and Devonian
Muskwa Shale hold 10 trillion cubic feet (Tcf)
of recoverable gas
Canada has horizontal well drilling expertise, but
not holders of technology
▪ US OFSEs have 40% market share in pumping
and fracturing, and 80% completion
Canada has many smaller drilling companies
with expertise in Canadian shale gas basins
▪
▪
▪
Drilling, pumps, pipes and fracking about 50-60%
of cost
Multinationals willing to develop smaller
operators (<50 rigs) into larger regionals with
track records
Some potential for operation outside Canada
(e.g. NA or China), but dependent on geology
Canada has little GTL technology, but is
attracting GTL potential due to its vast resources
Large fast growing market globally with
incremental technology improvements
Fast growth driven by drilling and fracturing
technologies
▪
▪
Shale gas 30% of NA, 50% of US gas production
by 2020
– 16-30% will come from outside NA: China and
Australia
By 2020, oilfield services spend in NA $38B
(shale) $7B (tight) <$1B (coalbed methane
(CBM)), $18B (drilling)
Incremental improvements in technology
▪
▪
Drilling innovation incremental, practical, easily
copied, specialized to geology
Opportunities in supply chain management, field
management, field exploration, network
Environmental opposition presents challenges
and opportunities
▪▪▪
Fracking bans in Quebec, France
Some concerns regarding seismic activity
Water pollution concerns present opportunity to
lead in water treatment
GTL technology energy-intensive and immature,
some incremental improvements to serve
smaller fields
To maintain Canada’s advantage,
Canada could seek opportunities to
export shale gas, stimulate the
domestic market for NG and
potentially export services
Domestic, regional gas services
(drilling, water) in Canadian basins
▪
▪
Regional Canadian players have
first mover advantages, particularly
if water and other regulations are
systematically tightened
Possible export in services (likely
not technology) to international
areas where shale is similar to Horn
River, Montney, or where water
regulations are also being tightened
Grow Canadian players in other
technology areas
▪ Canadian NG have opportunity to
grow market share by taking
advantage of access to local
regional drillers/suppliers
GLOBALLY ATTRACTIVE
Market and Tech Overview Canada’s Advantage
Canada has a
clear advantage
Technology Areas Under Consideration
| 36
Market and Tech Overview Canada’s Advantage Investment thesis
Technology Areas Under Consideration
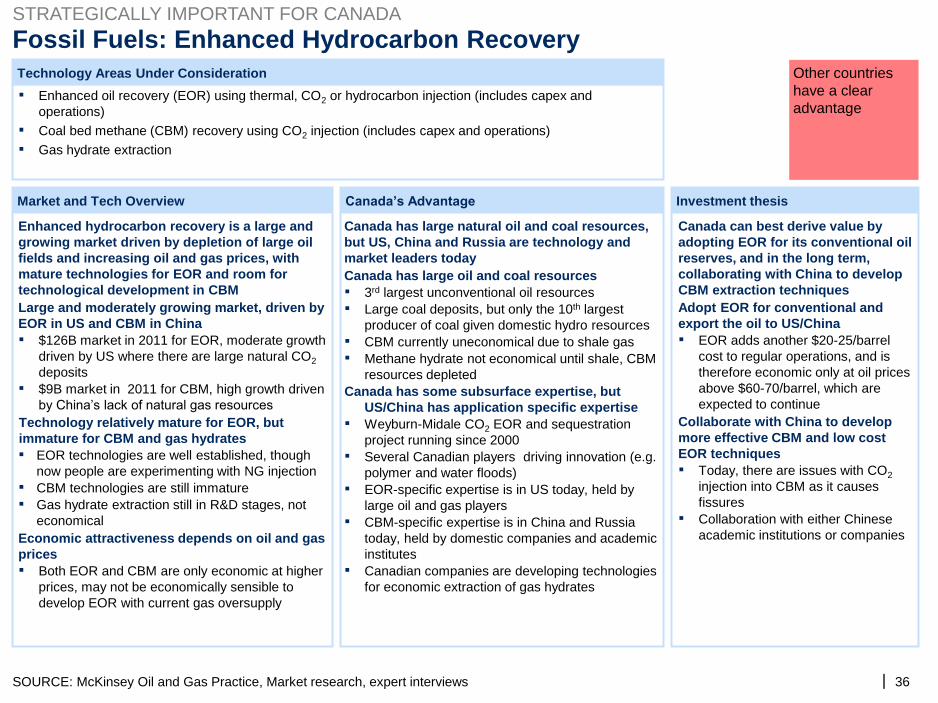
Fossil Fuels: Enhanced Hydrocarbon Recovery
SOURCE: McKinsey Oil and Gas Practice, Market research, expert interviews
▪
▪▪
Enhanced oil recovery (EOR) using thermal, CO2 or hydrocarbon injection (includes capex and
operations)
Coal bed methane (CBM) recovery using CO2 injection (includes capex and operations)
Gas hydrate extraction
Canada has large natural oil and coal resources,
but US, China and Russia are technology and
market leaders today
Canada has large oil and coal resources
▪▪
▪▪
3rd largest unconventional oil resources
Large coal deposits, but only the 10th largest
producer of coal given domestic hydro resources
CBM currently uneconomical due to shale gas
Methane hydrate not economical until shale, CBM
resources depleted
Canada has some subsurface expertise, but
US/China has application specific expertise
▪
▪
▪
▪
▪
Weyburn-Midale CO2 EOR and sequestration
project running since 2000
Several Canadian players driving innovation (e.g.
polymer and water floods)
EOR-specific expertise is in US today, held by
large oil and gas players
CBM-specific expertise is in China and Russia
today, held by domestic companies and academic
institutes
Canadian companies are developing technologies
for economic extraction of gas hydrates
Enhanced hydrocarbon recovery is a large and
growing market driven by depletion of large oil
fields and increasing oil and gas prices, with
mature technologies for EOR and room for
technological development in CBM
Large and moderately growing market, driven by
EOR in US and CBM in China
▪
▪
$126B market in 2011 for EOR, moderate growth
driven by US where there are large natural CO2
deposits
$9B market in 2011 for CBM, high growth driven
by China’s lack of natural gas resources
Technology relatively mature for EOR, but
immature for CBM and gas hydrates
▪
▪▪
EOR technologies are well established, though
now people are experimenting with NG injection
CBM technologies are still immature
Gas hydrate extraction still in R&D stages, not
economical
Economic attractiveness depends on oil and gas
prices
▪ Both EOR and CBM are only economic at higher
prices, may not be economically sensible to
develop EOR with current gas oversupply
Canada can best derive value by
adopting EOR for its conventional oil
reserves, and in the long term,
collaborating with China to develop
CBM extraction techniques
Adopt EOR for conventional and
export the oil to US/China
▪ EOR adds another $20-25/barrel
cost to regular operations, and is
therefore economic only at oil prices
above $60-70/barrel, which are
expected to continue
Collaborate with China to develop
more effective CBM and low cost
EOR techniques
▪
▪
Today, there are issues with CO2
injection into CBM as it causes
fissures
Collaboration with either Chinese
academic institutions or companies
STRATEGICALLY IMPORTANT FOR CANADA
Other countries
have a clear
advantage
| 37
Market and Tech Overview Canada’s Advantage Investment thesis
Technology Areas Under Consideration
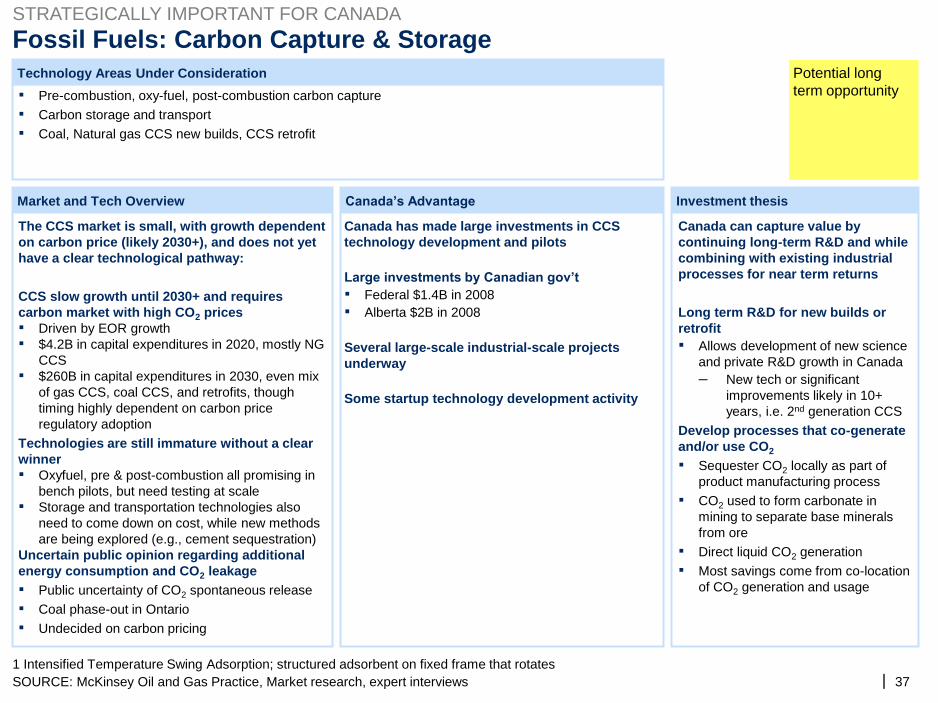
Fossil Fuels: Carbon Capture & Storage
SOURCE: McKinsey Oil and Gas Practice, Market research, expert interviews
Canada has made large investments in CCS
technology development and pilots
Large investments by Canadian gov’t
▪▪
Federal $1.4B in 2008
Alberta $2B in 2008
Several large-scale industrial-scale projects
underway
Some startup technology development activity
The CCS market is small, with growth dependent
on carbon price (likely 2030+), and does not yet
have a clear technological pathway:
CCS slow growth until 2030+ and requires
carbon market with high CO2 prices
▪▪
▪
Driven by EOR growth
$4.2B in capital expenditures in 2020, mostly NG
CCS
$260B in capital expenditures in 2030, even mix
of gas CCS, coal CCS, and retrofits, though
timing highly dependent on carbon price
regulatory adoption
Technologies are still immature without a clear
winner
▪
▪
Oxyfuel, pre & post-combustion all promising in
bench pilots, but need testing at scale
Storage and transportation technologies also
need to come down on cost, while new methods
are being explored (e.g., cement sequestration)
Uncertain public opinion regarding additional
energy consumption and CO2 leakage
▪▪▪
Public uncertainty of CO2 spontaneous release
Coal phase-out in Ontario
Undecided on carbon pricing
▪▪▪
Pre-combustion, oxy-fuel, post-combustion carbon capture
Carbon storage and transport
Coal, Natural gas CCS new builds, CCS retrofit
Canada can capture value by
continuing long-term R&D and while
combining with existing industrial
processes for near term returns
Long term R&D for new builds or
retrofit
▪ Allows development of new science
and private R&D growth in Canada
– New tech or significant
improvements likely in 10+
years, i.e. 2nd generation CCS
Develop processes that co-generate
and/or use CO2
▪
▪
▪▪
Sequester CO2 locally as part of
product manufacturing process
CO2 used to form carbonate in
mining to separate base minerals
from ore
Direct liquid CO2 generation
Most savings come from co-location
of CO2 generation and usage
STRATEGICALLY IMPORTANT FOR CANADA
1 Intensified Temperature Swing Adsorption; structured adsorbent on fixed frame that rotates
Potential long
term opportunity
| 38
Investment thesis
Technology Areas Under Consideration
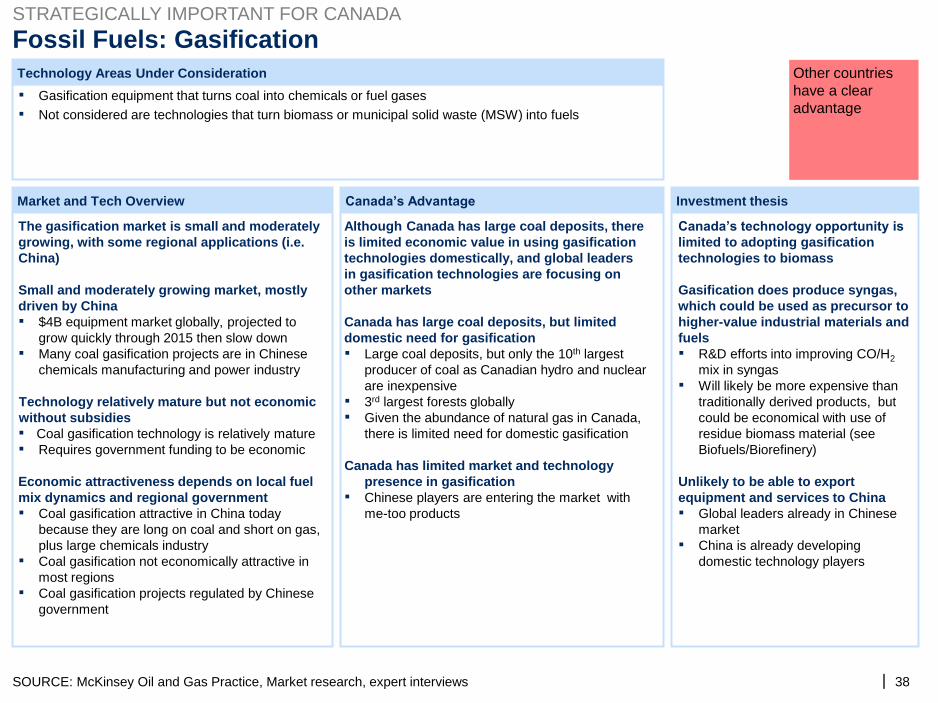
Fossil Fuels: Gasification
SOURCE: McKinsey Oil and Gas Practice, Market research, expert interviews
▪▪
Gasification equipment that turns coal into chemicals or fuel gases
Not considered are technologies that turn biomass or municipal solid waste (MSW) into fuels
Although Canada has large coal deposits, there
is limited economic value in using gasification
technologies domestically, and global leaders
in gasification technologies are focusing on
other markets
Canada has large coal deposits, but limited
domestic need for gasification
▪
▪▪
Large coal deposits, but only the 10th largest
producer of coal as Canadian hydro and nuclear
are inexpensive
3rd largest forests globally
Given the abundance of natural gas in Canada,
there is limited need for domestic gasification
Canada has limited market and technology
presence in gasification
▪ Chinese players are entering the market with
me-too products
The gasification market is small and moderately
growing, with some regional applications (i.e.
China)
Small and moderately growing market, mostly
driven by China
▪
▪
$4B equipment market globally, projected to
grow quickly through 2015 then slow down
Many coal gasification projects are in Chinese
chemicals manufacturing and power industry
Technology relatively mature but not economic
without subsidies
▪▪
Coal gasification technology is relatively mature
Requires government funding to be economic
Economic attractiveness depends on local fuel
mix dynamics and regional government
▪
▪
▪
Coal gasification attractive in China today
because they are long on coal and short on gas,
plus large chemicals industry
Coal gasification not economically attractive in
most regions
Coal gasification projects regulated by Chinese
government
Canada’s technology opportunity is
limited to adopting gasification
technologies to biomass
Gasification does produce syngas,
which could be used as precursor to
higher-value industrial materials and
fuels
▪
▪
R&D efforts into improving CO/H2
mix in syngas
Will likely be more expensive than
traditionally derived products, but
could be economical with use of
residue biomass material (see
Biofuels/Biorefinery)
Unlikely to be able to export
equipment and services to China
▪
▪
Global leaders already in Chinese
market
China is already developing
domestic technology players
STRATEGICALLY IMPORTANT FOR CANADA
Market and Tech Overview Canada’s Advantage
Other countries
have a clear
advantage
| 39
Market and Tech Overview Canada’s Advantage Investment thesis
Technology Areas Under Consideration
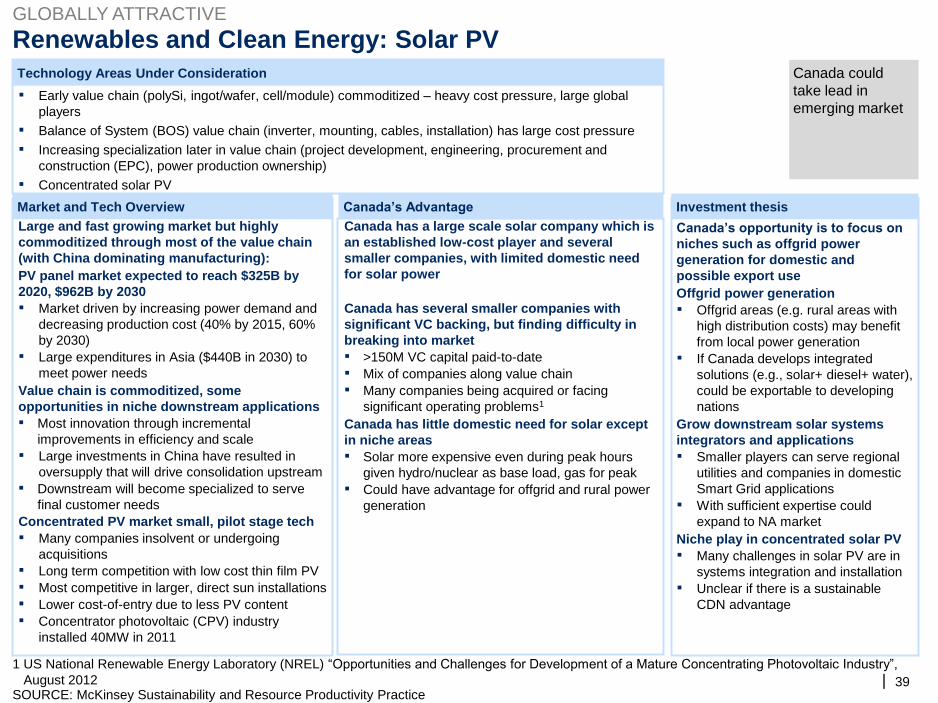
Renewables and Clean Energy: Solar PV
SOURCE: McKinsey Sustainability and Resource Productivity Practice
▪
▪▪
▪
Early value chain (polySi, ingot/wafer, cell/module) commoditized – heavy cost pressure, large global
players
Balance of System (BOS) value chain (inverter, mounting, cables, installation) has large cost pressure
Increasing specialization later in value chain (project development, engineering, procurement and
construction (EPC), power production ownership)
Concentrated solar PV
Canada has a large scale solar company which is
an established low-cost player and several
smaller companies, with limited domestic need
for solar power
Canada has several smaller companies with
significant VC backing, but finding difficulty in
breaking into market
▪▪▪
>150M VC capital paid-to-date
Mix of companies along value chain
Many companies being acquired or facing
significant operating problems1
Canada has little domestic need for solar except
in niche areas
▪
▪
Solar more expensive even during peak hours
given hydro/nuclear as base load, gas for peak
Could have advantage for offgrid and rural power
generation
Large and fast growing market but highly
commoditized through most of the value chain
(with China dominating manufacturing):
PV panel market expected to reach $325B by
2020, $962B by 2030
▪
▪
Market driven by increasing power demand and
decreasing production cost (40% by 2015, 60%
by 2030)
Large expenditures in Asia ($440B in 2030) to
meet power needs
Value chain is commoditized, some
opportunities in niche downstream applications
▪
▪
▪
Most innovation through incremental
improvements in efficiency and scale
Large investments in China have resulted in
oversupply that will drive consolidation upstream
Downstream will become specialized to serve
final customer needs
Concentrated PV market small, pilot stage tech
▪
▪▪▪▪
Many companies insolvent or undergoing
acquisitions
Long term competition with low cost thin film PV
Most competitive in larger, direct sun installations
Lower cost-of-entry due to less PV content
Concentrator photovoltaic (CPV) industry
installed 40MW in 2011
Canada’s opportunity is to focus on
niches such as offgrid power
generation for domestic and
possible export use
Offgrid power generation
▪
▪
Offgrid areas (e.g. rural areas with
high distribution costs) may benefit
from local power generation
If Canada develops integrated
solutions (e.g., solar+ diesel+ water),
could be exportable to developing
nations
Grow downstream solar systems
integrators and applications
▪
▪
Smaller players can serve regional
utilities and companies in domestic
Smart Grid applications
With sufficient expertise could
expand to NA market
Niche play in concentrated solar PV
▪
▪
Many challenges in solar PV are in
systems integration and installation
Unclear if there is a sustainable
CDN advantage
GLOBALLY ATTRACTIVE
Canada could
take lead in
emerging market
1 US National Renewable Energy Laboratory (NREL) “Opportunities and Challenges for Development of a Mature Concentrating Photovoltaic Industry”,
August 2012
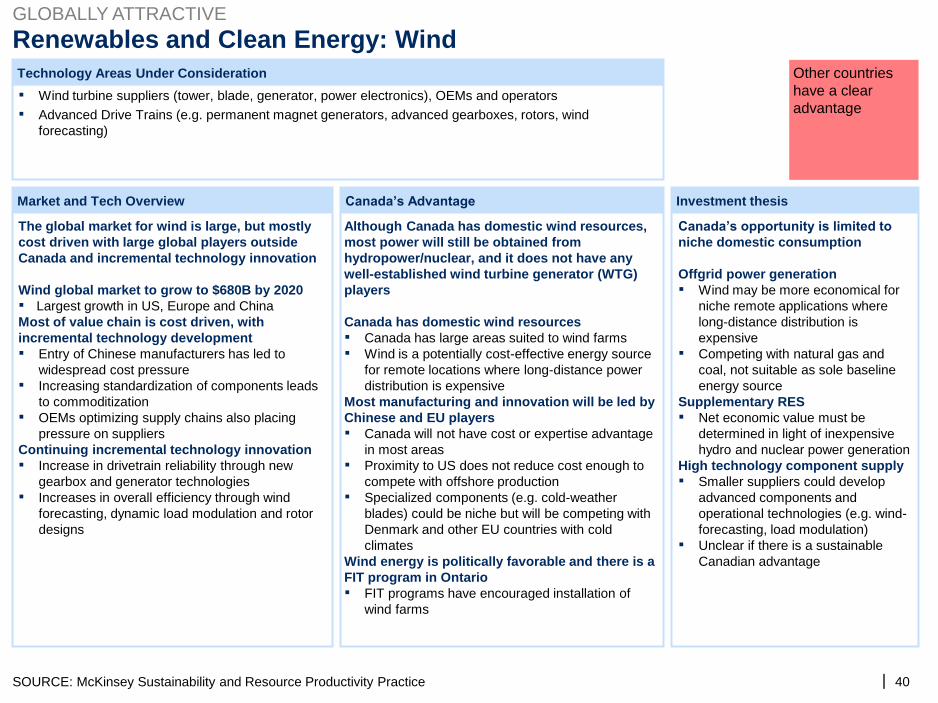
Market and Tech Overview Canada’s Advantage Investment thesis
Technology Areas Under Consideration
Renewables and Clean Energy: Wind
SOURCE: McKinsey Sustainability and Resource Productivity Practice
▪▪
Wind turbine suppliers (tower, blade, generator, power electronics), OEMs and operators
Advanced Drive Trains (e.g. permanent magnet generators, advanced gearboxes, rotors, wind
forecasting)
Although Canada has domestic wind resources,
most power will still be obtained from
hydropower/nuclear, and it does not have any
well-established wind turbine generator (WTG)
players
Canada has domestic wind resources
▪▪
Canada has large areas suited to wind farms
Wind is a potentially cost-effective energy source
for remote locations where long-distance power
distribution is expensive
Most manufacturing and innovation will be led by
Chinese and EU players
▪
▪
▪
Canada will not have cost or expertise advantage
in most areas
Proximity to US does not reduce cost enough to
compete with offshore production
Specialized components (e.g. cold-weather
blades) could be niche but will be competing with
Denmark and other EU countries with cold
climates
Wind energy is politically favorable and there is a
FIT program in Ontario
▪ FIT programs have encouraged installation of
wind farms
The global market for wind is large, but mostly
cost driven with large global players outside
Canada and incremental technology innovation
Wind global market to grow to $680B by 2020
▪ Largest growth in US, Europe and China
Most of value chain is cost driven, with
incremental technology development
▪
▪
▪
Entry of Chinese manufacturers has led to
widespread cost pressure
Increasing standardization of components leads
to commoditization
OEMs optimizing supply chains also placing
pressure on suppliers
Continuing incremental technology innovation
▪
▪
Increase in drivetrain reliability through new
gearbox and generator technologies
Increases in overall efficiency through wind
forecasting, dynamic load modulation and rotor
designs
Canada’s opportunity is limited to
niche domestic consumption
Offgrid power generation
▪
▪
Wind may be more economical for
niche remote applications where
long-distance distribution is
expensive
Competing with natural gas and
coal, not suitable as sole baseline
energy source
Supplementary RES
▪ Net economic value must be
determined in light of inexpensive
hydro and nuclear power generation
High technology component supply
▪
▪
Smaller suppliers could develop
advanced components and
operational technologies (e.g. wind-
forecasting, load modulation)
Unclear if there is a sustainable
Canadian advantage
GLOBALLY ATTRACTIVE
Other countries
have a clear
advantage
| 40
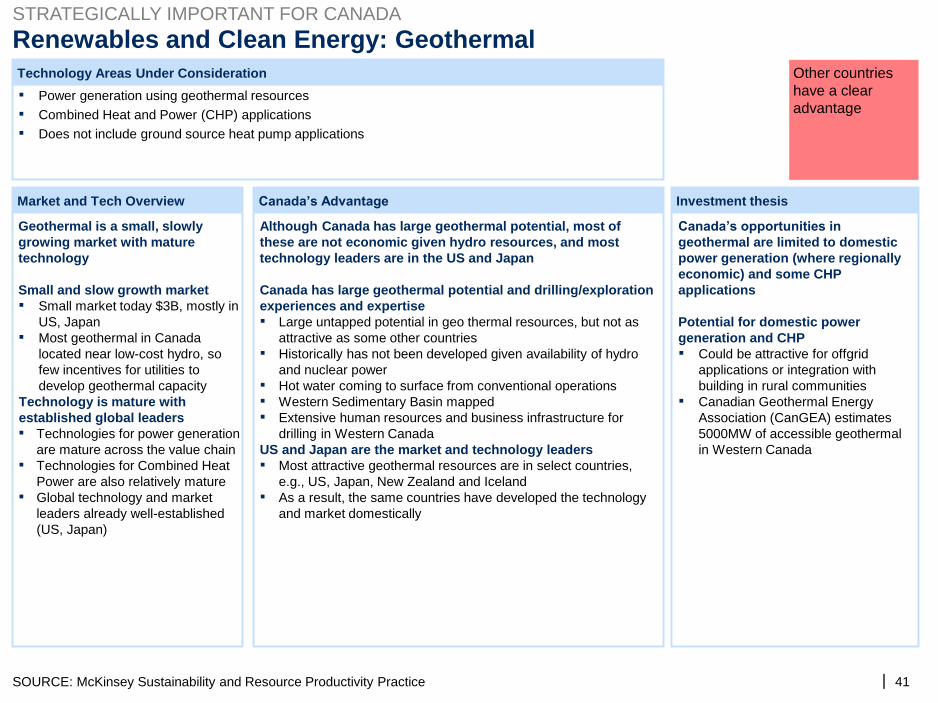
| 41
Market and Tech Overview Canada’s Advantage
Renewables and Clean Energy: Geothermal
▪▪▪
Power generation using geothermal resources
Combined Heat and Power (CHP) applications
Does not include ground source heat pump applications
Although Canada has large geothermal potential, most of
these are not economic given hydro resources, and most
technology leaders are in the US and Japan
Canada has large geothermal potential and drilling/exploration
experiences and expertise
▪
▪
▪▪▪
Large untapped potential in geo thermal resources, but not as
attractive as some other countries
Historically has not been developed given availability of hydro
and nuclear power
Hot water coming to surface from conventional operations
Western Sedimentary Basin mapped
Extensive human resources and business infrastructure for
drilling in Western Canada
US and Japan are the market and technology leaders
▪
▪
Most attractive geothermal resources are in select countries,
e.g., US, Japan, New Zealand and Iceland
As a result, the same countries have developed the technology
and market domestically
Geothermal is a small, slowly
growing market with mature
technology
Small and slow growth market
▪
▪
Small market today $3B, mostly in
US, Japan
Most geothermal in Canada
located near low-cost hydro, so
few incentives for utilities to
develop geothermal capacity
Technology is mature with
established global leaders
▪
▪
▪
Technologies for power generation
are mature across the value chain
Technologies for Combined Heat
Power are also relatively mature
Global technology and market
leaders already well-established
(US, Japan)
Canada’s opportunities in
geothermal are limited to domestic
power generation (where regionally
economic) and some CHP
applications
Potential for domestic power
generation and CHP
▪
▪
Could be attractive for offgrid
applications or integration with
building in rural communities
Canadian Geothermal Energy
Association (CanGEA) estimates
5000MW of accessible geothermal
in Western Canada
STRATEGICALLY IMPORTANT FOR CANADA
Investment thesis
Technology Areas Under Consideration
SOURCE: McKinsey Sustainability and Resource Productivity Practice
Other countries
have a clear
advantage
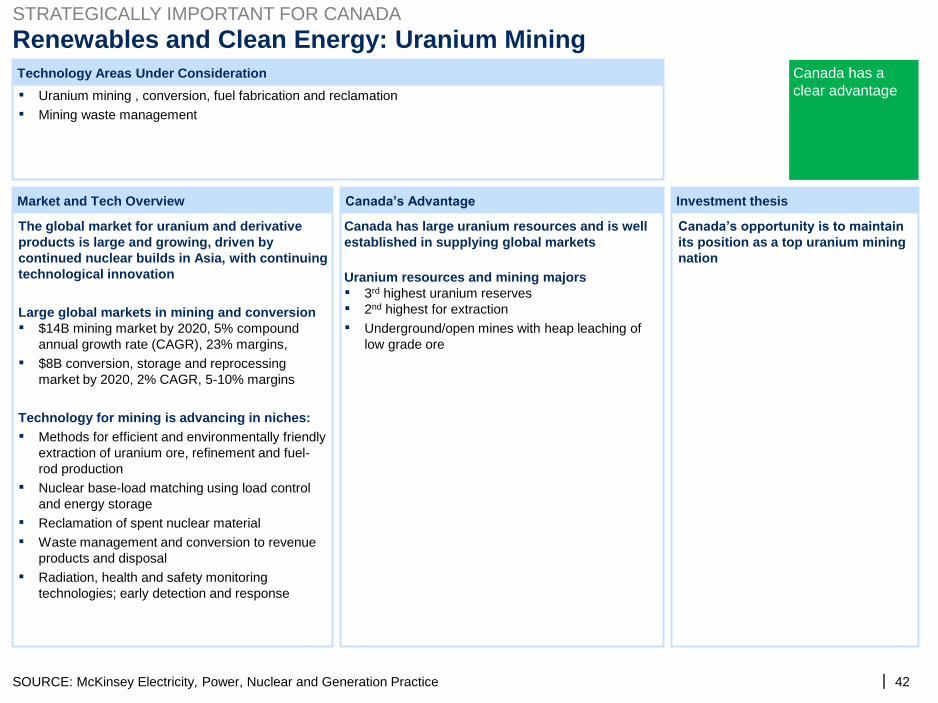
| 42
Investment thesis
Technology Areas Under Consideration
Renewables and Clean Energy: Uranium Mining
▪▪
Uranium mining , conversion, fuel fabrication and reclamation
Mining waste management
Canada has large uranium resources and is well
established in supplying global markets
Uranium resources and mining majors
▪▪▪
3rd highest uranium reserves
2nd highest for extraction
Underground/open mines with heap leaching of
low grade ore
The global market for uranium and derivative
products is large and growing, driven by
continued nuclear builds in Asia, with continuing
technological innovation
Large global markets in mining and conversion
▪
▪
$14B mining market by 2020, 5% compound
annual growth rate (CAGR), 23% margins,
$8B conversion, storage and reprocessing
market by 2020, 2% CAGR, 5-10% margins
Technology for mining is advancing in niches:
▪
▪
▪▪
▪
Methods for efficient and environmentally friendly
extraction of uranium ore, refinement and fuel-
rod production
Nuclear base-load matching using load control
and energy storage
Reclamation of spent nuclear material
Waste management and conversion to revenue
products and disposal
Radiation, health and safety monitoring
technologies; early detection and response
STRATEGICALLY IMPORTANT FOR CANADA
Canada’s opportunity is to maintain
its position as a top uranium mining
nation
SOURCE: McKinsey Electricity, Power, Nuclear and Generation Practice
Market and Tech Overview Canada’s Advantage
Canada has a
clear advantage
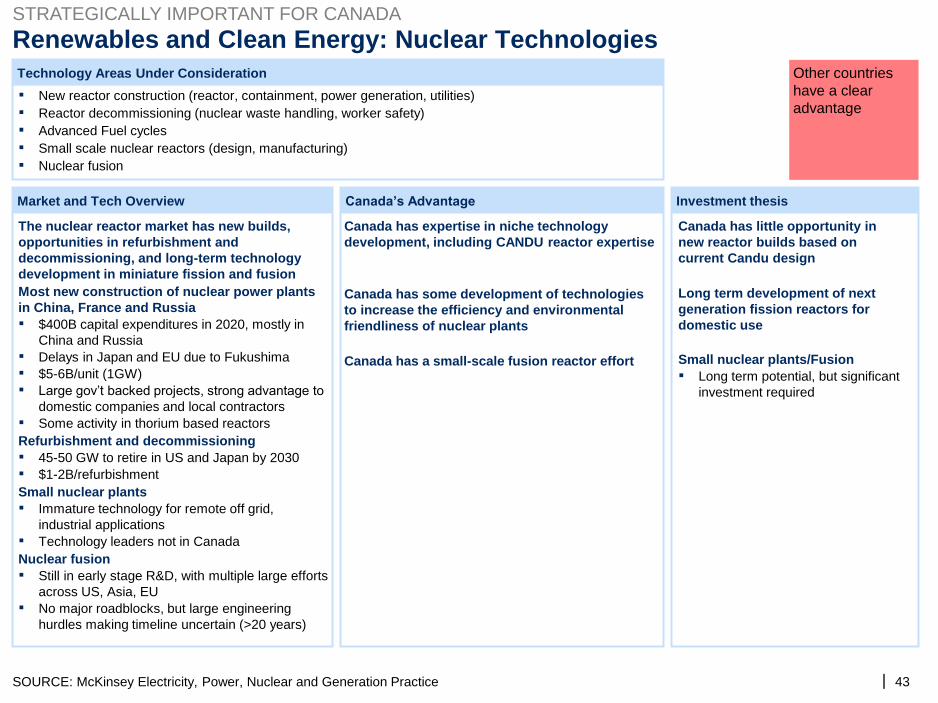
| 43
Market and Tech Overview Canada’s Advantage Investment thesis
Technology Areas Under Consideration
Renewables and Clean Energy: Nuclear Technologies
▪▪▪▪▪
New reactor construction (reactor, containment, power generation, utilities)
Reactor decommissioning (nuclear waste handling, worker safety)
Advanced Fuel cycles
Small scale nuclear reactors (design, manufacturing)
Nuclear fusion
Canada has expertise in niche technology
development, including CANDU reactor expertise
Canada has some development of technologies
to increase the efficiency and environmental
friendliness of nuclear plants
Canada has a small-scale fusion reactor effort
The nuclear reactor market has new builds,
opportunities in refurbishment and
decommissioning, and long-term technology
development in miniature fission and fusion
Most new construction of nuclear power plants
in China, France and Russia
▪
▪▪▪
▪
$400B capital expenditures in 2020, mostly in
China and Russia
Delays in Japan and EU due to Fukushima
$5-6B/unit (1GW)
Large gov’t backed projects, strong advantage to
domestic companies and local contractors
Some activity in thorium based reactors
Refurbishment and decommissioning
▪▪
45-50 GW to retire in US and Japan by 2030
$1-2B/refurbishment
Small nuclear plants
▪
▪
Immature technology for remote off grid,
industrial applications
Technology leaders not in Canada
Nuclear fusion
▪
▪
Still in early stage R&D, with multiple large efforts
across US, Asia, EU
No major roadblocks, but large engineering
hurdles making timeline uncertain (>20 years)
STRATEGICALLY IMPORTANT FOR CANADA
Canada has little opportunity in
new reactor builds based on
current Candu design
Long term development of next
generation fission reactors for
domestic use
Small nuclear plants/Fusion
▪ Long term potential, but significant
investment required
SOURCE: McKinsey Electricity, Power, Nuclear and Generation Practice
Other countries
have a clear
advantage
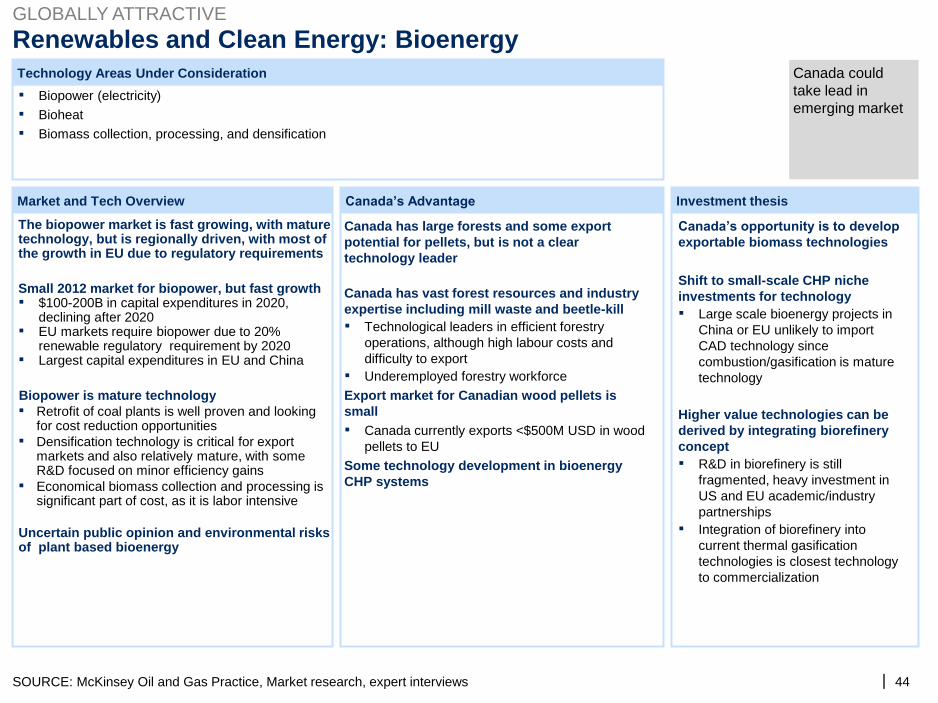
| 44
Market and Tech Overview Canada’s Advantage Investment thesis
Technology Areas Under Consideration
Renewables and Clean Energy: Bioenergy GLOBALLY ATTRACTIVE
SOURCE: McKinsey Oil and Gas Practice, Market research, expert interviews
▪▪▪
Biopower (electricity)
Bioheat
Biomass collection, processing, and densification
The biopower market is fast growing, with mature technology, but is regionally driven, with most of the growth in EU due to regulatory requirements
Small 2012 market for biopower, but fast growth ▪
▪
▪
$100-200B in capital expenditures in 2020,declining after 2020EU markets require biopower due to 20%renewable regulatory requirement by 2020Largest capital expenditures in EU and China
Biopower is mature technology
▪
▪
▪
Retrofit of coal plants is well proven and lookingfor cost reduction opportunities
Densification technology is critical for exportmarkets and also relatively mature, with someR&D focused on minor efficiency gains
Economical biomass collection and processing issignificant part of cost, as it is labor intensive
Uncertain public opinion and environmental risks of plant based bioenergy
Canada has large forests and some export
potential for pellets, but is not a clear
technology leader
Canada has vast forest resources and industry
expertise including mill waste and beetle-kill
▪
▪
Technological leaders in efficient forestry
operations, although high labour costs and
difficulty to export
Underemployed forestry workforce
Export market for Canadian wood pellets is
small
▪ Canada currently exports <$500M USD in wood
pellets to EU
Some technology development in bioenergy
CHP systems
Canada’s opportunity is to develop
exportable biomass technologies
Shift to small-scale CHP niche
investments for technology
▪ Large scale bioenergy projects in
China or EU unlikely to import
CAD technology since
combustion/gasification is mature
technology
Higher value technologies can be
derived by integrating biorefinery
concept
▪
▪
R&D in biorefinery is still
fragmented, heavy investment in
US and EU academic/industry
partnerships
Integration of biorefinery into
current thermal gasification
technologies is closest technology
to commercialization
Canada could
take lead in
emerging market
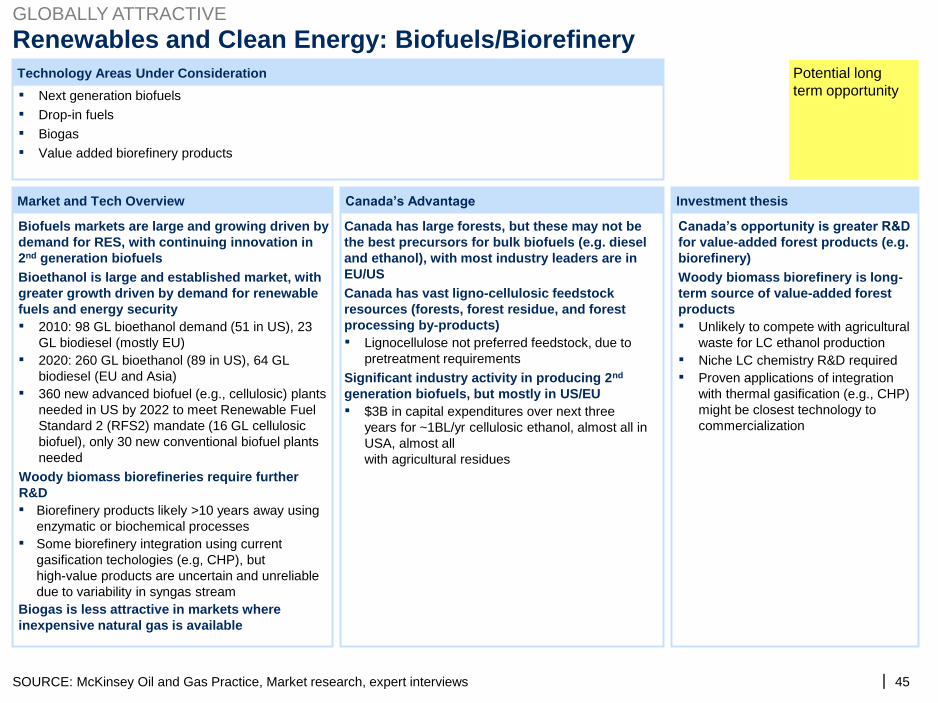
| 45
Market and Tech Overview Canada’s Advantage Investment thesis
Technology Areas Under Consideration
Renewables and Clean Energy: Biofuels/Biorefinery GLOBALLY ATTRACTIVE
SOURCE: McKinsey Oil and Gas Practice, Market research, expert interviews
▪▪▪▪
Next generation biofuels
Drop-in fuels
Biogas
Value added biorefinery products
Biofuels markets are large and growing driven by
demand for RES, with continuing innovation in
2nd generation biofuels
Bioethanol is large and established market, with
greater growth driven by demand for renewable
fuels and energy security
▪
▪
▪
2010: 98 GL bioethanol demand (51 in US), 23
GL biodiesel (mostly EU)
2020: 260 GL bioethanol (89 in US), 64 GL
biodiesel (EU and Asia)
360 new advanced biofuel (e.g., cellulosic) plants
needed in US by 2022 to meet Renewable Fuel
Standard 2 (RFS2) mandate (16 GL cellulosic
biofuel), only 30 new conventional biofuel plants
needed
Woody biomass biorefineries require further
R&D
▪
▪
Biorefinery products likely >10 years away using
enzymatic or biochemical processes
Some biorefinery integration using current
gasification techologies (e.g, CHP), but
high-value products are uncertain and unreliable
due to variability in syngas stream
Biogas is less attractive in markets where
inexpensive natural gas is available
Canada has large forests, but these may not be
the best precursors for bulk biofuels (e.g. diesel
and ethanol), with most industry leaders are in
EU/US
Canada has vast ligno-cellulosic feedstock
resources (forests, forest residue, and forest
processing by-products)
▪ Lignocellulose not preferred feedstock, due to
pretreatment requirements
Significant industry activity in producing 2nd
generation biofuels, but mostly in US/EU
▪ $3B in capital expenditures over next three
years for ~1BL/yr cellulosic ethanol, almost all in
USA, almost all
with agricultural residues
Canada’s opportunity is greater R&D
for value-added forest products (e.g.
biorefinery)
Woody biomass biorefinery is long-
term source of value-added forest
products
▪
▪▪
Unlikely to compete with agricultural
waste for LC ethanol production
Niche LC chemistry R&D required
Proven applications of integration
with thermal gasification (e.g., CHP)
might be closest technology to
commercialization
Potential long
term opportunity
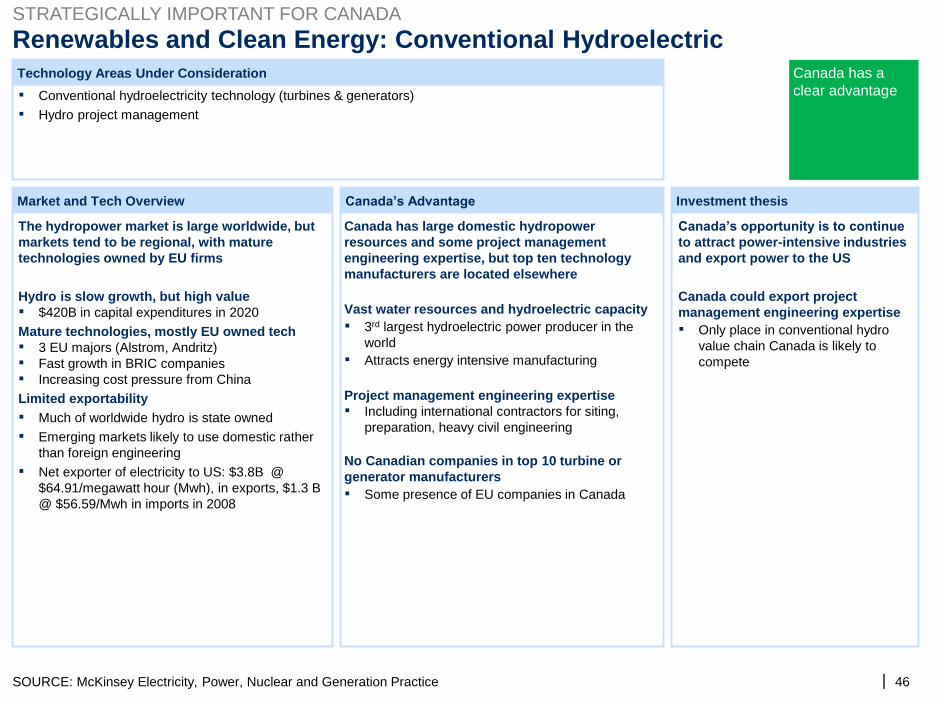
| 46
Market and Tech Overview Canada’s Advantage Investment thesis
Technology Areas Under Consideration
SOURCE: McKinsey Electricity, Power, Nuclear and Generation Practice
Renewables and Clean Energy: Conventional Hydroelectric STRATEGICALLY IMPORTANT FOR CANADA
▪▪
Conventional hydroelectricity technology (turbines & generators)
Hydro project management
The hydropower market is large worldwide, but
markets tend to be regional, with mature
technologies owned by EU firms
Hydro is slow growth, but high value
▪ $420B in capital expenditures in 2020
Mature technologies, mostly EU owned tech
▪▪▪
3 EU majors (Alstrom, Andritz)
Fast growth in BRIC companies
Increasing cost pressure from China
Limited exportability
▪▪
▪
Much of worldwide hydro is state owned
Emerging markets likely to use domestic rather
than foreign engineering
Net exporter of electricity to US: $3.8B @
$64.91/megawatt hour (Mwh), in exports, $1.3 B
@ $56.59/Mwh in imports in 2008
Canada has large domestic hydropower
resources and some project management
engineering expertise, but top ten technology
manufacturers are located elsewhere
Vast water resources and hydroelectric capacity
▪
▪
3rd largest hydroelectric power producer in the
world
Attracts energy intensive manufacturing
Project management engineering expertise
▪ Including international contractors for siting,
preparation, heavy civil engineering
No Canadian companies in top 10 turbine or
generator manufacturers
▪ Some presence of EU companies in Canada
Canada’s opportunity is to continue
to attract power-intensive industries
and export power to the US
Canada could export project
management engineering expertise
▪ Only place in conventional hydro
value chain Canada is likely to
compete
Canada has a
clear advantage
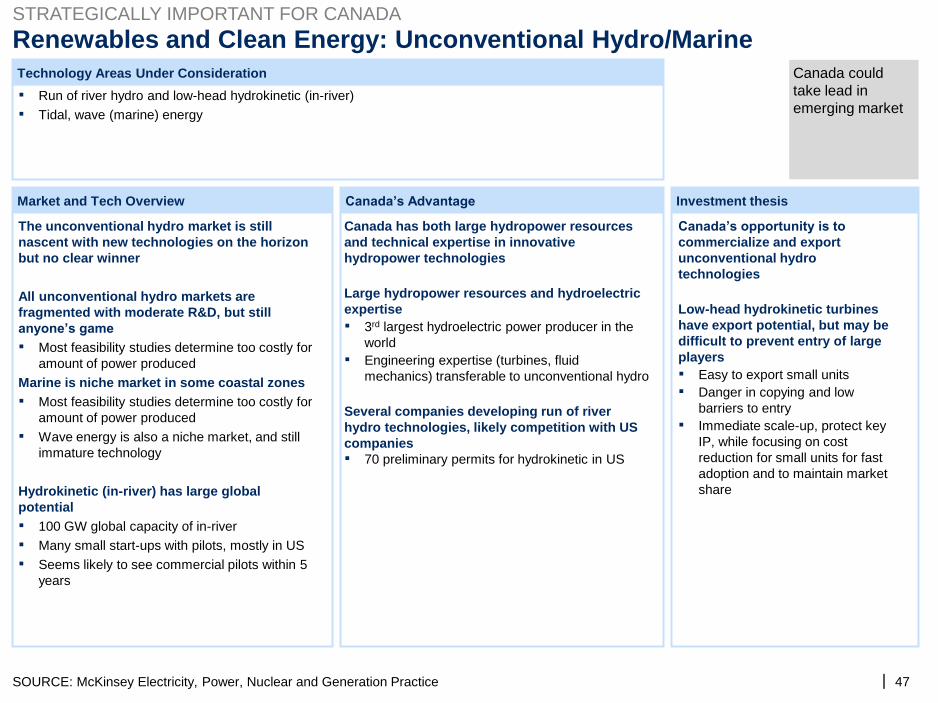
| 47
Market and Tech Overview Canada’s Advantage Investment thesis
Technology Areas Under Consideration
SOURCE: McKinsey Electricity, Power, Nuclear and Generation Practice
Renewables and Clean Energy: Unconventional Hydro/Marine STRATEGICALLY IMPORTANT FOR CANADA
▪▪
Run of river hydro and low-head hydrokinetic (in-river)
Tidal, wave (marine) energy
The unconventional hydro market is still
nascent with new technologies on the horizon
but no clear winner
All unconventional hydro markets are
fragmented with moderate R&D, but still
anyone’s game
▪ Most feasibility studies determine too costly for
amount of power produced
Marine is niche market in some coastal zones
▪
▪
Most feasibility studies determine too costly for
amount of power produced
Wave energy is also a niche market, and still
immature technology
Hydrokinetic (in-river) has large global
potential
▪▪▪
100 GW global capacity of in-river
Many small start-ups with pilots, mostly in US
Seems likely to see commercial pilots within 5
years
Canada has both large hydropower resources
and technical expertise in innovative
hydropower technologies
Large hydropower resources and hydroelectric
expertise
▪
▪
3rd largest hydroelectric power producer in the
world
Engineering expertise (turbines, fluid
mechanics) transferable to unconventional hydro
Several companies developing run of river
hydro technologies, likely competition with US
companies
▪ 70 preliminary permits for hydrokinetic in US
Canada’s opportunity is to
commercialize and export
unconventional hydro
technologies
Low-head hydrokinetic turbines
have export potential, but may be
difficult to prevent entry of large
players
▪▪
▪
Easy to export small units
Danger in copying and low
barriers to entry
Immediate scale-up, protect key
IP, while focusing on cost
reduction for small units for fast
adoption and to maintain market
share
Canada could
take lead in
emerging market
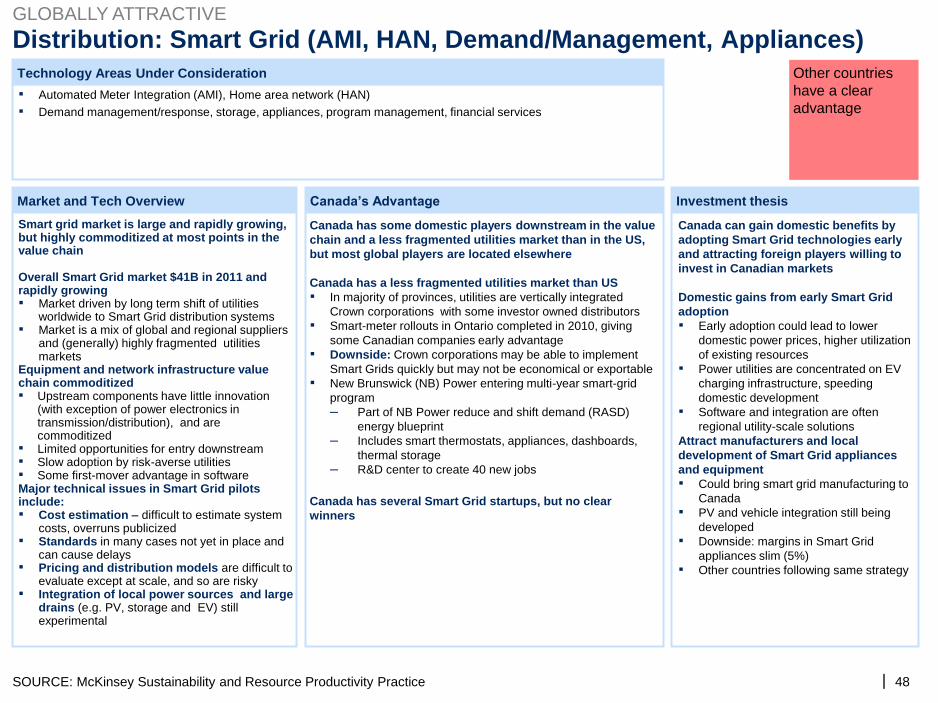
| 48
Market and Tech Overview Canada’s Advantage Investment thesis
Technology Areas Under Consideration
Distribution: Smart Grid (AMI, HAN, Demand/Management, Appliances)
SOURCE: McKinsey Sustainability and Resource Productivity Practice
▪▪
Automated Meter Integration (AMI), Home area network (HAN)
Demand management/response, storage, appliances, program management, financial services
Canada has some domestic players downstream in the value
chain and a less fragmented utilities market than in the US,
but most global players are located elsewhere
Canada has a less fragmented utilities market than US
▪
▪
▪
▪
In majority of provinces, utilities are vertically integrated
Crown corporations with some investor owned distributors
Smart-meter rollouts in Ontario completed in 2010, giving
some Canadian companies early advantage
Downside: Crown corporations may be able to implement
Smart Grids quickly but may not be economical or exportable
New Brunswick (NB) Power entering multi-year smart-grid
program
– Part of NB Power reduce and shift demand (RASD)
energy blueprint
– Includes smart thermostats, appliances, dashboards,
thermal storage
– R&D center to create 40 new jobs
Canada has several Smart Grid startups, but no clear
winners
Canada can gain domestic benefits by
adopting Smart Grid technologies early
and attracting foreign players willing to
invest in Canadian markets
Domestic gains from early Smart Grid
adoption
▪
▪
▪
Early adoption could lead to lower
domestic power prices, higher utilization
of existing resources
Power utilities are concentrated on EV
charging infrastructure, speeding
domestic development
Software and integration are often
regional utility-scale solutions
Attract manufacturers and local
development of Smart Grid appliances
and equipment
▪
▪
▪
▪
Could bring smart grid manufacturing to
Canada
PV and vehicle integration still being
developed
Downside: margins in Smart Grid
appliances slim (5%)
Other countries following same strategy
GLOBALLY ATTRACTIVE
Smart grid market is large and rapidly growing, but highly commoditized at most points in the value chain
Overall Smart Grid market $41B in 2011 and rapidly growing ▪
▪
Market driven by long term shift of utilitiesworldwide to Smart Grid distribution systemsMarket is a mix of global and regional suppliersand (generally) highly fragmented utilitiesmarkets
Equipment and network infrastructure value chain commoditized ▪
▪▪▪
Upstream components have little innovation(with exception of power electronics intransmission/distribution), and arecommoditizedLimited opportunities for entry downstreamSlow adoption by risk-averse utilitiesSome first-mover advantage in software
Major technical issues in Smart Grid pilots include: ▪
▪
▪
▪
Cost estimation – difficult to estimate systemcosts, overruns publicizedStandards in many cases not yet in place andcan cause delaysPricing and distribution models are difficult toevaluate except at scale, and so are riskyIntegration of local power sources and largedrains (e.g. PV, storage and EV) stillexperimental
Other countries
have a clear
advantage
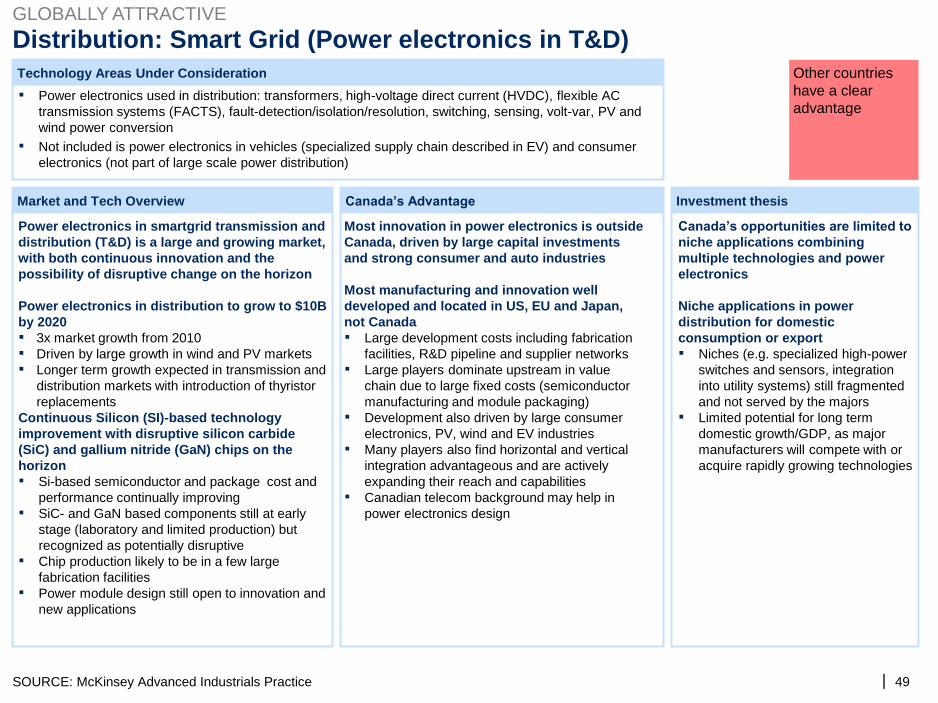
| 49
Market and Tech Overview Canada’s Advantage Investment thesis
Technology Areas Under Consideration
Distribution: Smart Grid (Power electronics in T&D)
SOURCE: McKinsey Advanced Industrials Practice
▪
▪
Power electronics used in distribution: transformers, high-voltage direct current (HVDC), flexible AC
transmission systems (FACTS), fault-detection/isolation/resolution, switching, sensing, volt-var, PV and
wind power conversion
Not included is power electronics in vehicles (specialized supply chain described in EV) and consumer
electronics (not part of large scale power distribution)
Most innovation in power electronics is outside
Canada, driven by large capital investments
and strong consumer and auto industries
Most manufacturing and innovation well
developed and located in US, EU and Japan,
not Canada
▪
▪
▪
▪
▪
Large development costs including fabrication
facilities, R&D pipeline and supplier networks
Large players dominate upstream in value
chain due to large fixed costs (semiconductor
manufacturing and module packaging)
Development also driven by large consumer
electronics, PV, wind and EV industries
Many players also find horizontal and vertical
integration advantageous and are actively
expanding their reach and capabilities
Canadian telecom background may help in
power electronics design
Power electronics in smartgrid transmission and
distribution (T&D) is a large and growing market,
with both continuous innovation and the
possibility of disruptive change on the horizon
Power electronics in distribution to grow to $10B
by 2020
▪▪▪
3x market growth from 2010
Driven by large growth in wind and PV markets
Longer term growth expected in transmission and
distribution markets with introduction of thyristor
replacements
Continuous Silicon (SI)-based technology
improvement with disruptive silicon carbide
(SiC) and gallium nitride (GaN) chips on the
horizon
▪
▪
▪
▪
Si-based semiconductor and package cost and
performance continually improving
SiC- and GaN based components still at early
stage (laboratory and limited production) but
recognized as potentially disruptive
Chip production likely to be in a few large
fabrication facilities
Power module design still open to innovation and
new applications
Canada’s opportunities are limited to
niche applications combining
multiple technologies and power
electronics
Niche applications in power
distribution for domestic
consumption or export
▪
▪
Niches (e.g. specialized high-power
switches and sensors, integration
into utility systems) still fragmented
and not served by the majors
Limited potential for long term
domestic growth/GDP, as major
manufacturers will compete with or
acquire rapidly growing technologies
GLOBALLY ATTRACTIVE
Other countries
have a clear
advantage
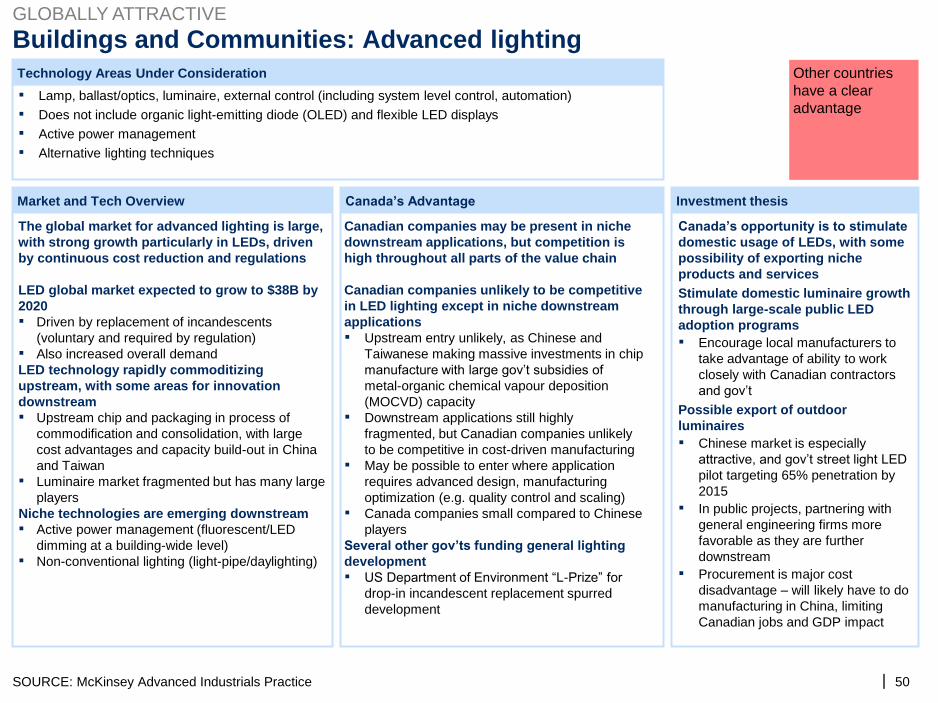
| 50
Market and Tech Overview Canada’s Advantage Investment thesis
Technology Areas Under Consideration
Buildings and Communities: Advanced lighting
▪▪▪▪
Lamp, ballast/optics, luminaire, external control (including system level control, automation)
Does not include organic light-emitting diode (OLED) and flexible LED displays
Active power management
Alternative lighting techniques
Canadian companies may be present in niche
downstream applications, but competition is
high throughout all parts of the value chain
Canadian companies unlikely to be competitive
in LED lighting except in niche downstream
applications
▪
e
▪
▪
▪
Upstream entry unlikely, as Chinese and
Taiwanese making massive investments in chip
manufacture with large gov’t subsidies of
metal-organic chemical vapour deposition
(MOCVD) capacity
Downstream applications still highly
fragmented, but Canadian companies unlikely
to be competitive in cost-driven manufacturing
May be possible to enter where application
requires advanced design, manufacturing
optimization (e.g. quality control and scaling)
Canada companies small compared to Chinese
players
Several other gov’ts funding general lighting
development
▪ US Department of Environment “L-Prize” for
drop-in incandescent replacement spurred
development
The global market for advanced lighting is large,
with strong growth particularly in LEDs, driven
by continuous cost reduction and regulations
LED global market expected to grow to $38B by
2020
▪
▪
Driven by replacement of incandescents
(voluntary and required by regulation)
Also increased overall demand
LED technology rapidly commoditizing
upstream, with some areas for innovation
downstream
▪
▪
Upstream chip and packaging in process of
commodification and consolidation, with large
cost advantages and capacity build-out in China
and Taiwan
Luminaire market fragmented but has many larg
players
Niche technologies are emerging downstream
▪
▪
Active power management (fluorescent/LED
dimming at a building-wide level)
Non-conventional lighting (light-pipe/daylighting)
Canada’s opportunity is to stimulate
domestic usage of LEDs, with some
possibility of exporting niche
products and services
Stimulate domestic luminaire growth
through large-scale public LED
adoption programs
▪ Encourage local manufacturers to
take advantage of ability to work
closely with Canadian contractors
and gov’t
Possible export of outdoor
luminaires
▪
▪
▪
Chinese market is especially
attractive, and gov’t street light LED
pilot targeting 65% penetration by
2015
In public projects, partnering with
general engineering firms more
favorable as they are further
downstream
Procurement is major cost
disadvantage – will likely have to do
manufacturing in China, limiting
Canadian jobs and GDP impact
SOURCE: McKinsey Advanced Industrials Practice
GLOBALLY ATTRACTIVE
Other countries
have a clear
advantage
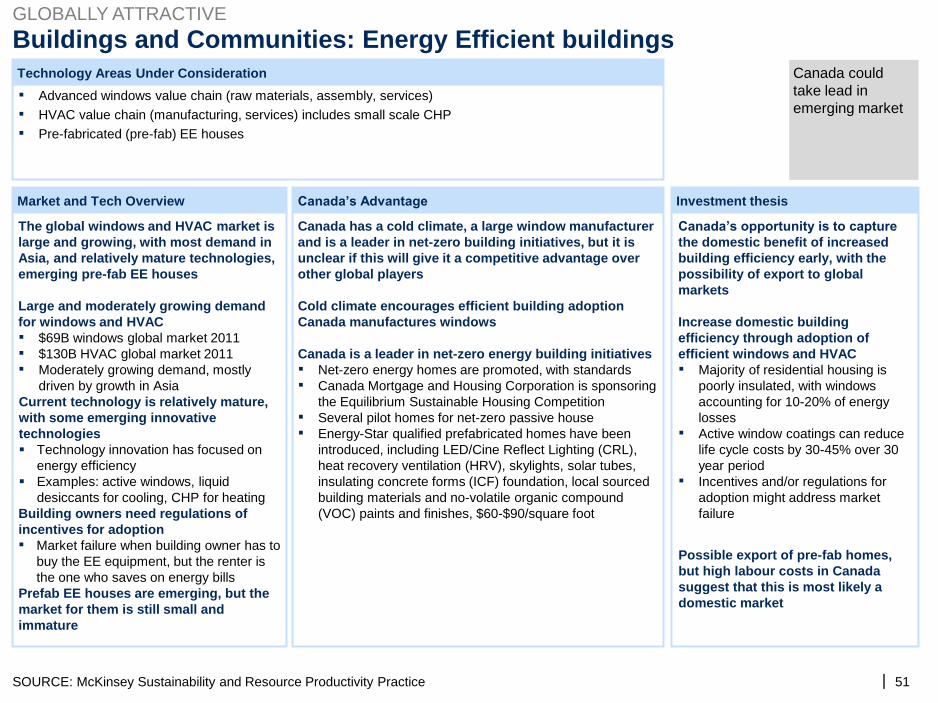
| 51
Market and Tech Overview Canada’s Advantage Investment thesis
Technology Areas Under Consideration
Buildings and Communities: Energy Efficient buildings
SOURCE: McKinsey Sustainability and Resource Productivity Practice
▪▪▪
Advanced windows value chain (raw materials, assembly, services)
HVAC value chain (manufacturing, services) includes small scale CHP
Pre-fabricated (pre-fab) EE houses
Canada has a cold climate, a large window manufacturer
and is a leader in net-zero building initiatives, but it is
unclear if this will give it a competitive advantage over
other global players
Cold climate encourages efficient building adoption
Canada manufactures windows
Canada is a leader in net-zero energy building initiatives
▪▪
▪▪
Net-zero energy homes are promoted, with standards
Canada Mortgage and Housing Corporation is sponsoring
the Equilibrium Sustainable Housing Competition
Several pilot homes for net-zero passive house
Energy-Star qualified prefabricated homes have been
introduced, including LED/Cine Reflect Lighting (CRL),
heat recovery ventilation (HRV), skylights, solar tubes,
insulating concrete forms (ICF) foundation, local sourced
building materials and no-volatile organic compound
(VOC) paints and finishes, $60-$90/square foot
The global windows and HVAC market is
large and growing, with most demand in
Asia, and relatively mature technologies,
emerging pre-fab EE houses
Large and moderately growing demand
for windows and HVAC
▪▪▪
$69B windows global market 2011
$130B HVAC global market 2011
Moderately growing demand, mostly
driven by growth in Asia
Current technology is relatively mature,
with some emerging innovative
technologies
Technology innovation has focused on
energy efficiency
Examples: active windows, liquid
desiccants for cooling, CHP for heating
Building owners need regulations of
incentives for adoption
▪ Market failure when building owner has to
buy the EE equipment, but the renter is
the one who saves on energy bills
Prefab EE houses are emerging, but the
market for them is still small and
immature
Canada’s opportunity is to capture
the domestic benefit of increased
building efficiency early, with the
possibility of export to global
markets
Increase domestic building
efficiency through adoption of
efficient windows and HVAC
▪
▪
▪
Majority of residential housing is
poorly insulated, with windows
accounting for 10-20% of energy
losses
Active window coatings can reduce
life cycle costs by 30-45% over 30
year period
Incentives and/or regulations for
adoption might address market
failure
Possible export of pre-fab homes,
but high labour costs in Canada
suggest that this is most likely a
domestic market
GLOBALLY ATTRACTIVE
Canada could
take lead in
emerging market
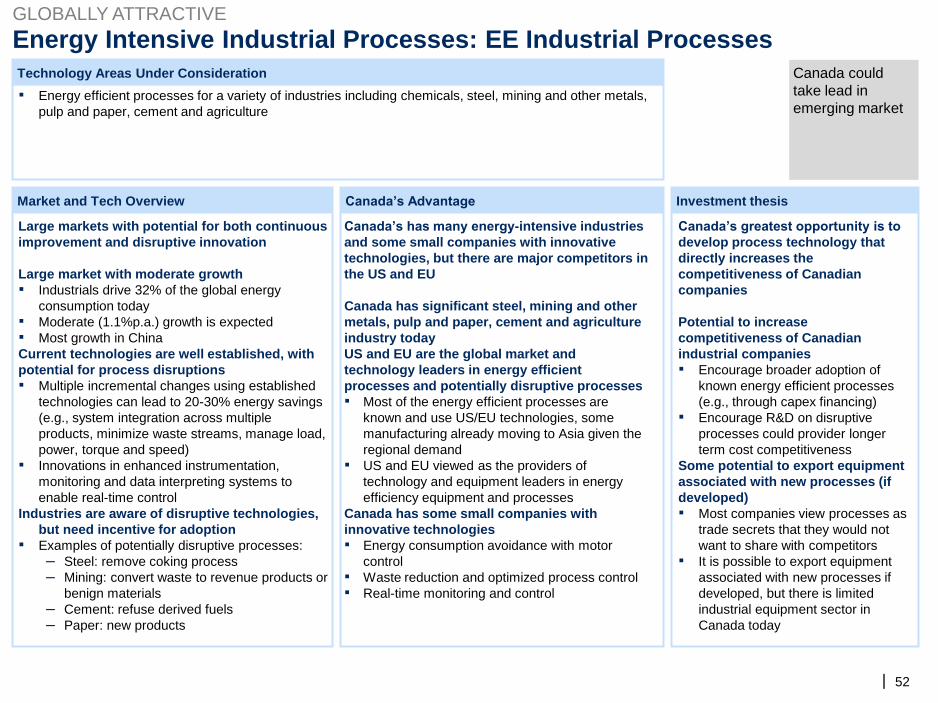
| 52
Market and Tech Overview Canada’s Advantage Investment thesis
Technology Areas Under Consideration
Energy Intensive Industrial Processes: EE Industrial Processes
▪ Energy efficient processes for a variety of industries including chemicals, steel, mining and other metals,
pulp and paper, cement and agriculture
Canada’s has many energy-intensive industries
and some small companies with innovative
technologies, but there are major competitors in
the US and EU
Canada has significant steel, mining and other
metals, pulp and paper, cement and agriculture
industry today
US and EU are the global market and
technology leaders in energy efficient
processes and potentially disruptive processes
▪
▪
Most of the energy efficient processes are
known and use US/EU technologies, some
manufacturing already moving to Asia given the
regional demand
US and EU viewed as the providers of
technology and equipment leaders in energy
efficiency equipment and processes
Canada has some small companies with
innovative technologies
▪
▪▪
Energy consumption avoidance with motor
control
Waste reduction and optimized process control
Real-time monitoring and control
Canada’s greatest opportunity is to
develop process technology that
directly increases the
competitiveness of Canadian
companies
Potential to increase
competitiveness of Canadian
industrial companies
▪
▪
Encourage broader adoption of
known energy efficient processes
(e.g., through capex financing)
Encourage R&D on disruptive
processes could provider longer
term cost competitiveness
Some potential to export equipment
associated with new processes (if
developed)
▪
▪
Most companies view processes as
trade secrets that they would not
want to share with competitors
It is possible to export equipment
associated with new processes if
developed, but there is limited
industrial equipment sector in
Canada today
Large markets with potential for both continuous
improvement and disruptive innovation
Large market with moderate growth
▪
▪▪
Industrials drive 32% of the global energy
consumption today
Moderate (1.1%p.a.) growth is expected
Most growth in China
Current technologies are well established, with
potential for process disruptions
▪
▪
Multiple incremental changes using established
technologies can lead to 20-30% energy savings
(e.g., system integration across multiple
products, minimize waste streams, manage load,
power, torque and speed)
Innovations in enhanced instrumentation,
monitoring and data interpreting systems to
enable real-time control
Industries are aware of disruptive technologies,
but need incentive for adoption
▪ Examples of potentially disruptive processes:
– Steel: remove coking process
– Mining: convert waste to revenue products or
benign materials
– Cement: refuse derived fuels
– Paper: new products
GLOBALLY ATTRACTIVE
Canada could
take lead in
emerging market
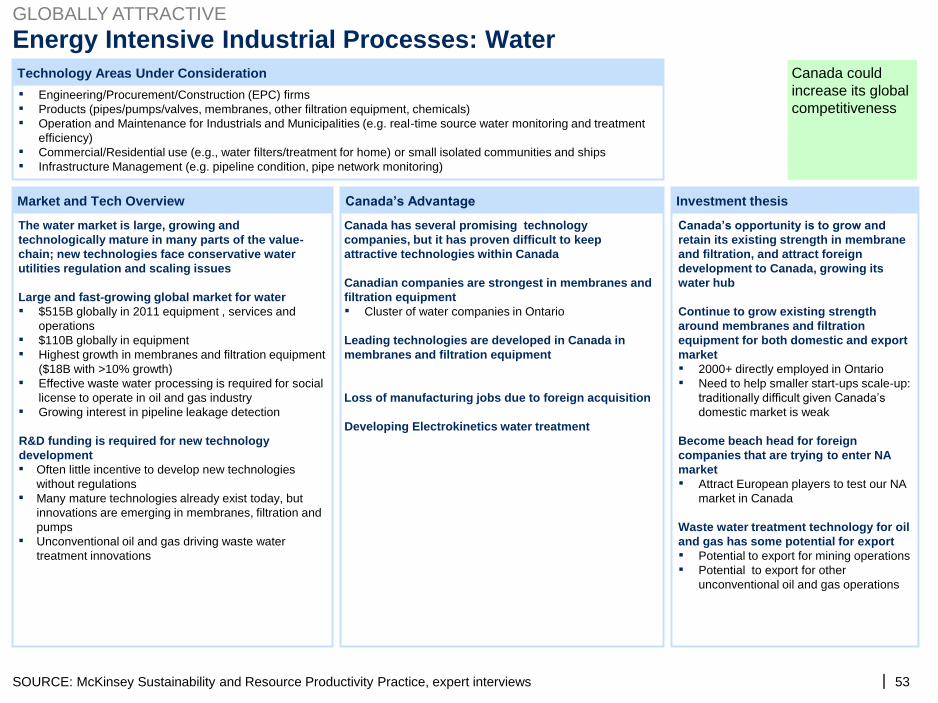
| 53
Market and Tech Overview Canada’s Advantage Investment thesis
Technology Areas Under Consideration
Energy Intensive Industrial Processes: Water
SOURCE: McKinsey Sustainability and Resource Productivity Practice, expert interviews
▪▪▪
▪▪
Engineering/Procurement/Construction (EPC) firms
Products (pipes/pumps/valves, membranes, other filtration equipment, chemicals)
Operation and Maintenance for Industrials and Municipalities (e.g. real-time source water monitoring and treatment
efficiency)
Commercial/Residential use (e.g., water filters/treatment for home) or small isolated communities and ships
Infrastructure Management (e.g. pipeline condition, pipe network monitoring)
The water market is large, growing and
technologically mature in many parts of the value-
chain; new technologies face conservative water
utilities regulation and scaling issues
Large and fast-growing global market for water
▪
▪▪
▪
▪
$515B globally in 2011 equipment , services and
operations
$110B globally in equipment
Highest growth in membranes and filtration equipment
($18B with >10% growth)
Effective waste water processing is required for social
license to operate in oil and gas industry
Growing interest in pipeline leakage detection
R&D funding is required for new technology
development
▪
▪
▪
Often little incentive to develop new technologies
without regulations
Many mature technologies already exist today, but
innovations are emerging in membranes, filtration and
pumps
Unconventional oil and gas driving waste water
treatment innovations
Canada’s opportunity is to grow and
retain its existing strength in membrane
and filtration, and attract foreign
development to Canada, growing its
water hub
Continue to grow existing strength
around membranes and filtration
equipment for both domestic and export
market
▪▪
2000+ directly employed in Ontario
Need to help smaller start-ups scale-up:
traditionally difficult given Canada’s
domestic market is weak
Become beach head for foreign
companies that are trying to enter NA
market
▪ Attract European players to test our NA
market in Canada
Waste water treatment technology for oil
and gas has some potential for export
▪▪
Potential to export for mining operations
Potential to export for other
unconventional oil and gas operations
GLOBALLY ATTRACTIVE
Canada has several promising technology
companies, but it has proven difficult to keep
attractive technologies within Canada
Canadian companies are strongest in membranes and
filtration equipment
▪ Cluster of water companies in Ontario
Leading technologies are developed in Canada in
membranes and filtration equipment
Loss of manufacturing jobs due to foreign acquisition
Developing Electrokinetics water treatment
Canada could
increase its global
competitiveness
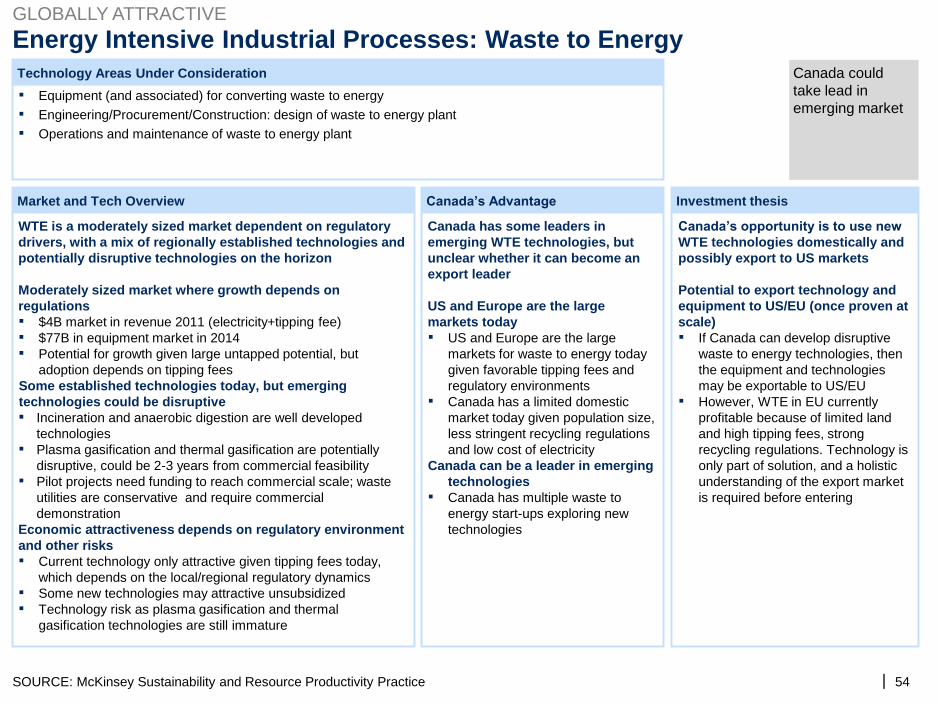
| 54
Market and Tech Overview Canada’s Advantage Investment thesis
Technology Areas Under Consideration
Energy Intensive Industrial Processes: Waste to Energy
SOURCE: McKinsey Sustainability and Resource Productivity Practice
▪▪▪
Equipment (and associated) for converting waste to energy
Engineering/Procurement/Construction: design of waste to energy plant
Operations and maintenance of waste to energy plant
Canada has some leaders in
emerging WTE technologies, but
unclear whether it can become an
export leader
US and Europe are the large
markets today
▪
▪
US and Europe are the large
markets for waste to energy today
given favorable tipping fees and
regulatory environments
Canada has a limited domestic
market today given population size,
less stringent recycling regulations
and low cost of electricity
Canada can be a leader in emerging
technologies
▪ Canada has multiple waste to
energy start-ups exploring new
technologies
WTE is a moderately sized market dependent on regulatory
drivers, with a mix of regionally established technologies and
potentially disruptive technologies on the horizon
Moderately sized market where growth depends on
regulations
▪▪▪
$4B market in revenue 2011 (electricity+tipping fee)
$77B in equipment market in 2014
Potential for growth given large untapped potential, but
adoption depends on tipping fees
Some established technologies today, but emerging
technologies could be disruptive
▪
▪
▪
Incineration and anaerobic digestion are well developed
technologies
Plasma gasification and thermal gasification are potentially
disruptive, could be 2-3 years from commercial feasibility
Pilot projects need funding to reach commercial scale; waste
utilities are conservative and require commercial
demonstration
Economic attractiveness depends on regulatory environment
and other risks
▪
▪▪
Current technology only attractive given tipping fees today,
which depends on the local/regional regulatory dynamics
Some new technologies may attractive unsubsidized
Technology risk as plasma gasification and thermal
gasification technologies are still immature
Canada’s opportunity is to use new
WTE technologies domestically and
possibly export to US markets
Potential to export technology and
equipment to US/EU (once proven at
scale)
▪
▪
If Canada can develop disruptive
waste to energy technologies, then
the equipment and technologies
may be exportable to US/EU
However, WTE in EU currently
profitable because of limited land
and high tipping fees, strong
recycling regulations. Technology is
only part of solution, and a holistic
understanding of the export market
is required before entering
GLOBALLY ATTRACTIVE
Canada could
take lead in
emerging market
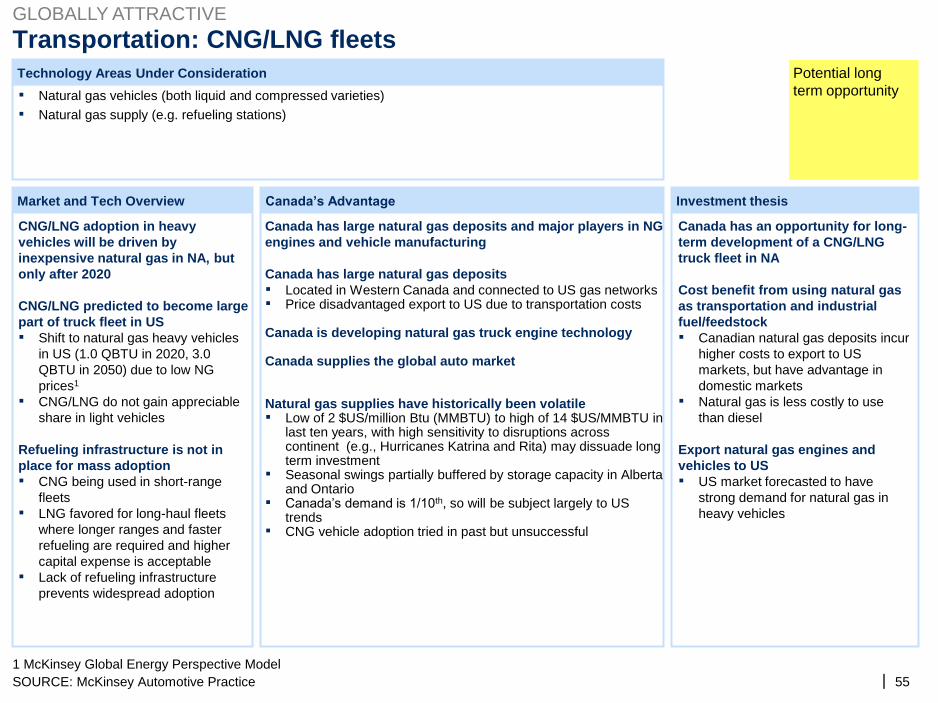
| 55
Market and Tech Overview Canada’s Advantage Investment thesis
Technology Areas Under Consideration
Transportation: CNG/LNG fleets
SOURCE: McKinsey Automotive Practice
1 McKinsey Global Energy Perspective Model
▪▪
Natural gas vehicles (both liquid and compressed varieties)
Natural gas supply (e.g. refueling stations)
CNG/LNG adoption in heavy
vehicles will be driven by
inexpensive natural gas in NA, but
only after 2020
CNG/LNG predicted to become large
part of truck fleet in US
▪
▪
Shift to natural gas heavy vehicles
in US (1.0 QBTU in 2020, 3.0
QBTU in 2050) due to low NG
prices1
CNG/LNG do not gain appreciable
share in light vehicles
Refueling infrastructure is not in
place for mass adoption
▪
▪
▪
CNG being used in short-range
fleets
LNG favored for long-haul fleets
where longer ranges and faster
refueling are required and higher
capital expense is acceptable
Lack of refueling infrastructure
prevents widespread adoption
Canada has an opportunity for long-
term development of a CNG/LNG
truck fleet in NA
Cost benefit from using natural gas
as transportation and industrial
fuel/feedstock
▪
▪
Canadian natural gas deposits incur
higher costs to export to US
markets, but have advantage in
domestic markets
Natural gas is less costly to use
than diesel
Export natural gas engines and
vehicles to US
▪ US market forecasted to have
strong demand for natural gas in
heavy vehicles
GLOBALLY ATTRACTIVE
Canada has large natural gas deposits and major players in NG
engines and vehicle manufacturing
Canada has large natural gas deposits
▪▪
Located in Western Canada and connected to US gas networksPrice disadvantaged export to US due to transportation costs
Canada is developing natural gas truck engine technology
Canada supplies the global auto market
Natural gas supplies have historically been volatile ▪
l
▪
▪
▪
Low of 2 $US/million Btu (MMBTU) to high of 14 $US/MMBTU inast ten years, with high sensitivity to disruptions acrosscontinent (e.g., Hurricanes Katrina and Rita) may dissuade longterm investmentSeasonal swings partially buffered by storage capacity in Albertaand OntarioCanada’s demand is 1/10th, so will be subject largely to UStrendsCNG vehicle adoption tried in past but unsuccessful
Potential long
term opportunity
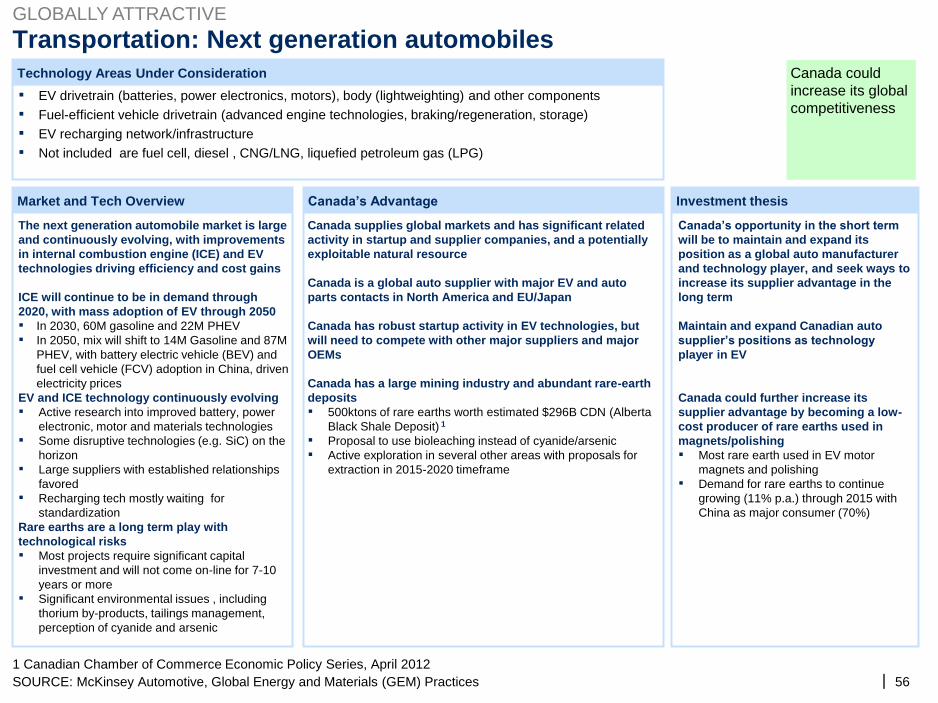
| 56
Market and Tech Overview Canada’s Advantage Investment thesis
Technology Areas Under Consideration
Transportation: Next generation automobiles
SOURCE: McKinsey Automotive, Global Energy and Materials (GEM) Practices
1 Canadian Chamber of Commerce Economic Policy Series, April 2012
▪▪▪▪
EV drivetrain (batteries, power electronics, motors), body (lightweighting) and other components
Fuel-efficient vehicle drivetrain (advanced engine technologies, braking/regeneration, storage)
EV recharging network/infrastructure
Not included are fuel cell, diesel , CNG/LNG, liquefied petroleum gas (LPG)
Canada supplies global markets and has significant related
activity in startup and supplier companies, and a potentially
exploitable natural resource
Canada is a global auto supplier with major EV and auto
parts contacts in North America and EU/Japan
Canada has robust startup activity in EV technologies, but
will need to compete with other major suppliers and major
OEMs
Canada has a large mining industry and abundant rare-earth
deposits
▪
▪▪
500ktons of rare earths worth estimated $296B CDN (Alberta
Black Shale Deposit) 1
Proposal to use bioleaching instead of cyanide/arsenic
Active exploration in several other areas with proposals for
extraction in 2015-2020 timeframe
The next generation automobile market is large
and continuously evolving, with improvements
in internal combustion engine (ICE) and EV
technologies driving efficiency and cost gains
ICE will continue to be in demand through
2020, with mass adoption of EV through 2050
▪▪
In 2030, 60M gasoline and 22M PHEV
In 2050, mix will shift to 14M Gasoline and 87M
PHEV, with battery electric vehicle (BEV) and
fuel cell vehicle (FCV) adoption in China, driven
electricity prices
EV and ICE technology continuously evolving
▪
▪
▪
▪
Active research into improved battery, power
electronic, motor and materials technologies
Some disruptive technologies (e.g. SiC) on the
horizon
Large suppliers with established relationships
favored
Recharging tech mostly waiting for
standardization
Rare earths are a long term play with
technological risks
▪
▪
Most projects require significant capital
investment and will not come on-line for 7-10
years or more
Significant environmental issues , including
thorium by-products, tailings management,
perception of cyanide and arsenic
Canada’s opportunity in the short term
will be to maintain and expand its
position as a global auto manufacturer
and technology player, and seek ways to
increase its supplier advantage in the
long term
Maintain and expand Canadian auto
supplier’s positions as technology
player in EV
Canada could further increase its
supplier advantage by becoming a low-
cost producer of rare earths used in
magnets/polishing
▪
▪
Most rare earth used in EV motor
magnets and polishing
Demand for rare earths to continue
growing (11% p.a.) through 2015 with
China as major consumer (70%)
GLOBALLY ATTRACTIVE
Canada could
increase its global
competitiveness
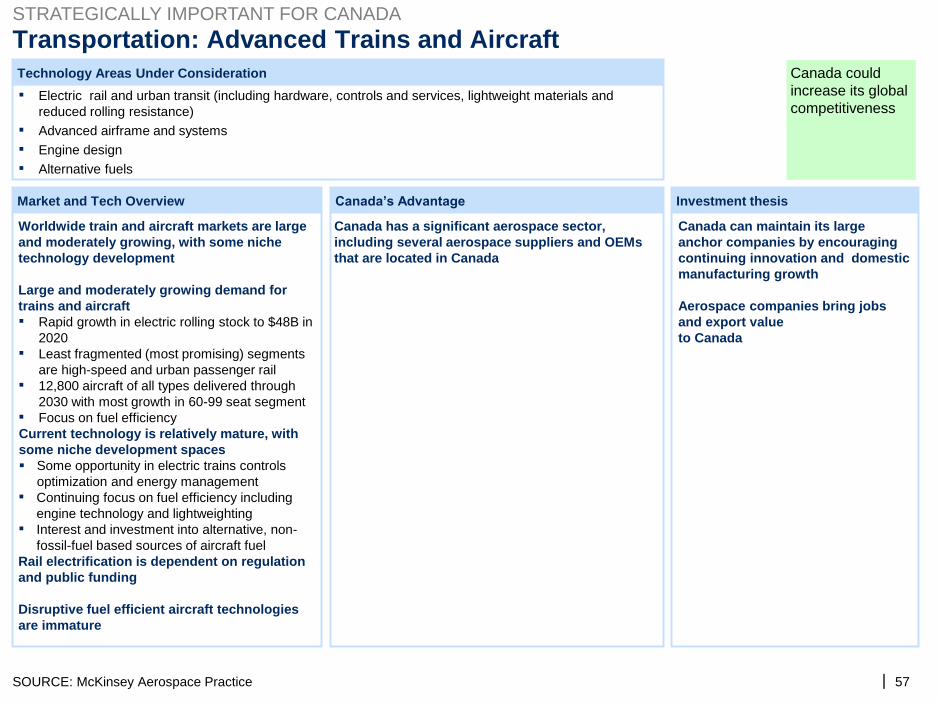
| 57
Market and Tech Overview Canada’s Advantage Investment thesis
Technology Areas Under Consideration
Transportation: Advanced Trains and Aircraft
SOURCE: McKinsey Aerospace Practice
▪
▪▪▪
Electric rail and urban transit (including hardware, controls and services, lightweight materials and
reduced rolling resistance)
Advanced airframe and systems
Engine design
Alternative fuels
Canada has a significant aerospace sector,
including several aerospace suppliers and OEMs
that are located in Canada
Worldwide train and aircraft markets are large
and moderately growing, with some niche
technology development
Large and moderately growing demand for
trains and aircraft
▪
▪
▪
▪
Rapid growth in electric rolling stock to $48B in
2020
Least fragmented (most promising) segments
are high-speed and urban passenger rail
12,800 aircraft of all types delivered through
2030 with most growth in 60-99 seat segment
Focus on fuel efficiency
Current technology is relatively mature, with
some niche development spaces
▪
▪
Some opportunity in electric trains controls
optimization and energy management
Continuing focus on fuel efficiency including
engine technology and lightweighting
Interest and investment into alternative, non-
fossil-fuel based sources of aircraft fuel
Rail electrification is dependent on regulation
and public funding
Disruptive fuel efficient aircraft technologies
are immature
Canada can maintain its large
anchor companies by encouraging
continuing innovation and domestic
manufacturing growth
Aerospace companies bring jobs
and export value
to Canada
STRATEGICALLY IMPORTANT FOR CANADA
Canada could
increase its global
competitiveness
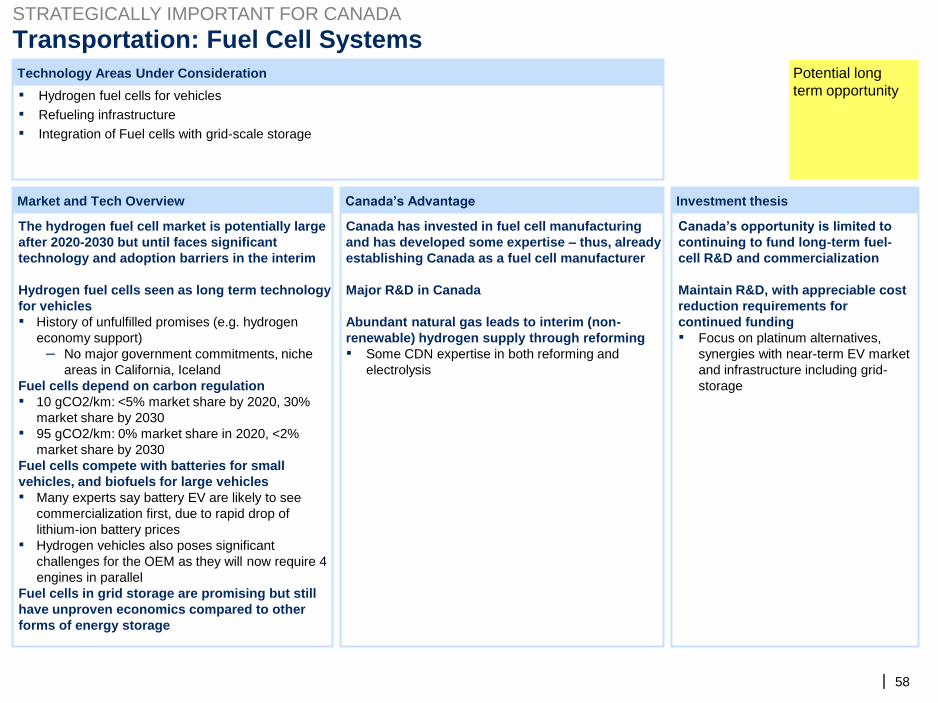
| 58
Market and Tech Overview Canada’s Advantage Investment thesis
Technology Areas Under Consideration
Transportation: Fuel Cell Systems STRATEGICALLY IMPORTANT FOR CANADA
▪▪▪
Hydrogen fuel cells for vehicles
Refueling infrastructure
Integration of Fuel cells with grid-scale storage
The hydrogen fuel cell market is potentially large
after 2020-2030 but until faces significant
technology and adoption barriers in the interim
Hydrogen fuel cells seen as long term technology
for vehicles
▪ History of unfulfilled promises (e.g. hydrogen
economy support)
– No major government commitments, niche
areas in California, Iceland
Fuel cells depend on carbon regulation
▪
▪
10 gCO2/km: <5% market share by 2020, 30%
market share by 2030
95 gCO2/km: 0% market share in 2020, <2%
market share by 2030
Fuel cells compete with batteries for small
vehicles, and biofuels for large vehicles
▪
▪
Many experts say battery EV are likely to see
commercialization first, due to rapid drop of
lithium-ion battery prices
Hydrogen vehicles also poses significant
challenges for the OEM as they will now require 4
engines in parallel
Fuel cells in grid storage are promising but still
have unproven economics compared to other
forms of energy storage
Canada has invested in fuel cell manufacturing
and has developed some expertise – thus, already
establishing Canada as a fuel cell manufacturer
Major R&D in Canada
Abundant natural gas leads to interim (non-
renewable) hydrogen supply through reforming
▪ Some CDN expertise in both reforming and
electrolysis
Canada’s opportunity is limited to
continuing to fund long-term fuel-
cell R&D and commercialization
Maintain R&D, with appreciable cost
reduction requirements for
continued funding
▪ Focus on platinum alternatives,
synergies with near-term EV market
and infrastructure including grid-
storage
Potential long
term opportunity


![Financial Markets in Africa: Opportunities & … Markets in Africa: Opportunities & Challenges Moremi Marwa [27th April 2015] 1 * Preface * Introduction * State of Financial Markets](https://img.pdfslide.us/doc/110x75/5ada6e6c7f8b9aee348cc85e/financial-markets-in-africa-opportunities-markets-in-africa-opportunities.jpg)