Embed Size (px)
Citation preview

Year 3 Progress Report 2 2012-13
Progress Report: Enhancing World Markets for Canadian Pulses Through Secondary Processing and Value Added Research SPG Project # PRO1008
Enhancing World Markets for Canadian Pulses through Secondary Processing and Value Added Research
SPG Project # PRO1008
Progress Report: Year 3 (August 1st, 2012 – July 31st, 2013)
Submitted to:
Saskatchewan Pulse Growers and Manitoba Pulse Growers Association
By:
Dr. Rex Newkirk, Vice President Research and Innovation
Peter Frohlich, Project Manager Pulses and Special Crops
Gina Boux, Technologist, Pulses
Canadian International Grains Institute (Cigi), Winnipeg MB

Enhancing World Markets For Canadian Pulses Through Secondary Processing and Value Added Research
SPG Project # PRO1008 Page 1
1. Industry Advisory Committee The Industry Advisory Committee meeting was held on January 9
th, 2013 in Saskatoon, SK.
Committee members in attendance included: L. Malcolmson, Cigi (Chair) P. Frohlich, Cigi G. Boux, Cigi R. Newkirk, Cigi J. Parker,SPG A. Fletcher, SPG M. Reimer, MPGA T. Warkentin, CDC R. Tyler, University of Saskatchewan G. O'Hara, Parrheim Foods M. Hughes, Best Cooking Pulses T. Der, Pulse Canada (via conference call) 2. Progress Report on Projects:
2.1 Effect of Fibre Addition and Fibre Particle Size on the Extrusion Properties of Split
Yellow Pea Flour
Rationale and Objectives The fibre rich hull fraction from yellow peas is a bi-product of the dehulling and splitting process. This fraction can be incorporated into extruded puffed snack formulations to improve the fibre content of these products. The objective of the first phase of this study was to gain knowledge on the effect of pea fibre addition on the extrusion properties of split yellow pea flour. During the second phase of the study, the effect of fibre addition and fibre particle size on the extrusion properties of split yellow pea flour was measured. Materials and Methods Split yellow pea flour and pea hulls were acquired from commercial suppliers. Pea hulls were pin milled at 10, 15, 18 and 22K rpm to produce fiber fractions of different particle size distributions. Fiber fractions were added to commercial split yellow pea flour at 5, 10, 15 and 20% and extruded into a puffed snack using a Clextral EV-20 twin screw extruder. The effect of fibre addition and fibre particle size on the extrusion properties of split yellow pea flour was assessed by measuring the expansion ratio and bulk density of the puffed product. Results and Discussion Complete results for this study can be found in the Year 2 project report. During the current reporting period the data was compiled into a research poster (Appendix 1) and presented at the 2012 AACCI Annual Meeting, September 30 – October 3 in Hollywood Florida and the 9
th CPRW November 6-9 in
Niagara Falls.

Enhancing World Markets For Canadian Pulses Through Secondary Processing and Value Added Research
SPG Project # PRO1008 Page 2
2.2 The Effect of Air Classifier Speed and Air Flow on the Protein Fraction from Yellow Pea and Red Lentil Flours.
Rationale and Objectives Fractionation of pulse flours is becoming an important segment of the pulse processing industry. In 2011 Cigi purchased a lab scale air classifier that has been used to fractionate yellow pea and red lentil flours. The objective of this study was to test how air classifier parameters such as classifier rotor speed and air flow effect the protein concentrations in the fine flour fractions generated by air classification. Materials and Methods In two separate studies split red lentils were milled using a lab scale pin mill and split yellow pea flour was acquired from a commercial supplier. The flours were fractionated using a lab scale air classifier where the classifier rotor speed was set to 4K, 6K, 8K and 10K rpm and two air flow settings (46 and 60 m³/h). Fine and coarse flour fractions were collected following air classification. The fine flour fraction was tested for protein content. Results and Discussion Results indicate that increasing air classifier rotor speed from 4 to 10 K rpm resulted in an increase in the concentration of protein in the fine flour fractions for both yellow pea and red lentil flours. Decreasing the air flow rate from 60 to 46 m³/h resulted in a small increase in the protein concentrations of the fine fractions (Table 1). Table 1. Protein Concentrations of Fine Fractions from Yellow Pea and Red Lentil Flours Air Classified at Various Rotor Speeds and Air Flow Rates.
Air Flow and Speed
Yellow Pea Flour (% Protein)
Red Lentil Flour (% Protein)
46 m³/h 4k rpm 35.1 28.6
46 m³/h 6k rpm 54.3 48.6
46 m³/h 8k rpm 56.6 59.2
46 m³/h 10k rpm 58.6 59.7
60 m³/h 4k rpm 28.9 26.9
60 m³/h 6k rpm 42.4 39.3
60 m³/h 8k rpm 52.9 50.4
60 m³/h 10k rpm 57.9 59.4
2.3 Impact of Processing on the Digestibility and Nutritional Quality of Pulse Flours and Fibre Fractions
(Additional funding for this project was obtained from AAFC – AIP program and SPG)
Rationale and Objectives Processing treatments such as dehulling, roasting and micronization are increasingly being used to enhance nutrition and improve functionality of pulse flours and fractions. It is not known however, if the pre-treatment of pulses prior to milling will affect the end quality characteristics of a food product such as spaghetti. The objective of this study was to examine the quality of pasta made with yellow
Enhancing World Markets For Canadian Pulses Through Secondary Processing and Value Added Research
SPG Project # PRO1008 Page 3
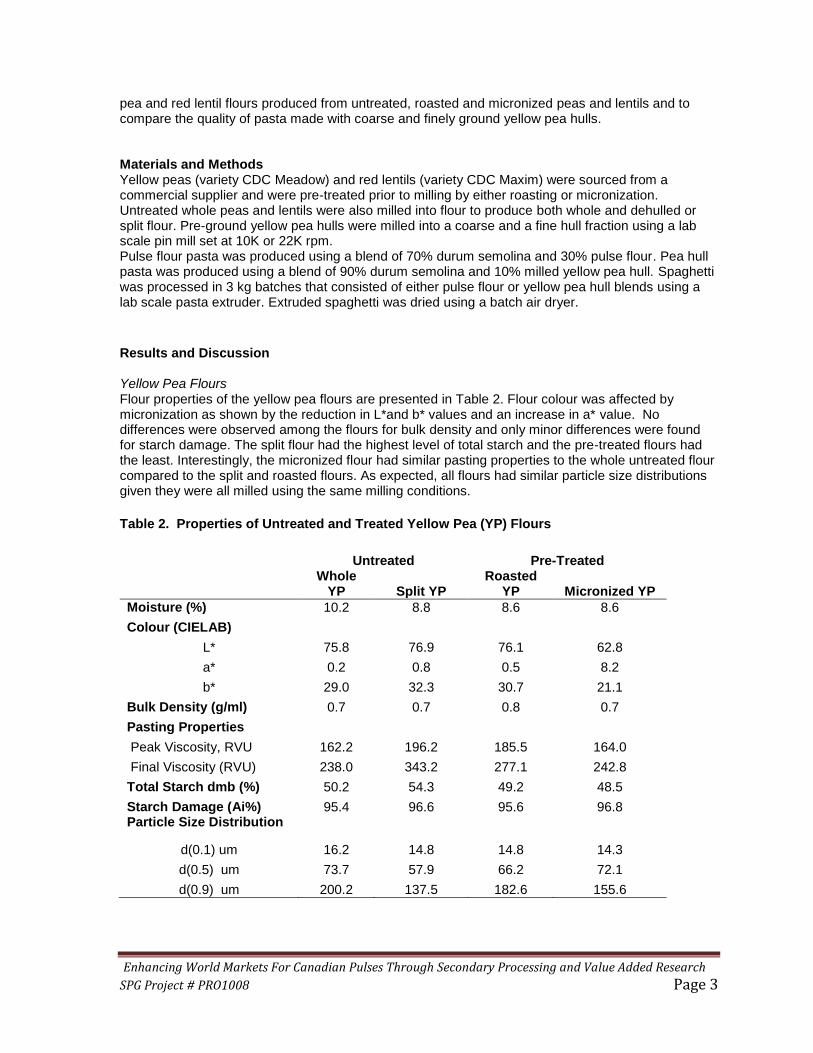
pea and red lentil flours produced from untreated, roasted and micronized peas and lentils and to compare the quality of pasta made with coarse and finely ground yellow pea hulls. Materials and Methods Yellow peas (variety CDC Meadow) and red lentils (variety CDC Maxim) were sourced from a commercial supplier and were pre-treated prior to milling by either roasting or micronization. Untreated whole peas and lentils were also milled into flour to produce both whole and dehulled or split flour. Pre-ground yellow pea hulls were milled into a coarse and a fine hull fraction using a lab scale pin mill set at 10K or 22K rpm. Pulse flour pasta was produced using a blend of 70% durum semolina and 30% pulse flour. Pea hull pasta was produced using a blend of 90% durum semolina and 10% milled yellow pea hull. Spaghetti was processed in 3 kg batches that consisted of either pulse flour or yellow pea hull blends using a lab scale pasta extruder. Extruded spaghetti was dried using a batch air dryer.
Results and Discussion Yellow Pea Flours Flour properties of the yellow pea flours are presented in Table 2. Flour colour was affected by micronization as shown by the reduction in L*and b* values and an increase in a* value. No differences were observed among the flours for bulk density and only minor differences were found for starch damage. The split flour had the highest level of total starch and the pre-treated flours had the least. Interestingly, the micronized flour had similar pasting properties to the whole untreated flour compared to the split and roasted flours. As expected, all flours had similar particle size distributions given they were all milled using the same milling conditions.
Table 2. Properties of Untreated and Treated Yellow Pea (YP) Flours
Untreated Pre-Treated
Whole
YP Split YP Roasted
YP Micronized YP
Moisture (%) 10.2 8.8 8.6 8.6
Colour (CIELAB)
L* 75.8 76.9 76.1 62.8
a* 0.2 0.8 0.5 8.2
b* 29.0 32.3 30.7 21.1
Bulk Density (g/ml) 0.7 0.7 0.8 0.7
Pasting Properties
Peak Viscosity, RVU 162.2 196.2 185.5 164.0
Final Viscosity (RVU) 238.0 343.2 277.1 242.8
Total Starch dmb (%) 50.2 54.3 49.2 48.5
Starch Damage (Ai%) 95.4 96.6 95.6 96.8 Particle Size Distribution
d(0.1) um 16.2 14.8 14.8 14.3
d(0.5) um 73.7 57.9 66.2 72.1
d(0.9) um 200.2 137.5 182.6 155.6

Enhancing World Markets For Canadian Pulses Through Secondary Processing and Value Added Research
SPG Project # PRO1008 Page 4
Spaghetti made from micronized peas had firmness values that were similar to the 100% durum control sample at all cooking times and had significantly lower peak force values than the other spaghetti samples when cooked for 10 and 12 min (Table 3).
Table 3. Instrumental Firmness of Spaghetti Made With Untreated and Treated Yellow Pea (TP)
Flours Cooked for 8, 10 and 12 Minutes
8 min 10 min 12 min
Spaghetti Sample Force (kg) Force (kg) Force (kg)
100% Durum Semolina (Control) 2.06 ± 0.16 1.61 ± 0.15 1.38 ± 0.13
30% Whole Untreated YP Flour 2.51 ± 0.28a¹ 2.11 ± 0.26a 1.80 ± 0.11a
30% Split Untreated YP Flour 2.86 ± 0.04a 2.39 ± 0.21a 1.94 ± 0.07a
30% Roasted YP Flour 2.53 ± 0.08a 2.12 ± 0.10a 1.77 ± 0.014a
30% Micronized YP Flour 2.09 ± 0.24a 1.65 ± 0.18b 1.38 ± 0.17b
¹Values within a column with the same letter are not significantly different (p<0.05)
No differences in cooking time were found among the pulse spaghetti samples and the 100% durum semolina control sample (Table 4). Table 4. Cooking Time of Spaghetti Made With Untreated and Pre-Treated Yellow Pea (YP) Flours
Spaghetti Sample Cooking Time
(min)
100% Durum Semolina (Control) 10.1 ± 0.2 a
30% Whole Untreated YP Flour 10.3 ± 0.4 a
30% Split Untreated YP Flour 10.0 ± 0.0 a
30% Roasted YP Flour 10.3 ± 0.4 a
30% Micronized YP Flour 10.0 ± 0.0 a
Spaghetti made from micronized pea flour had a slightly higher cooking loss although this difference was not found to be statistically significant (Figure 1).
Figure 1. Cooking Loss of Spaghetti Made with Untreated and Pre-Treated Yellow Pea Flours
¹Values with the same letter are not significantly different (p<0.05)
0.0
1.0
2.0
3.0
4.0
5.0
6.0
7.0
8.0
Co
oki
ng
Loss
(%
)
Pasta Sample
100% Durum Semolina Reference
30% Whole Yellow Pea Flour
30% Split Yellow Pea Flour
30% Roasted Yellow Pea Flour
30% Micronized Yellow Pea Flour
a¹ a a
a

Enhancing World Markets For Canadian Pulses Through Secondary Processing and Value Added Research
SPG Project # PRO1008 Page 5
Significant differences in L* (brightness) and a* (yellowness) values were observed between the spaghetti made from the micronized peas and the spaghetti made from untreated peas (whole and split flours) (Figure 2). No differences in b* values were found among the spaghetti samples.
Figure 2. Minolta Colour Values (L*, a*, b*) For Dried Spaghetti Made with Untreated and Pre-
Treated Yellow Pea Flours
¹Values within each colour parameter with the same letter are not significantly different (p<0.05)
Red Lentil Flours Flour properties of the red lentil flours are presented in Table 5. Split red lentil flour had the highest L*, a* and b* values while micronized, roasted and whole lentil flours had lower but similar L*, a* and b* values. Similar to the yellow pea flour results, there were no differences among the flours for bulk density and particle size distribution. The split red lentil flour had higher total starch and lower starch damage values compared to the other three lentil flours. Similar to the yellow pea flour results, the micronized flour has similar pasting properties to the whole untreated flour compared to the other two lentil flours.
0
10
20
30
40
50
60
70
80
100% DurumSemolinaReference
30% WholeYellow Pea Flour
30% Split YellowPea Flour
30% RoastedYellow Pea Flour
30% MicronizedYellow Pea Flour
Min
olt
a C
olo
ur
Val
ue
Pasta Sample
L*
a*
b*
b ab a
a a ab
b
a a a
b¹
a

Enhancing World Markets For Canadian Pulses Through Secondary Processing and Value Added Research
SPG Project # PRO1008 Page 6
Table 5. Properties of Untreated and Treated Red Lentil (RL) Flours
Untreated Treated
Whole RL Split RL Roasted
RL Micronized
RL
Moisture (%) 9.1 9.5 7.8 9.0
Colour (CIELAB) L* 62.3 71.4 61.9 61.7
a* 8.5 16.6 8.7 8.2
b* 21.1 31.4 20.9 19.7
Bulk Density (g/ml) 0.8 0.7 0.8 0.8
Pasting Properties
Peak Viscosity, RVU 156.5 197.6 164.1 183.6
Final Viscosity (RVU) 264.8 350.1 265.8 275.2
Total Starch dmb (%) 47.3 53.2 46.6 46.5
Starch Damage (Ai%) 99.4 97.5 99.5 99.4 Particle Size Distribution
d(0.1) um 15.5 14.5 14.2 14.8
d(0.5) um 71.0 69.9 76.7 79.7
d(0.9) um 223.2 146.8 159.5 169.0
No significant differences in firmness were found among the red lentil flour spaghetti samples cooked for 8, 10 or 12 min (Table 6). Regardless of cooking time, spaghetti made with red lentil flour was firmer than the 100% durum semolina control sample Spaghetti made from roasted lentil flour had a slightly higher cooking loss although this difference was not found to be statistically significant (Figure 3).
Table 6. Instrumental Firmness of Spaghetti Made With Untreated and Treated Red Lentil (RL)
Flours Cooked for 8, 10 and 12 Minutes
8 min 10 min 12 min
Spaghetti Sample Force 8 min
(kg) Force 10 min
(kg) Force 12 min
(kg)
100% Durum Semolina (Control) 2.06 ± 0.16 1.62 ± 0.15 1.38 ± 0.13
30% Whole Untreated RL Flour 3.02 ± 0.24a¹ 2.44 ± 0.22a 1.96 ± 0.26a
30% Split Untreated RL Flour 3.25 ± 0.16a 2.71 ± 0.12a 2.23 ± 0.26a
30% Roasted RL Flour 2.61 ±0.17a 2.23 ± 0.06a 1.96 ± 0.18a
30% Micronized RL Flour 2.57 ± 0.10a 2.13 ± 0.21a 1.75 ± 0.08a
¹Values with the same column with the same letter are not significantly different (p<0.05)
No differences in cooking time were found among the red lentil flour spaghetti samples and the 100% durum semolina control sample (Table 7).

Enhancing World Markets For Canadian Pulses Through Secondary Processing and Value Added Research
SPG Project # PRO1008 Page 7
Table 7. Cooking Time of Spaghetti Made With Untreated and Pre-Treated Red Lentil (RL) Flours
Spaghetti Sample CT (min)
100% Durum Semolina (Reference) 10.1 ± 0.2
30% Whole Untreated RL Flour 10.0 ± 0.0
30% Split Untreated RL Flour 10.3 ± 0.4
30% Roasted RL Flour 10.3 ± 0.4
30% Micronized RL Flour 10.0 ± 0.0
Figure 3. Cooking Loss of Spaghetti Made With Untreated and Pre-Treated Red Lentil Flours
¹Values with the same letter are not significantly different (p<0.05)
Spaghetti made with untreated split red lentil flour had significantly higher L* (brightness), a* (yellowness) and b* (redness) values than all other spaghetti samples (Figure 4). In addition, the micronized red lentil flour had significantly lower b* values than untreated whole flour and lower a* values than the untreated whole flour and the roasted flour.
0.0
1.0
2.0
3.0
4.0
5.0
6.0
7.0
Co
oki
ng
Loss
(%
)
Pasta Sample
100% Durum Semolina Reference
30% Whole Red Lentil Flour
30% Split Red Lentil Flour
30% Roasted Red Lentil Flour
30% Micronized Red Lentil Flour
a a
a¹ a

Enhancing World Markets For Canadian Pulses Through Secondary Processing and Value Added Research
SPG Project # PRO1008 Page 8
Figure 4. Minolta Colour Values (L*, a*, b*) For Dried Spaghetti Made From Untreated and Pre-Treated Yellow Pea Flours
¹Values within the each colour parameter with the same letter are not significantly different (p<0.05)
Coarse and Fine Pea Hull Fractions Properties of the coarse and fine pea hull fractions are presented in Table 8. As expected, there are notable differences in particle size distribution between the two hull fractions. No difference in bulk density were found between the two fractions and only minor differences were observed in colour (b* value) and total starch.
Table 8. Properties of Milled Yellow Pea Hulls
Coarse Fibre
Fine Fibre
Moisture (%) 8.6 6.6
Colour (CIELAB) L* 70.5 70.0
a* 0.8 0.8
b* 15.4 14.9
Bulk Density (g/ml) 0.8 0.8 Particle Size Distribution
d(0.1) um 172.4 16.9
d(0.5) um 535.4 249.5
d(0.9) um 1089.2 510.7
Total Starch dmb (%) 6.9 7.9
Regardless of cooking time, no differences in firmness were found between the spaghetti made with the coarse and fine pea hull fractions (Table 9) but spaghetti made from both fractions had lower firmness values than the 100% durum semolina control spaghetti.
0
10
20
30
40
50
60
70
80
100% DurumSemolinaReference
30% Whole RedLentil Flour
30% Split RedLentil Flour
30% RoastedRed Lentil Flour
30% MicronizedRed Lentil Flour
Min
olt
a C
olo
ur
Val
ue
Pasta Sample
L*
a*
b*
b¹
a
b b
a
b b c
a
b bc c

Enhancing World Markets For Canadian Pulses Through Secondary Processing and Value Added Research
SPG Project # PRO1008 Page 9
Table 9. Instrumental Firmness of Spaghetti Made with Milled Yellow Pea Hulls Cooked for 8, 10 and 12 Minutes
Pasta Sample Force 8 min
(kg) Force 10 min
(kg) Force 12 min
(kg)
100% Durum Semolina (Reference) 2.06 ± 0.16 1.62 ± 0.15 1.38 ± 0.13
10% Coarse Fibre 1.82 ± 0.01a¹ 1.51 ± 0.02a 1.28 ± 0.02a
10% Fine Fibre 1.82 ± 0.03a 1.50 ± 0.02a 1.28 ± 0.002a
¹Values with the same letter are not significantly different (p<0.05) No differences in cooking time were found among the spaghetti made with the pea hull fractions and the 100% durum semolina control sample (Table 10).
Table 10. Cooking Time (CT) of Spaghetti Made with Milled Yellow Pea Hulls
Spaghetti Sample CT (min)
100% Durum Semolina (Reference) 10.1 ± 0.2 10% Coarse Fibre 9.8 ± 0.4 10% Fine Fibre 9.5 ± 0.0
No differences in cooking loss were found between the spaghetti made with coarse and fine pea hull fractions but both spaghetti samples had lower cooking losses then the 100% durum semolina control spaghetti (Figure 5).
Figure 5. Cooking Loss of Spaghetti Made with Milled Yellow Pea Hulls
¹Values with the same letter are not significantly different (p<0.05)
Significant differences in L* and a* values were observed between the spaghetti made with the two hull fractions. No significant differences were observed in the b* values for the spaghetti made with the two hull fractions (Figure 6).
0.0
1.0
2.0
3.0
4.0
5.0
6.0
Co
oki
ng
Loss
(%
)
Pasta Sample
100% Durum SemolinaReference
10% Coarse Fibre
10% Fine Fibre
a a¹

Enhancing World Markets For Canadian Pulses Through Secondary Processing and Value Added Research
SPG Project # PRO1008 Page 10
Figure 6. Minolta Colour Values (L*, a*, b*) For Dried Spaghetti Made with Milled Yellow Pea Hulls
Neither pre-treating of pea and lentil seeds prior to milling nor particle size of the pea hull fraction had a major effect on spaghetti quality with the exception of dried spaghetti colour and the firmness of spaghetti made from micronized yellow peas.
2.3 Pargem Project (Additional funding for this project was obtained from Alberta Agriculture and Rural Development and the Alberta Pulse Growers)
Rationale and Objectives Pargem is a process developed by Buhler AG in Switzerland which involves the controlled partial germination of grains. Cigi has partnered with Dr. Eliana Zamprogna (Buhler, Switzerland), Dr. Jay Han (Food Product Development Centre, Leduc Dr Joyce Boye (AAFC, St Hyacinthe) and Dr. Jim House (University of Manitoba, Winnipeg) to undertake the project. The objectives of this study were to evaluate the nutritional quality, processing attributes and consumer acceptance of partially germinated yellow pea flour derived from the Pargem process. Materials and Methods Partially germinated (Pargem), micronized and untreated whole yellow peas were milled into flour using a commercial pin mill and assessed for composition. Flours were processed into extruded snacks using a twin screw cooking extruder. The end product quality of the snacks was measured. Results and Discussion The compositional and physical analysis of flours (protein, total starch, fibre, colour and particle size distribution) is shown in Table 11. Pargem flours exhibited a lower total starch value compared to the micronized and untreated pea flours. The pargem flour was slightly darker in colour then the untreated and micronized flours indicated by lower L*, b* and higher a* Minolta colour values. Micronized flour had a higher soluble fibre value and the untreated flour had the lowest total dietary fibre value when compared to the micronized and untreated flours.
0
10
20
30
40
50
60
70
80
100% DurumSemolina Reference
10% Coarse Fibre 10% Fine Fibre
Min
olt
a C
olo
ur
Val
ue
Pasta Sample
L*
a*
b*
a¹ b
a b
a a

Enhancing World Markets For Canadian Pulses Through Secondary Processing and Value Added Research
SPG Project # PRO1008 Page 11
Table 11. Compositional Analysis of Micronized, Pargem and Untreated Whole Yellow Pea Flours.
Micronized Pargem Untreated Protein Content %¹ 22.96 23.76 23.14
Total starch %¹ 47.0 44.7 46.6 Insoluble Fibre %¹ 15.10 16.60 14.60
Soluble Fibre %¹ 3.30 1.90 1.60
Total Dietary Fibre %¹ 18.40 18.50 16.20
Minolta Colour
L* 74.1 72.5 74.2
a* 0.81 3.10 0.70
b* 30.1 25.0 33.8
Mastersizer d(0.1) um 6.8 4.4 4.2
d(0.5) um 33.8 23.7 23.5 d(0.9) um 352.9 253.7 186.2
¹ values based on dmb
Following the extrusion of the flours, micronized flour had a slightly higher expansion ratio (Figure 7) and a lower bulk density (Figure 8) compared to snacks made with untreated and Pargem flours. However, the results were not statistically significant at (p<0.05). Figure 7. Expansion Ratio of Extruded Snacks Made with 100% Untreated, Micronized and Pargem Whole Yellow Pea Flours
¹ Values with the same letter are not significantly different (p<0.05)
2.0
2.5
3.0
3.5
4.0
Untreated Micronized Pargem
Expansion Ratio
a¹ a
a

Enhancing World Markets For Canadian Pulses Through Secondary Processing and Value Added Research
SPG Project # PRO1008 Page 12
Figure 8. Bulk Density of Extruded Snacks Made with 100% Untreated, Micronized and Pargem Whole Yellow Pea Flours
¹ Values with the same letter are not significantly different (p<0.05)
Extruded snacks made using Pargem flour had significantly lower L* and significantly higher a* values when compared to snacks using untreated and micronized flours (Table 12). Table12. Minolta Colour Values of Untreated, Micronized and Pargem Whole Yellow Pea Flours.
L* a* b*
Untreated 77.1 ± 0.5 a¹ - 0.2 ± 0.2 b 28.2 ± 0.3 a Micronized 77.0 ± 0.1 a 0.3 ± 0.0 b 26.0 ± 0.6 b Pargem 73.8 ± 0.6 b 3.1 ± 0.6 a 27.4 ± 0.5 c
¹Values within a column with the same letter are not significantly different (p<0.05)
Extruded snacks made with Pargem flour had the highest crispiness value compared to snacks made using untreated and micronized pea flour (Compression peak counts correspond to crispiness of the extruded snacks)(Figure 9).
40.0
45.0
50.0
55.0
60.0
Untreated Micronized Pargem
Bulk Density
(mg/cm³)

Enhancing World Markets For Canadian Pulses Through Secondary Processing and Value Added Research
SPG Project # PRO1008 Page 13
Figure 9. Compression Peak Counts of Extruded Snacks Made with Untreated, Micronized and Pargem Flours.
¹ Values with the same letter are not significantly different (p<0.05) Future work at Cigi will include the processing and quality testing of spaghetti using Pargem, micronized and untreated whole yellow pea flours. Processing and quality assessment of baked products such as pan bread and crackers using the Pargem, micronized and untreated whole yellow pea flours will be carried out at FPDC. Digestibility and protein content of the flours will be assessed by AAFC and the University of Manitoba respectively.
2.5 Assessment of the Quality and Sensory Characteristics of Foods Made Using Red Pea Flour.
Rationale and Objectives In 2011 a trained sensory panel evaluated the odour and flavour characteristics of a cooked red cotyledon pea variety supplied by the CDC in Saskatoon. The sensory analysis indicated that the red pea variety had lower flavour intensity when compared to a conventional yellow pea variety. A pea variety exhibiting less pea flavour is desirable as a food ingredient, especially in the form of flour. The objective of this study was to assess the end product quality and flavour characteristics of foods made with flour derived from the red peas. Materials and Methods Red cotyledon peas (variety 2710-1) and control peas (variety CDC Golden) were acquired from CDC in Saskatoon and roller milled into whole flours. The flours were used to produce 100% pea flour extruded puffed snacks and also blended at 30% inclusion with wheat flour to produce tortillas. The end product quality of the extruded snacks and the tortillas was measured.
0
100
200
300
400
500
Untreated Micronized Pargem
Compression Peak Count
b
c
a¹

Enhancing World Markets For Canadian Pulses Through Secondary Processing and Value Added Research
SPG Project # PRO1008 Page 14
Results and Discussion Extruded Puffed Snacks Quality assessment of extruded puffed snacks made using red cotyledon pea flour and control yellow pea flour indicates no significant differences in expansion ratio and texture of the snacks. However, a significant difference was observed between the bulk densities of the snacks (Table 13). Table 13. Expansion Ratio, Bulk Density and Texture Values of Extruded Puffed Snacks Made with Yellow and Red Pea Flour
Expansion Ratio¹ Bulk Density
(mg/cm³) Texture
(Crispiness)²
Whole Yellow Pea Flour (Control) 3.25 ± 0.09 a³ 75.20 ± 1.60 a 251 ± 10 a
Whole Red Pea Flour 3.30 ± 0.09 a 74.70 ± 0.76 b 255 ± 9 a
¹ Ratio of product diameter to the diameter of the extruder die opening ² Determined using a TA.HD Plus texture analyzer and expresses as the number of peaks during compression
³ Values within a column with the same letter are not significantly different (p<0.05) Significant differences were observed for all Minolta colour values of the extruded puffed snacks made using control yellow pea flour and red cotyledon pea flour (Table 14)
Table 14. Minolta Colour Values of Extruded Puffed Snacks Made with Yellow and Red Pea Flour
L* a* b*
Whole Yellow Pea Flour (Control) 76.6 ± 0.6 a¹ -0.15 ± 0.06 a 29.4 ± 0.4 a Whole Red Pea Flour 73.8 ± 0.5 b 4.9 ± 0.07 b 26.9 ± 0.2 b
¹Values within a column with the same letter are not significantly different (p<0.05)
Tortillas Significant differences were not observed for weight and diameter between the pulse flour tortillas. However, tortillas made with wheat flour were significantly different from the pulse flour tortillas for both weight and diameter. There were no significant differences in thickness between any of the tortillas tested (Table 15). Table 15. Weight, Diameter and Thickness Values of Tortillas Made with Wheat, Yellow Pea and Red Pea Flours.
Weight (g) Diameter (cm) Thickness (mm)
Wheat Flour Control 38.8 ± 3.4 a¹ 18.3 ± 1.0 a 1.34 ± 0.3 a
30% Whole Yellow Pea Flour 35.5 ± 0.6 b 17.5 ± 0.6 b 1.74 ± 0.3 a
30% Whole Red Pea Flour 36.3 ± 1.4 b 17.1 ±1.0 ab 1.68 ± 0.2 a
¹Values within a column with the same letter are not significantly different (p<0.05) Tortillas made with whole yellow pea flour had significantly lower instrumental firmness values when compared to the wheat flour control and red pea flour tortillas. Tortillas made with yellow pea and red pea flours had lower cohesiveness values then the control tortillas made with wheat flour (Table 16).

Enhancing World Markets For Canadian Pulses Through Secondary Processing and Value Added Research
SPG Project # PRO1008 Page 15
Table 16. Firmness and Cohesiveness Instrumental Texture Values for Tortillas Made with Wheat Flour, Whole Yellow Pea and Red Pea Flours.
Firmness² Cohesiveness³
100% Wheat Flour Control 355 ± 22 a¹ 2326 ± 323 a
30% Whole Yellow Pea Flour 263 ± 47 b 1016 ± 320 b
30% Whole Red Pea Flour 379 ± 51 a 1513 ± 427 b
¹Values within a column with the same letter are not significantly different (p<0.05)
² Determined using a TA.HD Plus texture analyzer and expressed as the peak force used to compress a tortilla ³ Determined using a TA.HD Plus texture analyzer and expressed as the area under the peak force curve
Significant differences were found between all Minolta colour values L*, a* and b* for tortillas made with the yellow, red and wheat flours (Table 17). Table 17. Minolta Colour Values for Tortillas Made with Wheat Flour Control, Whole Yellow Pea and Red Pea Flours
L* a* b*
100% Wheat Flour Control 83.78 ± 1.4 a -0.76 ± 0.6 a 20.81 ± 1.2 a
30% Whole Yellow Pea Flour 81.84 ± 0.5 b 0.69 ± 0.4 b 25.97 ± 0.9 b
30% Whole Red Pea Flour 77.02 ± 0.5 c 7.58 ± 0.6 c 27.98 ± 1.3 c
¹Values within a column with the same letter are not significantly different (p<0.05)
Sensory analysis of the extruded snacks and the tortillas show that products containing the red pea flower have less pea flavour and an overall more acceptable flavour characteristics then the products made using whole yellow pea flour. Overall products made with red pea flour retained acceptable end product quality and exhibited improved flavour characteristics.
2.6 Lab Scale Dehulling of Soybeans
Rationale and Objectives Pesticide levels were tested in the hulls and cotyledons of soybeans by a processor. The objective of this study for Cigi was to establish a lab scale method for dehulling and splitting of soybeans and to dehull soybeans that were a part of this study.

Enhancing World Markets For Canadian Pulses Through Secondary Processing and Value Added Research
SPG Project # PRO1008 Page 16
Materials and Methods: Four soybean samples were sourced by a commercial supplier. The soybeans were pitted, conditioned and hot air dried. The soybeans were then dehulled using a lab scale dehuller (Figure 10). Figure 10. Lab Scale Conditioning, Hot Air Drying and Dehulling of Canadian Soybeans
Results and Discussion Good results for dehulling soybeans were achieved using a similar procedure used to dehull and split peas (Figure 11). Dehulled soybeans and the fibre fractions were sent to the processor for further testing. Figure 11. Dehulled and Split Canadian Soybeans Using a Lab Scale Dehulling Method Developed at Cigi
2.7 Development of Gluten Free Products – Ginger Snap Cookies
Rationale and Objectives The use of pulse ingredients to develop gluten-free products adds variety, nutrition and functionality to the growing gluten-free ingredient market. The objective of this study was to develop a gluten-free cookie formulation that used split yellow pea flour as an ingredient.

Enhancing World Markets For Canadian Pulses Through Secondary Processing and Value Added Research
SPG Project # PRO1008 Page 17
Materials and Methods Split yellow pea flour at 20% inclusion was blended with rice and tapioca flours and incorporated into a ginger snap cookie. Formulation developed by Cigi (Table 18) Table 18. Gluten–Free Ginger Snap Cookie Formulation
Ingredient Quantity (Bakers %)
White rice flour 53 Tapioca flour 27
Split yellow pea flour 20
Salt 0.7
Baking soda 2
Corn syrup 15
Sugar 30
Ground cinnamon 0.7
Ground ginger 1.1
Ground cloves 0.3
Monoglycerides 2.5
Molasses 35
Shortening 33
Water 5
Results and Discussion Ginger snap cookies made with gluten free ingredients were significantly thinner and had greater width and spread values than the wheat control cookies (Table 19). Table 19. Cookie Quality (Width, Thickness, Spread) for Cookies Made Using 100% Wheat Flour and a 20% Split Yellow Pea Flour Blend.
Width (mm) Thickness (mm) Spread (W/T)
100% Wheat Flour Control 68.8 ± 3.53 a 10.2 ± 0.0 a 6.7 ± 0.3 a
20% Split Yellow Pea Flour 82.4 ± 0.14 b 9.8 ± 0.07 b 8.5 ± 0.2 b
¹Values within a column with the same letter are not significantly different (p<0.05)

Enhancing World Markets For Canadian Pulses Through Secondary Processing and Value Added Research
SPG Project # PRO1008 Page 18
Ginger snap cookies made using 20% split yellow pea flour blend had an overall firmer instrumental texture then the cookies made using 100% wheat flour for both day 1 and day 6 of testing (Figure 12). Figure 12. Peak Force Values of Gluten-Free and Wheat Cookies
Gluten-free yellow pea flour cookies were slightly thinner and had greater width and spread values than the wheat control cookies (Figures 13 and 14). Figure 13. Width and Spread of Gluten-Free (left) and Wheat (right) Ginger Snap Cookies.
0.0
1.5
3.0
4.5
6.0
20% Split Yellow Pea Flour 100% Wheat Flour Control
Pea
k Fo
rce
(kg
)
Cookie Type
Day 1
Day 6

Enhancing World Markets For Canadian Pulses Through Secondary Processing and Value Added Research
SPG Project # PRO1008 Page 19
Figure 14. Height of Gluten-Free (left) and Wheat (right) Ginger Snap Cookies.
The addition of split yellow pea flour to the ginger snap cookie formulation improved the nutritional content of the cookies which many gluten-free baked products are lacking. Expert panel sensory analysis of the cookies indicated that the gluten-free yellow pea flour cookies maintained very acceptable appearance, texture and flavour characteristics. Cigi is currently working on gluten free tortilla and pita bread formulations.
3. New Projects Initiated
3.1 Development of gluten-free products using pulse ingredients
As the gluten-free food product market develops there is an increased demand for non-
conventional gluten free ingredients such as pulse flours and fractions. Cigi will continue to
develop and test formulations for gluten free pizza crust, low expansion chips, pasta and
other baked products.
3.2 Quality assessment of extruded and baked products made using micronized whole pea and lentil flours
The effect of micronizating whole red lentils and whole yellow peas will be determined on the end product quality of baked goods, extruded snacks and pasta.
3.3 Influence of functional ingredients on the end product quality of extruded snacks
made with pulse flours. Effects of functional ingredients such as proteins, starches, emulsifiers, sugar and sodium chloride on the extrusion properties of pulse flours will be examined.

Enhancing World Markets For Canadian Pulses Through Secondary Processing and Value Added Research
SPG Project # PRO1008 Page 20
4. Additional Activities
Technical support was provided to the industry and to researchers as requested.
Demonstrations on pulse processing were given to Cigi course participants and visitors.
Dehulling of Red Lentils was completed as part of a CDC project on nutrient bioavailability. 5. Conference Attendance and Oral and Poster Presentations
L. Malcolmson, P. Frohlich, and G. Boux attended the AACC Annual Meeting and Exposition in Hollywood FL September 30 - October 3, 2012. Two research posters entitled “ Effect of Fibre Enrichment Level and Fibre Particle Size on the Extrusion Properties of Split Yellow Pea Flour” ( Appendix 1) and " Use of Pulse Ingredients to Develop Healthier Baked Products “ (Appendix 2) were presented by Peter Frohlich and Gina Boux respectively.
P. Frohlich, and G. Boux attended the Ninth Canadian Pulse Research Workshop in Niagara Falls. Two research posters entitled “ Effect of Fibre Enrichment Level and Fibre Particle Size on the Extrusion Properties of Split Yellow Pea Flour” ( Appendix 1) and " Use of Pulse Ingredients to Develop Healthier Baked Products “ (Appendix 2) were presented by Peter Frohlich and Gina Boux respectively.
L. Malcolmson attended the PGDC Annual Meeting in Saskatoon, February 26-28, 2013.
P. Frohlich delivered an oral presentation at the Extrusion Platforms America Seminar in Winnipeg on October 30, 2012 entitled “Effect of Fibre Enrichment Level and Fibre Particle Size on the Extrusion Properties of Split Yellow Pea Flour”
G. Boux attended the 3rd
International Gluten-Free Symposium on Cereal and Beverage Products in Vienna, Austria June 12-14, 2013.
P. Frohlich delivered an oral presentations at the Buhler facility in Uzwill Switzerland on June 18, 2013 entitled “ Enhancing Market Opportunities for Canadian Pulses” and “ Pargem Project – Cigi Update” (this activity was funded by the Pargem project)
6. Statement of Expenditures for Year 3 and Projected Expenditures for Year 4. 6.1 Refer to Statement of Project Expenditures for Year 3 prepared by CIGI finance department. 6.2 Projected Project Expenditures for Year 4
SPG Funds for Year 4
August 1, 2013 - July 31, 2014
MPGA Funds for Year 4
August 1, 2013 - July 31, 2014
Salaries & Benefits 123,105 5,000
Material & Supplies 5,000 5,000
Travel 7,000 5,000
Overhead/Admin Fee 5,000 0
Equipment 5,000 5,000
Total 145,105 20,000
SPG/MPGA Funds 75,051 10,000

Enhancing World Markets For Canadian Pulses Through Secondary Processing and Value Added Research
SPG Project # PRO1008 Page 21
6. Description of Achievement Arising From the Project to Date (Year 3)
Fractionation of pea and lentil flours
Understanding the effects of classifier speed and air flow on the protein concentrations of air
classified fine fractions.
Development of gluten-free products using pulse flours: ginger snap cookies and tortillas.
Understanding the effects of roasting, micronization and dehulling of yellow peas and red
lentil on pulse pasta quality.
Understanding the effects of partial germination of yellow peas on the quality of pasta and
extruded snacks.
Analyzing composition of red pea flour and testing the flour in conventional food products.
Developing a lab scale method for the dehulling of soybeans.
7. Summary for Publication in Power Point Magazine The Canadian International Grains Institute (Cigi) has completed the third year of a five year project to enhance market opportunities for Canadian pulses. During the past year Cigi has continued value added applied research using whole pulses, pulse flours and pulse fractions. Cigi’s work included projects that investigated the effects of dehulling, roasting, germinating and micronizing of peas and lentils on the nutrition and functionality of pulses as ingredients in food products. This research is important as enhancing nutrition and functionality of pulse ingredients can make pulse crops even more desirable and marketable to both the consumer and the food industry. Following a recent purchase of a laboratory air classifier, Cigi has been fractionating pea, lentil and bean flours into valuable starch and protein fractions. In addition, Cigi has been testing flour milled from a new red pea variety as an ingredient in tortillas and snack foods. Cigi thanks SPG and MPGA for their continued support and strives to assist and support the Canadian pulse industry in efforts to promote and enhance market opportunities for Canadian pulses.