Embed Size (px)
Citation preview
Noname manuscript No.
(will be inserted by the editor)
Operations Research in BASF’s Supply Chain Operations
Robert Blackburn · Josef Kallrath · Steffen T.
Klosterhalfen
June 10, 2014
Abstract In this article we highlight the application of Operations Research (OR) at BASF in the area of
supply chain management (SCM) through the use of selected examples with annual cost savings ranging
between several hundred thousand and several million e. We address special characteristics of the process
industry that have to be dealt with and identify future research needs. The examples cover strategic, tactical,
and operational topics encountered at BASF. We share our lessons learned based on our experience from
past OR projects in SCM about challenges as well as benefits of standard and tailor-made OR solutions.
In general, we find that the special characteristics often call for a modification or enhancement of standard
OR models. Providing appropriate solutions therefore requires a joint effort of SCM, IT, and OR experts.
Keywords supply chain management · OR · mathematical programming · modeling · tailor-made solutions
1 Introduction
The last decades have seen a tremendous increase in the amount of data that companies collect and store.
This is also true for BASF. The ability to exploit those data is considered to be an important driver of better
Robert Blackburn
BASF SE
GS - Information Services & Supply Chain Operations
67056 Ludwigshafen, Germany
E-mail: [email protected]
Josef Kallrath
BASF SE
GVM/S - Scientific Computing
67056 Ludwigshafen, Germany
E-mail: [email protected]
Steffen T. Klosterhalfen
BASF SE
GVM/S - Scientific Computing
67056 Ludwigshafen, Germany
E-mail: [email protected]
2 Robert Blackburn et al.
decision making and improved profitability. McAfee and Brynjolfsson (2012) find that “companies in the
top third of their industry in use of data-driven decision making were on average 5% more productive and
6% more profitable than their competitors” (p. 64). In order to realize such potentials, not only sufficient
computing power is required, but more importantly the tailored application of mathematical methods and
algorithms towards individual problems is critical. Conventional approaches and tools are mostly not suf-
ficient. Instead, advanced mathematical competencies are needed to transform a real-world problem into a
mathematical data-based problem, optimize relevant parameters, and provide quantitative results for deci-
sion support. In other words, there is a clear need for a stronger use of Operations Research (OR). Expertise
in OR/mathematics at BASF is becoming a significant strategic opportunity in a world where complexity
and the need for effectiveness as well as efficiency are increasing.
BASF has an in-house unit named Scientific Computing which is the competence center for mathematics.
The unit consists of an interdisciplinary team with background in mathematics, statistics, chemistry, physics
and quantitative economics. While there are certainly further units and individuals within certain business
units of BASF applying OR methods, they are mainly focused on one particular method or application
type. In contrast, the experts at Scientific Computing have an extensive methodological toolset at their
disposal. It enables them to select the most appropriate solution approach for an individual problem and
build dedicated models and specialized algorithms, if necessary.
Experience has shown that the latter is rather the rule than the exception to it. Due to the special charac-
teristics in the process industry, in general, and BASF, in particular, readily available “standard” solutions
can hardly ever be applied without any shortcomings or modification. For instance, one of BASF’s charac-
teristics is its “Verbund” structure. “Verbund” refers to the efficient use of resources. Production plants at
large sites are closely interlinked. The value chains (from basic chemicals to high-value-added products) are
designed in such a way that the by-products of one plant can be used as the starting materials of another.
Thus, the system saves resources and energy, minimizes emissions, cuts logistics costs and utilizes infrastruc-
tural synergies. For instance, the heat of production processes can be used as energy in other plants. The
“Verbund” setup generates strong interdependencies between several businesses and cyclic relationships in
the material flow, which represent challenges for standard mathematical models and approaches.
The main contributions of this paper are: (i) We illuminate the role OR plays at BASF, (ii) we provide
examples of projects addressing decision problems in the area of strategic, tactical, and operational supply
chain management (SCM) solved by OR techniques, (iii) we identify topics for future research in those
areas, and (iv) we provide a detailed discussion on lessons learned and different views in the SCM and OR
world.
The remainder of the paper is structured as follows. The next three sections address selected decision
problems at BASF in the strategic (Section 2), tactical (Section 3), and operational (Section 4) domain as
well as topics for future research. In Section 5 we summarize insights that we have gained from applying
OR in the SCM area at BASF with regard to its value, but also with regard to the challenges encountered.
Section 6 concludes the paper.
Operations Research in BASF’s Supply Chain Operations 3
2 Strategic decision support
In the strategic decision domain we highlight three areas where the application of OR methods has generated
value for BASF and still does. The first example is a very traditional OR problem: strategic distribution
network optimization. Even though there are standard software packages available for addressing this prob-
lem, there is still room for enhancements. The second example is a special topic in the supply chain context,
but a very important one for BASF and its “Verbund” structure. In this particular case we are concerned
with the “Water Verbund”, i.e., the supply and usage of fresh water and waste water. The third example
deals with the logistics side and addresses the design of BASF’s rail car fleet.
2.1 Strategic distribution network optimization
2.1.1 Description of the real-world example
Planning the future supply chain landscape is one of the key drivers for cost reduction in BASF. Amongst
others, the aspects under consideration refer to the positioning of warehouses, the determination of appropri-
ate plant capactities and the selection of the right modes of transportation given various supply, production,
and distribution constraints. BASF operates in business units, each with their own supply chain planning
units which optimize their sub-networks mainly on their own. This isolated approach most likely leads to
a suboptimal setup from an overall BASF perspective. Moreover, new investments and company acqui-
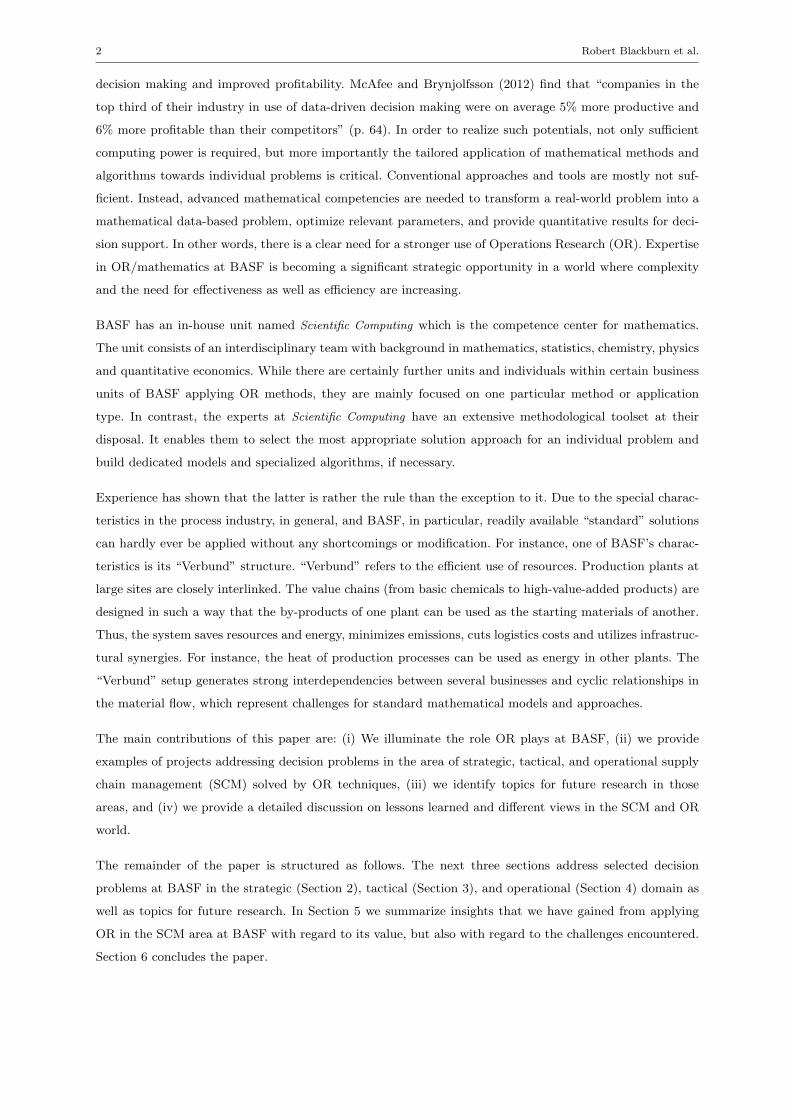
sitions constantly change the network design. Therefore, global network optimization projects have been
successfully established as repetitive events to foster cooperation and make use of synergies in terms of
transportation and warehousing costs as well as taxation aspects. Figure 1 shows how such a project is
typically structured at BASF.
Fig. 1 Strategic distribution network optimization – Project outline
Data collection
As-Is modeling
Baseline extra-polation
Scenario calculation
Sensitivity analysis
Proposal Implementation
From a modeling point of view, such a project starts with a very time-consuming data collection phase in
which historical data is extracted from the systems and needs to be prepared for optimization. By translating
this data into the mathematical model world, we obtain the so-called “As-Is” model. After incorporating
planned network changes and extrapolating demand and cost figures, we obtain the “Baseline” model which
serves for cost comparison and project benefit analysis. Having strategic visions in mind, several predefined
as well as project specific scenarios are optimized to get a glimpse of the overall optimization potential within
the network. In these scenarios, typically, customer service level requirements are relaxed or improved, the
absolute number of locations may be minimized or different distribution concepts (centralized, regional or
local distribution centers) are tested to challenge the current situation and explore future opportunities.
Finally, we arrive at a proposal, which can be seen as the most likely to be operated network design respecting
all side constraints. Single measures are identified and quantified by the expected benefit.
4 Robert Blackburn et al.
Of major importance to the success of such a project is the communication of the modeling assumptions.
Involving the business units early on in this process is key in order to get their trust in the final calculations.
From the past projects we find that the cost saving potential amounts to 5-10% of logistics cost plus taxes,
which corresponds to 5-20 million e per project.
A lot of standard software tools are available to carry out network optimization studies – still they need to be
adapted to the needs of BASF’s complexity. Here, we are closely cooperating with Barloworld’s supply chain
experts in enhancing their CAST tool. CAST is a powerful supply chain planning software application used
for global supply chain network modeling, strategic network design and supply chain optimization, which
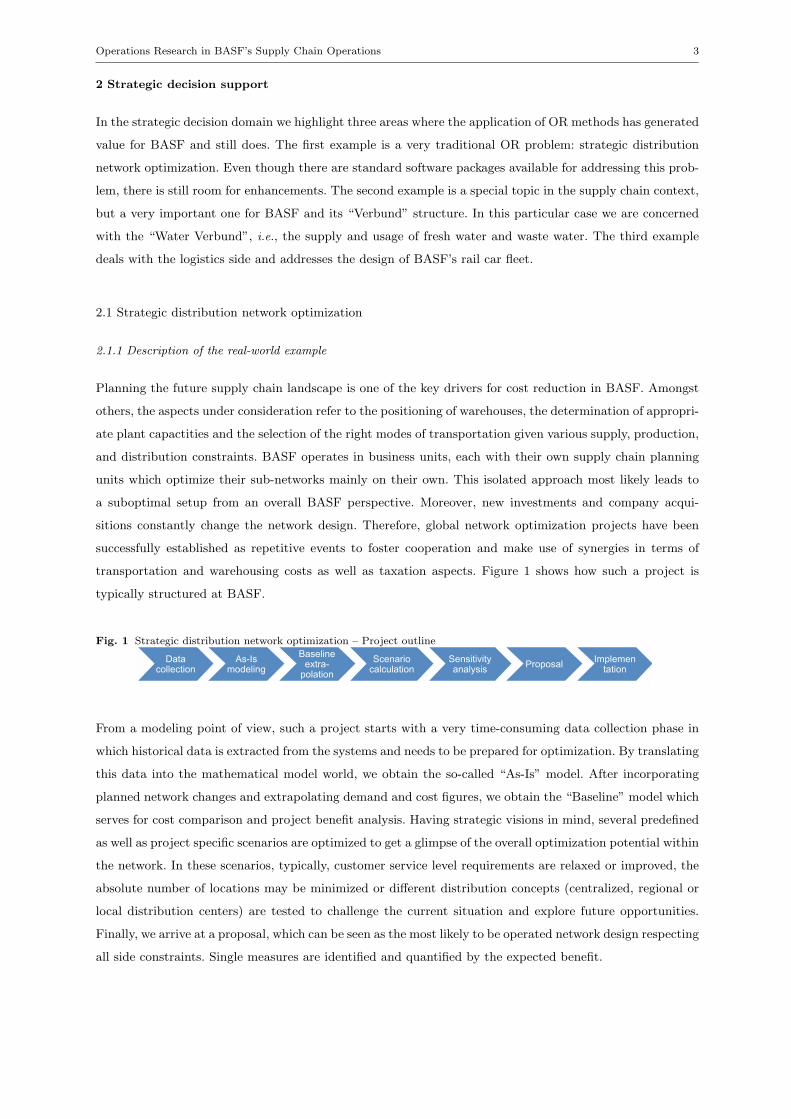
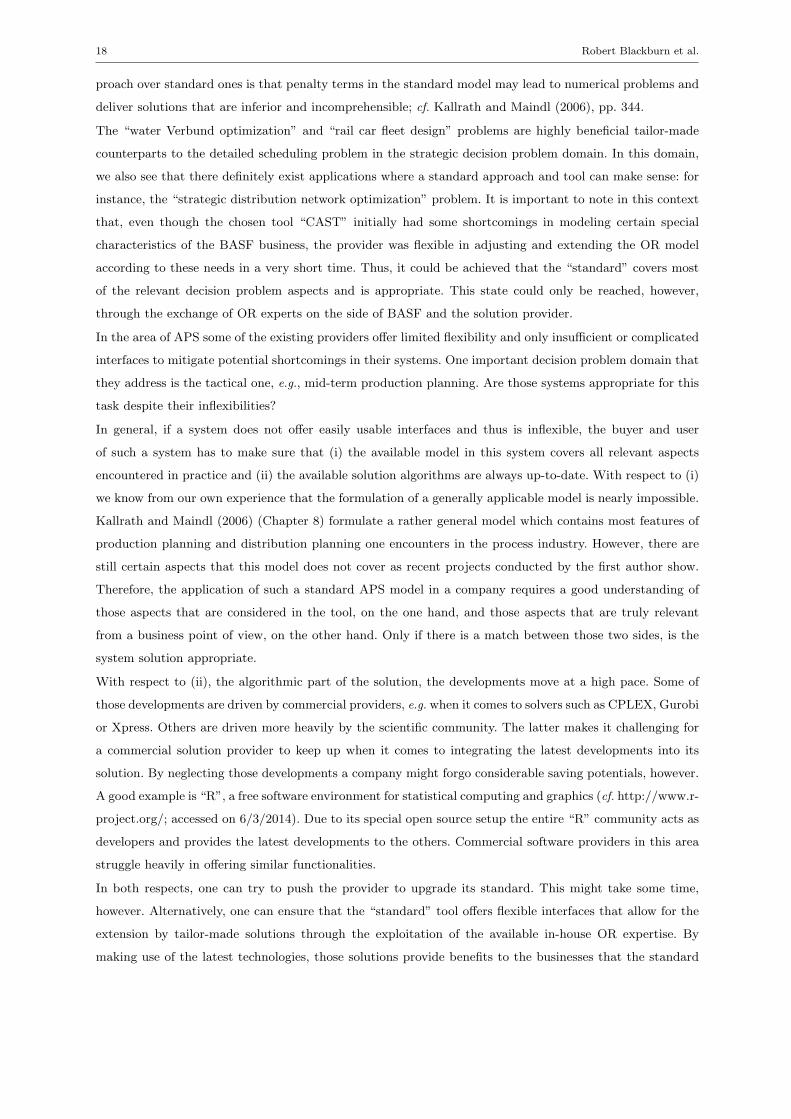
also provides a graphical user interface to illustrate the computational results. Figure 2 presents a proposal
obtained by the optimization model for parts of BASF’s distribution network in South America. The figure
on the left shows the inbound flows from the ports to the warehouses (green dots). The figure on the right
depicts the outbound flows from the warehouses to the customer regions.
Fig. 2 Strategic distribution network optimization – Sample network
Inbound flows
to warehouses
Outbound flows to
customer regions
Even though the standard mathematical model working in the background of the CAST tool contains many
constraints that can be used to reflect the real-world setting, some relevant aspects for the BASF network
in, e.g., South America are missing. In this region various kinds of inter-state taxes need to be paid with
the possibility of balancing certain credits and burdens. Therefore, it is important to account for those tax
aspects in an appropriate way. In the original CAST model this aspect could not be reflected appropriately,
however. Upon our request, calculations for refundable and non-refundable taxes developed together with
our OR experts have been incorporated into the tool. Even though aspects such as taxation might seem
minor at first, they drive the ultimate result. In the future it is intended to make the tool even more
flexible. Each user should be able to add his/her own (additional) constraints to the model without having
to contact the CAST developers. Thus, necessary adjustments can be made more quickly by the company’s
OR experts.
It is critical to the success of the project to obtain reliable data. Though all kinds of cost and volume
movements from the past might be available, they are maintained differently from business unit to business
unit and need manual adjustments. In terms of time, this easily adds up to half of the project timeline.
However, it is essential to bring in the suggested changes into the implementation plan. Besides historical
Operations Research in BASF’s Supply Chain Operations 5
data the forecasting accuracy as well as the modeling of transportation and warehousing costs play a crucial
role. For transportation cost, we use regression analysis based on distances and drop sizes, if logistically
reasonable, or we add original rates from the contracts, if these differ too much. Thus, the cost for proposed
routes in the future can be estimated. In the financial reports warehousing costs are easily distinguished
in fixed and variable costs. To correctly reflect the strategic nature of the project, parts of the fixed costs,
such as labor, have to be translated into variable costs, however. It is crucial to check all of these rates with
procurement early on in the process to get their final buy-in.
The challenge in solving our strategic network optimization problems within reasonable computation times
comes from the huge size of the obtained networks. That is why efforts to keep the model at a reasonable
size need to be made in the data preparation phase. In fact, there is a huge tradeoff between accuracy and
applicability of OR methods.
2.1.2 Future research
Multi-objective optimization is a desirable direction for future development. Balancing cost with carbon
footprint to increase sustainability, customer service lead times or the handling of complex distribution
structures are only a few examples. Here, techniques for efficiently calculating the pareto-optimal frontier
for further investigations of the solution space are in high demand.
Even more important and crucial for the success is finding a robust solution, i.e., a solution that is stable
against forecasting errors and against small changes in the cost assumptions. In particular, in strategic
network optimization, simple scenario-based (best- or worst-case) approaches are not suited to obtain one
solution being good enough in all scenarios. Hence, techniques from simulation, stochastic programming, or
robust optimization - if any of them were applicable to such large-sized instances - are highly sought after.
2.2 Water Verbund optimization
2.2.1 Description of the real-world example
As an example of a non-standard design problem in SCM we refer to the Water Verbund optimization
problem at the BASF site in Antwerp (Kallrath (1999)). The motivation for this project in the mid-nineties
was a shortage of fresh water from the river Schelde. The general problem can be described as follows.
Water-consuming processing units require water of certain qualities measured in terms of impurities. If
appropriate, waste water might be used instead of fresh water. Thus, some units may use waste water
from certain other units instead of fresh water if they are properly connected by pipelines. Treatment and
processing units have limited capacities. The investment of new, local treatment plants is another option.
Contamination limits for outlet into the Schelde river have to be observed as well.
The developed mathematical model includes a free network flow topology, pooling (nonlinear), selecting
pipes, treatments, and capacities (discrete) of the pipelines. The degrees of freedom are to construct addi-
tional pipes in order to increase waste water re-use or to build additional local re-processing units to save
6 Robert Blackburn et al.
fresh water. The target of the mixed-integer non-linear programming (MINLP) problem is to minimize the
overall cost.
Back in 1997, the problem could not be solved by formulating a single (“monolithic”) model; instead,
several models (polylithic approach, cf. Kallrath (2011)) were developed that interact with each other to find
a solution; the solution of one model is the starting point of another. The result of the polylithic model were
good proposals for network design. Based on these suggestions, additional pipelines were built. The project
costs of about 250 ke were well balanced by annual savings of 300 ke. Therefore, the amortization period
of this project was less than one year.
2.2.2 Future research
Today the solver technologies have improved and the particular model described above can also be solved as
a monolithic one. In general, many projects at BASF require polylithic modeling and solution approaches
as a bridging technology. Those problems can be used as interesting cases and starting points for further
improving the solver technologies with the goal that, after a few years, those problems can be solved by
monolithic model formulations. Decomposition approaches, a subclass of polylithic solution techniques,
should also be kept in mind as a valuable solution technique. In many situations they allow us to prove
global optimality for hard problems (cf. Rebennack et al. (2009)), e.g., for non-convex nonlinear problems
(NLP and MINLP), which are still very challenging.
2.3 Rail car fleet design
2.3.1 Description of the real-world example
In the logistics area of SCM there are also interesting design questions to be answered, such as the optimal
design of BASF’s rail car fleet; cf. Klosterhalfen et al. (2013). In particular, answers have to be found to
the following three questions: (i) Structure - Which types of rail cars should be used? (ii) Size - What is an
appropriate number of rail cars of a specific type? (iii) Ownership - Should BASF buy additional rail cars
of certain types to increase its ownership (instead of leasing)?
In this project the two major challenges in finding a solution are the following: First, the mathematical
model needs to account for substitution between different rail car types. The product to be transported
has certain minimum requirements regarding the rail car characteristics. One such characteristic is, e.g., the
material of the rail car. Higher quality rail cars can be used as substitutes for lower ones. For instance, iron
rail cars can be substituted by stainless steel cars. Second, stochastic demand and travel times of the rail
cars have to be taken into account. Considering each of these two aspects in isolation in a mathematical
model is rather simple. It is the combination that makes it challenging.
The solution approach developed together with the fleet management team combines two standard tech-
niques used in OR: mixed integer linear programming (MILP) supporting substitution between the different
rail car types and stochastic inventory control approaches to derive safety stocks in order to account for
Operations Research in BASF’s Supply Chain Operations 7
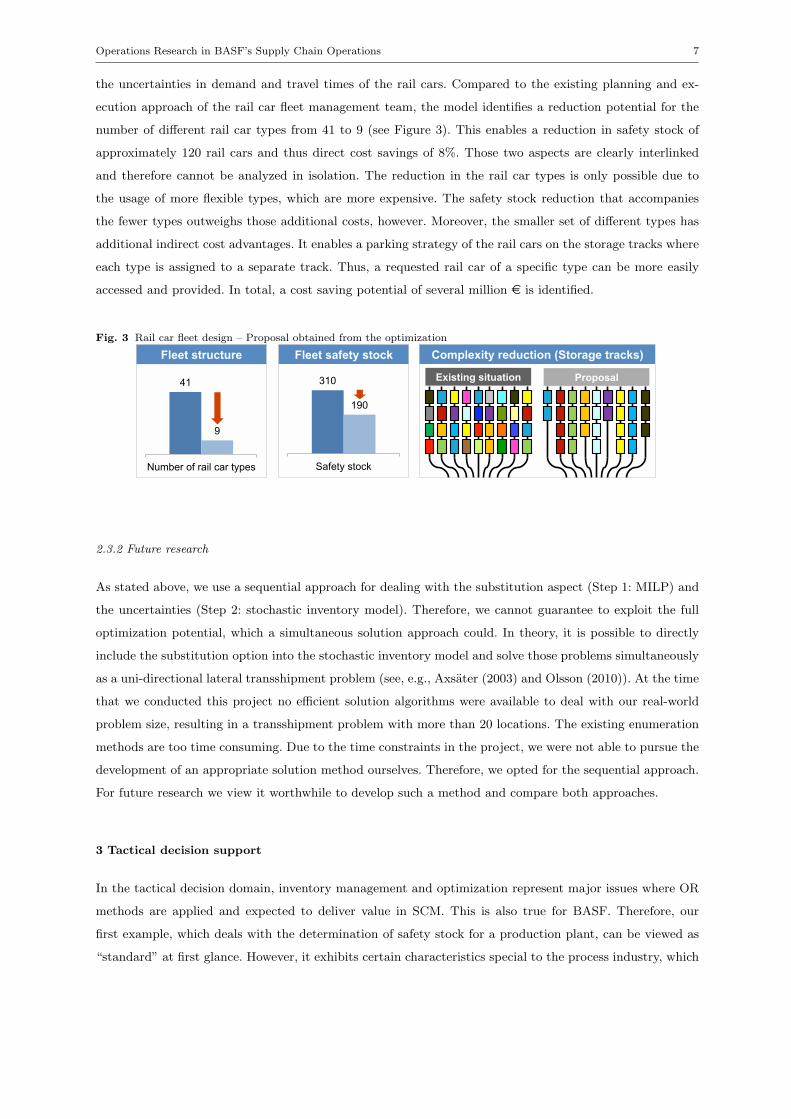
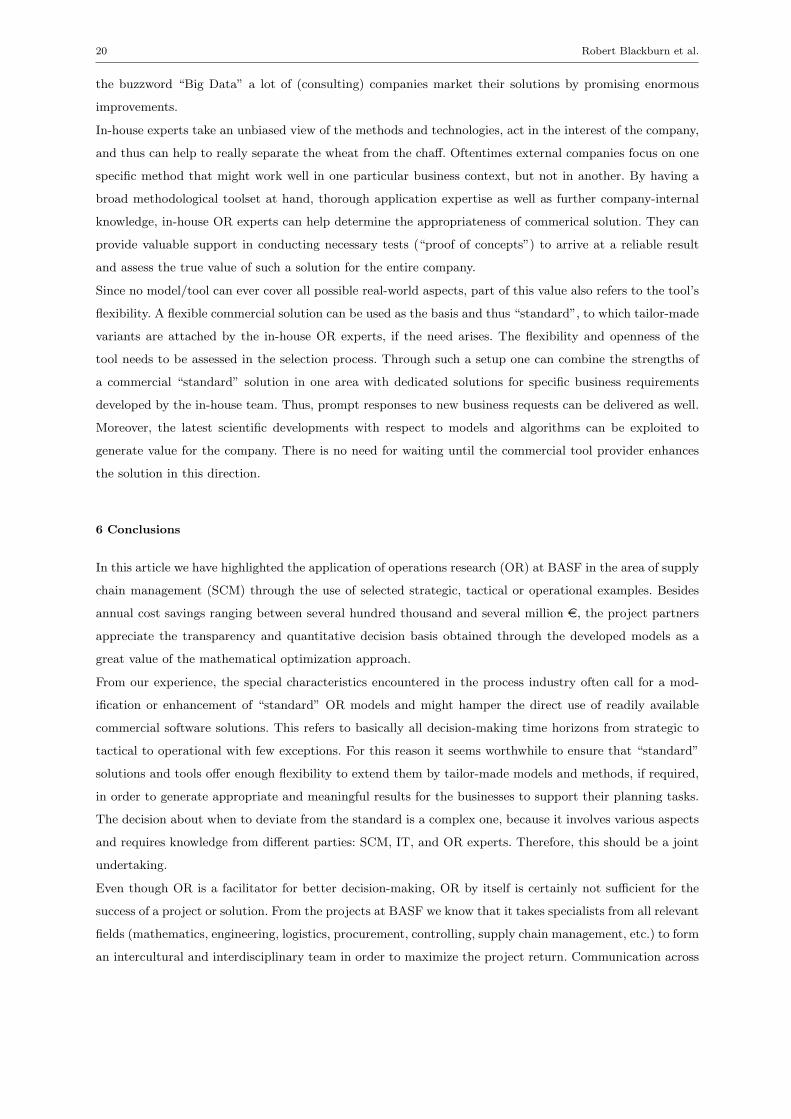
the uncertainties in demand and travel times of the rail cars. Compared to the existing planning and ex-
ecution approach of the rail car fleet management team, the model identifies a reduction potential for the
number of different rail car types from 41 to 9 (see Figure 3). This enables a reduction in safety stock of
approximately 120 rail cars and thus direct cost savings of 8%. Those two aspects are clearly interlinked
and therefore cannot be analyzed in isolation. The reduction in the rail car types is only possible due to
the usage of more flexible types, which are more expensive. The safety stock reduction that accompanies
the fewer types outweighs those additional costs, however. Moreover, the smaller set of different types has
additional indirect cost advantages. It enables a parking strategy of the rail cars on the storage tracks where
each type is assigned to a separate track. Thus, a requested rail car of a specific type can be more easily
accessed and provided. In total, a cost saving potential of several million e is identified.
Fig. 3 Rail car fleet design – Proposal obtained from the optimization
Fleet structure Fleet safety stock Complexity reduction (Storage tracks)
Existing situation Proposal 41
9
Number of rail car types
310
190
Safety stock
2.3.2 Future research
As stated above, we use a sequential approach for dealing with the substitution aspect (Step 1: MILP) and
the uncertainties (Step 2: stochastic inventory model). Therefore, we cannot guarantee to exploit the full
optimization potential, which a simultaneous solution approach could. In theory, it is possible to directly
include the substitution option into the stochastic inventory model and solve those problems simultaneously
as a uni-directional lateral transshipment problem (see, e.g., Axsater (2003) and Olsson (2010)). At the time
that we conducted this project no efficient solution algorithms were available to deal with our real-world
problem size, resulting in a transshipment problem with more than 20 locations. The existing enumeration
methods are too time consuming. Due to the time constraints in the project, we were not able to pursue the
development of an appropriate solution method ourselves. Therefore, we opted for the sequential approach.
For future research we view it worthwhile to develop such a method and compare both approaches.
3 Tactical decision support
In the tactical decision domain, inventory management and optimization represent major issues where OR
methods are applied and expected to deliver value in SCM. This is also true for BASF. Therefore, our
first example, which deals with the determination of safety stock for a production plant, can be viewed as
“standard” at first glance. However, it exhibits certain characteristics special to the process industry, which
8 Robert Blackburn et al.
make it challenging. The second example, the “Supply chain early warning system”, is not something that
directly comes to mind when thinking about OR in supply chains and as such is rather non-standard. This
system enables the early detection of industry trends and quantifies its impact on BASF’s supply chains.
Therefore, it provides critical information for many other OR models used in the supply chain area. In
the third subsection we address collaborative planning as an important issue for BASF due to its Verbund
structure.
3.1 Inventory management
3.1.1 Description of the real-world example
As for basically every company, the right-sizing of inventories is critical for BASF in order to minimize its
working capital cost while providing the promised customer service. In many cases the application of simple
standard approaches that do not take into account the special characteristics of the analyzed real-world
setting at BASF is insufficient as it either leaves cost saving potentials untouched or might prescribe stock
levels that are too small for guaranteeing the target customer service.
One such example is studied in Klosterhalfen et al. (2014). They analyze a high-pressure reactor that
produces a liquid chemical around the clock. Basically, the process is only interrupted for maintenance
purposes. The chemical reaction within the reactor can be run at different rates, i.e., it can be done at a
lower or higher pace. The quality of the output is not affected as long as the run rate stays within a certain
range. Consequently, the minimum and maximum run rates define the minimum and maximum production
quantities that can enter the inventory each month. The run-rate adjustment represents the only feasible
reaction to the stochastic customer demand. Due to technical reasons such a run-rate adjustment is only
possible at regular intervals; in this particular case at the beginning of each month.
Standard inventory models usually do not consider such constraints on the production or replenishment
quantities or at most they consider one of those constraints; oftentimes it is a capacity constraint on the
production process which results in a maximum production quantity restriction. A tailored inventory model
that takes those special characteristics into account can deliver considerable value. Compared to the simple
standard inventory model without the quantity restrictions, which is currently used as an approximation,
Klosterhalfen et al. (2014) identify a safety stock quantity saving potential of 12.3% for this particular
company setting.
3.1.2 Future research
The above-described example highlights only one of BASF’s special requirements in the area of inventory
management. Other prominent challenges refer to the better integration of production aspects into stochastic
inventory models and the inventory management of products with an uncertain beginning of the selling
season. The latter aspect is typical, e.g., for the agricultural products business at BASF. Due to varying
weather conditions the selling period of certain products starts earlier or later in a year and even the length
of the selling season might vary. What complicates matters is that some of the final product components,
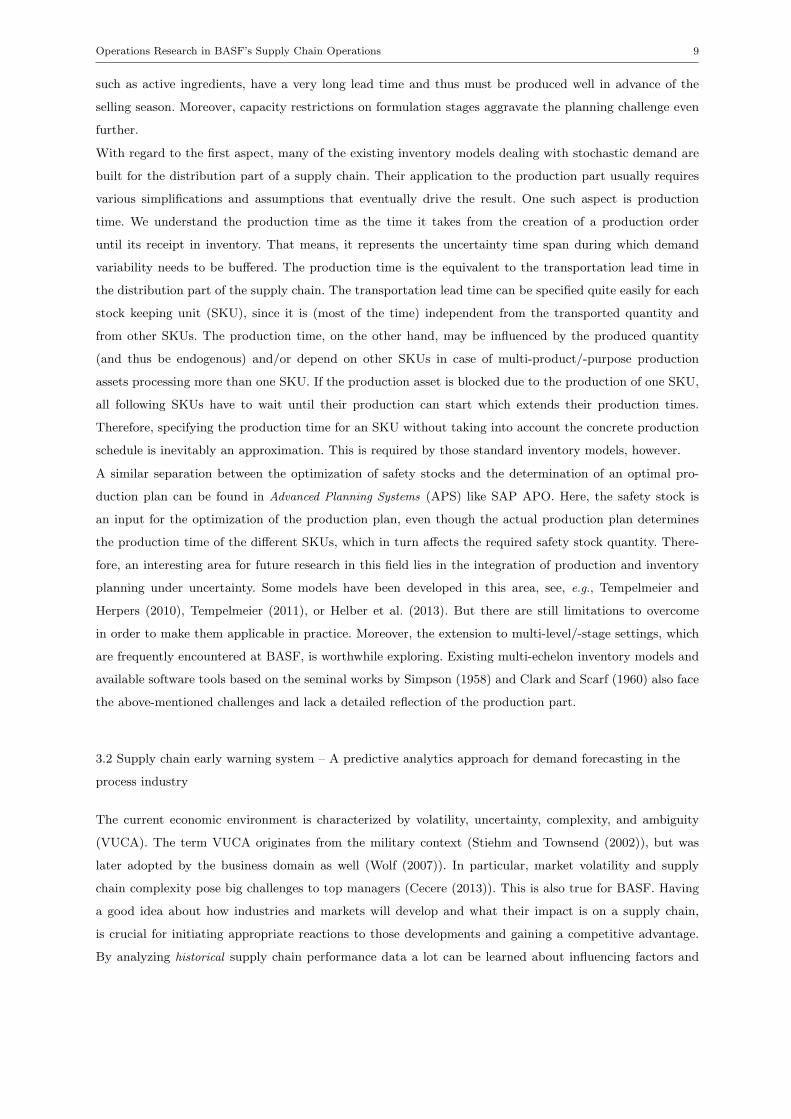
Operations Research in BASF’s Supply Chain Operations 9
such as active ingredients, have a very long lead time and thus must be produced well in advance of the
selling season. Moreover, capacity restrictions on formulation stages aggravate the planning challenge even
further.
With regard to the first aspect, many of the existing inventory models dealing with stochastic demand are
built for the distribution part of a supply chain. Their application to the production part usually requires
various simplifications and assumptions that eventually drive the result. One such aspect is production
time. We understand the production time as the time it takes from the creation of a production order
until its receipt in inventory. That means, it represents the uncertainty time span during which demand
variability needs to be buffered. The production time is the equivalent to the transportation lead time in
the distribution part of the supply chain. The transportation lead time can be specified quite easily for each
stock keeping unit (SKU), since it is (most of the time) independent from the transported quantity and
from other SKUs. The production time, on the other hand, may be influenced by the produced quantity
(and thus be endogenous) and/or depend on other SKUs in case of multi-product/-purpose production
assets processing more than one SKU. If the production asset is blocked due to the production of one SKU,
all following SKUs have to wait until their production can start which extends their production times.
Therefore, specifying the production time for an SKU without taking into account the concrete production
schedule is inevitably an approximation. This is required by those standard inventory models, however.
A similar separation between the optimization of safety stocks and the determination of an optimal pro-
duction plan can be found in Advanced Planning Systems (APS) like SAP APO. Here, the safety stock is
an input for the optimization of the production plan, even though the actual production plan determines
the production time of the different SKUs, which in turn affects the required safety stock quantity. There-
fore, an interesting area for future research in this field lies in the integration of production and inventory
planning under uncertainty. Some models have been developed in this area, see, e.g., Tempelmeier and
Herpers (2010), Tempelmeier (2011), or Helber et al. (2013). But there are still limitations to overcome
in order to make them applicable in practice. Moreover, the extension to multi-level/-stage settings, which
are frequently encountered at BASF, is worthwhile exploring. Existing multi-echelon inventory models and
available software tools based on the seminal works by Simpson (1958) and Clark and Scarf (1960) also face
the above-mentioned challenges and lack a detailed reflection of the production part.
3.2 Supply chain early warning system – A predictive analytics approach for demand forecasting in the
process industry
The current economic environment is characterized by volatility, uncertainty, complexity, and ambiguity
(VUCA). The term VUCA originates from the military context (Stiehm and Townsend (2002)), but was
later adopted by the business domain as well (Wolf (2007)). In particular, market volatility and supply
chain complexity pose big challenges to top managers (Cecere (2013)). This is also true for BASF. Having
a good idea about how industries and markets will develop and what their impact is on a supply chain,
is crucial for initiating appropriate reactions to those developments and gaining a competitive advantage.
By analyzing historical supply chain performance data a lot can be learned about influencing factors and
10 Robert Blackburn et al.
resulting responses within a supply chain. However, in isolation this information is of little use for the better
steering of a supply chain. To do so it needs to be combined with forward-looking data about industries and
markets.
This is the goal of the “Supply Chain Early Warning System (SC-EWS)” that has been developed over the
last few years within BASF. It combines external industry and economic information (external indicators),
BASF’s large internal information base (internal indicators), and new analytical approaches and methods.
Thus industry and market trends are detected and related to the impacted businesses and supply chains
within BASF. The time horizon on which the system (currently) focusses is 3-12 months.
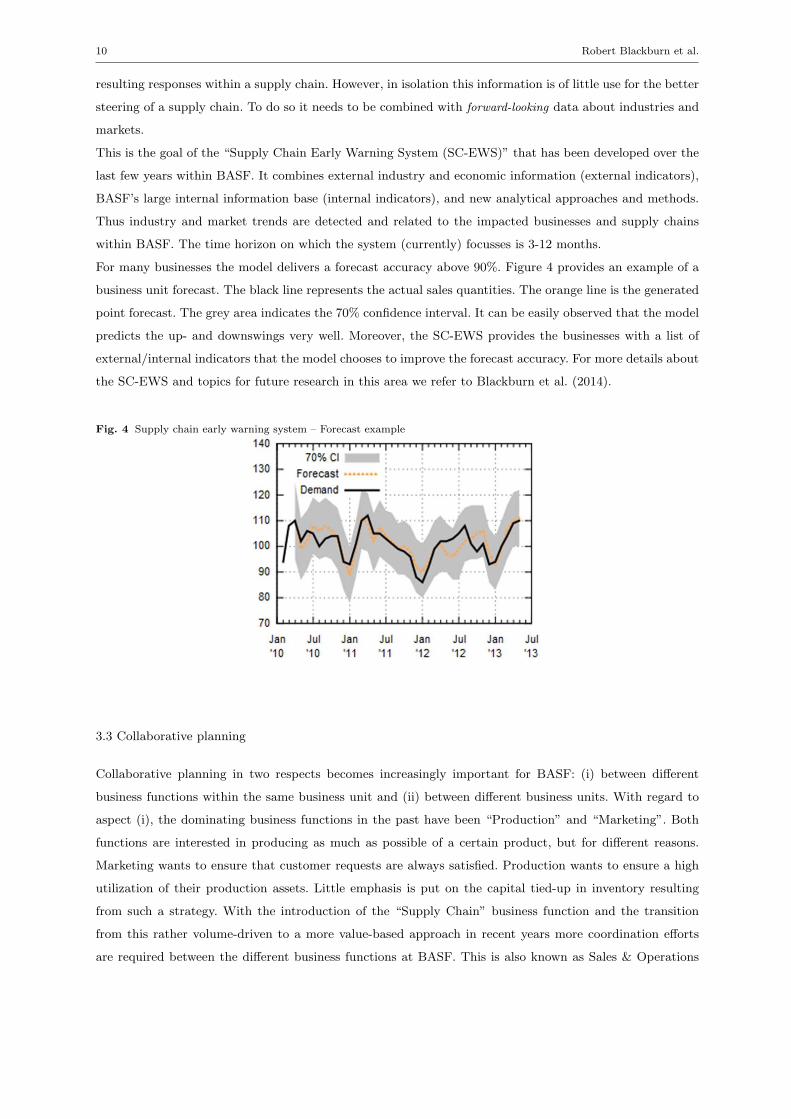
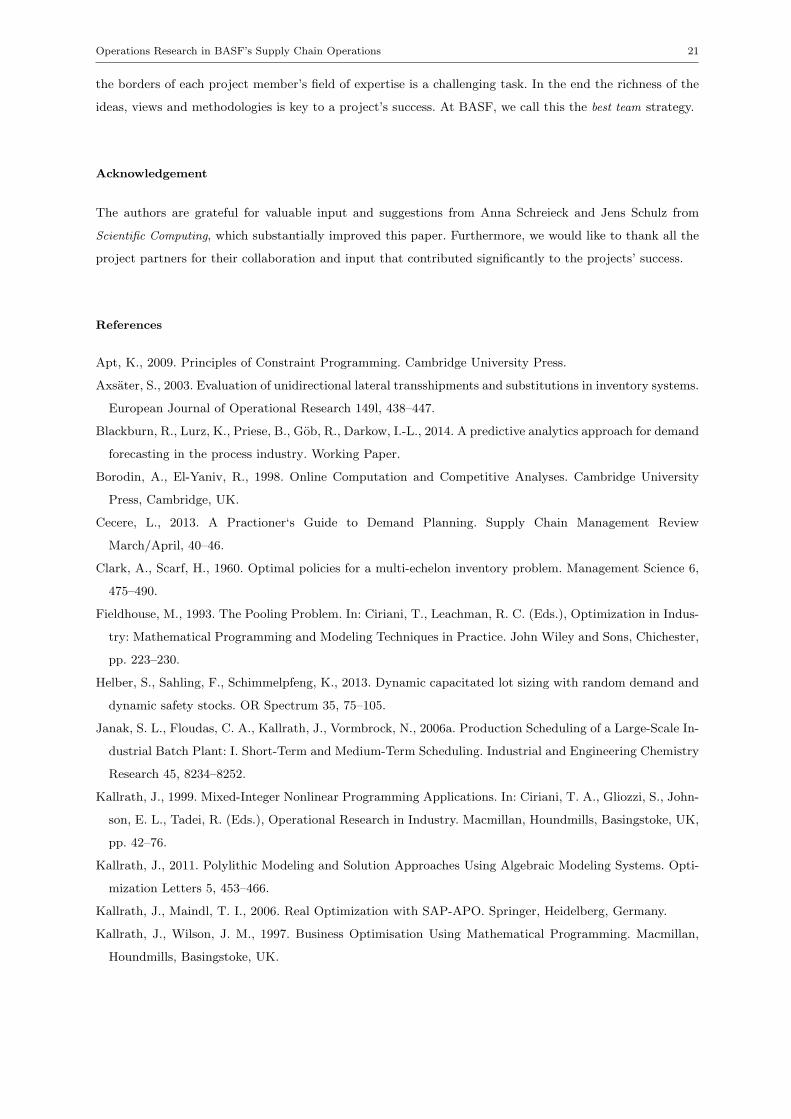
For many businesses the model delivers a forecast accuracy above 90%. Figure 4 provides an example of a
business unit forecast. The black line represents the actual sales quantities. The orange line is the generated
point forecast. The grey area indicates the 70% confidence interval. It can be easily observed that the model
predicts the up- and downswings very well. Moreover, the SC-EWS provides the businesses with a list of
external/internal indicators that the model chooses to improve the forecast accuracy. For more details about
the SC-EWS and topics for future research in this area we refer to Blackburn et al. (2014).
Fig. 4 Supply chain early warning system – Forecast example
3.3 Collaborative planning
Collaborative planning in two respects becomes increasingly important for BASF: (i) between different
business functions within the same business unit and (ii) between different business units. With regard to
aspect (i), the dominating business functions in the past have been “Production” and “Marketing”. Both
functions are interested in producing as much as possible of a certain product, but for different reasons.
Marketing wants to ensure that customer requests are always satisfied. Production wants to ensure a high
utilization of their production assets. Little emphasis is put on the capital tied-up in inventory resulting
from such a strategy. With the introduction of the “Supply Chain” business function and the transition
from this rather volume-driven to a more value-based approach in recent years more coordination efforts
are required between the different business functions at BASF. This is also known as Sales & Operations
Operations Research in BASF’s Supply Chain Operations 11
Planning. OR methods can be extremely useful in this context by providing quantitative decision support.
In case of raw material or product shortages, suggestions based not only on volume, but on value can be
generated. Those suggestions can also take into account additional restrictions in the supply chain.
Aspect (ii), the collaboration between different business units, is particularly important for BASF due to its
highly integrated Verbund structures. They create many interdependencies between different business units
as they share parts of one and the same value chain. When it comes to the optimization of such chains, e.g.,
in case of raw material shortages, ideally all the relevant data including price information are collected and
plugged into an appropriate OR model that produces the optimal (most profitable) result. However, due to
various reasons, business units do not directly share profitability information with each other. This hampers
the above-described approach. Therefore, it seems interesting for future research to look for approaches that
do not require this explicit information sharing, but still deliver (close to) optimal results.
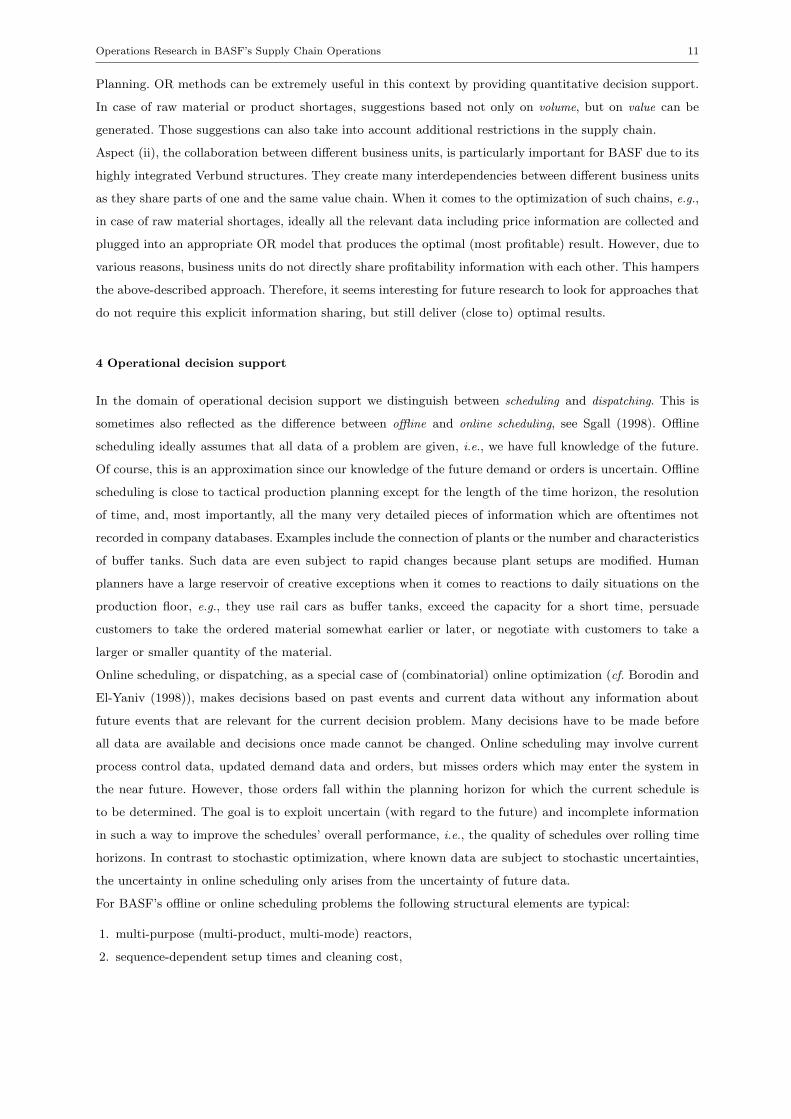
4 Operational decision support
In the domain of operational decision support we distinguish between scheduling and dispatching. This is
sometimes also reflected as the difference between offline and online scheduling, see Sgall (1998). Offline
scheduling ideally assumes that all data of a problem are given, i.e., we have full knowledge of the future.
Of course, this is an approximation since our knowledge of the future demand or orders is uncertain. Offline
scheduling is close to tactical production planning except for the length of the time horizon, the resolution
of time, and, most importantly, all the many very detailed pieces of information which are oftentimes not
recorded in company databases. Examples include the connection of plants or the number and characteristics
of buffer tanks. Such data are even subject to rapid changes because plant setups are modified. Human
planners have a large reservoir of creative exceptions when it comes to reactions to daily situations on the
production floor, e.g., they use rail cars as buffer tanks, exceed the capacity for a short time, persuade
customers to take the ordered material somewhat earlier or later, or negotiate with customers to take a
larger or smaller quantity of the material.
Online scheduling, or dispatching, as a special case of (combinatorial) online optimization (cf. Borodin and
El-Yaniv (1998)), makes decisions based on past events and current data without any information about
future events that are relevant for the current decision problem. Many decisions have to be made before
all data are available and decisions once made cannot be changed. Online scheduling may involve current
process control data, updated demand data and orders, but misses orders which may enter the system in
the near future. However, those orders fall within the planning horizon for which the current schedule is
to be determined. The goal is to exploit uncertain (with regard to the future) and incomplete information
in such a way to improve the schedules’ overall performance, i.e., the quality of schedules over rolling time
horizons. In contrast to stochastic optimization, where known data are subject to stochastic uncertainties,
the uncertainty in online scheduling only arises from the uncertainty of future data.
For BASF’s offline or online scheduling problems the following structural elements are typical:
1. multi-purpose (multi-product, multi-mode) reactors,
2. sequence-dependent setup times and cleaning cost,
12 Robert Blackburn et al.
3. combined divergent, convergent and cyclic material flows,
4. non-preemptive processes (no interruption), buffer times,
5. multi-stage, continuous, campaign & batch production using shared intermediates,
6. multi-component flow and nonlinear blending,
7. finite intermediate storage, dedicated and variable tanks.
Structurally, these features often lead to allocation and sequencing problems (cf. Kallrath and Wilson
(1997)), knapsack structures (cf. Martello and Toth (1990)), or even to the pooling problem (cf. Fieldhouse
(1993)). In strategic or tactical planning problems we prefer time-indexed models using a relatively coarse
discretization of time, e.g., a year, quarters, months or weeks are usually accurate enough.
In scheduling problems, the focus on time is more detailed, and continuous time formulations (cf. Janak et al.
(2006a)) are often preferable. Furthermore, we face (conflicting) goals that need to be aligned rather than
a simple objective such as profit maximization: the optimal use of resources, minimal makespan, minimal
operating cost or maximum profit versus more qualitative goals such as reliability (meet demand in time,
proper quality, etc.) and robustness; such qualitative goals are often hard to quantify. It is common that
the possibility to interact and to re-schedule, as well as the stability of solutions in case of re-scheduling are
highly appreciated. Due to their complexity and special characteristics, scheduling problems often call for
dedicated model formulations and specialized solution algorithms.
In this operational decision section we only describe one decision problem in detail: A scheduling problem
which contains most of the features mentioned above. Afterwards, we outline a couple of challenges specific
to the process industry that call for future research.
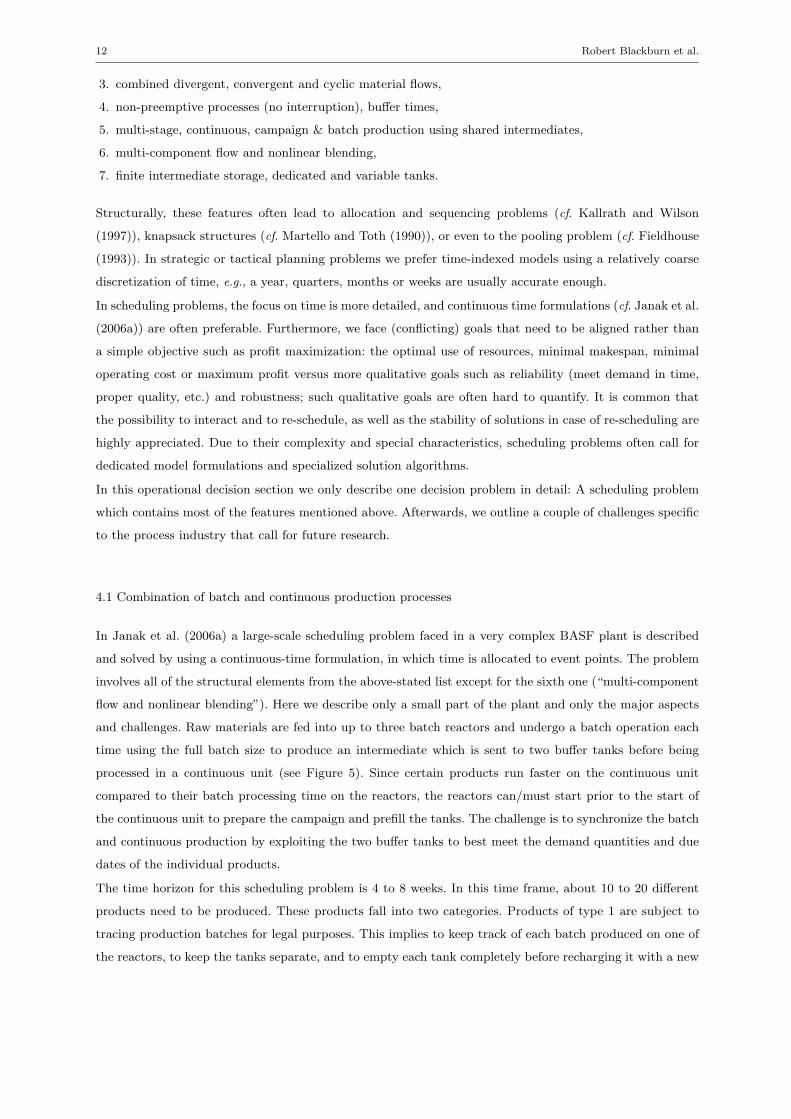
4.1 Combination of batch and continuous production processes
In Janak et al. (2006a) a large-scale scheduling problem faced in a very complex BASF plant is described
and solved by using a continuous-time formulation, in which time is allocated to event points. The problem
involves all of the structural elements from the above-stated list except for the sixth one (“multi-component
flow and nonlinear blending”). Here we describe only a small part of the plant and only the major aspects
and challenges. Raw materials are fed into up to three batch reactors and undergo a batch operation each
time using the full batch size to produce an intermediate which is sent to two buffer tanks before being
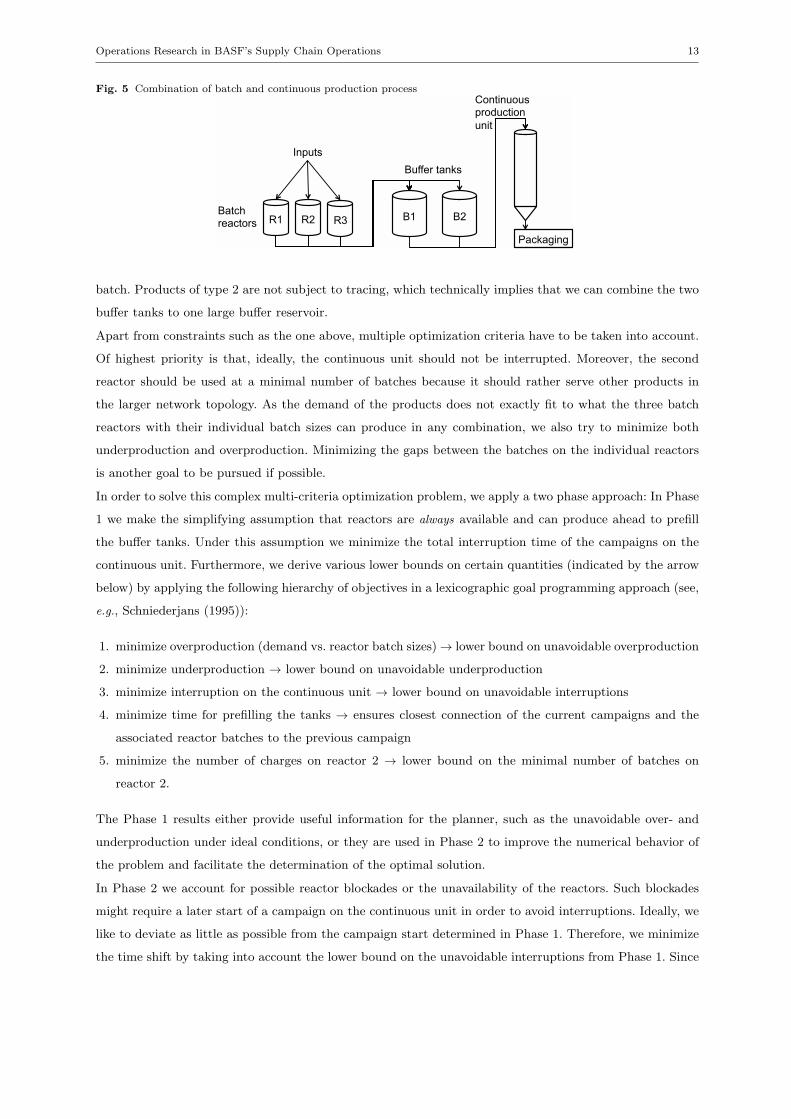
processed in a continuous unit (see Figure 5). Since certain products run faster on the continuous unit
compared to their batch processing time on the reactors, the reactors can/must start prior to the start of
the continuous unit to prepare the campaign and prefill the tanks. The challenge is to synchronize the batch
and continuous production by exploiting the two buffer tanks to best meet the demand quantities and due
dates of the individual products.
The time horizon for this scheduling problem is 4 to 8 weeks. In this time frame, about 10 to 20 different
products need to be produced. These products fall into two categories. Products of type 1 are subject to
tracing production batches for legal purposes. This implies to keep track of each batch produced on one of
the reactors, to keep the tanks separate, and to empty each tank completely before recharging it with a new
Operations Research in BASF’s Supply Chain Operations 13
Fig. 5 Combination of batch and continuous production process
R1 R2 R3 Batch reactors
B1 B2
Buffer tanks
Continuous production
unit
Inputs
Packaging
batch. Products of type 2 are not subject to tracing, which technically implies that we can combine the two
buffer tanks to one large buffer reservoir.
Apart from constraints such as the one above, multiple optimization criteria have to be taken into account.
Of highest priority is that, ideally, the continuous unit should not be interrupted. Moreover, the second
reactor should be used at a minimal number of batches because it should rather serve other products in
the larger network topology. As the demand of the products does not exactly fit to what the three batch
reactors with their individual batch sizes can produce in any combination, we also try to minimize both
underproduction and overproduction. Minimizing the gaps between the batches on the individual reactors
is another goal to be pursued if possible.
In order to solve this complex multi-criteria optimization problem, we apply a two phase approach: In Phase
1 we make the simplifying assumption that reactors are always available and can produce ahead to prefill
the buffer tanks. Under this assumption we minimize the total interruption time of the campaigns on the
continuous unit. Furthermore, we derive various lower bounds on certain quantities (indicated by the arrow
below) by applying the following hierarchy of objectives in a lexicographic goal programming approach (see,
e.g., Schniederjans (1995)):
1. minimize overproduction (demand vs. reactor batch sizes) → lower bound on unavoidable overproduction
2. minimize underproduction → lower bound on unavoidable underproduction
3. minimize interruption on the continuous unit → lower bound on unavoidable interruptions
4. minimize time for prefilling the tanks → ensures closest connection of the current campaigns and the
associated reactor batches to the previous campaign
5. minimize the number of charges on reactor 2 → lower bound on the minimal number of batches on
reactor 2.
The Phase 1 results either provide useful information for the planner, such as the unavoidable over- and
underproduction under ideal conditions, or they are used in Phase 2 to improve the numerical behavior of
the problem and facilitate the determination of the optimal solution.
In Phase 2 we account for possible reactor blockades or the unavailability of the reactors. Such blockades
might require a later start of a campaign on the continuous unit in order to avoid interruptions. Ideally, we
like to deviate as little as possible from the campaign start determined in Phase 1. Therefore, we minimize
the time shift by taking into account the lower bound on the unavoidable interruptions from Phase 1. Since
14 Robert Blackburn et al.
we are also interested in dense production schedules on the batch reactors we minmize the finishing time
of the reactor finishing last, which ensures exactly this. Finally, we also minimize the number of batches on
reactor 2 and overproduction under these new conditions. Overall, the hierarchy of objectives in Phase 2
can be summarized as:
1. minimize time shifts of the campaigns
2. minimize finishing time of the reactor finishing last
3. minimze number of batches on reactor 2
4. minimze overproduction.
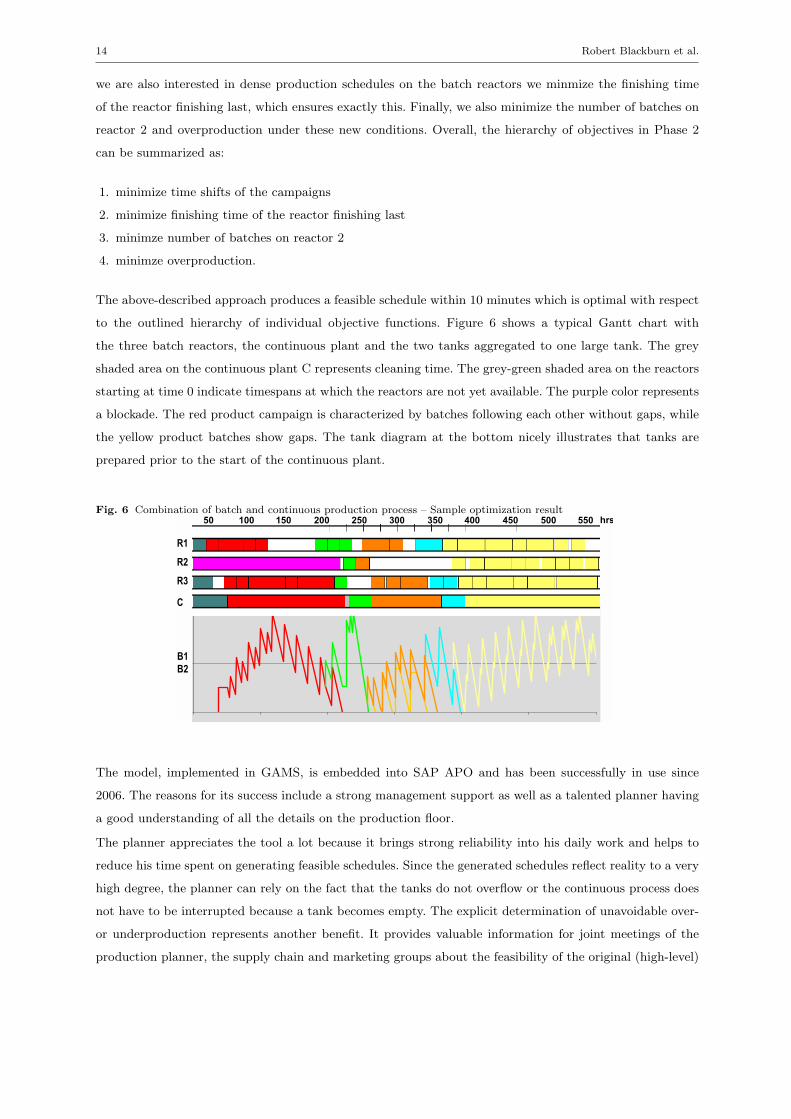
The above-described approach produces a feasible schedule within 10 minutes which is optimal with respect
to the outlined hierarchy of individual objective functions. Figure 6 shows a typical Gantt chart with
the three batch reactors, the continuous plant and the two tanks aggregated to one large tank. The grey
shaded area on the continuous plant C represents cleaning time. The grey-green shaded area on the reactors
starting at time 0 indicate timespans at which the reactors are not yet available. The purple color represents
a blockade. The red product campaign is characterized by batches following each other without gaps, while
the yellow product batches show gaps. The tank diagram at the bottom nicely illustrates that tanks are
prepared prior to the start of the continuous plant.
Fig. 6 Combination of batch and continuous production process – Sample optimization result
0
17
34
R1
R2
R3
500 400 300 200 100 550 450 350 250 150 50 hrs
C
B1
B2
The model, implemented in GAMS, is embedded into SAP APO and has been successfully in use since
2006. The reasons for its success include a strong management support as well as a talented planner having
a good understanding of all the details on the production floor.
The planner appreciates the tool a lot because it brings strong reliability into his daily work and helps to
reduce his time spent on generating feasible schedules. Since the generated schedules reflect reality to a very
high degree, the planner can rely on the fact that the tanks do not overflow or the continuous process does
not have to be interrupted because a tank becomes empty. The explicit determination of unavoidable over-
or underproduction represents another benefit. It provides valuable information for joint meetings of the
production planner, the supply chain and marketing groups about the feasibility of the original (high-level)
Operations Research in BASF’s Supply Chain Operations 15
plans created by those groups. Last but not least, the financial benefit of about 1-2 million e per year due
to smoother operations and a better utilization of the production assets is highly appreciated.
4.2 Future research
Particularly in the area of detailed scheduling, we experience many special aspects of the process industry –
a rich world requiring many detailed features to be considered. Modeling scheduling problems is a challenge
in itself. In the first place, it would be an important research task to develop a modeling language that is
appropriate to describe scheduling problems. Similar to algebraic modeling languages, which use the key objects
variables, constraints and objective functions, and are thus ideal to implement mathematical optimization
problems, the development of a scheduling language would be required that maps the key objects units,
resources, states, tasks, network topology, logical relations, etc. and goal criteria to an appropriate mathematical
structure, e.g., mathematical optimization or constraint programming representations.
Structurally, scheduling problems are often multi-criteria optimization, where most of the objectives are hard
to quantify, or feasibility problems rather than profit maximization problems. Plants are usually designed for
producing a particular product portfolio, for which they are equipped with sufficient extra buffer capacity.
As long as they smoothly produce this portfolio the potential for financial improvements appears limited.
The only advantage in that scenario is that a mathematical optimization approach generates a reliable and
feasible schedule independent of the individual who triggers the optimization. That means, production plans
of similar quality are produced independent of a specific planner. Once the product portfolio is altered or
even the plant setup itself is modified, the situation changes completely. For instance, the capacity of a
plant might no longer be sufficient. Therefore, one runs into infeasibilities when trying to create a schedule.
The solution approaches found in the literature are:
– exact and deterministic methods such as mathematical optimization including MILP and MINLP, graph
theory (GT, cf. Krumke and Noltemeier (2009)) or constraint programming (CP, cf. Apt (2009)), or
hybrid approaches in which MILP and CP are integrated,
– meta-heuristics (evolutionary strategies, tabu search, simulated annealing, ....) as described, for instance,
in Michaelewicz and Fogel (2000), or
– a combination of the former two types; that falls into the class of polylithic modeling and solution
approaches.
Exact and deterministic methods, or polylithic approaches are preferable, because only they allow us to
derive and prove unavoidable violations of constraints. Knowing that something is not possible can be
of great help. Therefore, the challenge is still to derive exact methods for real- world large-scale scheduling
problems.
16 Robert Blackburn et al.
5 Lessons learned
5.1 Benefits of OR in SCM
As the above-mentioned examples illustrate, OR can deliver great value in the area of SCM not only at
BASF, but also in general. Besides the obvious monetary benefits, this primarily includes:
– A better understanding of real-world problems is generated.
– Transparency is created between various stakeholders who affect and are affected by the problem under
consideration.
– Stronger confidence in decisions is created by basing them on a quantitative model analysis and by
involving all stakeholders in the model-building process.
– A competitive advantage can be gained.
Due to the complex nature of the decision problems in the process industry, caused by the various special
characteristics outlined above, simple solutions using either standard Excel functionality or standard APS
models only are often insufficient. Most of the time, more advanced OR methods are required.
5.2 Challenges
In order to be able to unleash the potential of OR in SCM certain prerequisites have to be fulfilled and
sometimes obstacles need to be overcome.
5.2.1 Different views
In larger companies SCM often follows strict hierarchical and organizational structures and thinks in terms
of processes. OR, at least in its mathematical programming branch, per se focusses on the decision problem
to be solved in the first place and does not care about such “artificial” constructs. Depending on the problem,
it might affect several parts and responsibilities of the SCM organization. This also refers to the ownership
of the required data that enter the OR model.
Concerning data one also encounters further difficulties. Data quality is one of them. There is often no
common understanding across the various business units about the information to enter in specific data
fields. Many times data fields are misused either intentionally or unintentionally. It is an important task
of the SCM organization to create a common understanding. One facilitator in this respect can be the
exposition of the clear value of an improved data quality, e.g., by pointing out the value of OR solutions
that inevitably rely on such data.
Data structures represent another difficulty. The way in which data are collected, aggregated, and stored is
often not ideal or insufficient for usage in an appropriate mathematical decision problem. For instance, in
the area of supply network planning, the demand in a period gets allocated directly to specific production
sites/plants according to a predefined allocation fraction without considering the actual capacity and cost
situtation at the individual plants. Only these allocated demand quantities are stored in the system and
Operations Research in BASF’s Supply Chain Operations 17
thus available for optimization later on. However, this allocation step itself represents an optimization
problem. Another example refers to the desired customer quantity and due date. Oftentimes, not the actually
requested quantity and date is entered into the system, but an adjusted quantity and/or a modified date.
These tweaked numbers better fit the current product availability and are still acceptable for the customer
(after some negotiations). For planning purposes the original numbers would be highly valuable, however.
Therefore, it is wise to include an OR expert in the definition phase of processes and data structures, even
if the direct need might not be apparent to everyone at an early stage. Modifying inappropriate structures
from an OR perspective in retrospect is much more costly or even impossible. The advances in IT can also
help alleviate the data challenges. Storage space nowadays comes at a very low cost. Coupled with the
switch of a company’s IT databases to in-memory technologies, which represents an opportunity for making
necessary adjustments to the data structures from an OR point of view as well, the granularity problem or
excessive access times for getting the right data out of the system might diminish in the future.
5.2.2 Standard and tailor-made solutions
In the area of SCM there are a lot of complex tasks to conduct, especially within large companies. In
order to help manage this complexity and avoid a proliferation of individual solutions SCM organizations
tend to define and strive for standards. While this might contain costs on the IT side in terms of lower
maintenance, such a strategy also bears the risk of generating additional (and unnecessary) costs elsewhere
in the businesses. For instance, if the standard approach does not model the real-world problem at an
appropriate level of detail and consider all relevant aspects, it produces solutions with too large safety
buffers or solutions which violate various constraints such as service level, capacity bounds which makes it
inferior even to manual or intuitive planning results. For sure, this is a difficult trade-off to solve. While
IT considerations should definitely play an important role in this, they should not be the dominating or
sole decisive factor. After all, IT should act as a supporting function for the businesses, not as a limiting
one. That is why at BASF the “Information Services & Supply Chain Operations” division strives towards
tailoring their innovative, differentiated solutions to meet the business needs.
A standard or basic solution is definitely a good starting point. However, it should not be defined too nar-
rowly or be inflexible. Having a standard (ERP) system/platform for storing and exchanging data between
different interconnected businesses within the company is indispensable and a good basis for OR solutions
(keeping in mind the above-mentioned obstacles that might have to be overcome with regard to data). In
order to exploit the potential of OR to its fullest, especially in the area of planning support, this stan-
dard system, be it an ERP system or an APS, should allow for sufficient flexibility to plug in tailor-made
solutions, if the readily available functionalities are not appropriate.
The detailed scheduling problem in Section 4.1 represents a good example for an application at the op-
erational decision support level that calls for such a tailor-made solution. Instead of resorting to penalty
techniques to reduce underproduction and delays, the solution explicitly computes and reports unavoidable
underproduction and delays using the goal programming techniques. The reason and advantage of this ap-
18 Robert Blackburn et al.
proach over standard ones is that penalty terms in the standard model may lead to numerical problems and
deliver solutions that are inferior and incomprehensible; cf. Kallrath and Maindl (2006), pp. 344.
The “water Verbund optimization” and “rail car fleet design” problems are highly beneficial tailor-made
counterparts to the detailed scheduling problem in the strategic decision problem domain. In this domain,
we also see that there definitely exist applications where a standard approach and tool can make sense: for
instance, the “strategic distribution network optimization” problem. It is important to note in this context
that, even though the chosen tool “CAST” initially had some shortcomings in modeling certain special
characteristics of the BASF business, the provider was flexible in adjusting and extending the OR model
according to these needs in a very short time. Thus, it could be achieved that the “standard” covers most
of the relevant decision problem aspects and is appropriate. This state could only be reached, however,
through the exchange of OR experts on the side of BASF and the solution provider.
In the area of APS some of the existing providers offer limited flexibility and only insufficient or complicated
interfaces to mitigate potential shortcomings in their systems. One important decision problem domain that
they address is the tactical one, e.g., mid-term production planning. Are those systems appropriate for this
task despite their inflexibilities?
In general, if a system does not offer easily usable interfaces and thus is inflexible, the buyer and user
of such a system has to make sure that (i) the available model in this system covers all relevant aspects
encountered in practice and (ii) the available solution algorithms are always up-to-date. With respect to (i)
we know from our own experience that the formulation of a generally applicable model is nearly impossible.
Kallrath and Maindl (2006) (Chapter 8) formulate a rather general model which contains most features of
production planning and distribution planning one encounters in the process industry. However, there are
still certain aspects that this model does not cover as recent projects conducted by the first author show.
Therefore, the application of such a standard APS model in a company requires a good understanding of
those aspects that are considered in the tool, on the one hand, and those aspects that are truly relevant
from a business point of view, on the other hand. Only if there is a match between those two sides, is the
system solution appropriate.
With respect to (ii), the algorithmic part of the solution, the developments move at a high pace. Some of
those developments are driven by commercial providers, e.g. when it comes to solvers such as CPLEX, Gurobi
or Xpress. Others are driven more heavily by the scientific community. The latter makes it challenging for
a commercial solution provider to keep up when it comes to integrating the latest developments into its
solution. By neglecting those developments a company might forgo considerable saving potentials, however.
A good example is “R”, a free software environment for statistical computing and graphics (cf. http://www.r-
project.org/; accessed on 6/3/2014). Due to its special open source setup the entire “R” community acts as
developers and provides the latest developments to the others. Commercial software providers in this area
struggle heavily in offering similar functionalities.
In both respects, one can try to push the provider to upgrade its standard. This might take some time,
however. Alternatively, one can ensure that the “standard” tool offers flexible interfaces that allow for the
extension by tailor-made solutions through the exploitation of the available in-house OR expertise. By
making use of the latest technologies, those solutions provide benefits to the businesses that the standard

Operations Research in BASF’s Supply Chain Operations 19
cannot deliver – at least not in the short term. Trimming a real-world decision problem such that it fits the
“standard” is most likely a high price to pay in terms of the resulting solution quality. In the end, there is
the risk of losing the overall trust in such IT solutions.
The challenging and critical task certainly refers to the assessment of the appropriateness of the standard
models and tools for the concrete business setting. The misfit might be evident and therefore easily detectable
by anybody or it might be rather subtle and thus require special OR knowledge. Criteria of interest when
making a decision about a standard vs. a tailor-made solution are, amongst others:
1. What is the purpose of the model?
2. How well suited is the standard (APS) model? Does it fit the reality or is it necessary to change the
reality and what are the consequences for the solution quality? Can the standard model be extended, if
necessary?
3. What are the costs?
4. What is the value of having a transparent tailor-made in-house model versus a black box model, for
instance, a standard APS?
5. What should be the life-time of the model and do we expect modified requests towards the model over
the years? (The up-front investment might be significant but can easily pay off over the years if more
requests have to be served.)
The overall task actually calls for a joint effort and close collaboration between three parties as equal
partners:
1. SCM experts for process knowledge and coordination
2. OR experts for bringing together the business requirements with the appropriate methods
3. IT experts for providing the required data, interfaces, and implementation.
The collection of the business requirements should be jointly done by SCM and OR experts, because in this
phase one needs to distinguish relevant from irrelevant aspects already – from a supply chain point of view,
but also from an OR solution perspective.
SCM and IT experts are usually available within every company. OR experts, on the other hand, are not that
common in companies. (Anglo-American companies might be the exception here.) So, the natural question
arises: Does it pay off to have an in-house OR unit?
5.2.3 The value of in-house OR experts
Since decision-making is expected to become more and more data-driven in the future (see Waller and
Fawcett (2013)), in-house OR experts or data scientists as they are also sometimes called can bring con-
siderable value to the table. On the one hand, the above-mentioned examples clearly show that, with a
relatively small investment (in OR resources and IT), oftentimes large saving potentials can be identified
and eventually realized. On the other hand, internal OR knowledge is also valuable in the decision-making
process concerning outside (out-of-the-box) solutions. In particular, in the current wave associated with
20 Robert Blackburn et al.
the buzzword “Big Data” a lot of (consulting) companies market their solutions by promising enormous
improvements.
In-house experts take an unbiased view of the methods and technologies, act in the interest of the company,
and thus can help to really separate the wheat from the chaff. Oftentimes external companies focus on one
specific method that might work well in one particular business context, but not in another. By having a
broad methodological toolset at hand, thorough application expertise as well as further company-internal
knowledge, in-house OR experts can help determine the appropriateness of commerical solution. They can
provide valuable support in conducting necessary tests (“proof of concepts”) to arrive at a reliable result
and assess the true value of such a solution for the entire company.
Since no model/tool can ever cover all possible real-world aspects, part of this value also refers to the tool’s
flexibility. A flexible commercial solution can be used as the basis and thus “standard”, to which tailor-made
variants are attached by the in-house OR experts, if the need arises. The flexibility and openness of the
tool needs to be assessed in the selection process. Through such a setup one can combine the strengths of
a commercial “standard” solution in one area with dedicated solutions for specific business requirements
developed by the in-house team. Thus, prompt responses to new business requests can be delivered as well.
Moreover, the latest scientific developments with respect to models and algorithms can be exploited to
generate value for the company. There is no need for waiting until the commercial tool provider enhances
the solution in this direction.
6 Conclusions
In this article we have highlighted the application of operations research (OR) at BASF in the area of supply
chain management (SCM) through the use of selected strategic, tactical or operational examples. Besides
annual cost savings ranging between several hundred thousand and several million e, the project partners
appreciate the transparency and quantitative decision basis obtained through the developed models as a
great value of the mathematical optimization approach.
From our experience, the special characteristics encountered in the process industry often call for a mod-
ification or enhancement of “standard” OR models and might hamper the direct use of readily available
commercial software solutions. This refers to basically all decision-making time horizons from strategic to
tactical to operational with few exceptions. For this reason it seems worthwhile to ensure that “standard”
solutions and tools offer enough flexibility to extend them by tailor-made models and methods, if required,
in order to generate appropriate and meaningful results for the businesses to support their planning tasks.
The decision about when to deviate from the standard is a complex one, because it involves various aspects
and requires knowledge from different parties: SCM, IT, and OR experts. Therefore, this should be a joint
undertaking.
Even though OR is a facilitator for better decision-making, OR by itself is certainly not sufficient for the
success of a project or solution. From the projects at BASF we know that it takes specialists from all relevant
fields (mathematics, engineering, logistics, procurement, controlling, supply chain management, etc.) to form
an intercultural and interdisciplinary team in order to maximize the project return. Communication across
Operations Research in BASF’s Supply Chain Operations 21
the borders of each project member’s field of expertise is a challenging task. In the end the richness of the
ideas, views and methodologies is key to a project’s success. At BASF, we call this the best team strategy.
Acknowledgement
The authors are grateful for valuable input and suggestions from Anna Schreieck and Jens Schulz from
Scientific Computing, which substantially improved this paper. Furthermore, we would like to thank all the
project partners for their collaboration and input that contributed significantly to the projects’ success.
References
Apt, K., 2009. Principles of Constraint Programming. Cambridge University Press.
Axsater, S., 2003. Evaluation of unidirectional lateral transshipments and substitutions in inventory systems.
European Journal of Operational Research 149l, 438–447.
Blackburn, R., Lurz, K., Priese, B., Gob, R., Darkow, I.-L., 2014. A predictive analytics approach for demand
forecasting in the process industry. Working Paper.
Borodin, A., El-Yaniv, R., 1998. Online Computation and Competitive Analyses. Cambridge University
Press, Cambridge, UK.
Cecere, L., 2013. A Practioner‘s Guide to Demand Planning. Supply Chain Management Review
March/April, 40–46.
Clark, A., Scarf, H., 1960. Optimal policies for a multi-echelon inventory problem. Management Science 6,
475–490.
Fieldhouse, M., 1993. The Pooling Problem. In: Ciriani, T., Leachman, R. C. (Eds.), Optimization in Indus-
try: Mathematical Programming and Modeling Techniques in Practice. John Wiley and Sons, Chichester,
pp. 223–230.
Helber, S., Sahling, F., Schimmelpfeng, K., 2013. Dynamic capacitated lot sizing with random demand and
dynamic safety stocks. OR Spectrum 35, 75–105.
Janak, S. L., Floudas, C. A., Kallrath, J., Vormbrock, N., 2006a. Production Scheduling of a Large-Scale In-
dustrial Batch Plant: I. Short-Term and Medium-Term Scheduling. Industrial and Engineering Chemistry
Research 45, 8234–8252.
Kallrath, J., 1999. Mixed-Integer Nonlinear Programming Applications. In: Ciriani, T. A., Gliozzi, S., John-
son, E. L., Tadei, R. (Eds.), Operational Research in Industry. Macmillan, Houndmills, Basingstoke, UK,
pp. 42–76.
Kallrath, J., 2011. Polylithic Modeling and Solution Approaches Using Algebraic Modeling Systems. Opti-
mization Letters 5, 453–466.
Kallrath, J., Maindl, T. I., 2006. Real Optimization with SAP-APO. Springer, Heidelberg, Germany.
Kallrath, J., Wilson, J. M., 1997. Business Optimisation Using Mathematical Programming. Macmillan,
Houndmills, Basingstoke, UK.
22 Robert Blackburn et al.
Klosterhalfen, S., Kallrath, J., Fischer, G., 2013. Rail car fleet design: Optimization of structure and size.
International Journal of Production Economics in print.
Klosterhalfen, S. T., Holzhauer, F., Fleischmann, M., 2014. Inventory control of a continuous production
inventory system with production quantity restrictions. Working Paper.
Krumke, S., Noltemeier, H., 2009. Graphentheoretische Konzepte und Algorithmen. Leitfaden der Infor-
matik. Vieweg + Teubner, Wiesbaden, Germany.
Martello, S., Toth, P., 1990. Knapsack Problem. Wiley & Sons, New York.
McAfee, A., Brynjolfsson, E., 2012. Big Data: The Management Revolution. Harvard Business Review 90,
60–68.
Michaelewicz, Z., Fogel, D. B., 2000. How to Solve It: Modern Heuristics. Springer, Berlin.
Olsson, F., 2010. An inventory model with unidirectional lateral transshipments. European Journal of Op-
erational Research 200, 725–732.
Rebennack, S., Kallrath, J., Pardalos, P. M., 2009. Column Enumeration based Decomposition Techniques
for a Class of Non-Convex MINLP Problems. Journal of Global Optimization in press.
Schniederjans, M. J., 1995. Goal Programming: Methodology and Applications. Kluwer Academic Publish-
ers, Boston, MA.
Sgall, J., 1998. On-line Scheduling. In: Fiat, A., Woeginger, G. J. (Eds.), Online Algorithms. Springer Verlag,
Berlin, pp. 196–231.
Simpson, K., 1958. In-process inventories. Operations Research 6, 863–873.
Stiehm, J., Townsend, N., 2002. The U.S. Army War College: Military Education in a Democracy. Temple
University Press.
Tempelmeier, H., 2011. A column generation heuristic for dynamic capacitated lot sizing with random
demand under a fill rate constraint. Omega 39, 627–633.
Tempelmeier, H., Herpers, S., 2010. ABCβ – a heuristic for dynamic capacitated lot sizing with random
demand under a fillrate constraint. International Journal of Production Research 48, 5181–5193.
Waller, M. A., Fawcett, S. E., 2013. Data Science, Predictive Analytics, and Big Data: A Revolution That
Will Transform Supply Chain Design and Management. Journal of Business Logistics 34(2), 77–84.
Wolf, D., 2007. Prepared and Resolved: The Strategic Agenda for Growth, Performance and Change. dsb
Publishing.