Embed Size (px)
Citation preview
VMTurbo Operations Manager 5.4Users Guide
VMTurbo, Inc.
500 Boylston St, 8th floorBoston, MA 02116 USAPhone: (866) 634 5087www.vmturbo.com

ii VMTurbo, Inc. www.vmturbo.com
COPYRIGHT
Copyright© VMTurbo 2010 — 2016, all rights reserved
END-USER LICENSE AGREEMENT
http://www.vmturbo.com/terms-of-use/
Users Guide iii
Table of Contents
What's New 9
Introducing Operations Manager 11How Operations Manager Works 11
The Desired State 12The Market and Virtual Currency 13The Economic Scheduling Engine 13The Operations Manager Supply Chain 14
Operations Manager Host Requirements 15Operations Manager Targets 16
Hypervisors 17Cloud Managers 17Application Servers 18Database Servers 18Load Balancers 18Storage Managers 19Fabric Managers 19Operations Manager Servers as Targets 20
Operations Manager Actions 20Provision 20Decommission 21Place 21(Re) Configure 22Actions Summary 22
Resource Descriptions 24
Operations Manager Editions and Control Modules 27Operations Manager 27
Associated Targets 28Use Cases 28
Virtual Health Monitor 29Associated Targets 29Use Cases 30
Application Control Module 30Load Balancers 31Application Servers 31Database Servers 33Associated Targets 33Use Cases 34
Cloud Control Module 34Microsoft VMM and SMB3 Storage Shares 35Associated Targets 35Use Cases 35
Hybrid Cloud Control Module 35Associated Targets 36Use Cases 36Requirements 36
iv VMTurbo, Inc. www.vmturbo.com
Storage Control Module 37Associated Targets 37Use Cases 37
Fabric Control Module 38Associated Targets 38Use Cases 38
Network Control Module 38Actions 40Associated Targets 40Use Cases 40Requirements 40
Container Control Module 40Actions 41Associated Targets 41Use Cases 41Requirements 41
VDI Control Module 41Use Cases 42Requirements 42
The Operations Manager User Interface 43Menu Bar 44
Deleting, Adding, and Arranging Menu Buttons 45Tool Bar 46
The Settings Menu 46Fly-out Panels 47
Setting Fly-out Panel Location 48Navigation Tree Hierarchies 49
Resource Icons 50Notifications Bar 51Standard Panel Controls 52
Tooltips 53Chart Legend Pulldowns 54Chart Display Radio Buttons 55Maximize/Minimize 55Export to XML 55Customize Panel 56
Information Panels 59Utilization Charts 59Dashboard Panels 60Show Top or Bottom Items in Chart 62
Viewing Entity Constraints 64Inspecting Available Providers 67Inspecting Consumers 67
Utilization History 68
To Do Lists - Maintaining QoS 70Viewing Recommended Actions 71
Viewing Action Details 73Executing Recommended Actions 74Viewing Risks and Efficiency Opportunities 76
Users Guide v
Action Categories 77Prevention 77Performance Assurance 78Compliance 78Efficiency Improvement 79
Examples of Risks and Actions 79Critical Over-Utilization 79Low Utilization 80Mis-configured VMs 80Mis-configured Infrastructure 80
Logging In to Operations Manager 81
The Dashboards View 82Generating Reports From the Dashboard View 83Setting Dashboard Scope 84Standard Dashboards 85
Assure Service Performance 86Improve Overall Efficiency 90Project Cluster Resources 94Monthly Summary 98Cluster Capacity 99Impact Summary 103Optimize Summary 105Supply and Demand 107QoS 109
Custom Dashboards 111Scoping Standard Dashboards 111Building Custom Dashboards 113
Editing Dashboards 116Change Dashboard Layout 116Change Panel Properties 117
Sharing Custom Dashboards 117
The Supply Chain View 119Choosing an Entity to View 121Viewing Related Entities 121Browsing Supply Chain Entities 122Setting Supply Chain Scope 123Supply Chain Entities 124
Supply Chain - Virtual Application 127Supply Chain - Application 128Supply Chain - Virtual Machine 131Supply Chain - Physical Machine 133Supply Chain - Storage 135Supply Chain - Disk Array 137Supply Chain - Storage Controller 139Supply Chain - IO Module 141Supply Chain - Fabric Interconnect 142Supply Chain - Chassis 143Supply Chain - Domain 144Supply Chain - Datacenter 145Supply Chain - Provider Virtual Datacenter 146
vi VMTurbo, Inc. www.vmturbo.com
Supply Chain - Consumer Virtual Datacenter 148Supply Chain - VPod 150Supply Chain - DPod 152Supply Chain - Zone 153Supply Chain - Region 155
The Workload View 157The Workload Chart 158
Inspecting Chart Data 159Controlling Workload Chart Display 161
Setting Display of Demand and Supply 161Setting Severity and Scale 161
Setting Workload View Scope 162
The Deploy View 163Creating Reservations 164
Defining a Reservation 165Requesting a Reservation 166Accepting a Reservation 167
Active Reservations 168Reservation Details 169Placement Calculations 171
Future Reservations 172Deploying VMs 172
Manually Deploying an Active Reservation 173Deploying VMs Today 173
Creating and Editing Templates 174Creating VM Templates 175Creating Deployment Profiles 176Discovered Deployment Data 176
The Plan View 178Use Cases 179
Increasing Virtual Load under Existing Constraints 180Decommission a Cluster or Datacenter 184
Running Plans 188Running a Plan on the Current Environment 190
Plan Setup 192Setting Plan Scope 193Enabling Projection 196Specifying the Plan Resources 197Setting the Plan Baseline 207Setting Advanced Options 212
Plan Results 217One-time Plan Results 218Projection Plan Results 221
The Inventory View 224Inventory Charts 225The Inventory Flyout Panel 225Virtual Applications 227
Users Guide vii
Applications 229Guest Load 232Application Servers 233Database Servers 234
Containers 235Virtual Machines 236Physical Machines 240Storage 244Disk Arrays 247Storage Controllers 251Fabric Interconnects 254Chassis 257IO Modules 260VPods 263DPods 265Datacenters 268Provider Virtual Datacenters 270Consumer Virtual Datacenters 274
The Admin View 277User Authentication Configuration 277
Creating User and Group Accounts 278User Authentication 280Account Privileges 282Account Scope 284
Target Configuration 285Adding and Removing Target Virtual Management Servers 287Adding Hypervisors as Targets 289Adding Cloud Management Targets 293Adding PaaS Managers as Targets 299Adding Application Servers as Targets 300Adding Database Servers as Targets 303Adding Windows® Applications as Targets 305Adding Load Balancers as Targets 306Adding Application Container Targets 307Adding Storage Managers as Targets 307Adding Network Flow Targets 310Adding Fabric Managers as Targets 311Adding Operations Manager Targets for Aggregation 313
License Configuration 314Maintenance 315
Proactive Support 316HTTP Proxy 316SMTP Relay 317Export State 317Software Updates 317Server Start Time 318Configuration Files 318Logging Levels 318
Extra Configuration Tasks 319Operations Manager Backup Procedures 319Configuring Management Continuity 323P2V - Planning Migration from Physical to Virtual 329Custom Branding of Operations Manager 332
viii VMTurbo, Inc. www.vmturbo.com
The Policy View 336Policy Scope 337
Global Settings 337Group Overrides 338
Policy Categories 341Group Management 342Workload Placement Segments 347Analysis 354Action Modes 364Application Priority 377Discovery Policies 379Infrastructure Cost 386Cluster Capacity Configuration 390Email and Trap Notification 391Retention Configuration 394General Settings 394
The Reports View 395Viewing Reports 396
Viewing an Up-To-The-Minute Report 396Viewing Scheduled Reports 397
Scheduling Reports 397Managing Subscriptions 399Custom Reports from Views 399Custom SQL Reports 400
Aggregated Operations Manager Installations 402Operations Manager Versions and Aggregation 403Aggregated User Accounts and Login 403
Active Directory Authentication 403Aggregation Details 404Configuring Aggregation 405
Users Guide 9
What's New
This release of VMTurbo Operations Manager includes the following new features:
• Proactive Customer Support
With this release you can enable Proactive Support. This automatically generates a support ticket if your running Operations Manager server experiences problems. See Maintenance on page 315 for more information.
• Multi-filter Groups
You can now create groups with multiple criteria. For example, you can create a group of all VMs that host a specific application, and that are in a named cluster (see Creating a Group on page 343).
• Dynamic Templates for Cluster Capacity
The Cluster Capacity dashboard uses templates to calculate headroom in your environment’s clusters. With this release, Operations Manager calculates average utilization in the cluster to derive a template that represents workload in the cluster. By using these templates, headroom calculation for each cluster better matches actual workload demands. See Cluster Capacity Configuration on page 390 for more information.
• Action Changes- Cross-vCenter vMotion — For VMware vShpere 6.0, Operations Manager supports vMotion from one vCenter
Server to another (see vCenter Server Targets on page 289).- For integration, this release supports an Action Script that is triggered when a condition clears. For example, if
Operations Manager recommends a VM resize for increased workload demand, that recommendation can trigger an action script with a ticketing system. If workload demand subsequently drops the recommendation will clear, which can trigger a script to remove the request from the ticketing system. For more information, see Action Script Settings on page 375.
• Hypervisor Support
With this release, Operations Manager uses Windows Remote Management with Hyper-V targets, and introduces secure connections.
• Storage Control Module
This release adds support for:- EMC VMAX- EMC XtremeIO all-flash arrays
For more information, see Adding Storage Managers as Targets on page 307.• Application Control Module
This release makes the following improvements to application management:- Microsoft SQL Server — This release adds support for Active Directory authentication when setting a SQL Server
target- Microsoft Exchange — With this release, Operations Manager uses Windows Remote Management with
Microsoft Exchange targets
What's New
10 VMTurbo, Inc. www.vmturbo.com
• Cloud Control Module
This release introduces support for Platform as a Service (PaaS) with Cloud Foundry targets (see Adding CloudStack Servers as Targets on page 293).
• User Interface Changes- Workload View — The Workload chart is improved to show more information about utilization of consumer
resources. In addition, the Workload view has been simplified to make it easier to focus on the most important information (see The Workload View on page 157).
- Plan View — Plan results now include Workload charts as a way to compare the before and after states of the plan (see The Plan View on page 178)
- Dashboard View — This release introduces the Supply and Demand and the QoS dashboards, which show the effect that executed actions have on your environment (see The Dashboards View on page 82).
• Operations Manager SDK
We continue to enhance the SDK. With this release the SDK supports discovery of constraints such as clusters or placement policies.
Users Guide 11
Introducing Operations Manager
Thank you for choosing VMTurbo Operations Manager, the premier solution for intelligent workload management of cloud and virtual environments. Operations Manager maintains your environment within the desired state — operat-ing conditions that achieve the following conflicting goals at the same time:
• Assured application performance
Prevent bottlenecks, provision physical resources, upsize VMs, prioritize workload.• Efficient use of resources
Consolidate workload, downsize VMs, prevent VM sprawl and dormant VMs.
Operations Manager is a server application running on VM that you install on your network. You then assign Virtual Management services running on your network to be Operations Manager targets. Operations Manager discovers the devices each target manages, and then performs analysis, anticipates risks to performance or efficiency, and recom-mends actions you can take to avoid problems before they occur.
How Operations Manager Works
To keep your infrastructure in the desired state, Operations Manager performs Intelligent Workload Management. This is an ongoing process that solves the problem of assuring application performance while simultaneously achiev-ing the most efficient use of resources that is possible.
This is not a simple problem to solve. Intelligent Workload Management has to consider many different resources, numerous control points for each device, and how devices and resources are used in relation to each other. As you add devices to your infrastructure, the factors for each decision increase exponentially. On top of that, the environ-ment is constantly changing — to stay in the desired state, you are constantly trying to hit a moving target.
To perform Intelligent Workload Management, Operations Manager models the environment as a market made up of buyers and sellers. These buyers and sellers make up a supply chain that represents tiers of devices in your inventory.
See the The Supply Chain View on page 119 for a visual layout of the buyer and seller relationships.
Operations Manager uses Virtual Currency to give a budget to buyers and assign cost to resources. This virtual cur-rency assigns value across all tiers of your environment, making it possible to compare the cost of application transac-tions with the cost of space on a disk or physical space in a data center.
Introducing Operations Manager
12 VMTurbo, Inc. www.vmturbo.com
The price that a seller charges for a resource changes according to the seller’s supply. As demand increases, prices increase. As prices change, buyers and sellers react. Buyers are free to look for other sellers that offer a better price, and sellers can duplicate themselves (open new storefronts) to meet increasing demand. Operations Manager uses its Economic Scheduling Engine to analyze the market and make these decisions. The effect is an invisible hand that dynamically guides your IT infrastructure to the optimal use of resources.
To get the most out of Operations Manager, you should understand how it models your environment, the kind of anal-ysis it performs, and the desired state it works to achieve.
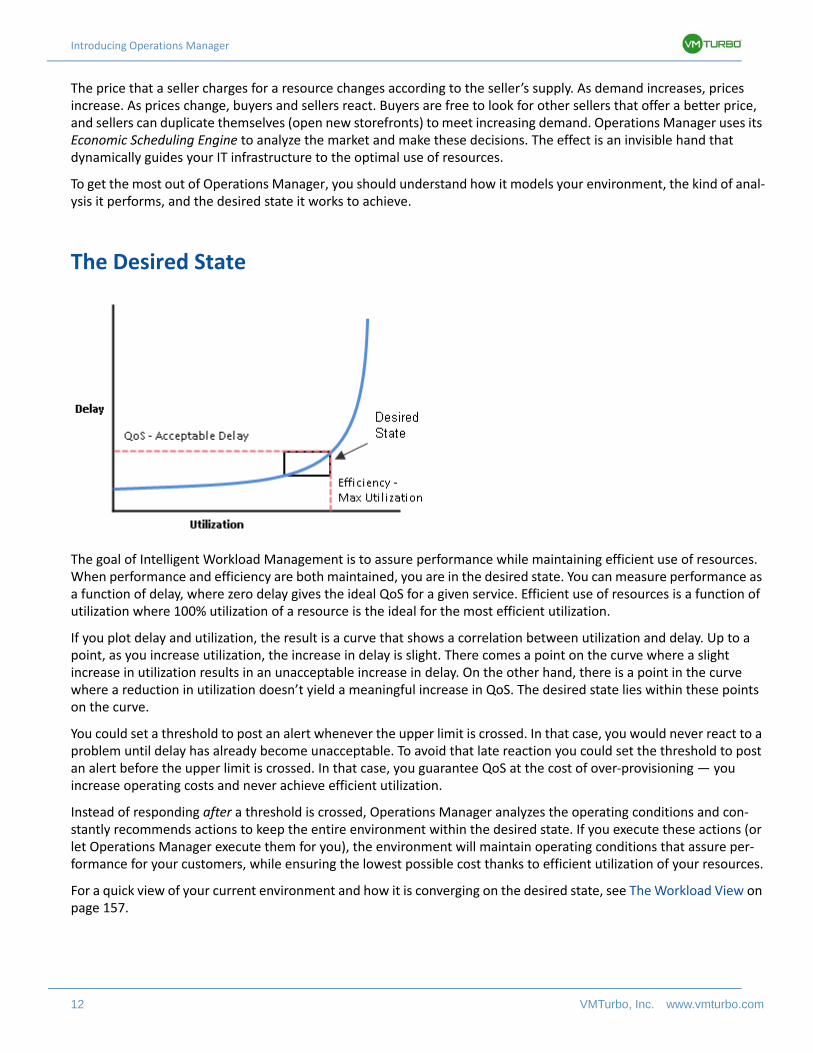
The Desired State
The goal of Intelligent Workload Management is to assure performance while maintaining efficient use of resources. When performance and efficiency are both maintained, you are in the desired state. You can measure performance as a function of delay, where zero delay gives the ideal QoS for a given service. Efficient use of resources is a function of utilization where 100% utilization of a resource is the ideal for the most efficient utilization.
If you plot delay and utilization, the result is a curve that shows a correlation between utilization and delay. Up to a point, as you increase utilization, the increase in delay is slight. There comes a point on the curve where a slight increase in utilization results in an unacceptable increase in delay. On the other hand, there is a point in the curve where a reduction in utilization doesn’t yield a meaningful increase in QoS. The desired state lies within these points on the curve.
You could set a threshold to post an alert whenever the upper limit is crossed. In that case, you would never react to a problem until delay has already become unacceptable. To avoid that late reaction you could set the threshold to post an alert before the upper limit is crossed. In that case, you guarantee QoS at the cost of over-provisioning — you increase operating costs and never achieve efficient utilization.
Instead of responding after a threshold is crossed, Operations Manager analyzes the operating conditions and con-stantly recommends actions to keep the entire environment within the desired state. If you execute these actions (or let Operations Manager execute them for you), the environment will maintain operating conditions that assure per-formance for your customers, while ensuring the lowest possible cost thanks to efficient utilization of your resources.
For a quick view of your current environment and how it is converging on the desired state, see The Workload View on page 157.
How Operations Manager Works
Users Guide 13
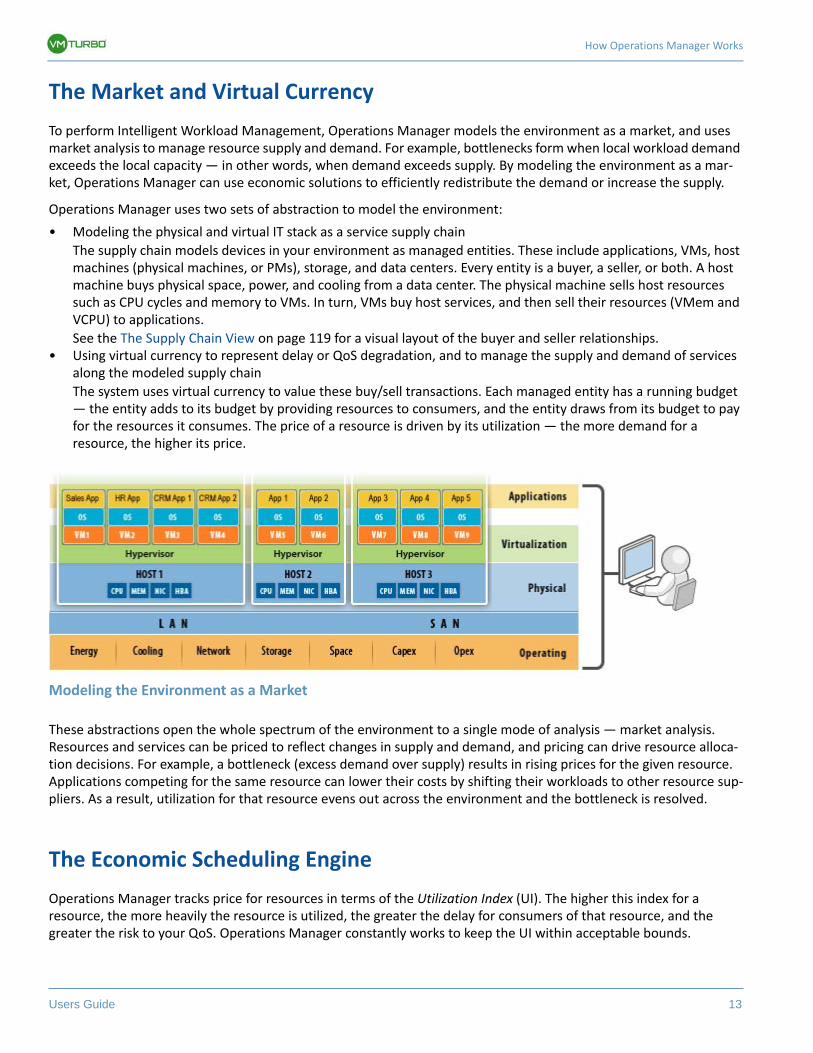
The Market and Virtual Currency
To perform Intelligent Workload Management, Operations Manager models the environment as a market, and uses market analysis to manage resource supply and demand. For example, bottlenecks form when local workload demand exceeds the local capacity — in other words, when demand exceeds supply. By modeling the environment as a mar-ket, Operations Manager can use economic solutions to efficiently redistribute the demand or increase the supply.
Operations Manager uses two sets of abstraction to model the environment:
• Modeling the physical and virtual IT stack as a service supply chain
The supply chain models devices in your environment as managed entities. These include applications, VMs, host machines (physical machines, or PMs), storage, and data centers. Every entity is a buyer, a seller, or both. A host machine buys physical space, power, and cooling from a data center. The physical machine sells host resources such as CPU cycles and memory to VMs. In turn, VMs buy host services, and then sell their resources (VMem and VCPU) to applications.
See the The Supply Chain View on page 119 for a visual layout of the buyer and seller relationships.• Using virtual currency to represent delay or QoS degradation, and to manage the supply and demand of services
along the modeled supply chain
The system uses virtual currency to value these buy/sell transactions. Each managed entity has a running budget — the entity adds to its budget by providing resources to consumers, and the entity draws from its budget to pay for the resources it consumes. The price of a resource is driven by its utilization — the more demand for a resource, the higher its price.
Modeling the Environment as a Market
These abstractions open the whole spectrum of the environment to a single mode of analysis — market analysis. Resources and services can be priced to reflect changes in supply and demand, and pricing can drive resource alloca-tion decisions. For example, a bottleneck (excess demand over supply) results in rising prices for the given resource. Applications competing for the same resource can lower their costs by shifting their workloads to other resource sup-pliers. As a result, utilization for that resource evens out across the environment and the bottleneck is resolved.
The Economic Scheduling Engine
Operations Manager tracks price for resources in terms of the Utilization Index (UI). The higher this index for a resource, the more heavily the resource is utilized, the greater the delay for consumers of that resource, and the greater the risk to your QoS. Operations Manager constantly works to keep the UI within acceptable bounds.
Introducing Operations Manager
14 VMTurbo, Inc. www.vmturbo.com
You can think of UI as the cost for a resource — Operations Manager works to keep the cost at a competitive level. This is not simply a matter of responding to threshold conditions. Operations Manager analyzes the full range of buyer/seller relationships, and each buyer constantly seeks out the most economical transaction that is available.
This last point is crucial to understanding Operations Manager. The virtual environment is dynamic, with constant changes to workload that correspond with the varying requests your customers make of your applications and ser-vices. By examining each buyer/seller relationship, the Economic Scheduling Engine arrives at the optimal workload distribution for the current state of the environment. In this way, Operations Manager constantly drives your environ-ment toward the desired state.
For example, assume a single PM that hosts one VM with a critical application, and also hosts two VMs with non-criti-cal applications. Consider these similar situations:
• The critical application has increased use, and the non-critical applications are dormant
In this case, Operations Manager can suspend the two unused VMs (reduce VM sprawl) and devote more host resources to the critical application.
• The critical application has increased use, and both non-critical applications see increased use
In this case, Operations Manager can move the non-critical VMs to another host and devote more host resources to the critical application.
This is a very simple case, but it illustrates the value of constant analysis of all the relationships. For the critical appli-cation, the results are the same. But for the environment as a whole, the results arrive at different, economical solu-tions, that are best for the actual conditions. The Economic Scheduling Engine considers all the entities and resources in your environment, and analyzes them to constantly tend toward the desired state.
NOTE: The default Operations Manager configuration is ready to use in many environments. However, you can fine-tune the configuration to address special services and resources in your environment. Operations Manager provides a full range of policies that you can set to control how the software manages specific groups of entities. Before you make such policy settings, you should understand default Operations Manager operation. For more information about poli-cies, see The Policy View on page 336.
The Operations Manager Supply Chain
Operations Manager models your environment as a market of buyers and sellers. It discovers different types of enti-ties in your environment via the targets you have configured for your installation. Discovery maps these entities to the supply chain so Operations Manager can monitor them and manage the workloads they support. For example, for a hypervisor target Operations Manager discovers VMs, the PMs and datastores that provide resources to the VMs, and the applications that use VM resources. The entities in your environment form a chain of supply and demand where some entities provide resources while others consume the supplied resources.
For information about specific members of the supply chain, see The Supply Chain View on page 119.
Supply Chain Terminology
VMTurbo introduces specific terms to express IT resources and utilization in terms of supply and demand. These terms are largely intuitive, but you should understand how they relate to the issues and activities that are common for IT management.
Operations Manager Host Requirements
Users Guide 15
Operations Manager Host Requirements
Operations Manager runs on hosts that meet the following requirements:
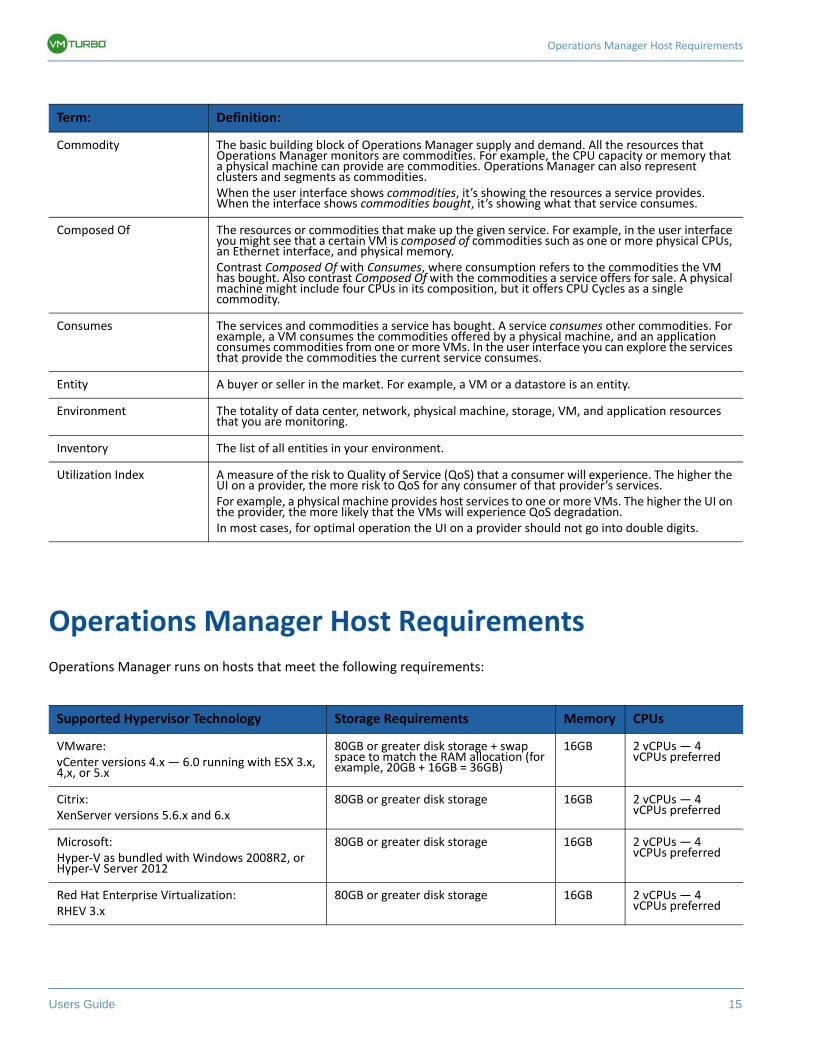
Term: Definition:
Commodity The basic building block of Operations Manager supply and demand. All the resources that Operations Manager monitors are commodities. For example, the CPU capacity or memory that a physical machine can provide are commodities. Operations Manager can also represent clusters and segments as commodities.When the user interface shows commodities, it’s showing the resources a service provides. When the interface shows commodities bought, it’s showing what that service consumes.
Composed Of The resources or commodities that make up the given service. For example, in the user interface you might see that a certain VM is composed of commodities such as one or more physical CPUs, an Ethernet interface, and physical memory.Contrast Composed Of with Consumes, where consumption refers to the commodities the VM has bought. Also contrast Composed Of with the commodities a service offers for sale. A physical machine might include four CPUs in its composition, but it offers CPU Cycles as a single commodity.
Consumes The services and commodities a service has bought. A service consumes other commodities. For example, a VM consumes the commodities offered by a physical machine, and an application consumes commodities from one or more VMs. In the user interface you can explore the services that provide the commodities the current service consumes.
Entity A buyer or seller in the market. For example, a VM or a datastore is an entity.
Environment The totality of data center, network, physical machine, storage, VM, and application resources that you are monitoring.
Inventory The list of all entities in your environment.
Utilization Index A measure of the risk to Quality of Service (QoS) that a consumer will experience. The higher the UI on a provider, the more risk to QoS for any consumer of that provider’s services.For example, a physical machine provides host services to one or more VMs. The higher the UI on the provider, the more likely that the VMs will experience QoS degradation.In most cases, for optimal operation the UI on a provider should not go into double digits.
Supported Hypervisor Technology Storage Requirements Memory CPUs
VMware:vCenter versions 4.x — 6.0 running with ESX 3.x, 4,x, or 5.x
80GB or greater disk storage + swap space to match the RAM allocation (for example, 20GB + 16GB = 36GB)
16GB 2 vCPUs — 4 vCPUs preferred
Citrix:XenServer versions 5.6.x and 6.x
80GB or greater disk storage 16GB 2 vCPUs — 4 vCPUs preferred
Microsoft:Hyper-V as bundled with Windows 2008R2, or Hyper-V Server 2012
80GB or greater disk storage 16GB 2 vCPUs — 4 vCPUs preferred
Red Hat Enterprise Virtualization:RHEV 3.x
80GB or greater disk storage 16GB 2 vCPUs — 4 vCPUs preferred
Introducing Operations Manager
16 VMTurbo, Inc. www.vmturbo.com
Operations Manager Targets
You can assign instances of the following technologies as Operations Manager targets:
• Hypervisors- Citrix XenServer 5.6 — 6.2- Microsoft Hyper-V 2008 R2, Hyper-V 2012, and Hyper-V 2012 R2- RHEV-M (RedHat Enterprise Virtualization Manager) versions 3.x- VMware vCenter 4.1 — 6.0 running with ESX 3.x, 4,x, 5.x, and 6.x
• Cloud Managers- CloudStack 3.0.2 — 4.1- Microsoft System Center 2012 Virtual Machine Manager and System Center 2012 R2 Virtual Machine Manager- VMware vCloud Director 1.0 — 5.1- OpenStack havana, Icehouse, juno, and kilo- Amazon AWS- Microsoft Azure- IBM SoftLayer
• Application Servers- IBM WebSphere Application Server, version 8.0.0.9 or greater- Oracle WebLogic versions 11g or 12c- JBoss Application Server 7.0 and later — JBoss Deployment Manager using jboss-eap-6.3- Apache Tomcat, versions 7.x and 8.0.x
• Database Servers- Microsoft SQL Server 2008 R2, 2012, and 2014- Oracle 11g R2 and 12c- MySQL 5.5.26 and higher, and all 5.6 releases
• Microsoft Applications- Microsoft Exchange
• Load Balancers- Citrix NetScaler
• Storage Managers- NetApp Storage Systems running Data ONTAP version 8 or later- EMC VNX Series Storage Systems (for version details, see the EMC VNX Support KB article)- Pure Storage FlashArray- HP 3PAR StoreServ- Nutanix- Dell Compellent
• Fabric Managers- Cisco UCS 2.0 and higher
• Network Flow Collectors- NetFlow/sFlow: NFDUMP — VMTurbo provides an OVA download with NFDUMP preconfigured for NetFlow and
sFlow collection- Arista EOS+
• Operations Manager Targets
To configure an aggregated deployment of Operations Manager, you can assign Operations Manager servers as targets (see Aggregated Operations Manager Installations on page 402). The versions of target instances must match the version of the aggregating instance.
The following sections describe these targets. For information about assigning targets to Operations Manager, see Target Configuration on page 285.
Operations Manager Targets
Users Guide 17
Hypervisors
Operations Manager can use a range of VM managers as targets. For general discussion, this document refers to the various supported VM managers as hypervisors.
Operations Manager supports the following hypervisor targets:
• Citrix XenServer• Microsoft Hyper-V• Red Hat RHEV-M• VMware vCenter
Operations Manager uses hypervisor targets to access information about the managed VMs, hosts, and datastores, and also to execute commands such as provisioning, resizing, or reconfiguring entities in the environment. Through the hypervisor, Operations Manager can perform system monitoring, report on wasted storage, recommend actions, execute moves for VMs and VM storage, and execute VM reconfiguration (change CPU count, memory, etc.).
The entities Operations Manager discovers through hypervisor targets include:
• VMs• Physical machines that host VMs• Datastores that support the VMs• Datacenters
Cloud Managers
Cloud Managers provide a layer of control to deliver virtual infrastructures that can be deployed automatically, or in a self-service offering to customers. They define and manage virtual datacenters (VDCs) — provider VDCs to manage the physical and virtual resources that support the cloud offering, and consumer VDCs that present limited resources to customers.
Operations Manager supports the following cloud manager targets:
• Apache CloudStack• Microsoft Virtual Machine Manager (VMM)• VMware vCloud Director• OpenStack Cloud Operating System
Operations Manager has visibility into the full VDC chain, from the resources provided by the underlying hosts and physical datastores, through the resources consumed by a provider VDC, to the resources consumed by VMs hosted on a consumer VDC.
You can create special Operations Manager user accounts for consumer VDC customers. Such an account has a limited scope, and the user cannot see any of the resources outside of that scope. In this way, you can offer Operations Man-ager to cloud customers without exposing any proprietary infrastructure data to them. For more information, see User Authentication Configuration on page 277.
The entities Operations Manager discovers through cloud manager targets include:
• Consumer VDCs
Virtual resources that are available to customers.• Provider VDCs
Physical resources that provide the infrastructure to support Consumer VDCs.
Introducing Operations Manager
18 VMTurbo, Inc. www.vmturbo.com
NOTE: Different targets use different names to refer to Virtual Datacenters. In the Operations Manager supply chain, these entities are all represented by Consumer and Provider VDCs, as follows:
Application Servers
An application server operates in the middle tier of a multi-tier application environment. It provides reliability and scalability, and it ensures high performance in the middle tier. Many application servers support some form of cluster-ing, where one application server is a master, or Domain Manager, to multiple slave application servers. This can enable load balancing, and failover availability.
Operations Manager supports the following application server targets:
• IBM WebSphere Application Server• Oracle WebLogic• JBoss• Apache Tomcat
The target can be a specific application server, or it can be a Domain Manager that manages a cluster of application servers. Operations Manager manages the resources used by application servers, including heap, threads, transac-tions, and response time in the server process, and VMem and VCPU in the VM that hosts the application server.
Database Servers
A database server hosts processing for the database component of a client/server or multi-tier application. Opera-tions Manager attaches as a client to the database server’s listener.
Operations Manager supports the following database server targets:
• Microsoft SQL Server 2008 R2, 2012, and 2014• Oracle 11g R2 and 12c
Load Balancers
A load balancer is deployed in front of multiple application servers, and distributes client requests in a way that achieves the best utilization of application resources. Client requests come in to virtual applications (in NetScaler, vir-tual servers), and the load balancer passes the requests to the bound underlying applications according to its criteria.
VMTurbo vCloud Director vCenter Server VMM CloudStack OpenStack
Consumer VDC Organization VDC Resource Pool (Child)
Tenant or TenantQuota
Accounts Tenant
Provider VDC Provider VDC Resource Pool (Root)
Cloud Pod N/A
Operations Manager Targets
Users Guide 19
Operations Manager supports the following load balancer targets:
• Citrix NetScaler
Operations Manager discovers the virtual applications that are configured for a load balancer. It can also discover applications running in your environment and automatically bind them to the correct virtual application. Operations Manager can then monitor the health of those bound applications and decide whether to provision or decommission application instances. As it provisions new instances, it automatically binds them to the correct virtual application. (For information about discovering applications to bind to a load balancer, see Load Balancer Discovery on page 383.)
The entities Operations Manager discovers through load balancer targets include:
• Virtual Applications• Applications
Storage Managers
Storage managers provide management and distribution of data storage across disk arrays. Storage managers can support thin provisioning, deduplication, and HA architectures. Operations Manager monitors resource utilization across the storage system to optimize placement and provisioning of volumes and disk arrays, as well as management of storage controller resources.
Operations Manager supports the following storage manager targets:
• NetApp Storage Systems running Data ONTAP version 8 or later
The actions Operations Manager can recommend and perform are different for systems running in 7-Mode or Cluster-Mode.
• EMC VNX Series Storage Systems — for version details, see the EMC VNX Support KB article.
The entities Operations Manager discovers through storage manager targets include:
• Storage Controllers (NetApp controllers/filers, VNX processors)• Disk Arrays (aggregates, clustered aggregates, storage pools, RAID groups)• Datastores (volumes or LUNs)
Fabric Managers
Fabric managers provide a point of control for fabrics that unify compute, network, storage, and virtual resources within a single system.
Operations Manager supports the following fabric manager targets:
• Cisco UCS Fabric Manager
The entities Operations Manager discovers through fabric managers targets include:
• UCS Domains• Chassis• Fabric Interconnects• IO Modules
Introducing Operations Manager
20 VMTurbo, Inc. www.vmturbo.com
Operations Manager Servers as Targets
In large virtual environments, you can use more than one Operations Manager instance to manage your workload. To manage the full environment through a single client user interface, you add these Operations Manager instances as targets to a master instance of Operations Manager. This creates an aggregated installation of Operations Manager. For more information, see Aggregated Operations Manager Installations on page 402 or Adding Operations Manager Targets for Aggregation on page 313.
Operations Manager Actions
Operations Manager does more than track problems in your environment. Before problems occur, Operations Man-ager identifies actions you can take to avoid the problems. You can perform these actions manually, direct Operations Manager to perform the actions on command, or direct Operations Manager to perform actions automatically as they arise. You can set different action modes (whether to automate or not) globally or for specific groups or clusters within your environment (see Action Modes on page 364).
Operations Manager performs four general types of actions:
• Provision — Add resource capacity, usually by adding an entity• Decommission — Stop, suspend, or remove an entity• Place — Place a consumer on a different provider• (Re) Configure — Change the allocation of resources on an entity
Provision
Provisioning actions add capacity to your environment. For example, provisioning a PM adds more compute capacity that is available to host VMs. Provisioning a VM adds capacity to run applications. Operations Manager can provision the following:
• Application Servers (only with Provision scaling policy)• VMs• PMs• Storage• Storage Controllers (only for planning scenarios)• Disk Arrays
Under certain circumstances, Operations Manager can also recommend that you provision a virtual datacenter.
Operations Manager Actions
Users Guide 21
Decommission
Decommissioning actions either suspend entities (set resources aside without removing them from the environment) or terminate entities (remove them from the environment). Suspended capacity is still available to be brought back online, but is currently not available for use. Suspended resources are candidates for termination. Operations Man-ager can decommission the following:
• Application Servers (only with Provision scaling policy)• VMs• PMs• Storage• Disk Arrays
Operations Manager can also recommend that you decommission a virtual datacenter.
Place
Placement actions determine the best provider for a consumer. Move actions change a consumer to use a different provider. For example, moving a VM assigns the VM to be hosted on a different PM. Moving a VM’s storage means the VM will use a different datastore. Operations Manager can move the following:
• VMs• Storage
Shared-Nothing Migration Actions
If you have enabled storage moves and VM moves, Operations Manager can perform shared-nothing migrations, which move the VM and the stored VM files simultaneously. For example, assume a VM on a host also uses local stor-age on that host. In that case, Operations Manager can move that VM and move its data to a different host in a single action.
Shared-nothing migrations are available for any environments that support automation of both VM moves and stor-age moves. In addition, you must have the action modes for VM and storage moves set to Manual or Automated. If you meet these criteria, then all VM moves will take advantage of this feature.
If you want to limit the effect of shared-nothing migration, you can use the Lock VMs to Datastores setting in the Poli-cies view. This will ensure that specific VMs stay within a specified storage cluster. For more information, see Con-trolling Shared-Nothing Migration on page 364.
Currently, the following targets support Shared-Nothing Migrations:
• vSphere, versions 5.1 or greater• VMM for HyperV 2012
Cross-vCenter vMotion
VMware vSphere 6.0 introduces functionality that enables migration of virtual machines between different vCenter Server instances. Operations Manager supports this capability — it considers cross-vCenter locations when calculating placement, and can recommend or execute moves to different vCenter servers.
Introducing Operations Manager
22 VMTurbo, Inc. www.vmturbo.com
(Re) Configure
These are configure, reconfigure, and resize actions. Configure and reconfigure actions can add necessary network access, or reconfigure storage. Resize actions allocate more or less resource capacity on an entity, which can include adding or subtracting VCPUs or VMem on a VM, adding or subtracting capacity on a datastore, and adding or subtract-ing volumes in a disk array. Operations Manager can resize the following:
• Application Servers (only with Resize scaling policy)• VMs• Storage• Disk Arrays• Virtual Datacenters
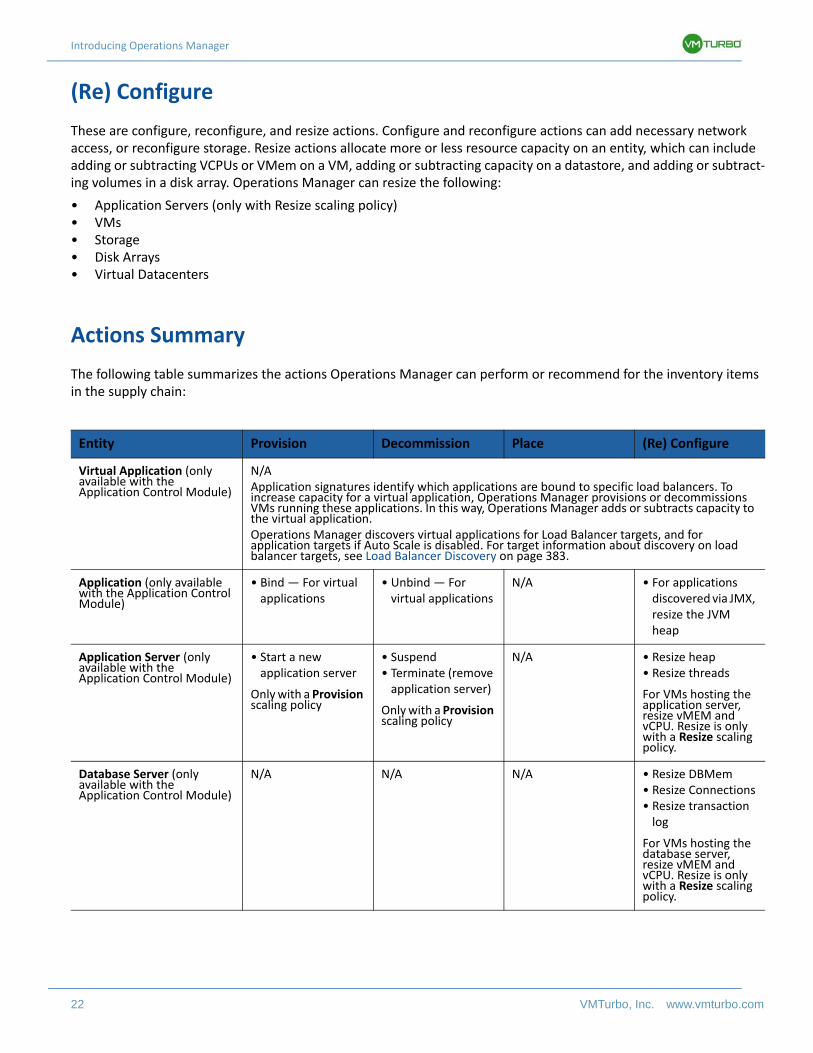
Actions Summary
The following table summarizes the actions Operations Manager can perform or recommend for the inventory items in the supply chain:
Entity Provision Decommission Place (Re) Configure
Virtual Application (only available with the Application Control Module)
N/AApplication signatures identify which applications are bound to specific load balancers. To increase capacity for a virtual application, Operations Manager provisions or decommissions VMs running these applications. In this way, Operations Manager adds or subtracts capacity to the virtual application.Operations Manager discovers virtual applications for Load Balancer targets, and for application targets if Auto Scale is disabled. For target information about discovery on load balancer targets, see Load Balancer Discovery on page 383.
Application (only available with the Application Control Module)
• Bind — For virtual applications
• Unbind — For virtual applications
N/A • For applications discovered via JMX, resize the JVM heap
Application Server (only available with the Application Control Module)
• Start a new application server
Only with a Provision scaling policy
• Suspend• Terminate (remove
application server)
Only with a Provision scaling policy
N/A • Resize heap• Resize threads
For VMs hosting the application server, resize vMEM and vCPU. Resize is only with a Resize scaling policy.
Database Server (only available with the Application Control Module)
N/A N/A N/A • Resize DBMem• Resize Connections• Resize transaction
log
For VMs hosting the database server, resize vMEM and vCPU. Resize is only with a Resize scaling policy.
Operations Manager Actions
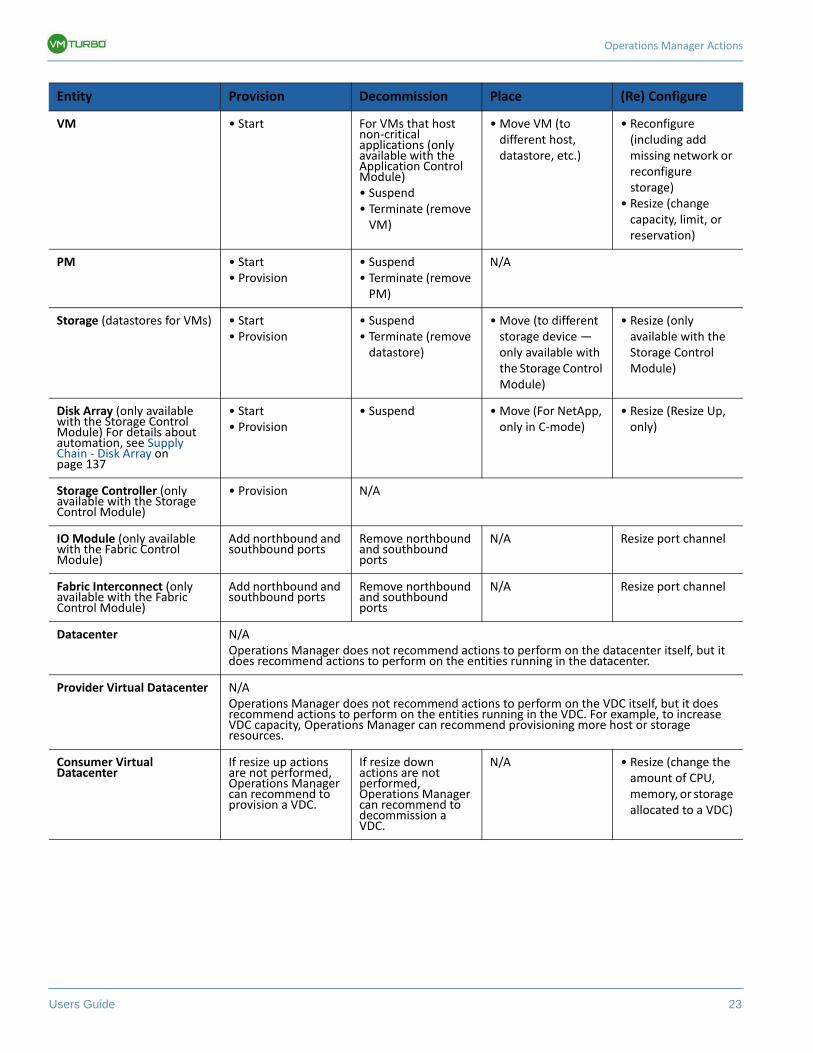
Users Guide 23
VM • Start For VMs that host non-critical applications (only available with the Application Control Module)• Suspend• Terminate (remove
VM)
• Move VM (to different host, datastore, etc.)
• Reconfigure (including add missing network or reconfigure storage)
• Resize (change capacity, limit, or reservation)
PM • Start• Provision
• Suspend• Terminate (remove
PM)
N/A
Storage (datastores for VMs) • Start• Provision
• Suspend• Terminate (remove
datastore)
• Move (to different storage device — only available with the Storage Control Module)
• Resize (only available with the Storage Control Module)
Disk Array (only available with the Storage Control Module) For details about automation, see Supply Chain - Disk Array on page 137
• Start• Provision
• Suspend • Move (For NetApp, only in C-mode)
• Resize (Resize Up, only)
Storage Controller (only available with the Storage Control Module)
• Provision N/A
IO Module (only available with the Fabric Control Module)
Add northbound and southbound ports
Remove northbound and southbound ports
N/A Resize port channel
Fabric Interconnect (only available with the Fabric Control Module)
Add northbound and southbound ports
Remove northbound and southbound ports
N/A Resize port channel
Datacenter N/AOperations Manager does not recommend actions to perform on the datacenter itself, but it does recommend actions to perform on the entities running in the datacenter.
Provider Virtual Datacenter N/AOperations Manager does not recommend actions to perform on the VDC itself, but it does recommend actions to perform on the entities running in the VDC. For example, to increase VDC capacity, Operations Manager can recommend provisioning more host or storage resources.
Consumer Virtual Datacenter
If resize up actions are not performed, Operations Manager can recommend to provision a VDC.
If resize down actions are not performed, Operations Manager can recommend to decommission a VDC.
N/A • Resize (change the amount of CPU, memory, or storage allocated to a VDC)
Entity Provision Decommission Place (Re) Configure
Introducing Operations Manager
24 VMTurbo, Inc. www.vmturbo.com
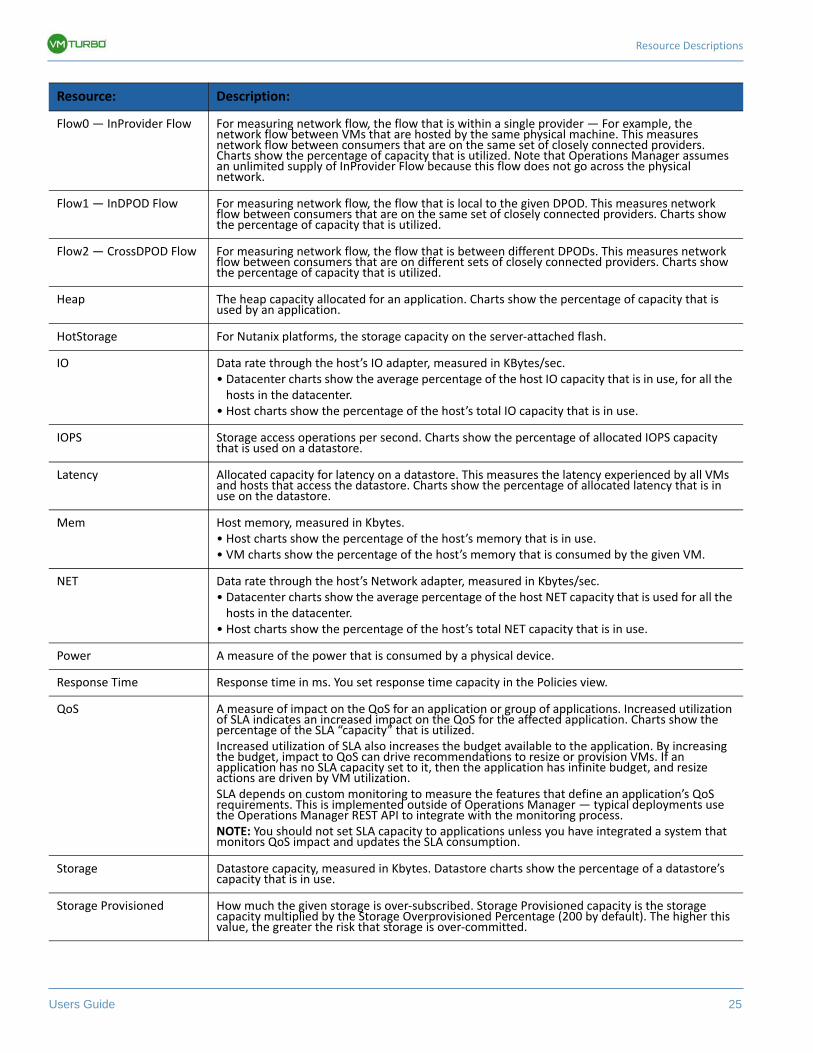
Resource Descriptions
To perform intelligent workload balancing, Operations Manager collects raw data from its target servers (hypervisors, cloud management stacks, or load balancers). Operations Manager polls its target servers at 10-minute intervals to collect the target's latest data samples. It then uses these 10-minute data points for analysis and to display data in the GUI.
The way Operations Manager collects host memory data from vCenter Server illustrates how this works. vCenter Server collects peak metrics from its managed VMs at 20-second intervals. Every ten minutes Operations Manager polls vCenter Server to collect its last round of data samples (30 samples in 10 minutes). To track a VM's utilization of host memory, Operations Manager requests memory.active data samples from vCenter. From that polling, Operations Manager can track:
• Max Memory Utilization - Operations Manager uses the greatest value in each polling sample. This gives the highest percentage of active memory utilization for the selected VM (or group of VMs), calculated over the selected time period. For a maximum value, Operations Manager uses the highest observed active memory value in the data sample.
• Average Memory Utilization - Operations Manager averages all the values in each polling sample.
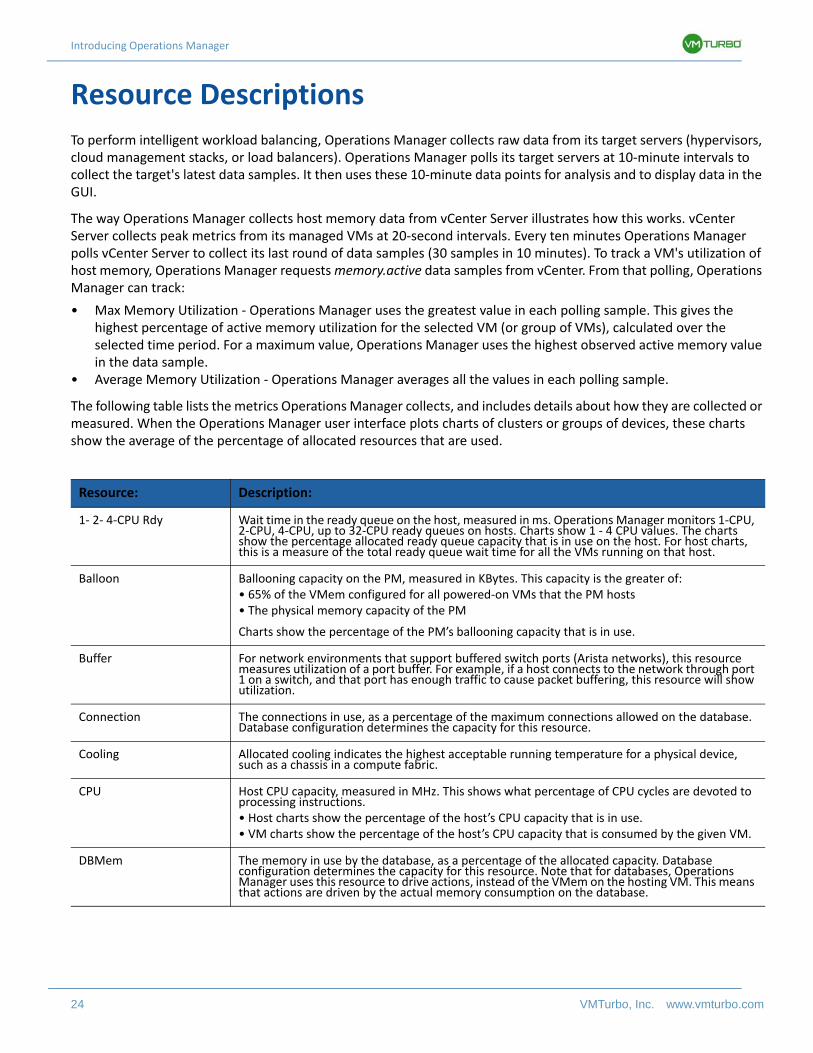
The following table lists the metrics Operations Manager collects, and includes details about how they are collected or measured. When the Operations Manager user interface plots charts of clusters or groups of devices, these charts show the average of the percentage of allocated resources that are used.
Resource: Description:
1- 2- 4-CPU Rdy Wait time in the ready queue on the host, measured in ms. Operations Manager monitors 1-CPU, 2-CPU, 4-CPU, up to 32-CPU ready queues on hosts. Charts show 1 - 4 CPU values. The charts show the percentage allocated ready queue capacity that is in use on the host. For host charts, this is a measure of the total ready queue wait time for all the VMs running on that host.
Balloon Ballooning capacity on the PM, measured in KBytes. This capacity is the greater of:• 65% of the VMem configured for all powered-on VMs that the PM hosts• The physical memory capacity of the PM
Charts show the percentage of the PM’s ballooning capacity that is in use.
Buffer For network environments that support buffered switch ports (Arista networks), this resource measures utilization of a port buffer. For example, if a host connects to the network through port 1 on a switch, and that port has enough traffic to cause packet buffering, this resource will show utilization.
Connection The connections in use, as a percentage of the maximum connections allowed on the database. Database configuration determines the capacity for this resource.
Cooling Allocated cooling indicates the highest acceptable running temperature for a physical device, such as a chassis in a compute fabric.
CPU Host CPU capacity, measured in MHz. This shows what percentage of CPU cycles are devoted to processing instructions.• Host charts show the percentage of the host’s CPU capacity that is in use.• VM charts show the percentage of the host’s CPU capacity that is consumed by the given VM.
DBMem The memory in use by the database, as a percentage of the allocated capacity. Database configuration determines the capacity for this resource. Note that for databases, Operations Manager uses this resource to drive actions, instead of the VMem on the hosting VM. This means that actions are driven by the actual memory consumption on the database.
Resource Descriptions
Users Guide 25
Flow0 — InProvider Flow For measuring network flow, the flow that is within a single provider — For example, the network flow between VMs that are hosted by the same physical machine. This measures network flow between consumers that are on the same set of closely connected providers. Charts show the percentage of capacity that is utilized. Note that Operations Manager assumes an unlimited supply of InProvider Flow because this flow does not go across the physical network.
Flow1 — InDPOD Flow For measuring network flow, the flow that is local to the given DPOD. This measures network flow between consumers that are on the same set of closely connected providers. Charts show the percentage of capacity that is utilized.
Flow2 — CrossDPOD Flow For measuring network flow, the flow that is between different DPODs. This measures network flow between consumers that are on different sets of closely connected providers. Charts show the percentage of capacity that is utilized.
Heap The heap capacity allocated for an application. Charts show the percentage of capacity that is used by an application.
HotStorage For Nutanix platforms, the storage capacity on the server-attached flash.
IO Data rate through the host’s IO adapter, measured in KBytes/sec.• Datacenter charts show the average percentage of the host IO capacity that is in use, for all the
hosts in the datacenter.• Host charts show the percentage of the host’s total IO capacity that is in use.
IOPS Storage access operations per second. Charts show the percentage of allocated IOPS capacity that is used on a datastore.
Latency Allocated capacity for latency on a datastore. This measures the latency experienced by all VMs and hosts that access the datastore. Charts show the percentage of allocated latency that is in use on the datastore.
Mem Host memory, measured in Kbytes.• Host charts show the percentage of the host’s memory that is in use.• VM charts show the percentage of the host’s memory that is consumed by the given VM.
NET Data rate through the host’s Network adapter, measured in Kbytes/sec.• Datacenter charts show the average percentage of the host NET capacity that is used for all the
hosts in the datacenter.• Host charts show the percentage of the host’s total NET capacity that is in use.
Power A measure of the power that is consumed by a physical device.
Response Time Response time in ms. You set response time capacity in the Policies view.
QoS A measure of impact on the QoS for an application or group of applications. Increased utilization of SLA indicates an increased impact on the QoS for the affected application. Charts show the percentage of the SLA “capacity” that is utilized.Increased utilization of SLA also increases the budget available to the application. By increasing the budget, impact to QoS can drive recommendations to resize or provision VMs. If an application has no SLA capacity set to it, then the application has infinite budget, and resize actions are driven by VM utilization.SLA depends on custom monitoring to measure the features that define an application’s QoS requirements. This is implemented outside of Operations Manager — typical deployments use the Operations Manager REST API to integrate with the monitoring process.NOTE: You should not set SLA capacity to applications unless you have integrated a system that monitors QoS impact and updates the SLA consumption.
Storage Datastore capacity, measured in Kbytes. Datastore charts show the percentage of a datastore’s capacity that is in use.
Storage Provisioned How much the given storage is over-subscribed. Storage Provisioned capacity is the storage capacity multiplied by the Storage Overprovisioned Percentage (200 by default). The higher this value, the greater the risk that storage is over-committed.
Resource: Description:
Introducing Operations Manager
26 VMTurbo, Inc. www.vmturbo.com
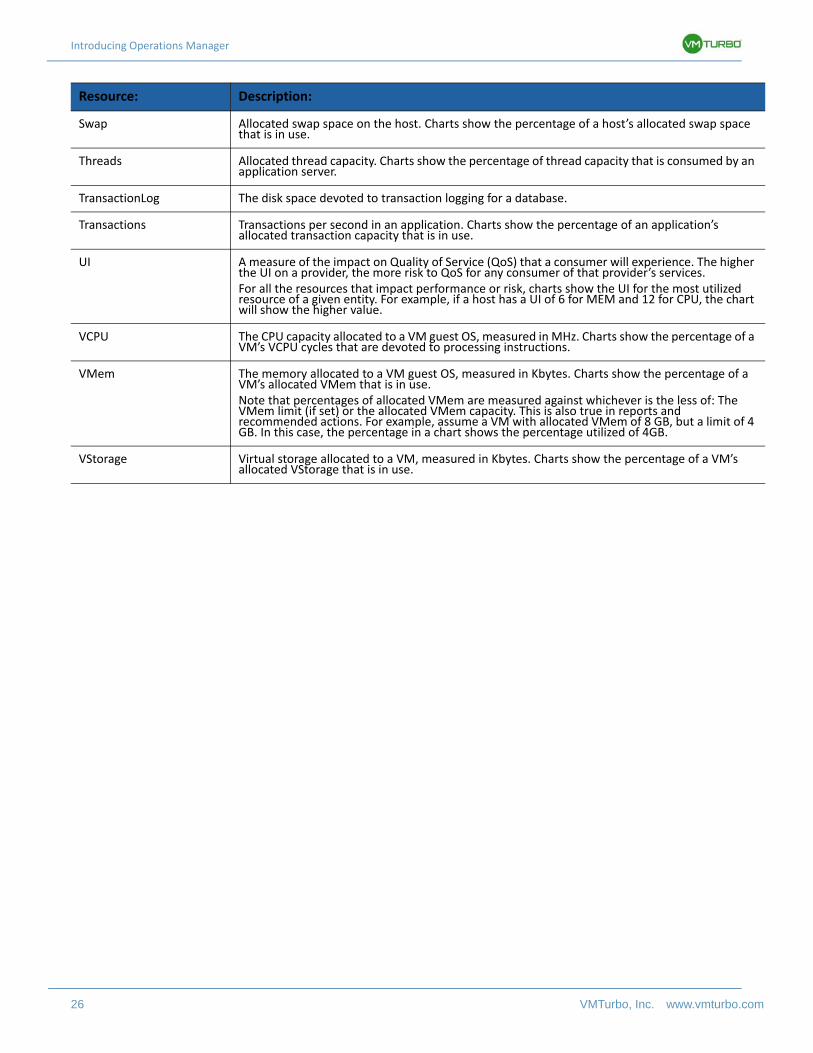
Swap Allocated swap space on the host. Charts show the percentage of a host’s allocated swap space that is in use.
Threads Allocated thread capacity. Charts show the percentage of thread capacity that is consumed by an application server.
TransactionLog The disk space devoted to transaction logging for a database.
Transactions Transactions per second in an application. Charts show the percentage of an application’s allocated transaction capacity that is in use.
UI A measure of the impact on Quality of Service (QoS) that a consumer will experience. The higher the UI on a provider, the more risk to QoS for any consumer of that provider’s services.For all the resources that impact performance or risk, charts show the UI for the most utilized resource of a given entity. For example, if a host has a UI of 6 for MEM and 12 for CPU, the chart will show the higher value.
VCPU The CPU capacity allocated to a VM guest OS, measured in MHz. Charts show the percentage of a VM’s VCPU cycles that are devoted to processing instructions.
VMem The memory allocated to a VM guest OS, measured in Kbytes. Charts show the percentage of a VM’s allocated VMem that is in use.Note that percentages of allocated VMem are measured against whichever is the less of: The VMem limit (if set) or the allocated VMem capacity. This is also true in reports and recommended actions. For example, assume a VM with allocated VMem of 8 GB, but a limit of 4 GB. In this case, the percentage in a chart shows the percentage utilized of 4GB.
VStorage Virtual storage allocated to a VM, measured in Kbytes. Charts show the percentage of a VM’s allocated VStorage that is in use.
Resource: Description:
Users Guide 27
Operations Manager Editions and Control Modules
VMTurbo Operations Manager can perform intelligent workload management on a wide range of entities in your envi-ronment. Depending on your management needs, you can license different control modules to extend Operations Manager control into more technologies and entities in your environment. This section describes the base installa-tions — Virtual Health Monitor and Operations Manager. It also describes the different control modules you can license to add features to your base installation of Operations Manager.
Operations Manager
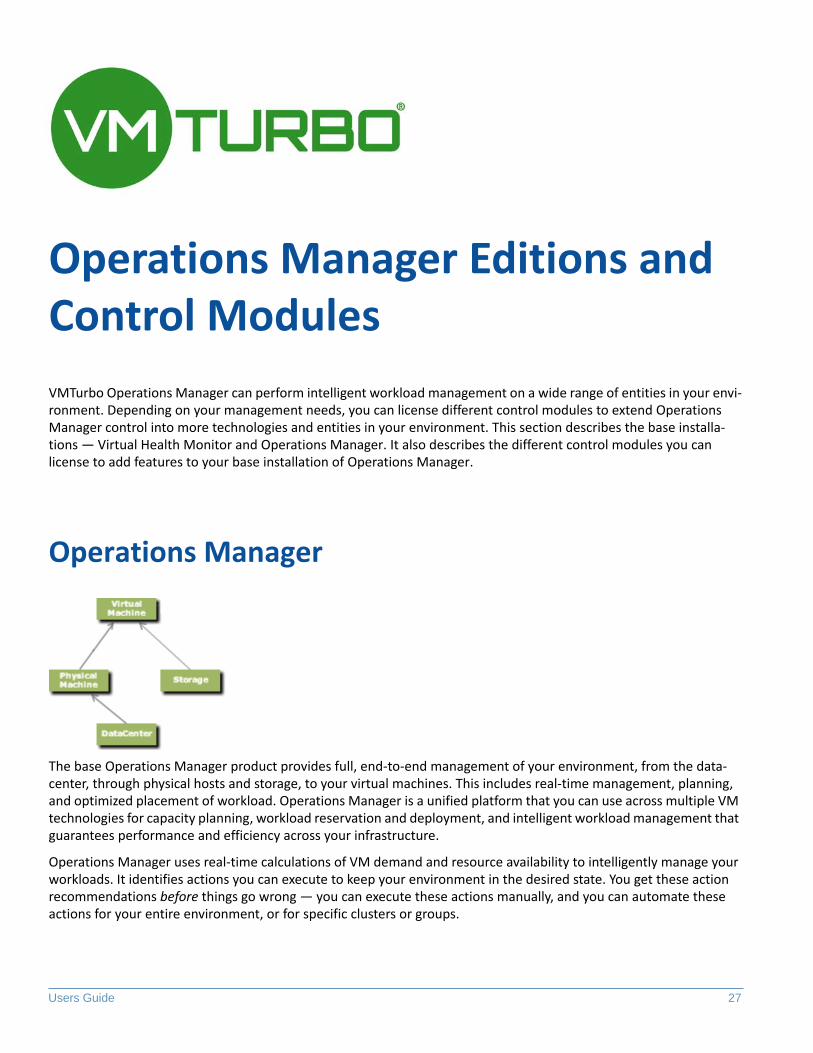
The base Operations Manager product provides full, end-to-end management of your environment, from the data-center, through physical hosts and storage, to your virtual machines. This includes real-time management, planning, and optimized placement of workload. Operations Manager is a unified platform that you can use across multiple VM technologies for capacity planning, workload reservation and deployment, and intelligent workload management that guarantees performance and efficiency across your infrastructure.
Operations Manager uses real-time calculations of VM demand and resource availability to intelligently manage your workloads. It identifies actions you can execute to keep your environment in the desired state. You get these action recommendations before things go wrong — you can execute these actions manually, and you can automate these actions for your entire environment, or for specific clusters or groups.
Operations Manager Editions and Control Modules
28 VMTurbo, Inc. www.vmturbo.com
Associated Targets
• Citrix XenServer• Microsoft Hyper-V• Red Hat RHEV-M• VMware vCenter
Use Cases
• Intelligently manage workload across:- VMs- Hosts- Storage
• Monitor and investigate
Operations Manager gives you the following views to monitor your environment — You can always see and execute the current set of recommended actions:- Dashboards View
Use dashboards to check conditions at a glance. You can scope dashboards, drill down to specifics, and generate reports from the dashboard views. You can also create and save custom dashboards.
- Supply Chain View
Navigate your environment through the chain of buyers and sellers — From applications, through VMs, out to Hosts or Datastores. From this view you can inspect individual entities, and drill down for more details.
- Workload View
Get a high-level view of the distribution of workload over hosts and datastores. You can see the current state, and the state our would achieve if you executed the current set of recommended actions.
- Inventory View
This view shows your complete infrastructure in a hierarchical display. Navigate to specific entities and view their resource consumption, or other data about their current state.
• Reserve and deploy workload resources
Use Operations Manager to calculate the best placement for future workloads, reserving the resources and maintaining your environment in a state that best supports the reserved resources as real-time changes occur. When the time comes to deploy these workloads, Operations Manager executes the deployment, placing the VMs for you.
• Perform capacity planning
The Operations Manager Plan View simulates what-if scenarios you can run to see how your current or planned infrastructure holds up. The plan includes a complete list of actions that will result in an environment that best supports the planned workload. After running a plan, you can save it or generate a report to keep the recommended actions on hand.
• Reporting:- One-time or scheduled reporting
You can generate reports on demand or schedule regular runs, including subscriptions to email reports to listed addresses.
- Create custom reports
You can create custom dashboards, and generate reports from their data. You can schedule these reports and set up subscriptions.
Virtual Health Monitor
Users Guide 29
• Configuration
Of course Operations Manager is flexible. You can configure it to meet the requirements of your environment. For example:- Create custom groups to manage like entities in a like manner- Enable or disable discovered placement policies- Create your own placement policies — For example, you can specify placement across cluster boundaries, so
Operations Manager can optimize placement even more.- Use discovered HA or specify how you want Operations Manager to reserve resources- Automate actions globally, or per group or cluster- Configure email or SNMP trap notifications
Virtual Health Monitor
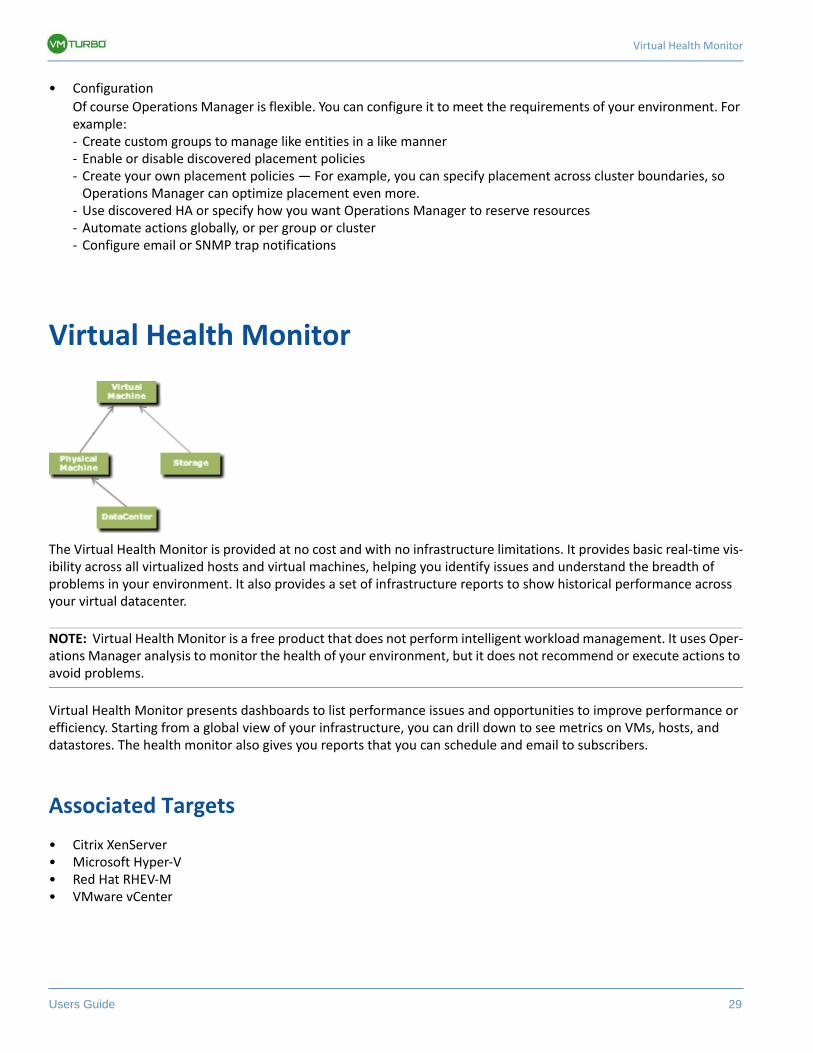
The Virtual Health Monitor is provided at no cost and with no infrastructure limitations. It provides basic real-time vis-ibility across all virtualized hosts and virtual machines, helping you identify issues and understand the breadth of problems in your environment. It also provides a set of infrastructure reports to show historical performance across your virtual datacenter.
NOTE: Virtual Health Monitor is a free product that does not perform intelligent workload management. It uses Oper-ations Manager analysis to monitor the health of your environment, but it does not recommend or execute actions to avoid problems.
Virtual Health Monitor presents dashboards to list performance issues and opportunities to improve performance or efficiency. Starting from a global view of your infrastructure, you can drill down to see metrics on VMs, hosts, and datastores. The health monitor also gives you reports that you can schedule and email to subscribers.
Associated Targets
• Citrix XenServer• Microsoft Hyper-V• Red Hat RHEV-M• VMware vCenter
Operations Manager Editions and Control Modules
30 VMTurbo, Inc. www.vmturbo.com
Use Cases
• Generate reports• Monitor performance for:
- Workload- Hosts and servers- Storage
• Get insights into capacity planning• Gauge infrastructure efficiency and network performance
Application Control Module
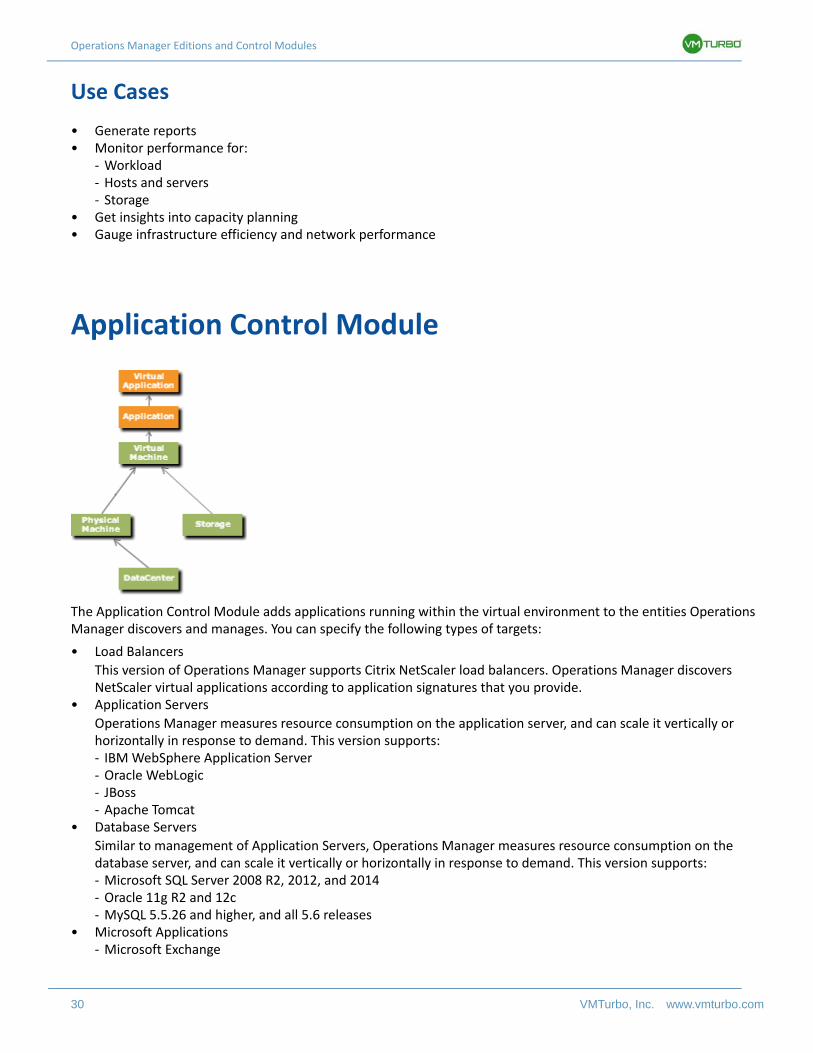
The Application Control Module adds applications running within the virtual environment to the entities Operations Manager discovers and manages. You can specify the following types of targets:
• Load Balancers
This version of Operations Manager supports Citrix NetScaler load balancers. Operations Manager discovers NetScaler virtual applications according to application signatures that you provide.
• Application Servers
Operations Manager measures resource consumption on the application server, and can scale it vertically or horizontally in response to demand. This version supports:- IBM WebSphere Application Server- Oracle WebLogic- JBoss- Apache Tomcat
• Database Servers
Similar to management of Application Servers, Operations Manager measures resource consumption on the database server, and can scale it vertically or horizontally in response to demand. This version supports:- Microsoft SQL Server 2008 R2, 2012, and 2014- Oracle 11g R2 and 12c- MySQL 5.5.26 and higher, and all 5.6 releases
• Microsoft Applications- Microsoft Exchange
Application Control Module
Users Guide 31
Load Balancers
When you provide a load balancer target, Operations Manager discovers the virtual applications (sometimes called virtual servers) that are managed by that load balancer. The virtual application is a proxy for multiple instances of actual applications. When a client requests application services, it requests them through the virtual application. The load balancer distributes the requests to balance the workload on the underlying applications that provide transac-tions to the virtual application.
Operations Manager uses discovery policies to associate applications with a load balancer. The virtual applications on the load balancer are divided by service type — Operations Manager discovers the service types that are defined for the load balancer. To bind applications to a virtual application, Operations Manager uses application signatures that you have defined. For more information, see Load Balancer Discovery on page 383 and Application Discovery on page 379.
Operations Manager recommends actions on the VMs that host the underlying applications. If the VM hosts an appli-cation with a signature that is associated with a virtual application, then provisioning the new VM will automatically bind the underlying application to the virtual application. In this way, Operations Manager can control the underlying resources that support the load balancer’s demand.
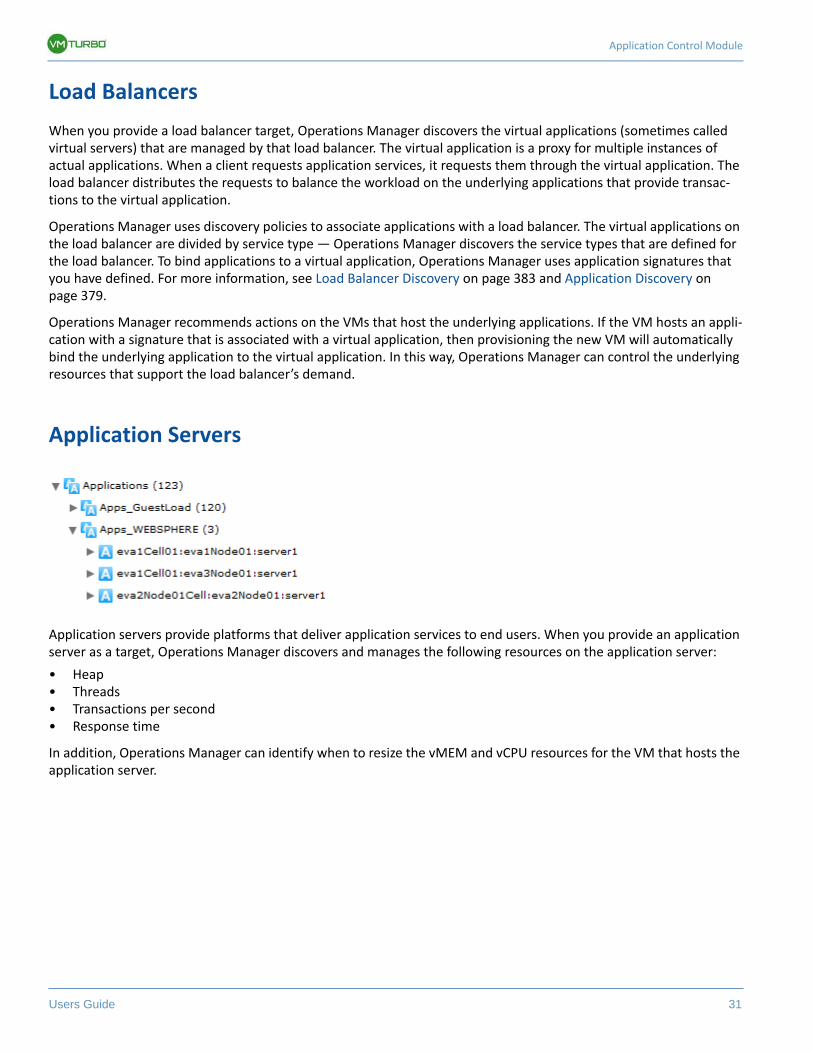
Application Servers
Application servers provide platforms that deliver application services to end users. When you provide an application server as a target, Operations Manager discovers and manages the following resources on the application server:
• Heap• Threads• Transactions per second• Response time
In addition, Operations Manager can identify when to resize the vMEM and vCPU resources for the VM that hosts the application server.
Operations Manager Editions and Control Modules
32 VMTurbo, Inc. www.vmturbo.com
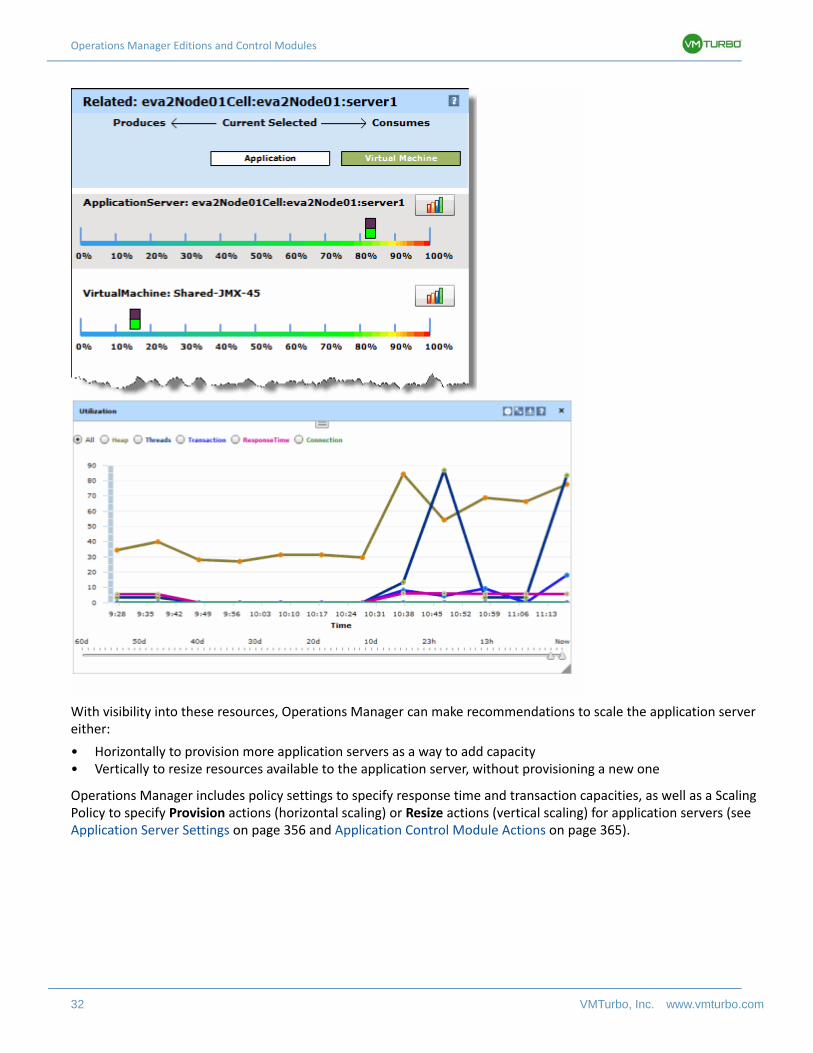
With visibility into these resources, Operations Manager can make recommendations to scale the application server either:
• Horizontally to provision more application servers as a way to add capacity• Vertically to resize resources available to the application server, without provisioning a new one
Operations Manager includes policy settings to specify response time and transaction capacities, as well as a Scaling Policy to specify Provision actions (horizontal scaling) or Resize actions (vertical scaling) for application servers (see Application Server Settings on page 356 and Application Control Module Actions on page 365).
Application Control Module
Users Guide 33
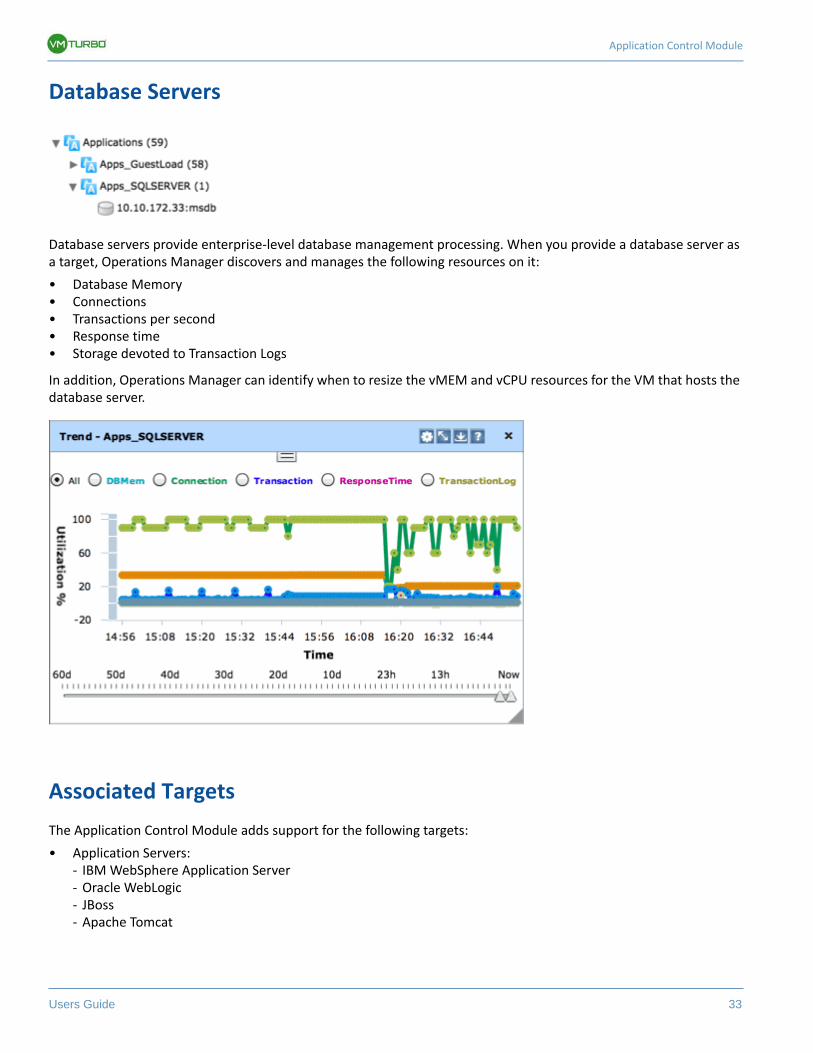
Database Servers
Database servers provide enterprise-level database management processing. When you provide a database server as a target, Operations Manager discovers and manages the following resources on it:
• Database Memory• Connections• Transactions per second• Response time• Storage devoted to Transaction Logs
In addition, Operations Manager can identify when to resize the vMEM and vCPU resources for the VM that hosts the database server.
Associated Targets
The Application Control Module adds support for the following targets:
• Application Servers:- IBM WebSphere Application Server- Oracle WebLogic- JBoss- Apache Tomcat
Operations Manager Editions and Control Modules
34 VMTurbo, Inc. www.vmturbo.com
• Database Servers:- Microsoft SQL Server 2008 R2, 2012, and 2014- Oracle 11g R2 and 12c- MySQL 5.5.26 and higher, and all 5.6 releases
• Load Balancers:- Citrix NetScaler
In addition, you can specify application signatures to discover and manage applications via SNMP and JMX.
Use Cases
• Set up application priorities for tiers of service to ensure QoS for critical workloads• Monitor real-time performance at the application layer, and execute actions to assure workload performance• Monitor real-time performance at the database layer, and execute actions to assure workload performance• Integrate with load-balanced applications
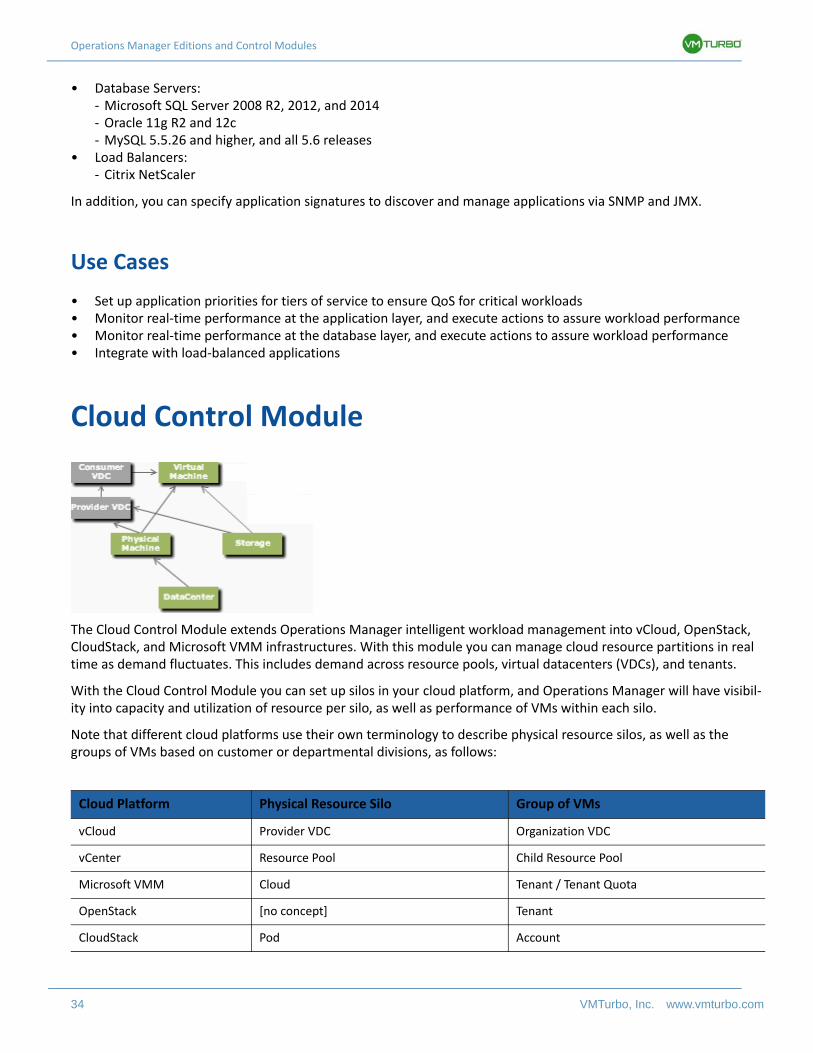
Cloud Control Module
The Cloud Control Module extends Operations Manager intelligent workload management into vCloud, OpenStack, CloudStack, and Microsoft VMM infrastructures. With this module you can manage cloud resource partitions in real time as demand fluctuates. This includes demand across resource pools, virtual datacenters (VDCs), and tenants.
With the Cloud Control Module you can set up silos in your cloud platform, and Operations Manager will have visibil-ity into capacity and utilization of resource per silo, as well as performance of VMs within each silo.
Note that different cloud platforms use their own terminology to describe physical resource silos, as well as the groups of VMs based on customer or departmental divisions, as follows:
Cloud Platform Physical Resource Silo Group of VMs
vCloud Provider VDC Organization VDC
vCenter Resource Pool Child Resource Pool
Microsoft VMM Cloud Tenant / Tenant Quota
OpenStack [no concept] Tenant
CloudStack Pod Account
Hybrid Cloud Control Module
Users Guide 35
Operations Manager lists these in the user interface as Provider VDCs for physical resources, and Organization VDCs for groups of VMs. As you use the product, you will see that it can automatically resize Provider VDCs as demand in Organization VDCs fluctuates.
Microsoft VMM and SMB3 Storage Shares
If you have added SMB 3.0 shares as storage devices in your VMM service center, Operations Manager recognizes these as datastores, and includes them in the supply chain. Calculations for workload placement in the VMM environ-ment will take the capacity and utilization of resources on these shares. Please refer to Microsoft documentation for information about adding SMB shares to your VMM service center.
Associated Targets
The Cloud Control Module adds support for the following targets:
• Apache CloudStack• Microsoft VMM• VMware vCloud Director• OpenStack Cloud
Use Cases
• Set up charge-back and show-back for private cloud or service-provider scenarios• For service-providers, set up scoped views to limit exposure to the customer base• Use reservations to optimally deploy new workloads• Plan hardware requirements — the planning scenarios takes cloud architectures into account
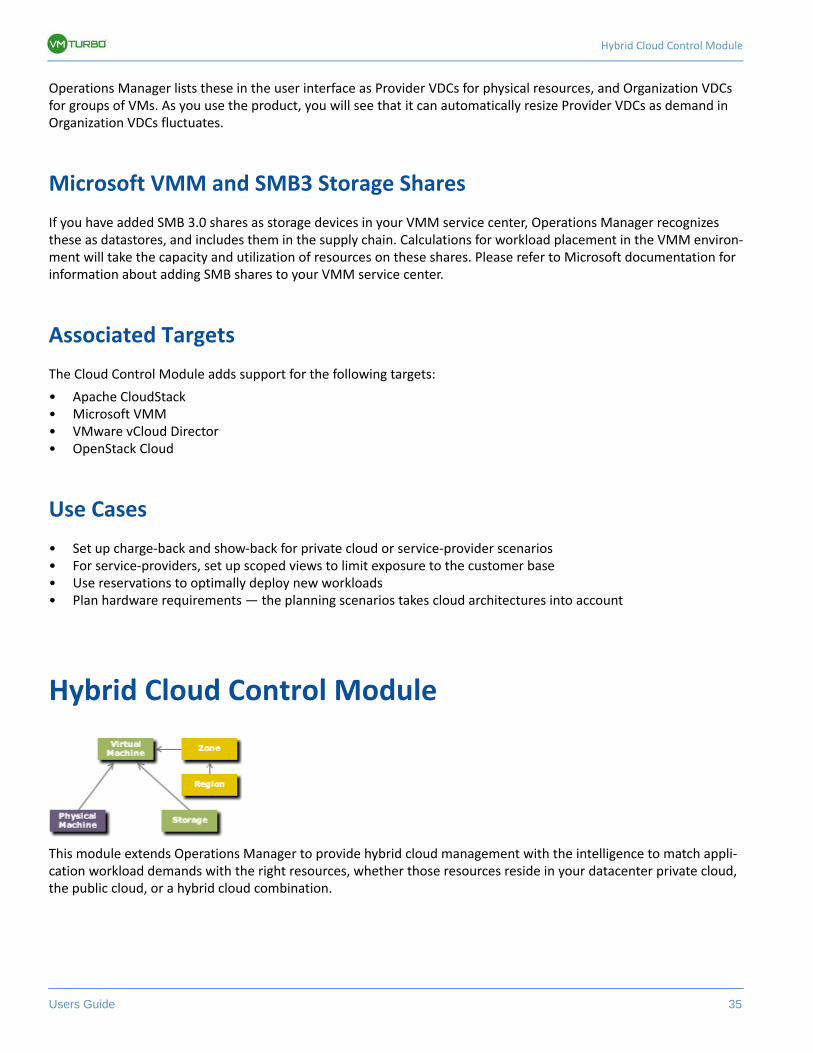
Hybrid Cloud Control Module
This module extends Operations Manager to provide hybrid cloud management with the intelligence to match appli-cation workload demands with the right resources, whether those resources reside in your datacenter private cloud, the public cloud, or a hybrid cloud combination.
Operations Manager Editions and Control Modules
36 VMTurbo, Inc. www.vmturbo.com
Operations Manager analysis calculates the most efficient placement while also assuring performance. In a hybrid environment, the cost of running on a subscribed cloud account may appear to show savings, but you still have to con-sider the applications’ business requirements. When analyzing a hybrid environment, Operations Manager actions take into account the differences of performance and cost for cloud and enterprise datacenters.
This module is ideal for environments with stateless applications that experience bursts of activity exceeding your pri-vate physical resources. In that case, Operations Manager can move the applications to an account on a public cloud (AWS or Azure) and scale your applications appropriately. If demand increases, Operations Manager will deploy copies of the application VMs to the public cloud. If demand falls off so that it’s more efficient to run the applications on your private infrastructure, Operations Manager will move the applications back to your datacenter.
The Application Control Module is highly recommended to accompany this module. Then for workload bursts, Opera-tions Manager can work with a Global Server load balancer to manage the sudden demand by efficiently distributing applications across the hybrid environment.
With the Hybrid Cloud Control Module, when Operations Manager decides to provision a new application or VM, it decides where to place that new workload, including:
• Which physical host, if placing in the datacenter• Which cloud, if placing on a virtual datacenter• Which zone, if placing on a public cloud
Associated Targets
• Amazon AWS accounts• Microsoft Azure subscriptions
Use Cases
• Extend resource allocation across hybrid clouds• Locate the most efficient workload placement within the hybrid environment, while assuring performance• Perform elastic load balancing for application groups deployed to the public cloud
Requirements
It is strongly suggested that you use the Hybrid Cloud Control Module along with the Application Control Module in a load-balanced environment. The Application Control Module is required if you want to take advantage of NetScaler Global Server load balancing.
Storage Control Module
Users Guide 37
Storage Control Module
The Storage Control Module adds physical storage management to Operations Manager, and refines VM placement decisions for IO-intensive applications. This control module performs the following tasks:
• Corrects and prevents storage performance issues that stem from storage contention and bottlenecks• Maps end-to-end relationships from VMs to underlying storage — Volumes/LUNs, Aggregates/Storage Pools,
physical disks/spindles, and storage controllers/processors• Holistically optimizes the hypervisor, storage, and Cisco UCS platform for customers adopting Vblock, VCE, and
FlexPod converged infrastructure
IOPS and latency can be the most constrained resources in a virtual environment. By extending control into storage pools and disk arrays in the SAN, the Storage Control Module can identify, remedy, and maintain performance across all storage contention points.
It manages IOPS and IO latency, wasted and reserved snapshot disk space, and includes overprovisioning in its calcula-tions. It also integrates with disk arrays to manage volumes in storage aggregates and storage controller resources.
Associated Targets
• NetApp Data ONTAP• EMC VNX• Pure Storage FlashArray• HP 3PAR StoreServ• Nutanix• Dell Compellent
Use Cases
• Manage disk arrays to:- Size array capacity- Remedy overutilization of IOPS- Fully utilize physical capacity- Get advanced warning to deploy new arrays before capacity runs out- Identify and prioritize critical VM storage paths- Understand how array performance impacts users
• Maintain storage pool performance• Prevent datastore issues
Operations Manager Editions and Control Modules
38 VMTurbo, Inc. www.vmturbo.com
Fabric Control Module
The Fabric Control Module adds fabric management to Operations Manager. It connects with Cisco UCS Manager and enables VMTurbo to map end-to-end relationships between virtual workloads, chassis, domains, blade servers, I/O modules and fabric interconnects.
Associated Targets
• Cisco UCS
Use Cases
• Get visibility into relationships between application workloads, and compute, storage, and fabric resources• Increase efficiency — reduce the tendency to overprovision blades• Use north- and south-bound statistics to drive actions that rightsize ports
Network Control Module
Network Control Module
Users Guide 39
This module extends Operations Manager to calculate costs associated with network proximity when managing work-load placement. For example, two VMs that show a lot of network traffic between each other should be placed close together. Obviously, they would see the best network performance if they were placed on the same physical host, and would exhibit latency if they were placed far from each other. With the Network Control Module, Operations Manager can compare costs of the full set of resources (such as compute and storage) with the benefits of localizing network traffic.
The Network Control Module supports the following network flow target types:
• NetFlow and sFlow Collectors
NFDUMP — VMTurbo provides an OVA download with NFDUMP preconfigured for NetFlow and sFlow collection.• Arista EOS+
When you assign a flow collector as a target, Operations Manager discovers:
• Network flow
The NetFlow or sFlow data that is being collected.• VPods
Sets of consumers that communicate frequently with each other over the network — For example, VMs that run processes for the same distributed application.
• DPods
Sets of closely connected providers — For example a storage controller, its datastores, and the hosts that consume the storage resources. A unified fabric chassis can also make up a DPod.
In this scheme, DPods provide network flow to VPods, and VPods provide flow to their constituent consumers. For example, as Operations Manager calculates the placement of a VM on a host or datastore, it considers the cost of the network flow so that VMs can reside closer together if that will lower the overall cost of their placement.
There are four levels of cost for network flow:
• Zero
The consumers use the same provider — For example VMs that reside on the same host. Such consumers have infinite net throughput capacity.
• Low
The consumers reside within the same DPod. Net throughput capacity for these consumers is determined by the capacity of the providers on the DPod.
• Medium
The consumers communicate across DPods (communicate through multiple switches). Throughput capacity is the capacity of the uplink, divided by the number of providers sharing it.
• High
The consumers communicate across the cloud.
NOTE: As a requirement for Network Control, you must have licensed either the Storage Control Module, the Fabric Control Module, or both — Operations Manager discovers DPods through storage controllers or UCS chassis. Keep in mind that DPods are an important feature of the Network Control Module. The most efficient network traffic results when each VPod can be restricted to a single provider. However, such an environment is unlikely. Operations Manager does have a likely chance of restricting most VPods to single DPods. This can give much better network performance than placing consumers arbitrarily across the hybrid datacenter.
Operations Manager Editions and Control Modules
40 VMTurbo, Inc. www.vmturbo.com
Actions
• Move a VM to improve network latency• Move a VPod across DPods• Provision a new DPod — Recommend adding a new storage controller, its datastores, and hosts consuming the
storage resources.
Associated Targets
• NetFlow flow controllers• sFlow flow controllers• Arista switches
Use Cases
• Manage workload placement and latency of distributed applications as the datacenter scales out• Move from static to dynamic or virtual networks
Requirements
The Network Control Module requires that either the Storage Control Module, the Fabric Control Module, or both are also licensed.
Container Control Module
The Container Control Module includes application containers in Operations Manager Intelligent Workload Manage-ment. You can see the containers in the Inventory View to monitor their resource utilization and drill down to the hosting VM or the providers of physical resources. If there is resource contention within the container, Operations Manager can recommend resizing the container.
VDI Control Module
Users Guide 41
Actions
• Resize container
Associated Targets
For the Container Control Module, you do not specify connections with target services. Instead, Operations Manager discovers containers running on VMs.
• Docker
Operations Manager discovers Docker containers running on VMs in your environment. To set this up you:- Create a group of VMs that host Docker containers- Expose a port on each VM for Docker Operations Manager to connect to the Docker API- For the group of VMs, specify that exposed port number in the Docker Port field of the Application Discovery
policy- For the applications running in the containers, set up application discovery (see Application Discovery on
page 379)
Use Cases
• Gain visibility into the application containers deployed in your environment• Resize containers to assure performance and efficiency
Requirements
The Container Control Module requires that the Application Control Module is also licensed.
VDI Control Module
The VDI Control Module is geared toward managing the execution of tasks across the Virtual Desktop Infrastructure. For example, executing an OS patch on hundreds or thousands of VMs at the same time is sure to impact resource capacity such as IOPS on your datastores.
To manage the execution of jobs across the VDI, this control module uses an Actions Manager that throttles the num-ber of jobs to run at one time, and queue pending job requests. Job requests appear as actions in the To Do list, and Operations Manager then executes these actions automatically.
Setting up VDI jobs and registering them with the Actions Manager requires a certain amount of scripting. Please con-sult the REST API documentation, and feel free to contact VMTurbo support.

Operations Manager Editions and Control Modules
42 VMTurbo, Inc. www.vmturbo.com
Use Cases
• Manage job execution across all the virtual desktops in your environment
Requirements
The VDI Control Module requires that the Storage Control Module is also licensed.
Users Guide 43
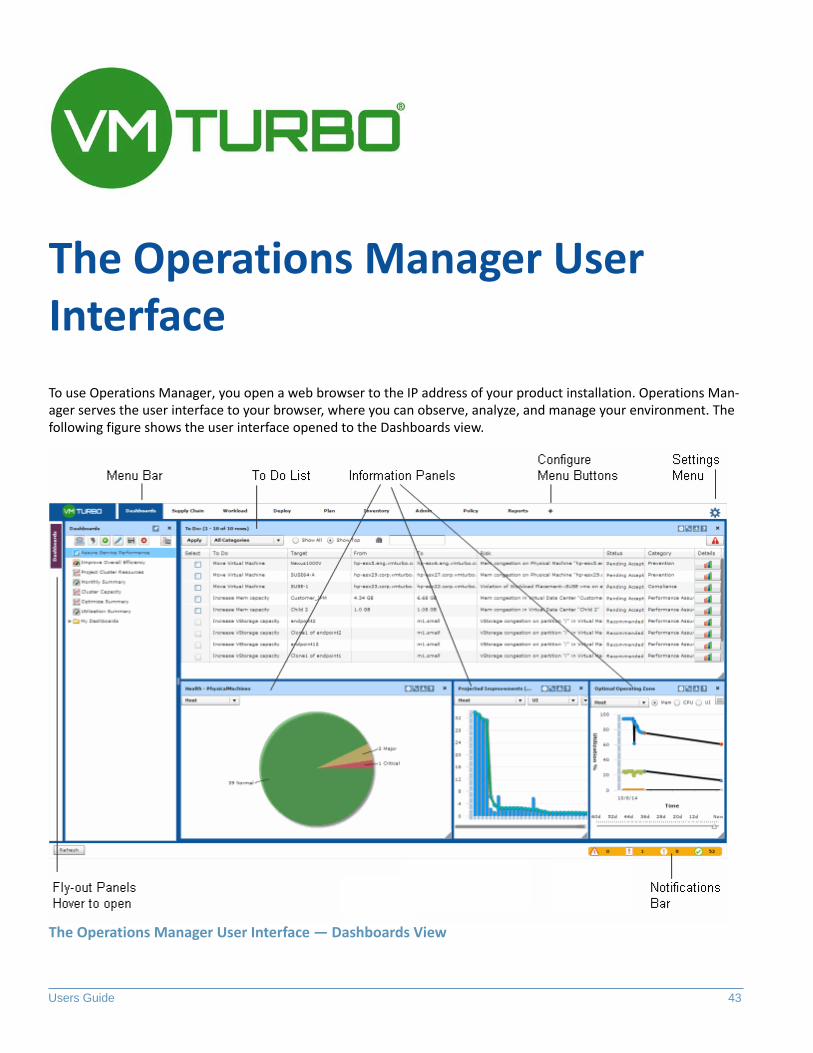
The Operations Manager User Interface
To use Operations Manager, you open a web browser to the IP address of your product installation. Operations Man-ager serves the user interface to your browser, where you can observe, analyze, and manage your environment. The following figure shows the user interface opened to the Dashboards view.
The Operations Manager User Interface — Dashboards View
The Operations Manager User Interface
44 VMTurbo, Inc. www.vmturbo.com
This section describes the different components of the user interface, including the following:
• Menu Bar on page 44• Tool Bar on page 46• Fly-out Panels on page 47• Notifications Bar on page 51• Standard Panel Controls on page 52• Information Panels on page 59• Utilization History on page 68
Menu Bar
Operations Manager presents views for the different activities you can perform. The menu bar at the top of the appli-cation window includes buttons you click to display these views. Operations Manager provides the following views:
• The Dashboards View on page 82 — See dashboards that focus on:- Assuring service performance- Maintaining efficient allocation of resources- Projecting future resource requirements for clusters- Trending environment status over the last month- Headroom capacity for VMs on clusters- How recommended actions impact costs to consumers and profit margin to providers- A comparison of the current state to the improvements you can expect- Overviews of your environment
• The Supply Chain View on page 119
Follow the supply chain to navigate your inventory and see supply/demand relationships between entities.• The Workload View on page 157
See charts that show the current workload distribution compared to the most desirable workload distribution.• The Deploy View on page 163
Use Operations Manager to deploy new VMs in your environment, while maintaining the environment within the desired state.
• The Plan View on page 178
Run what-if scenarios to investigate how to change your infrastructure to achieve optimal performance.• The Inventory View on page 224
See real-time and historical information about the various resources, services, and components in your environment.
• The Admin View on page 277
Attach Operations Manager to specific hypervisors, create user accounts, specify data retention policies, and perform other maintenance activities.
• The Policy View on page 336
Define groups and make settings to define workload placement, analysis, and other policies.• The Reports View on page 395
View reports and manage subscriptions.
You can also open views to show information about specific components. For example, when you search for a specific virtual machine (see Search in Tool Bar on page 46), Operations Manager opens a new view for that VM. That view includes a navigation panel and information panels that list only information about the given VM. When you are through with this kind of view, click the view button’s close box to discard it.
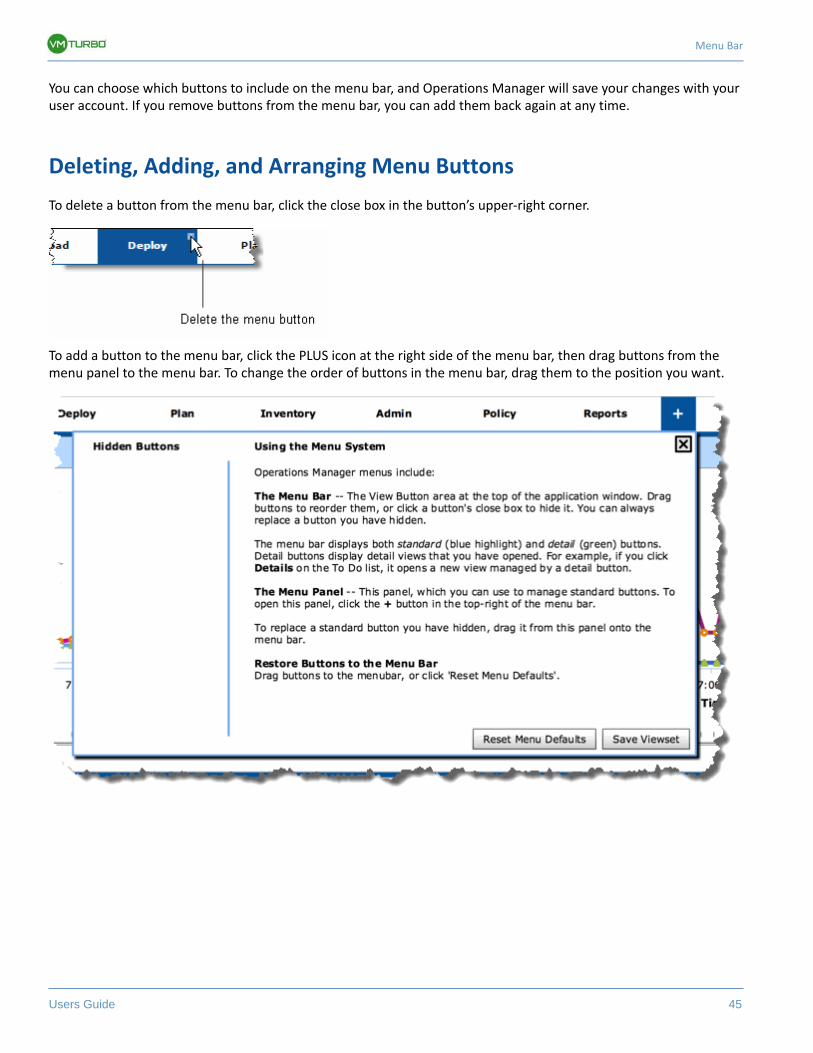
Menu Bar
Users Guide 45
You can choose which buttons to include on the menu bar, and Operations Manager will save your changes with your user account. If you remove buttons from the menu bar, you can add them back again at any time.
Deleting, Adding, and Arranging Menu Buttons
To delete a button from the menu bar, click the close box in the button’s upper-right corner.
To add a button to the menu bar, click the PLUS icon at the right side of the menu bar, then drag buttons from the menu panel to the menu bar. To change the order of buttons in the menu bar, drag them to the position you want.
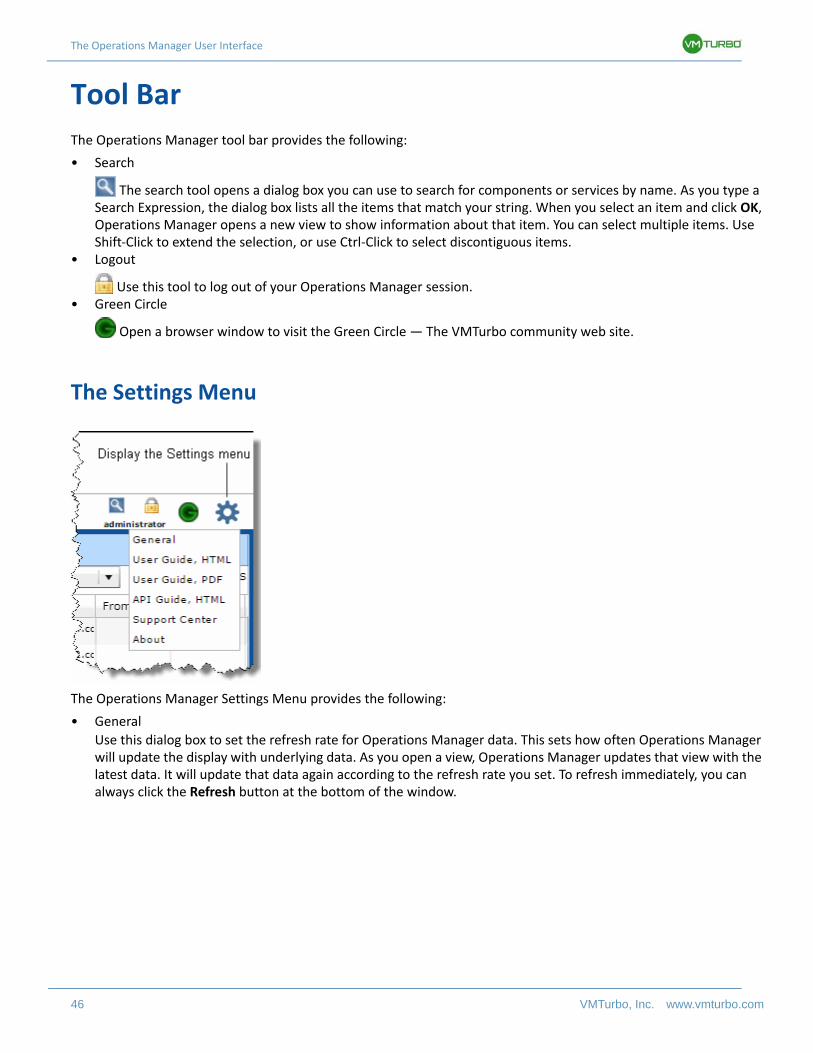
The Operations Manager User Interface
46 VMTurbo, Inc. www.vmturbo.com
Tool Bar
The Operations Manager tool bar provides the following:
• Search
The search tool opens a dialog box you can use to search for components or services by name. As you type a Search Expression, the dialog box lists all the items that match your string. When you select an item and click OK, Operations Manager opens a new view to show information about that item. You can select multiple items. Use Shift-Click to extend the selection, or use Ctrl-Click to select discontiguous items.
• Logout
Use this tool to log out of your Operations Manager session.• Green Circle
Open a browser window to visit the Green Circle — The VMTurbo community web site.
The Settings Menu
The Operations Manager Settings Menu provides the following:
• General
Use this dialog box to set the refresh rate for Operations Manager data. This sets how often Operations Manager will update the display with underlying data. As you open a view, Operations Manager updates that view with the latest data. It will update that data again according to the refresh rate you set. To refresh immediately, you can always click the Refresh button at the bottom of the window.
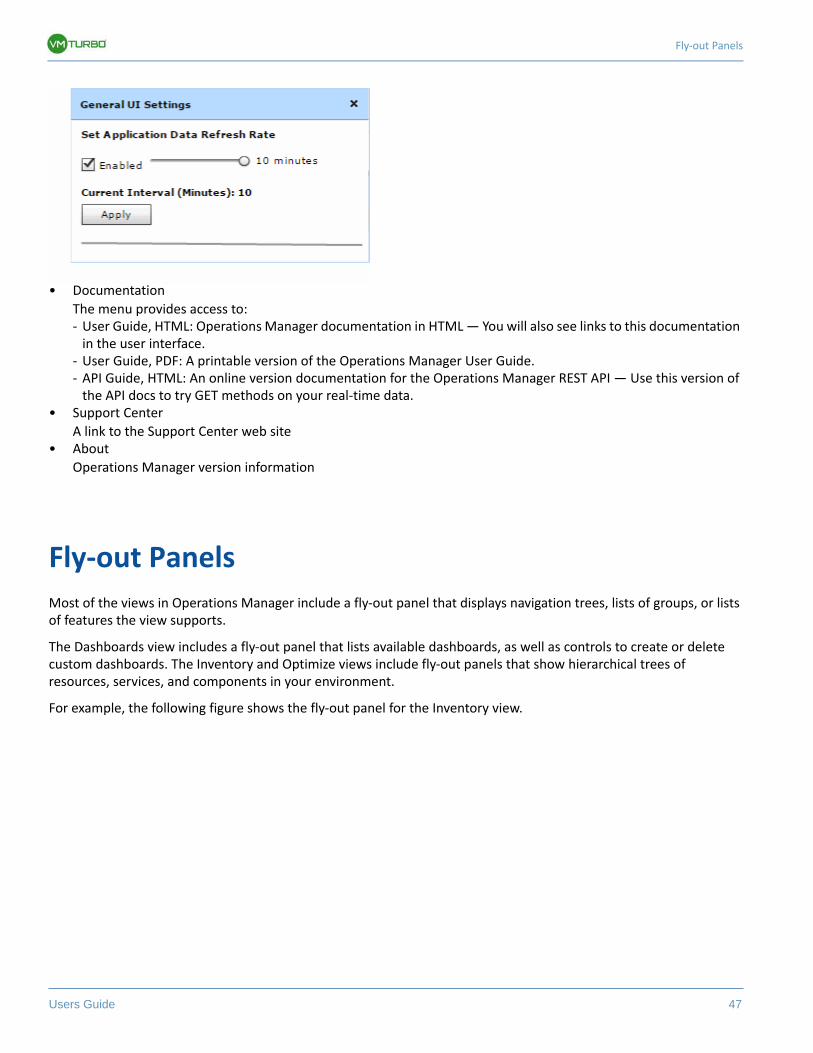
Fly-out Panels
Users Guide 47
• Documentation
The menu provides access to:- User Guide, HTML: Operations Manager documentation in HTML — You will also see links to this documentation
in the user interface.- User Guide, PDF: A printable version of the Operations Manager User Guide.- API Guide, HTML: An online version documentation for the Operations Manager REST API — Use this version of
the API docs to try GET methods on your real-time data.• Support Center
A link to the Support Center web site• About
Operations Manager version information
Fly-out Panels
Most of the views in Operations Manager include a fly-out panel that displays navigation trees, lists of groups, or lists of features the view supports.
The Dashboards view includes a fly-out panel that lists available dashboards, as well as controls to create or delete custom dashboards. The Inventory and Optimize views include fly-out panels that show hierarchical trees of resources, services, and components in your environment.
For example, the following figure shows the fly-out panel for the Inventory view.
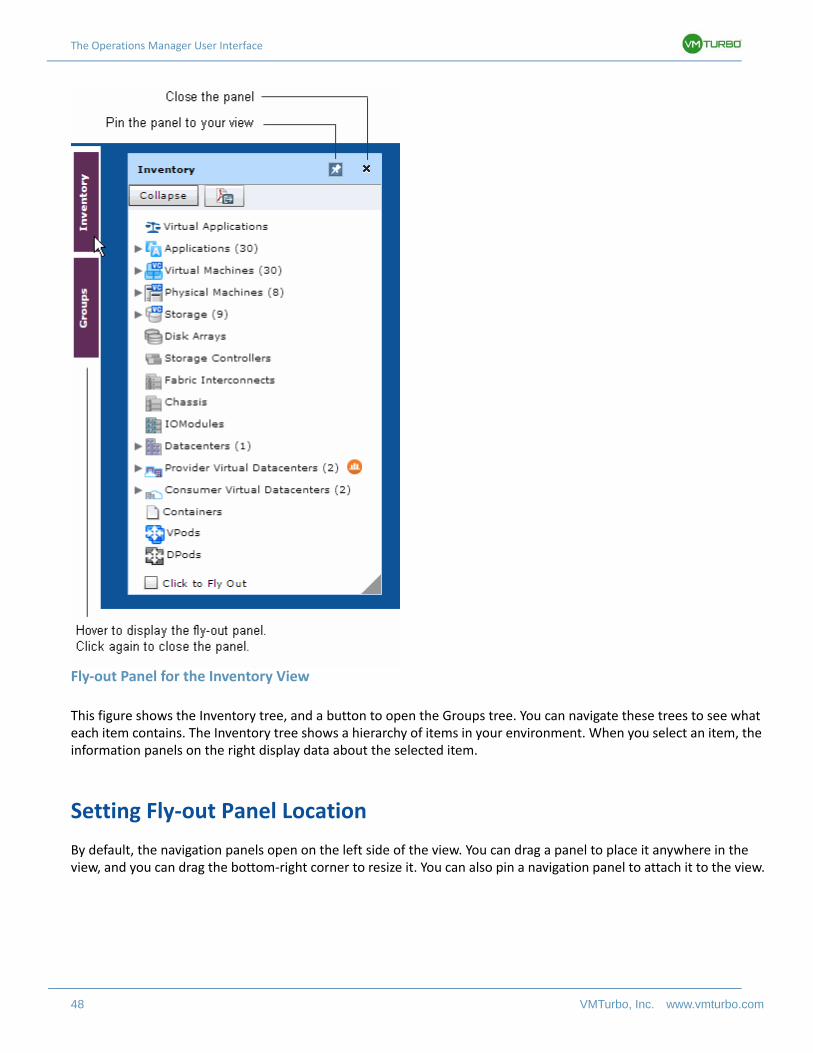
The Operations Manager User Interface
48 VMTurbo, Inc. www.vmturbo.com
Fly-out Panel for the Inventory View
This figure shows the Inventory tree, and a button to open the Groups tree. You can navigate these trees to see what each item contains. The Inventory tree shows a hierarchy of items in your environment. When you select an item, the information panels on the right display data about the selected item.
Setting Fly-out Panel Location
By default, the navigation panels open on the left side of the view. You can drag a panel to place it anywhere in the view, and you can drag the bottom-right corner to resize it. You can also pin a navigation panel to attach it to the view.
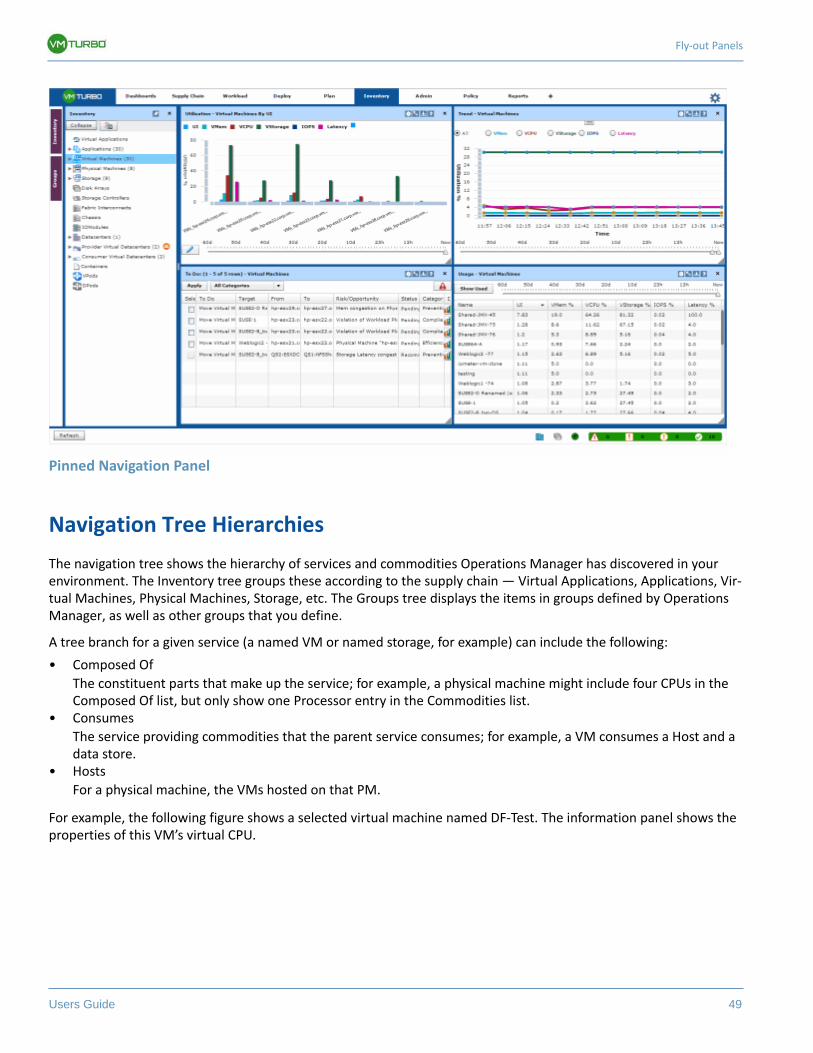
Fly-out Panels
Users Guide 49
Pinned Navigation Panel
Navigation Tree Hierarchies
The navigation tree shows the hierarchy of services and commodities Operations Manager has discovered in your environment. The Inventory tree groups these according to the supply chain — Virtual Applications, Applications, Vir-tual Machines, Physical Machines, Storage, etc. The Groups tree displays the items in groups defined by Operations Manager, as well as other groups that you define.
A tree branch for a given service (a named VM or named storage, for example) can include the following:
• Composed Of
The constituent parts that make up the service; for example, a physical machine might include four CPUs in the Composed Of list, but only show one Processor entry in the Commodities list.
• Consumes
The service providing commodities that the parent service consumes; for example, a VM consumes a Host and a data store.
• Hosts
For a physical machine, the VMs hosted on that PM.
For example, the following figure shows a selected virtual machine named DF-Test. The information panel shows the properties of this VM’s virtual CPU.
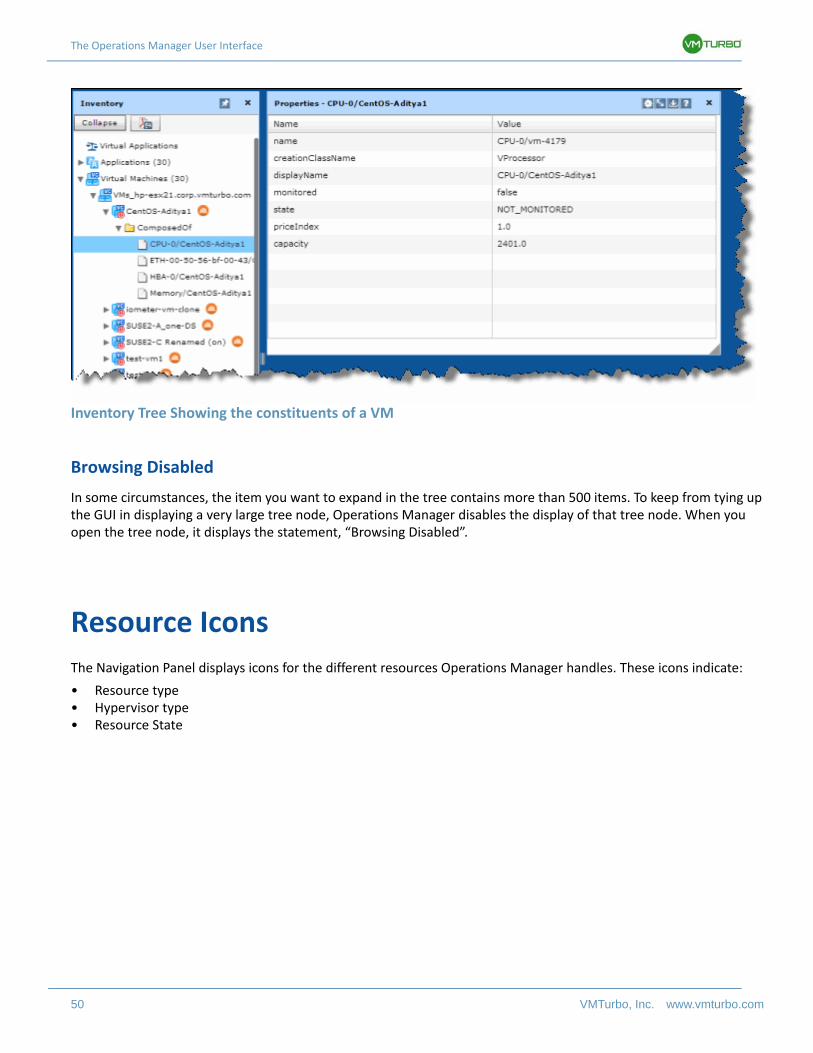
The Operations Manager User Interface
50 VMTurbo, Inc. www.vmturbo.com
Inventory Tree Showing the constituents of a VM
Browsing Disabled
In some circumstances, the item you want to expand in the tree contains more than 500 items. To keep from tying up the GUI in displaying a very large tree node, Operations Manager disables the display of that tree node. When you open the tree node, it displays the statement, “Browsing Disabled”.
Resource Icons
The Navigation Panel displays icons for the different resources Operations Manager handles. These icons indicate:
• Resource type• Hypervisor type• Resource State
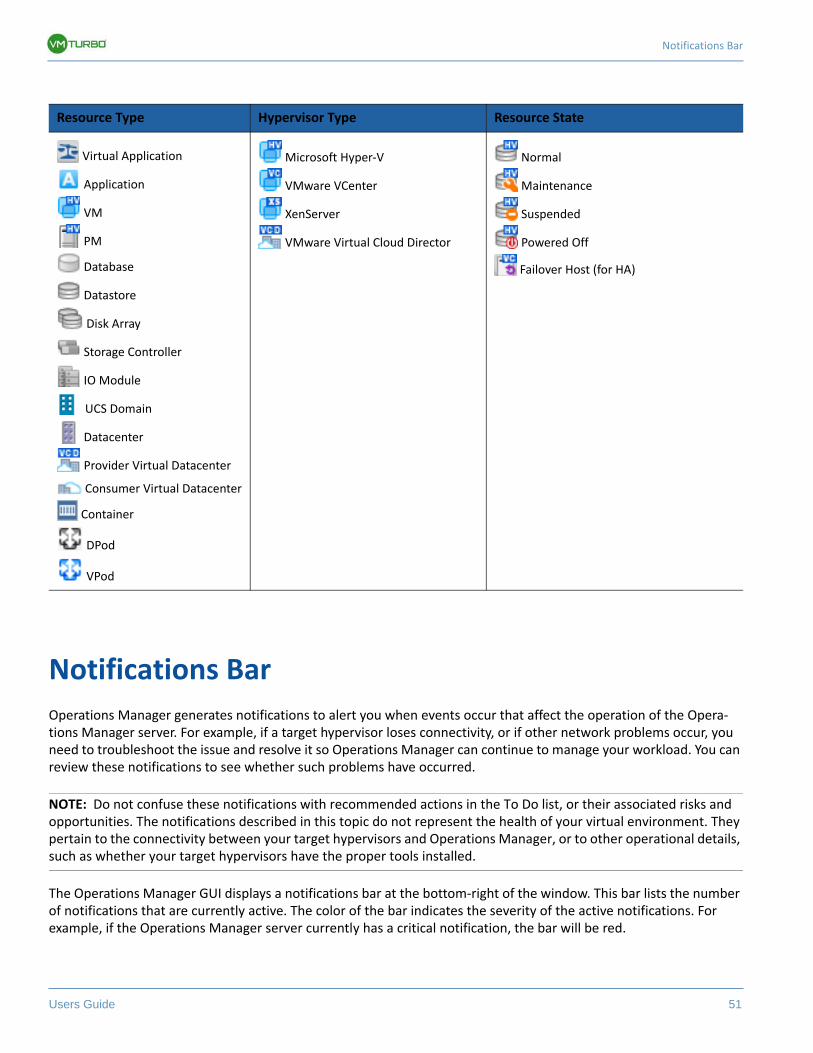
Notifications Bar
Users Guide 51
Notifications Bar
Operations Manager generates notifications to alert you when events occur that affect the operation of the Opera-tions Manager server. For example, if a target hypervisor loses connectivity, or if other network problems occur, you need to troubleshoot the issue and resolve it so Operations Manager can continue to manage your workload. You can review these notifications to see whether such problems have occurred.
NOTE: Do not confuse these notifications with recommended actions in the To Do list, or their associated risks and opportunities. The notifications described in this topic do not represent the health of your virtual environment. They pertain to the connectivity between your target hypervisors and Operations Manager, or to other operational details, such as whether your target hypervisors have the proper tools installed.
The Operations Manager GUI displays a notifications bar at the bottom-right of the window. This bar lists the number of notifications that are currently active. The color of the bar indicates the severity of the active notifications. For example, if the Operations Manager server currently has a critical notification, the bar will be red.
Resource Type Hypervisor Type Resource State
Virtual Application
Application
VM
PM
Database
Datastore
Disk Array
Storage Controller
IO Module
UCS Domain
Datacenter
Provider Virtual Datacenter
Consumer Virtual Datacenter
Container
DPod
VPod
Microsoft Hyper-V
VMware VCenter
XenServer
VMware Virtual Cloud Director
Normal
Maintenance
Suspended
Powered Off
Failover Host (for HA)
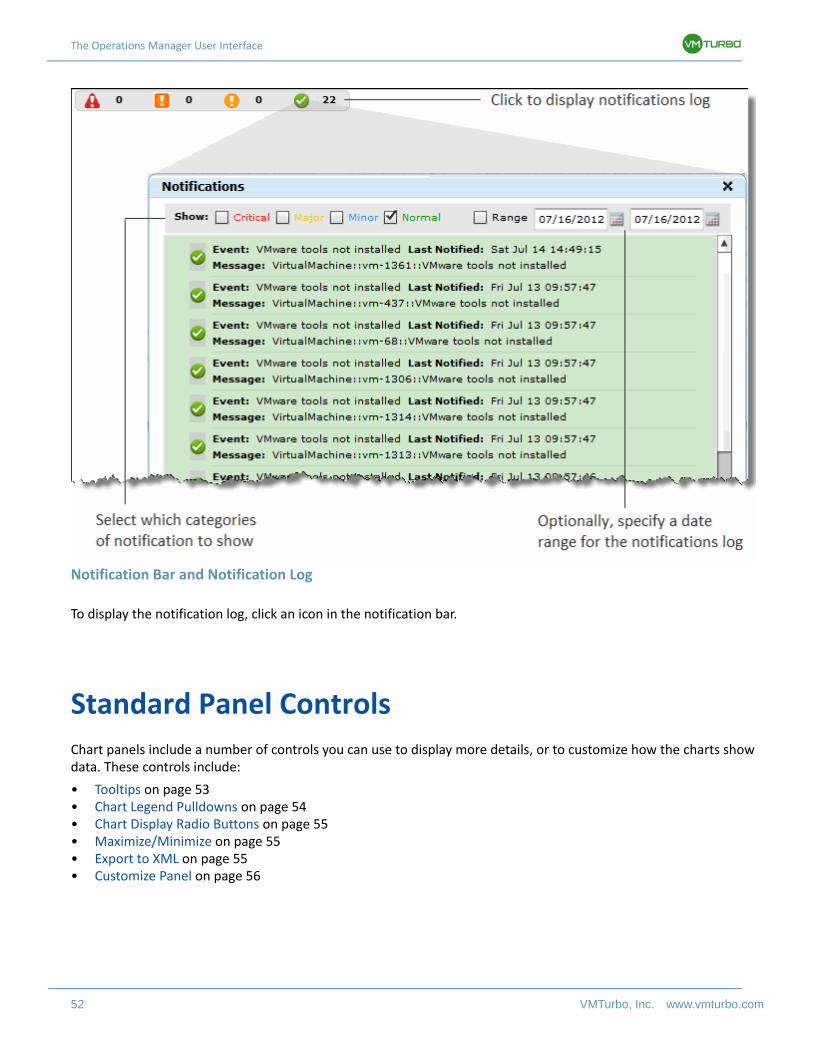
The Operations Manager User Interface
52 VMTurbo, Inc. www.vmturbo.com
Notification Bar and Notification Log
To display the notification log, click an icon in the notification bar.
Standard Panel Controls
Chart panels include a number of controls you can use to display more details, or to customize how the charts show data. These controls include:
• Tooltips on page 53• Chart Legend Pulldowns on page 54• Chart Display Radio Buttons on page 55• Maximize/Minimize on page 55• Export to XML on page 55• Customize Panel on page 56
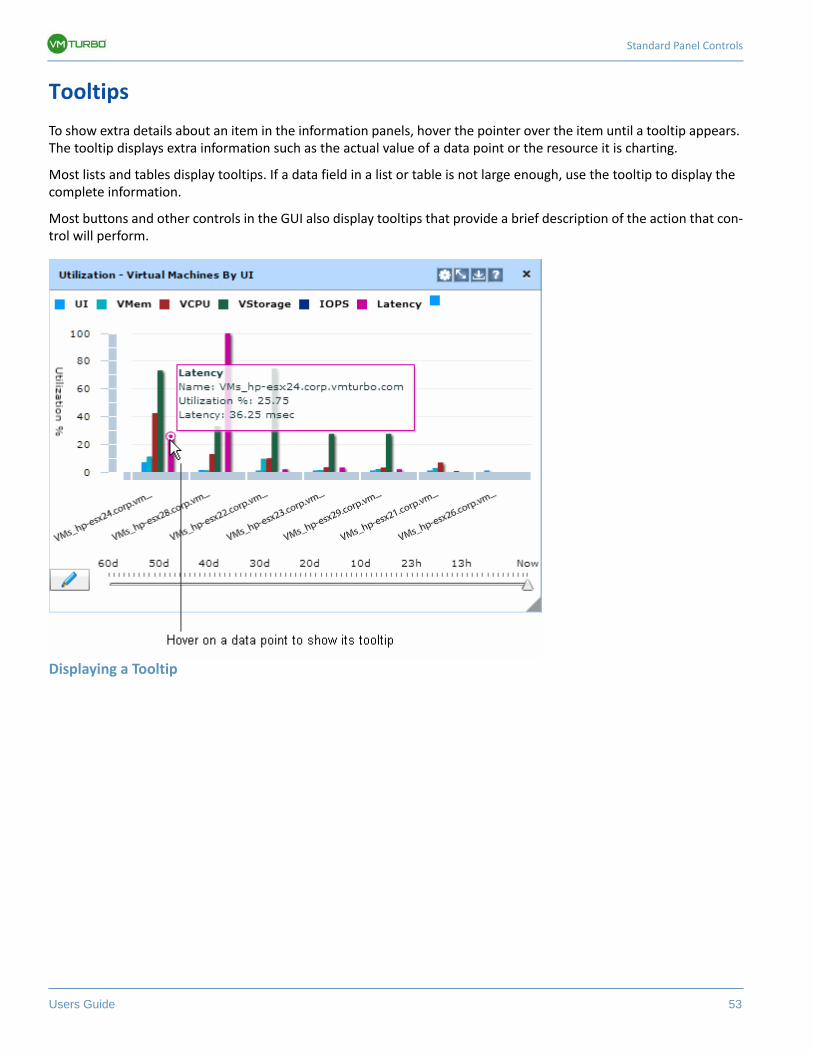
Standard Panel Controls
Users Guide 53
Tooltips
To show extra details about an item in the information panels, hover the pointer over the item until a tooltip appears. The tooltip displays extra information such as the actual value of a data point or the resource it is charting.
Most lists and tables display tooltips. If a data field in a list or table is not large enough, use the tooltip to display the complete information.
Most buttons and other controls in the GUI also display tooltips that provide a brief description of the action that con-trol will perform.
Displaying a Tooltip
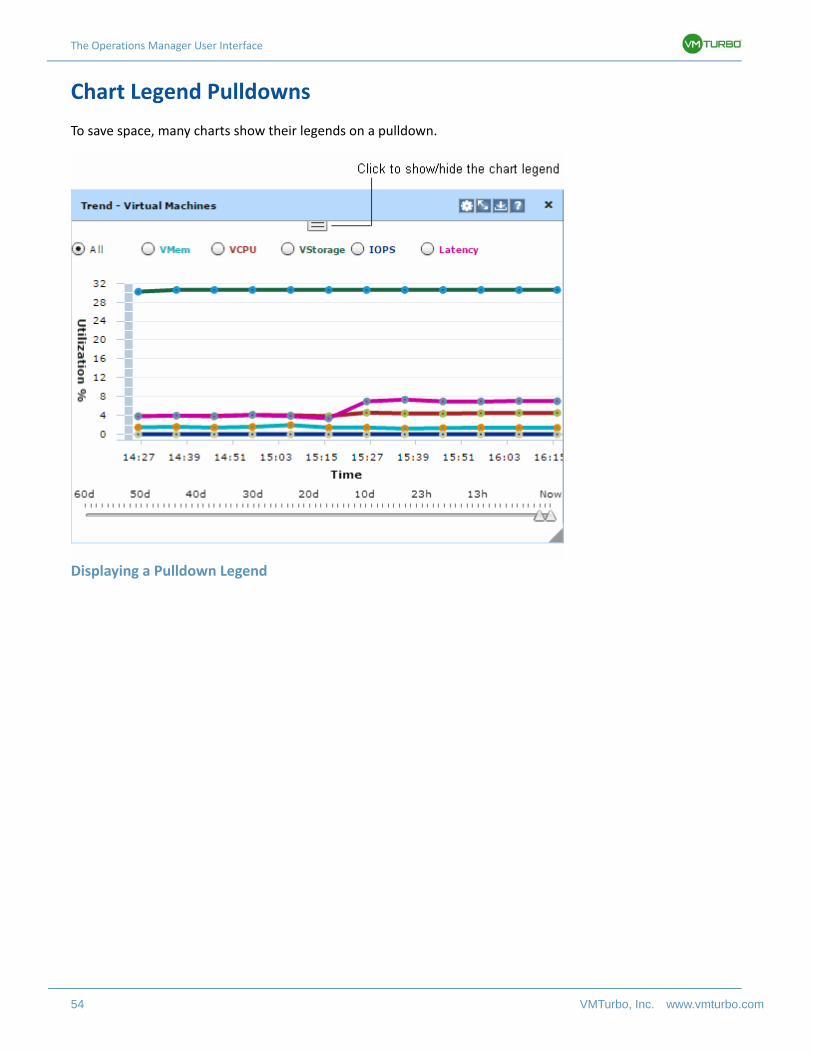
The Operations Manager User Interface
54 VMTurbo, Inc. www.vmturbo.com
Chart Legend Pulldowns
To save space, many charts show their legends on a pulldown.
Displaying a Pulldown Legend
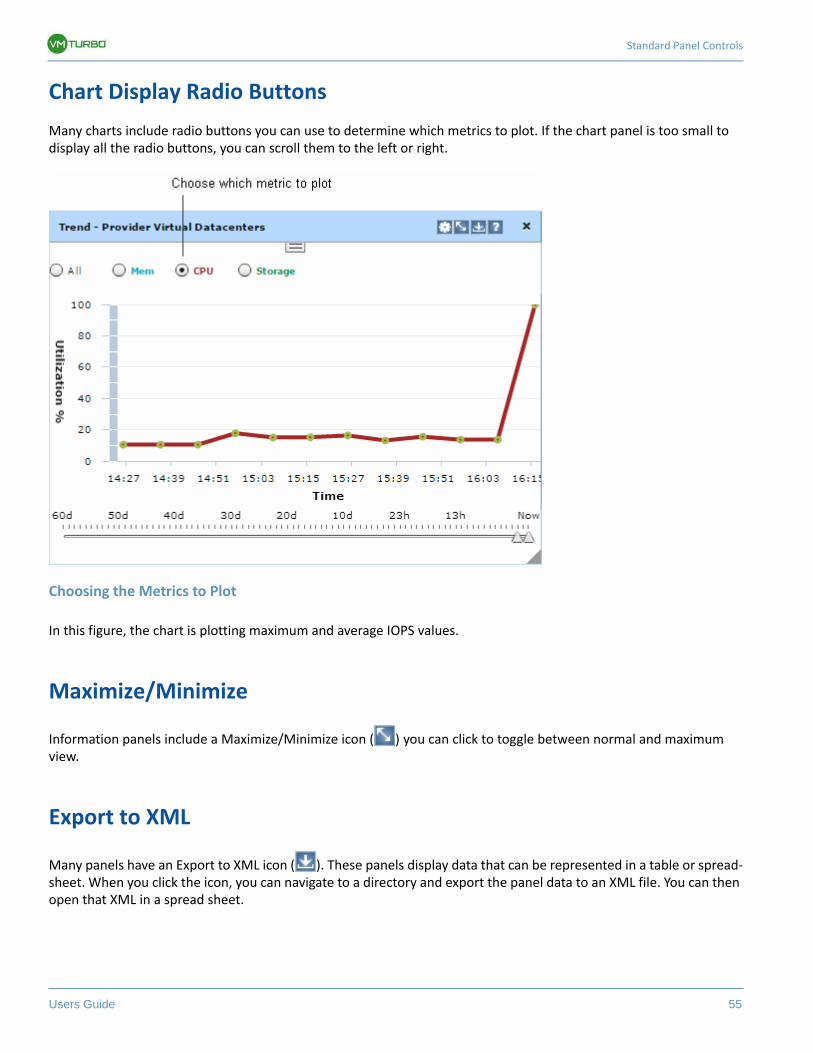
Standard Panel Controls
Users Guide 55
Chart Display Radio Buttons
Many charts include radio buttons you can use to determine which metrics to plot. If the chart panel is too small to display all the radio buttons, you can scroll them to the left or right.
Choosing the Metrics to Plot
In this figure, the chart is plotting maximum and average IOPS values.
Maximize/Minimize
Information panels include a Maximize/Minimize icon ( ) you can click to toggle between normal and maximum view.
Export to XML
Many panels have an Export to XML icon ( ). These panels display data that can be represented in a table or spread-sheet. When you click the icon, you can navigate to a directory and export the panel data to an XML file. You can then open that XML in a spread sheet.
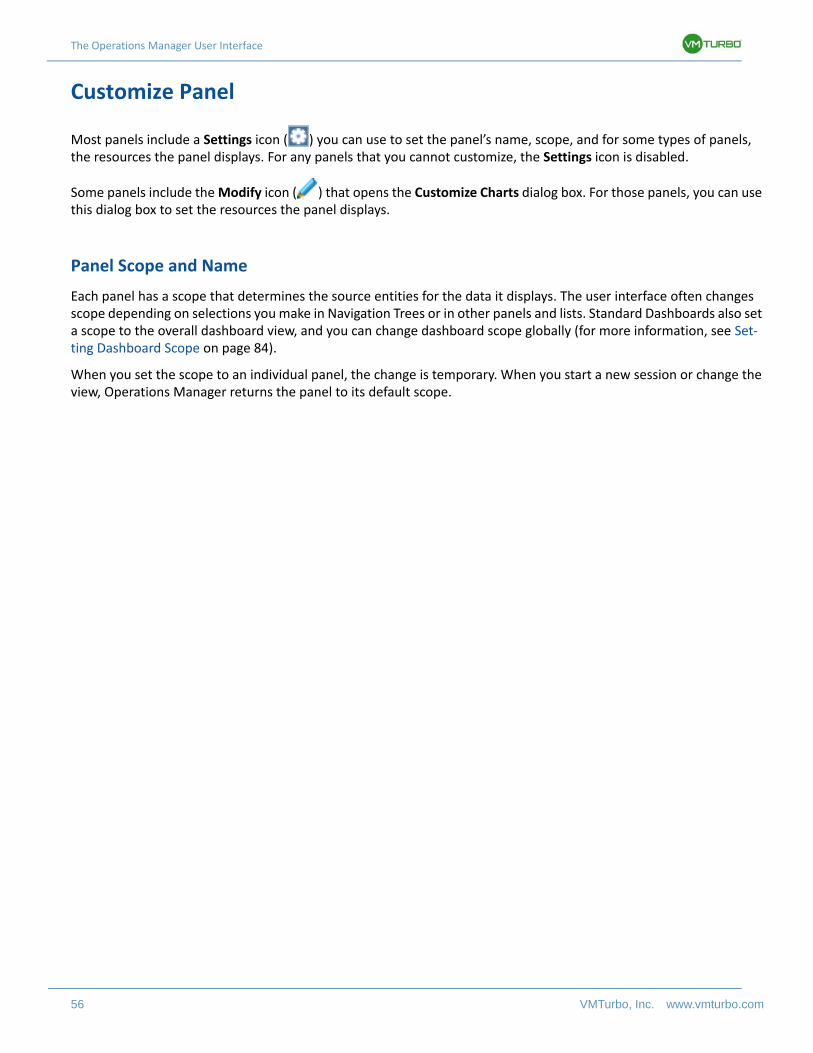
The Operations Manager User Interface
56 VMTurbo, Inc. www.vmturbo.com
Customize Panel
Most panels include a Settings icon ( ) you can use to set the panel’s name, scope, and for some types of panels, the resources the panel displays. For any panels that you cannot customize, the Settings icon is disabled.
Some panels include the Modify icon ( ) that opens the Customize Charts dialog box. For those panels, you can use this dialog box to set the resources the panel displays.
Panel Scope and Name
Each panel has a scope that determines the source entities for the data it displays. The user interface often changes scope depending on selections you make in Navigation Trees or in other panels and lists. Standard Dashboards also set a scope to the overall dashboard view, and you can change dashboard scope globally (for more information, see Set-ting Dashboard Scope on page 84).
When you set the scope to an individual panel, the change is temporary. When you start a new session or change the view, Operations Manager returns the panel to its default scope.
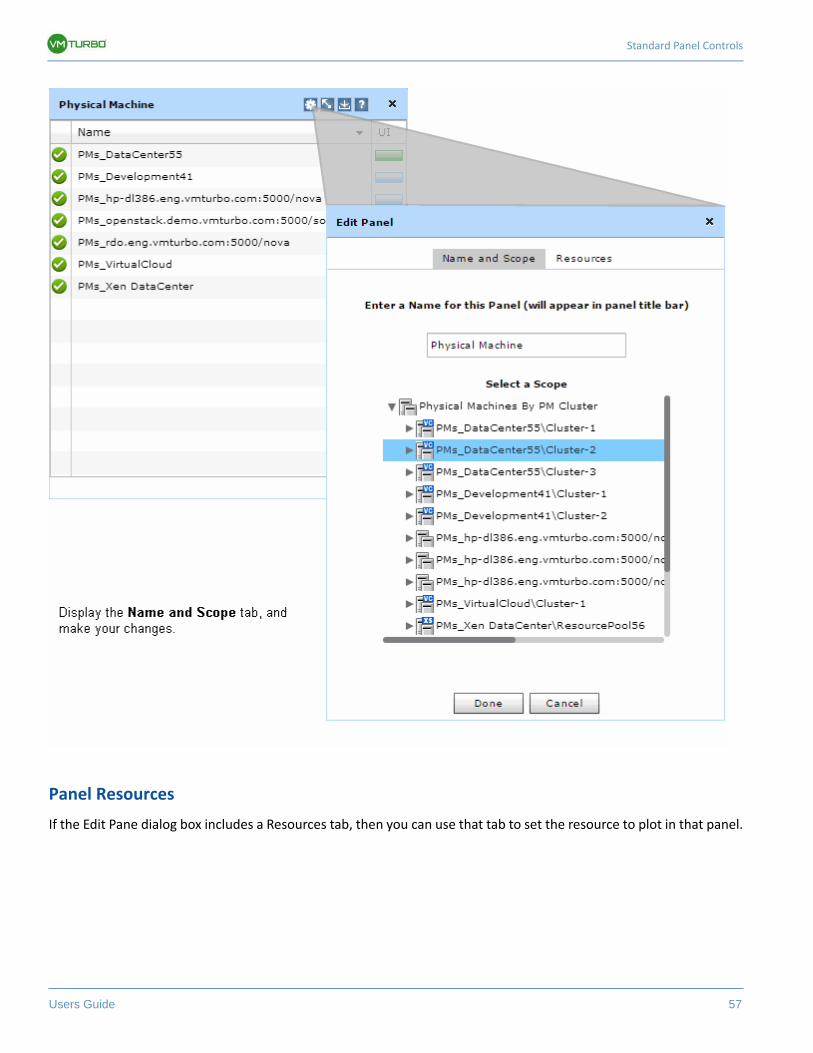
Standard Panel Controls
Users Guide 57
Panel Resources
If the Edit Pane dialog box includes a Resources tab, then you can use that tab to set the resource to plot in that panel.
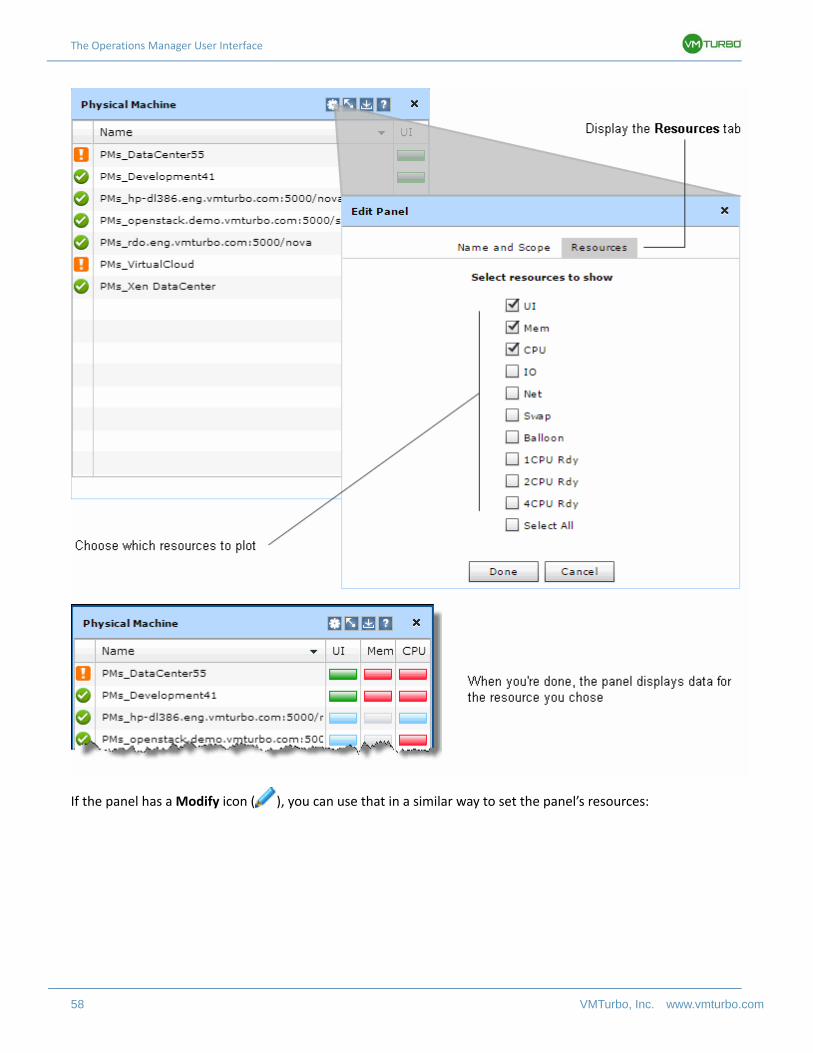
The Operations Manager User Interface
58 VMTurbo, Inc. www.vmturbo.com
If the panel has a Modify icon ( ), you can use that in a similar way to set the panel’s resources:
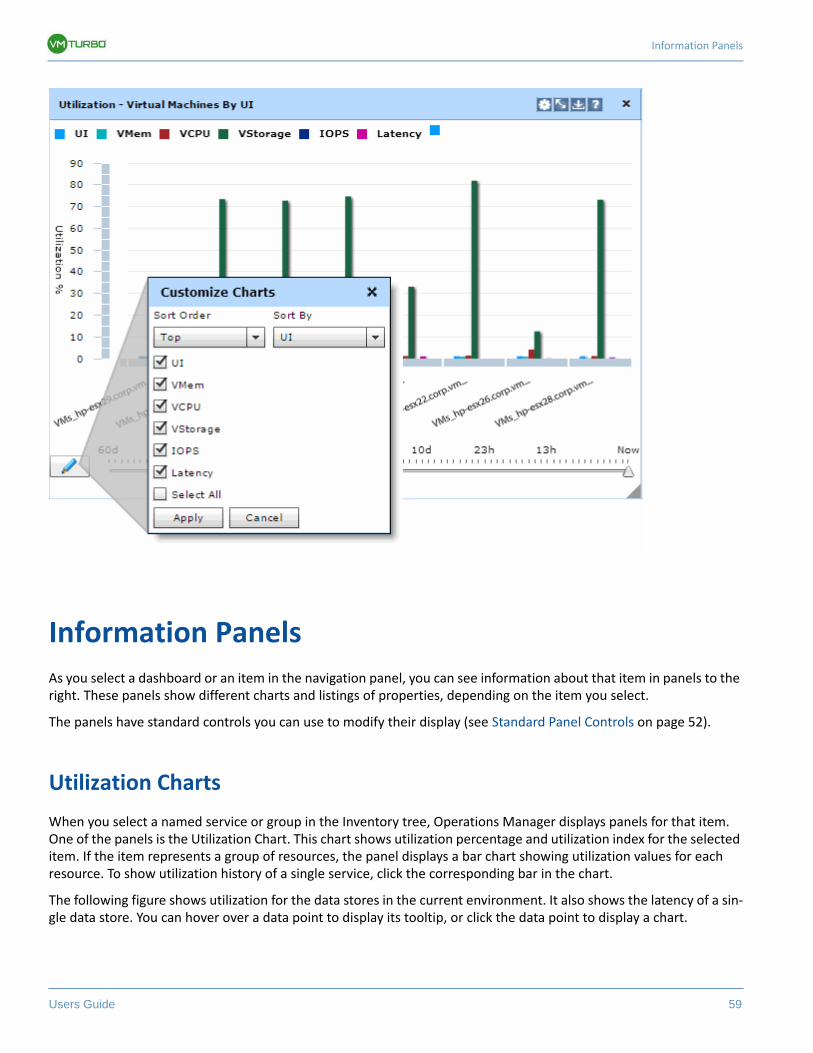
Information Panels
Users Guide 59
Information Panels
As you select a dashboard or an item in the navigation panel, you can see information about that item in panels to the right. These panels show different charts and listings of properties, depending on the item you select.
The panels have standard controls you can use to modify their display (see Standard Panel Controls on page 52).
Utilization Charts
When you select a named service or group in the Inventory tree, Operations Manager displays panels for that item. One of the panels is the Utilization Chart. This chart shows utilization percentage and utilization index for the selected item. If the item represents a group of resources, the panel displays a bar chart showing utilization values for each resource. To show utilization history of a single service, click the corresponding bar in the chart.
The following figure shows utilization for the data stores in the current environment. It also shows the latency of a sin-gle data store. You can hover over a data point to display its tooltip, or click the data point to display a chart.
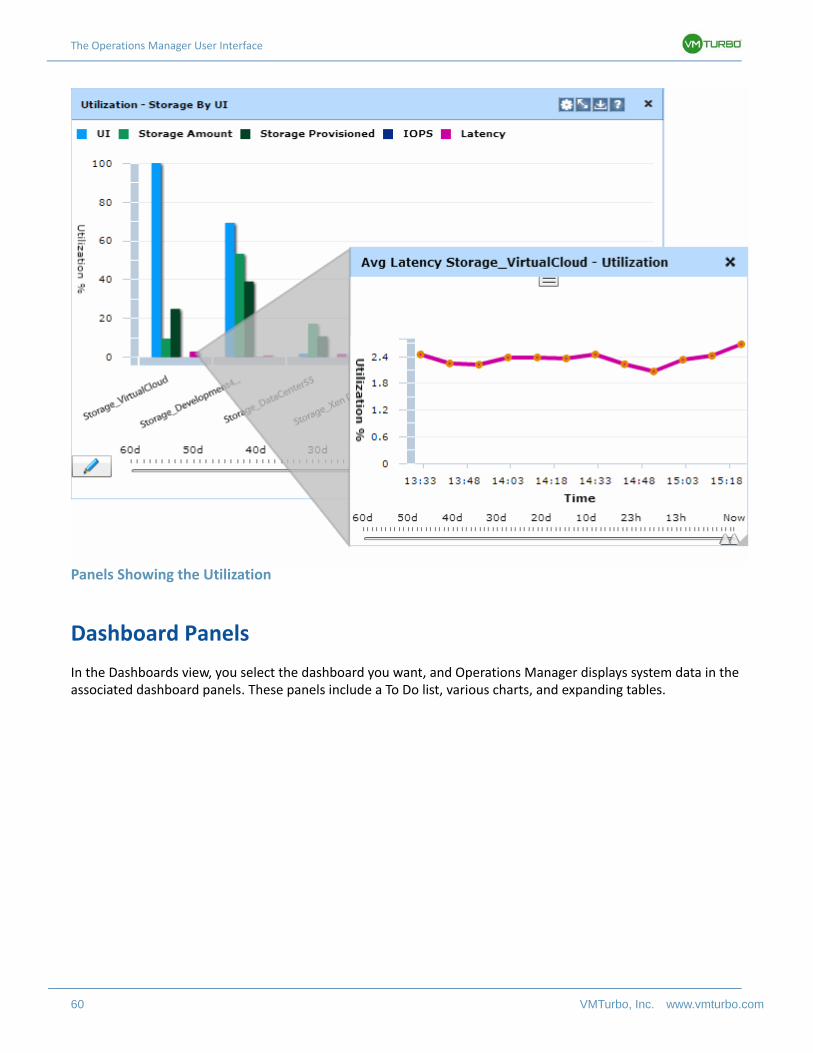
The Operations Manager User Interface
60 VMTurbo, Inc. www.vmturbo.com
Panels Showing the Utilization
Dashboard Panels
In the Dashboards view, you select the dashboard you want, and Operations Manager displays system data in the associated dashboard panels. These panels include a To Do list, various charts, and expanding tables.
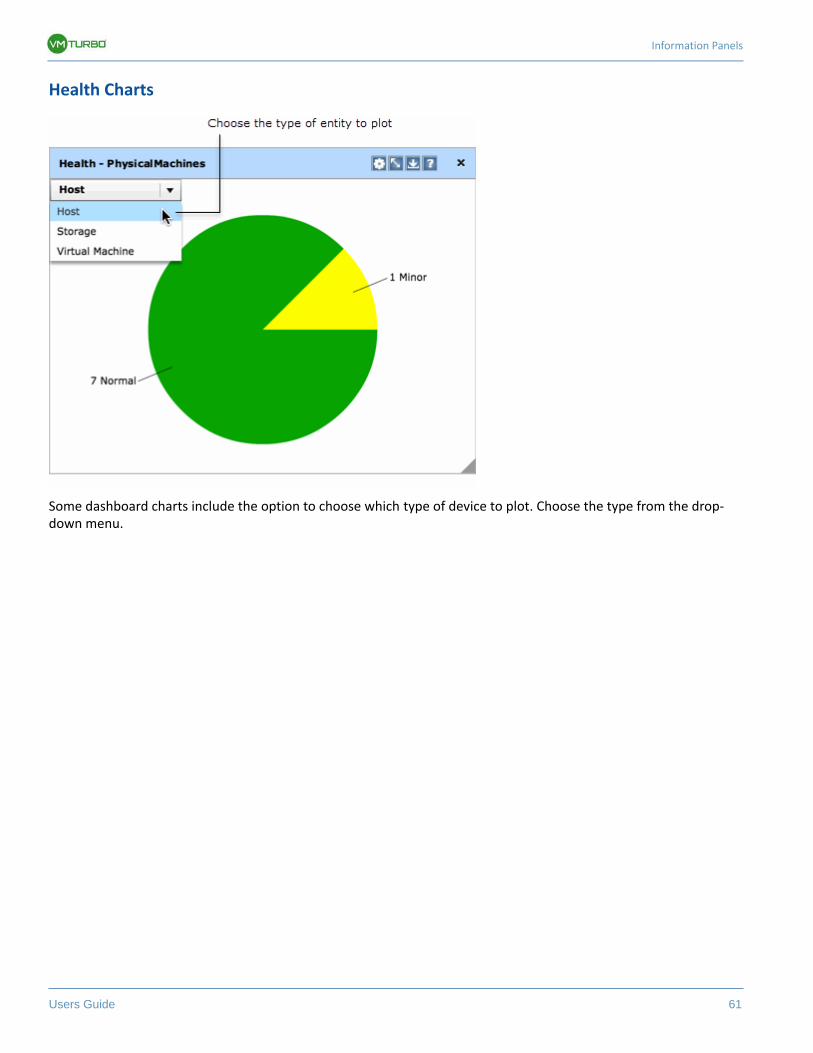
Information Panels
Users Guide 61
Health Charts
Some dashboard charts include the option to choose which type of device to plot. Choose the type from the drop-down menu.
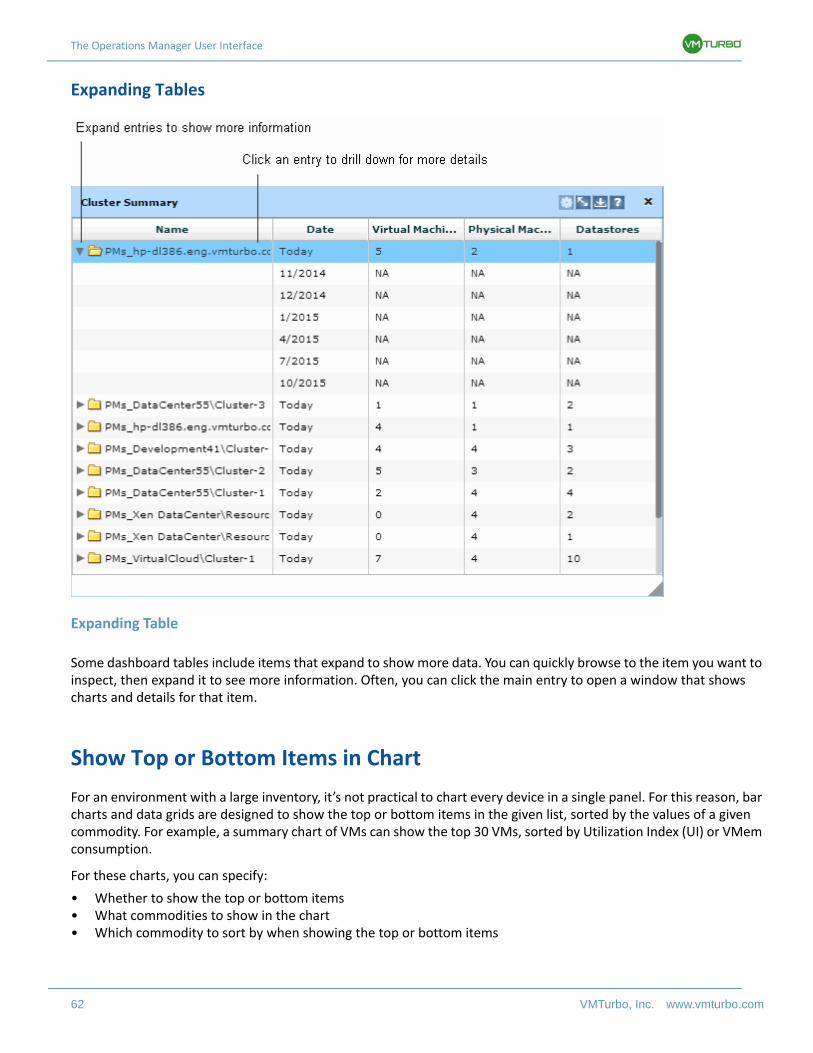
The Operations Manager User Interface
62 VMTurbo, Inc. www.vmturbo.com
Expanding Tables
Expanding Table
Some dashboard tables include items that expand to show more data. You can quickly browse to the item you want to inspect, then expand it to see more information. Often, you can click the main entry to open a window that shows charts and details for that item.
Show Top or Bottom Items in Chart
For an environment with a large inventory, it’s not practical to chart every device in a single panel. For this reason, bar charts and data grids are designed to show the top or bottom items in the given list, sorted by the values of a given commodity. For example, a summary chart of VMs can show the top 30 VMs, sorted by Utilization Index (UI) or VMem consumption.
For these charts, you can specify:
• Whether to show the top or bottom items• What commodities to show in the chart• Which commodity to sort by when showing the top or bottom items
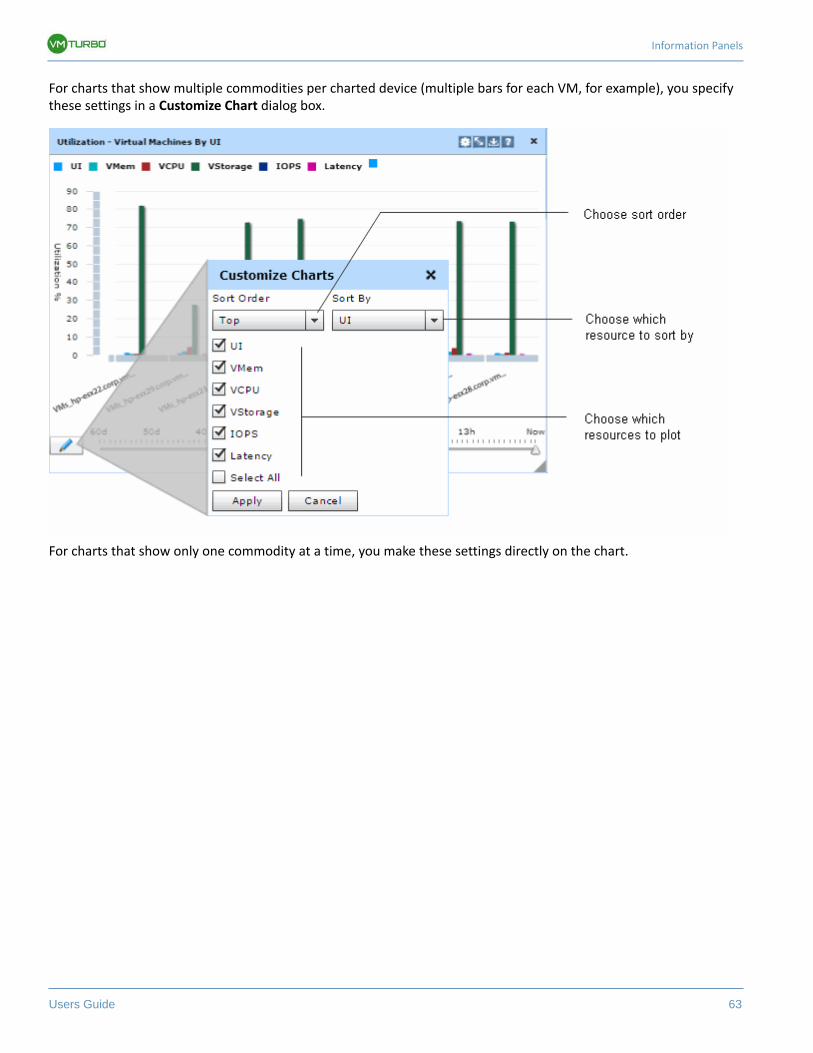
Information Panels
Users Guide 63
For charts that show multiple commodities per charted device (multiple bars for each VM, for example), you specify these settings in a Customize Chart dialog box.
For charts that show only one commodity at a time, you make these settings directly on the chart.
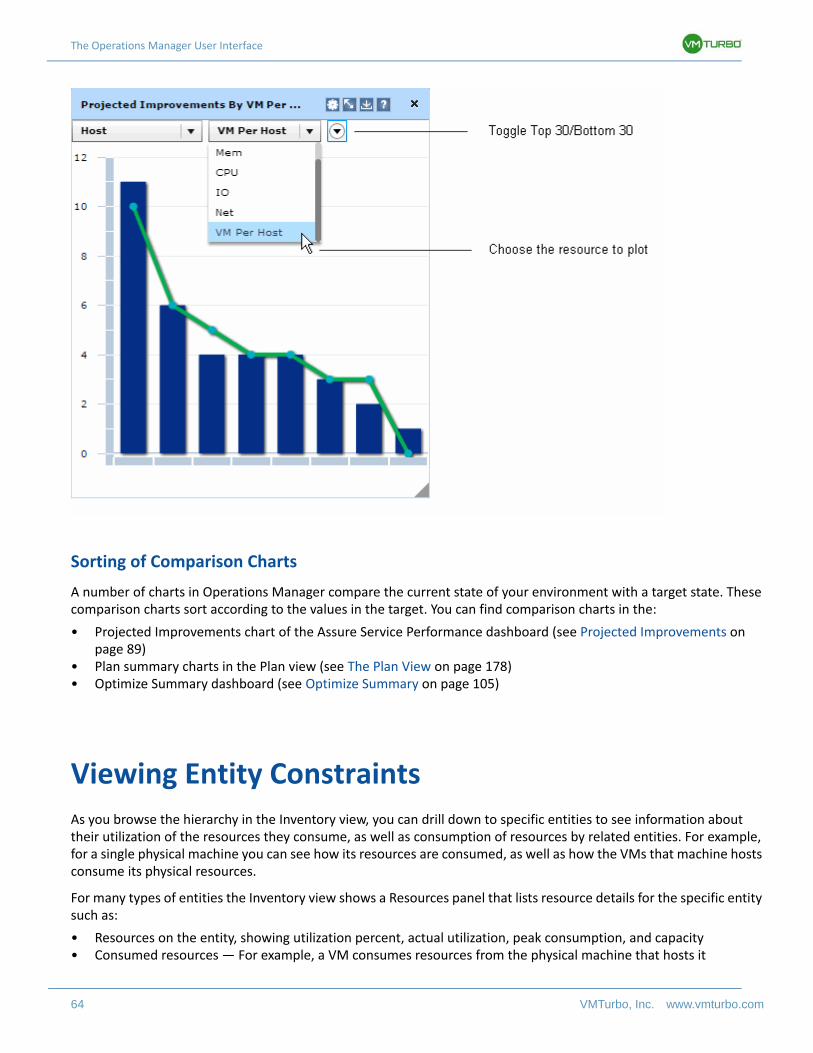
The Operations Manager User Interface
64 VMTurbo, Inc. www.vmturbo.com
Sorting of Comparison Charts
A number of charts in Operations Manager compare the current state of your environment with a target state. These comparison charts sort according to the values in the target. You can find comparison charts in the:
• Projected Improvements chart of the Assure Service Performance dashboard (see Projected Improvements on page 89)
• Plan summary charts in the Plan view (see The Plan View on page 178)• Optimize Summary dashboard (see Optimize Summary on page 105)
Viewing Entity Constraints
As you browse the hierarchy in the Inventory view, you can drill down to specific entities to see information about their utilization of the resources they consume, as well as consumption of resources by related entities. For example, for a single physical machine you can see how its resources are consumed, as well as how the VMs that machine hosts consume its physical resources.
For many types of entities the Inventory view shows a Resources panel that lists resource details for the specific entity such as:
• Resources on the entity, showing utilization percent, actual utilization, peak consumption, and capacity• Consumed resources — For example, a VM consumes resources from the physical machine that hosts it
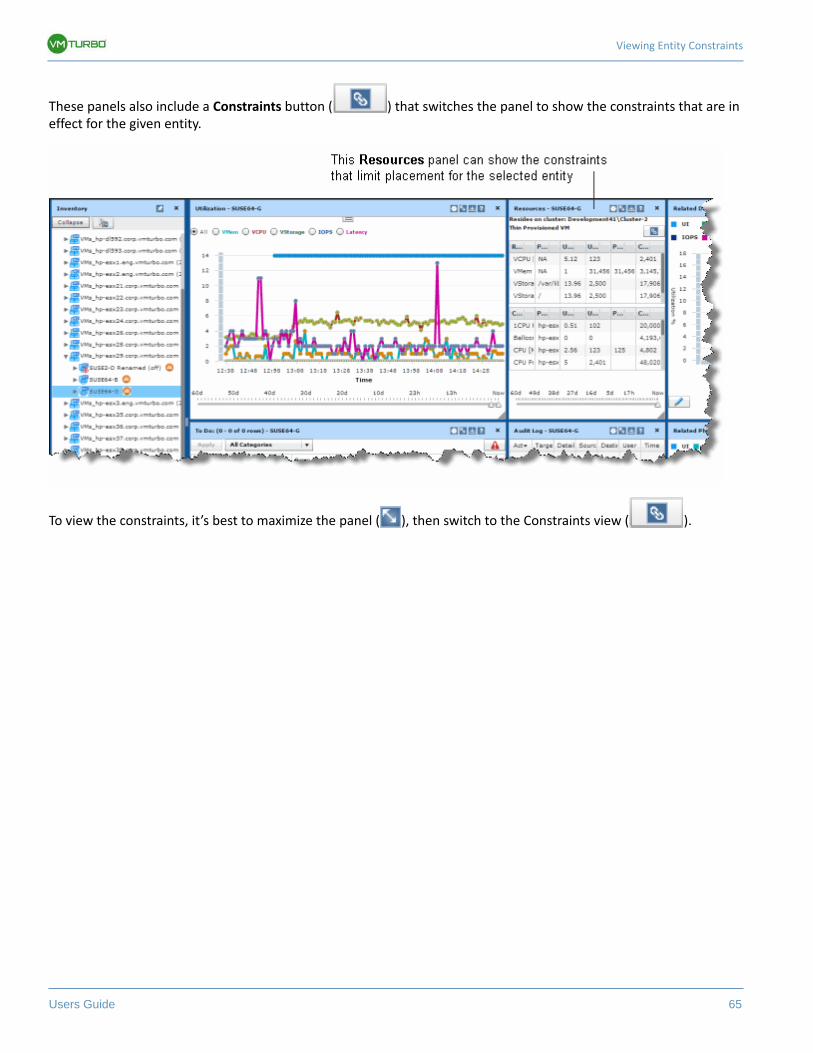
Viewing Entity Constraints
Users Guide 65
These panels also include a Constraints button ( ) that switches the panel to show the constraints that are in effect for the given entity.
To view the constraints, it’s best to maximize the panel ( ), then switch to the Constraints view ( ).
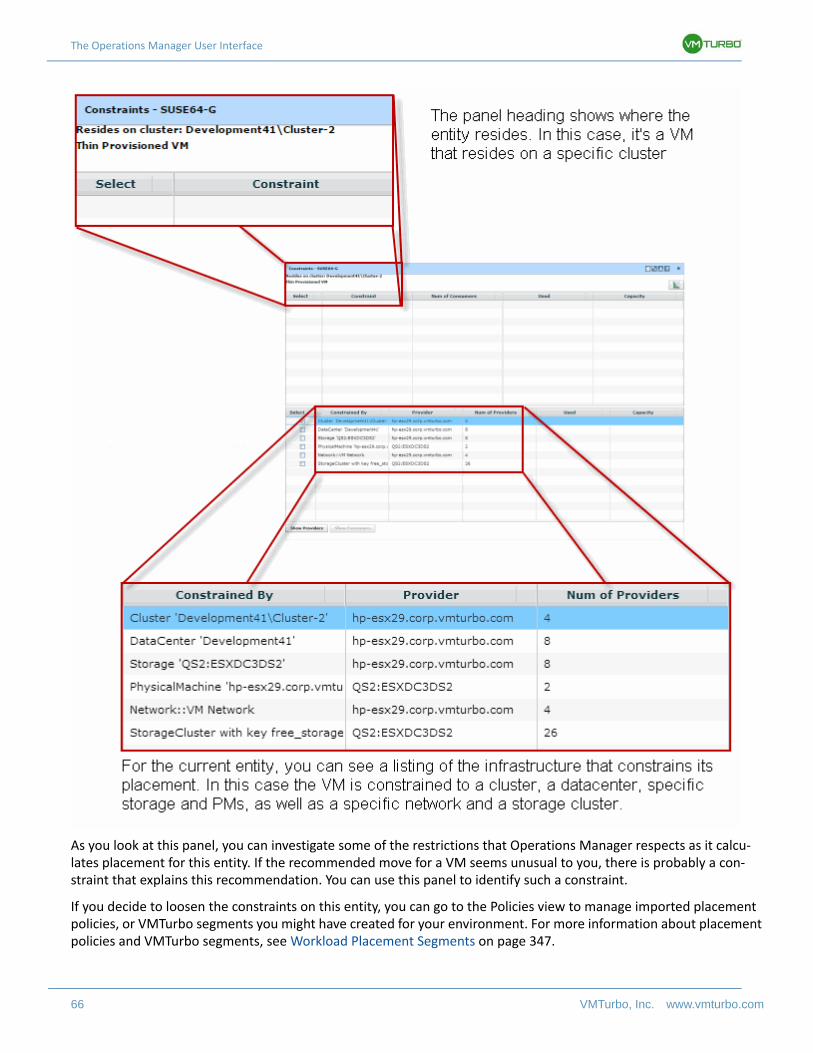
The Operations Manager User Interface
66 VMTurbo, Inc. www.vmturbo.com
As you look at this panel, you can investigate some of the restrictions that Operations Manager respects as it calcu-lates placement for this entity. If the recommended move for a VM seems unusual to you, there is probably a con-straint that explains this recommendation. You can use this panel to identify such a constraint.
If you decide to loosen the constraints on this entity, you can go to the Policies view to manage imported placement policies, or VMTurbo segments you might have created for your environment. For more information about placement policies and VMTurbo segments, see Workload Placement Segments on page 347.
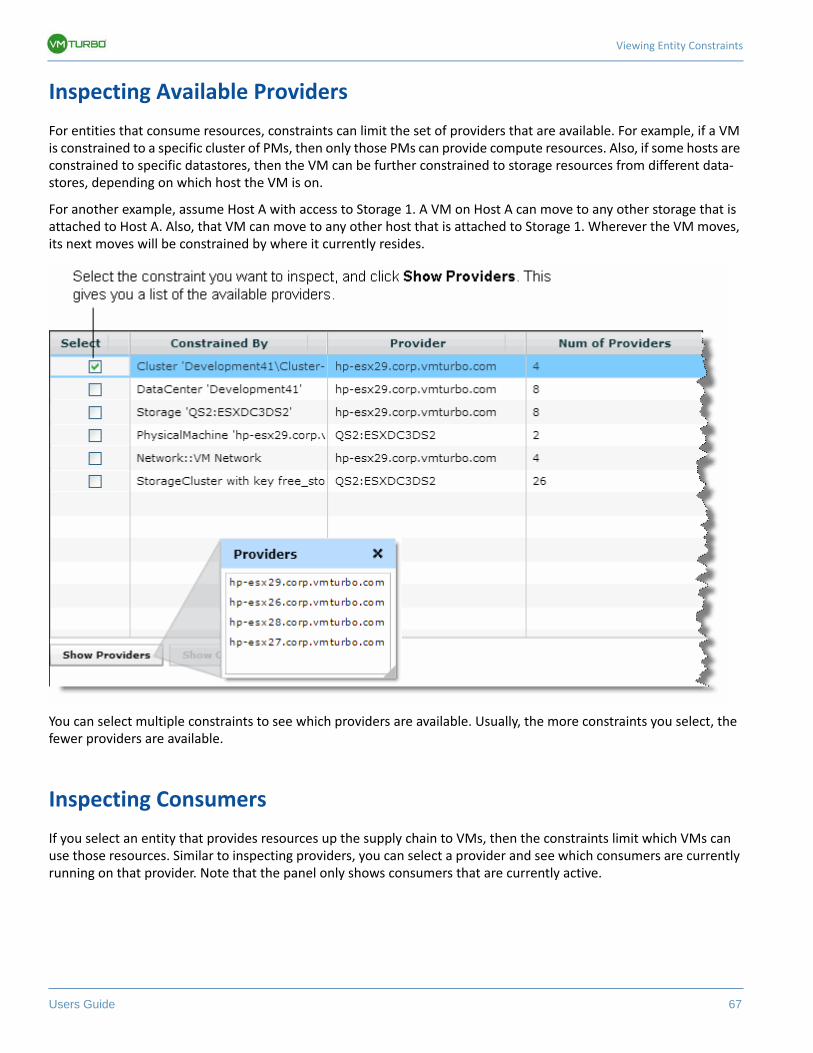
Viewing Entity Constraints
Users Guide 67
Inspecting Available Providers
For entities that consume resources, constraints can limit the set of providers that are available. For example, if a VM is constrained to a specific cluster of PMs, then only those PMs can provide compute resources. Also, if some hosts are constrained to specific datastores, then the VM can be further constrained to storage resources from different data-stores, depending on which host the VM is on.
For another example, assume Host A with access to Storage 1. A VM on Host A can move to any other storage that is attached to Host A. Also, that VM can move to any other host that is attached to Storage 1. Wherever the VM moves, its next moves will be constrained by where it currently resides.
You can select multiple constraints to see which providers are available. Usually, the more constraints you select, the fewer providers are available.
Inspecting Consumers
If you select an entity that provides resources up the supply chain to VMs, then the constraints limit which VMs can use those resources. Similar to inspecting providers, you can select a provider and see which consumers are currently running on that provider. Note that the panel only shows consumers that are currently active.
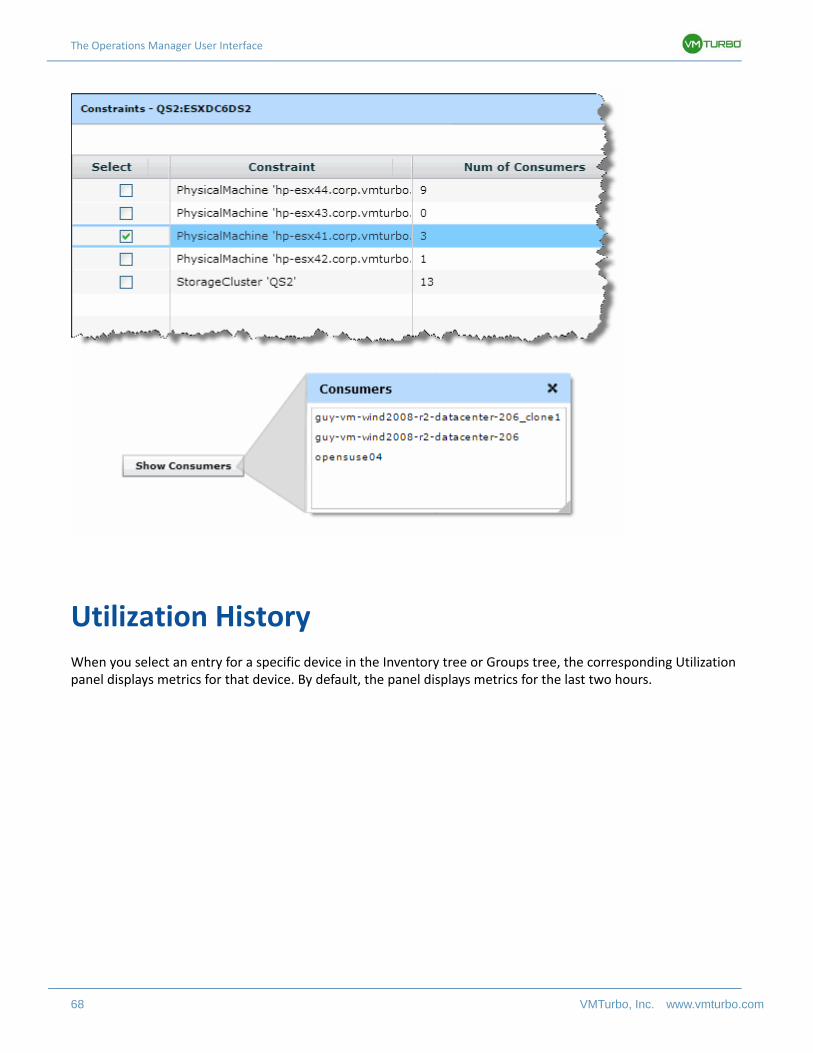
The Operations Manager User Interface
68 VMTurbo, Inc. www.vmturbo.com
Utilization History
When you select an entry for a specific device in the Inventory tree or Groups tree, the corresponding Utilization panel displays metrics for that device. By default, the panel displays metrics for the last two hours.
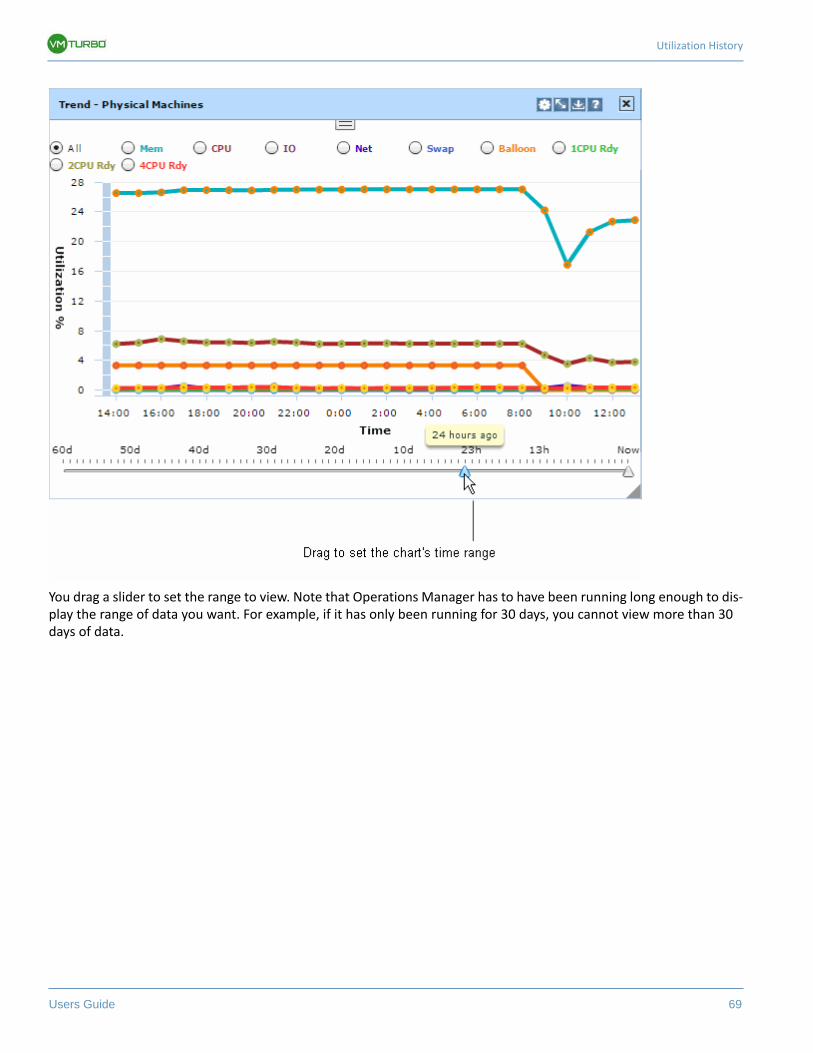
Utilization History
Users Guide 69
You drag a slider to set the range to view. Note that Operations Manager has to have been running long enough to dis-play the range of data you want. For example, if it has only been running for 30 days, you cannot view more than 30 days of data.
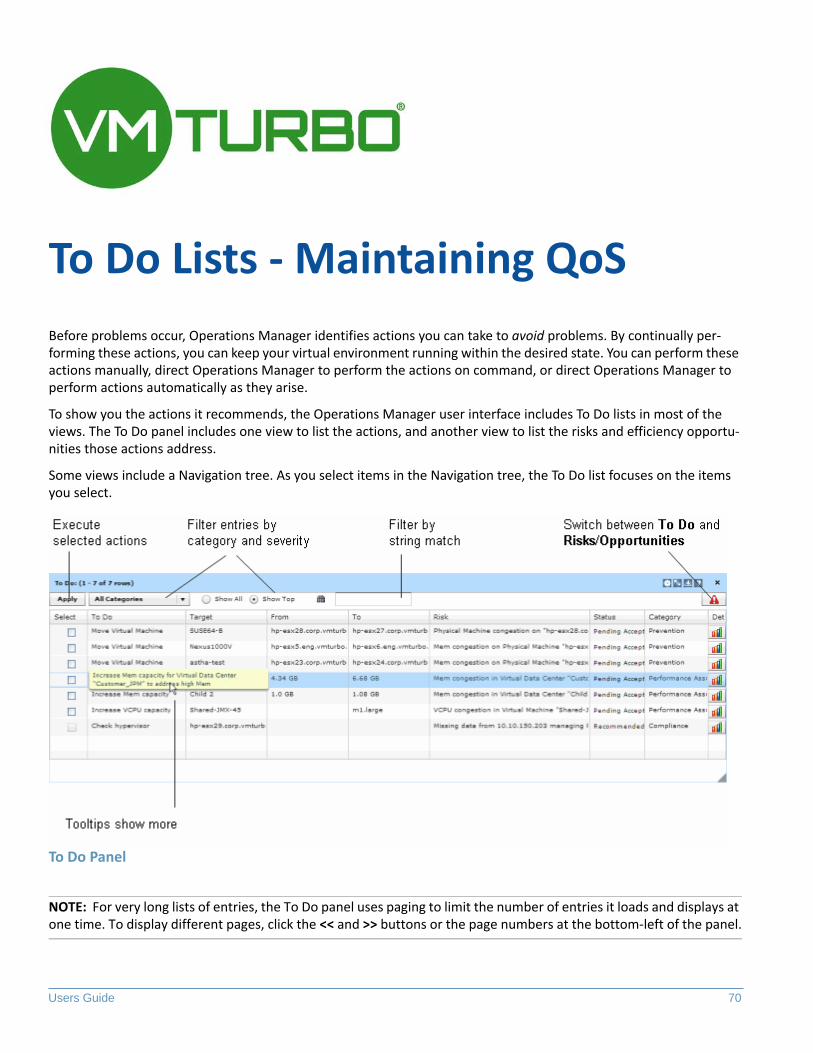
Users Guide 70
To Do Lists - Maintaining QoS
Before problems occur, Operations Manager identifies actions you can take to avoid problems. By continually per-forming these actions, you can keep your virtual environment running within the desired state. You can perform these actions manually, direct Operations Manager to perform the actions on command, or direct Operations Manager to perform actions automatically as they arise.
To show you the actions it recommends, the Operations Manager user interface includes To Do lists in most of the views. The To Do panel includes one view to list the actions, and another view to list the risks and efficiency opportu-nities those actions address.
Some views include a Navigation tree. As you select items in the Navigation tree, the To Do list focuses on the items you select.
To Do Panel
NOTE: For very long lists of entries, the To Do panel uses paging to limit the number of entries it loads and displays at one time. To display different pages, click the << and >> buttons or the page numbers at the bottom-left of the panel.
Viewing Recommended Actions
Users Guide 71
The To Do panel switches between an Action Log (listing recommended actions) and a log of opportunities and risks. The panel includes the following toggle buttons to change its views. Click these buttons to switch from one view to the other:
The To Do list shows the actions Operations Manager recommends. It can perform many of these actions, but other actions (such as installing more memory in a physical machine) are recommendations that an operator must perform. When using the To Do list you can:
• Filter the actions by category, severity, or string match• Select one or more actions to perform• Direct Operations Manager to perform the actions• View the progress of each action as Operations Manager performs it
The Risks/Opportunities log gives you a detailed view of the health of your environment. When using the Risks/Opportunities log you can:
• See risks or efficiency opportunities as they arise• Open detailed views of the issues, including associated charts and recommended actions
The following sections describe how to work with To Do lists:
• Viewing Recommended Actions on page 71• Executing Recommended Actions on page 74• Viewing Risks and Efficiency Opportunities on page 76• Action Categories on page 77• Examples of Risks and Actions on page 79
Viewing Recommended Actions
The To Do list shows actions that Operations Manager recommends for you to achieve optimal performance in your environment. For views that include a Navigation Panel, the list updates to show actions for navigation items you select. For example, if you select Summary in the Inventory tree, the panel shows actions for the whole environment. Then if you select a single physical machine, the panel updates to show only the actions identified for that machine.
The Recommended Actions list includes the following information:
• To Do: The short name of the action to perform; for example, a Move or Resize action (hover to display the long description in a tooltip)
• Target: The resource that will be changed; for example, the VM to move• From: The resource that contains the target (the PM that hosts the VM), or the resource to be modified (the
memory to be resized)• To: The resulting resource; for example, the PM that will host the moved VM, or the new memory capacity• Risk/Opportunity: The risk or opportunity that justifies the action• Status: Recommended, Pending, or other states for this action• Category: See Action Categories on page 77for full descriptions
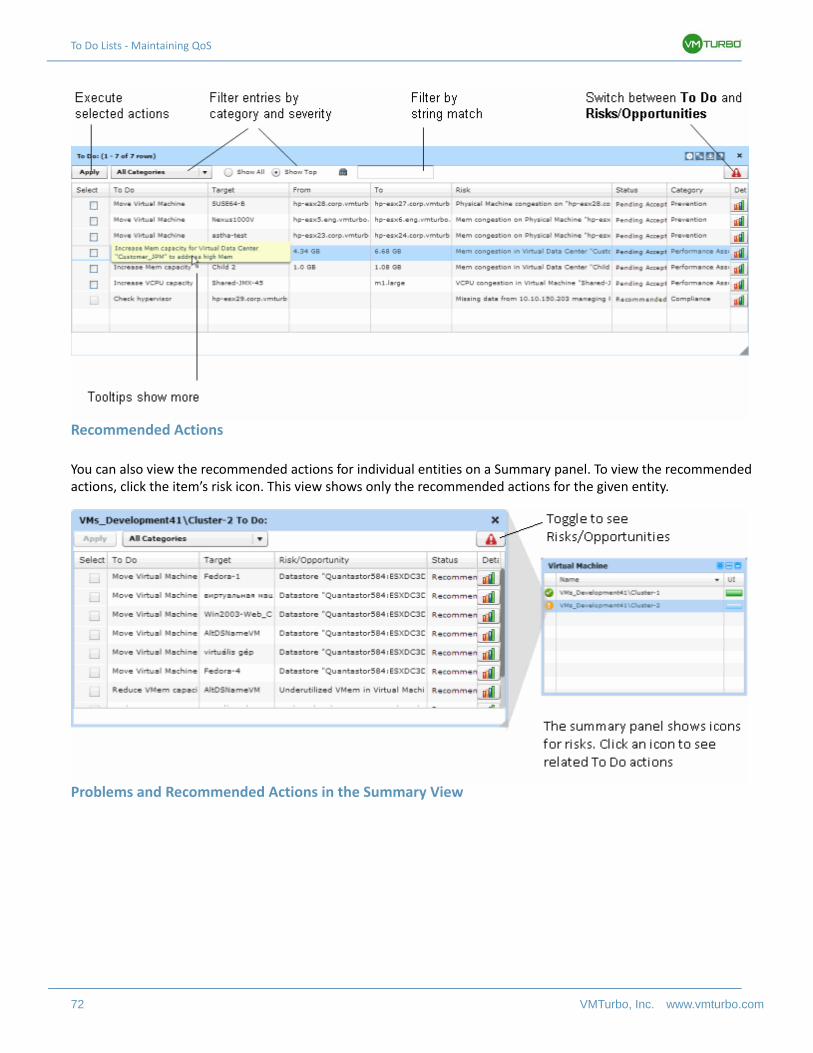
To Do Lists - Maintaining QoS
72 VMTurbo, Inc. www.vmturbo.com
Recommended Actions
You can also view the recommended actions for individual entities on a Summary panel. To view the recommended actions, click the item’s risk icon. This view shows only the recommended actions for the given entity.
Problems and Recommended Actions in the Summary View
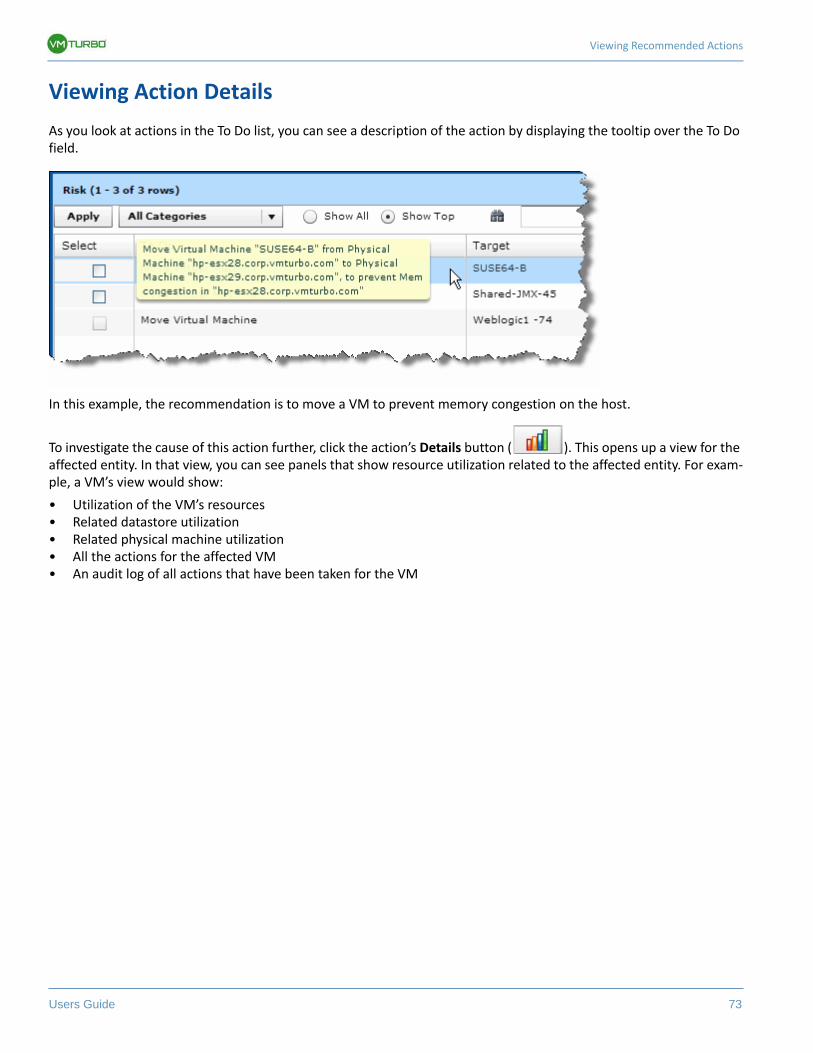
Viewing Recommended Actions
Users Guide 73
Viewing Action Details
As you look at actions in the To Do list, you can see a description of the action by displaying the tooltip over the To Do field.
In this example, the recommendation is to move a VM to prevent memory congestion on the host.
To investigate the cause of this action further, click the action’s Details button ( ). This opens up a view for the affected entity. In that view, you can see panels that show resource utilization related to the affected entity. For exam-ple, a VM’s view would show:
• Utilization of the VM’s resources• Related datastore utilization• Related physical machine utilization• All the actions for the affected VM• An audit log of all actions that have been taken for the VM
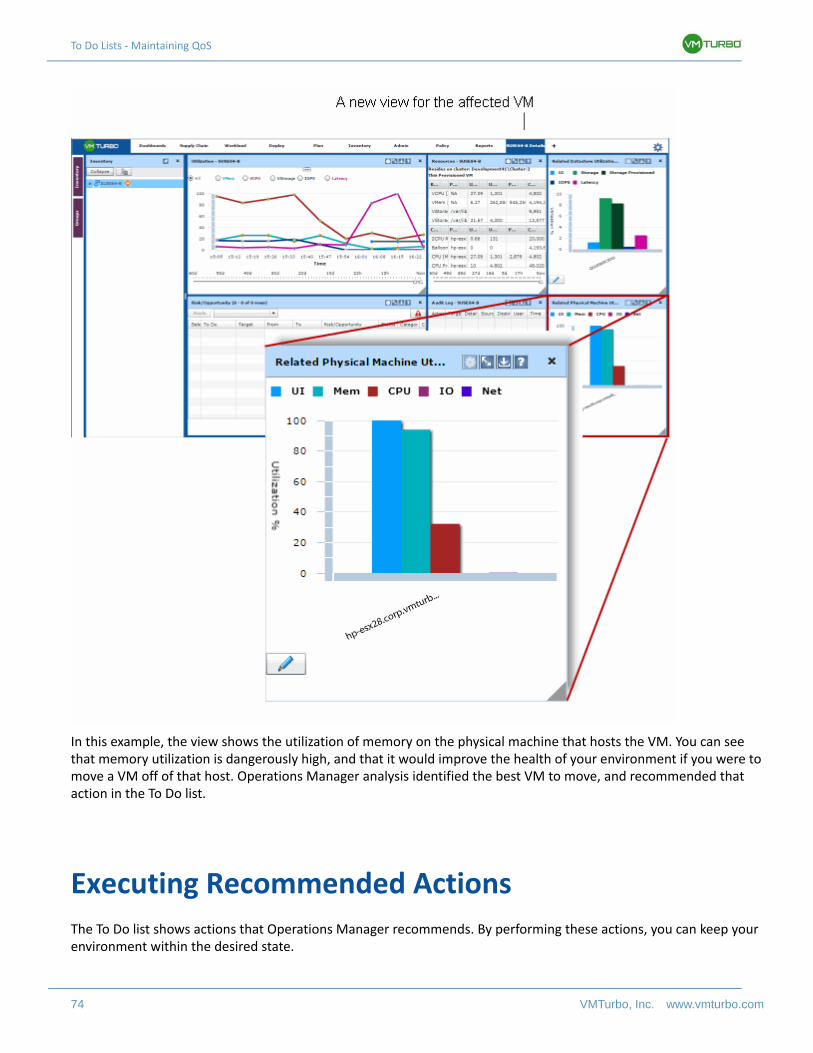
To Do Lists - Maintaining QoS
74 VMTurbo, Inc. www.vmturbo.com
In this example, the view shows the utilization of memory on the physical machine that hosts the VM. You can see that memory utilization is dangerously high, and that it would improve the health of your environment if you were to move a VM off of that host. Operations Manager analysis identified the best VM to move, and recommended that action in the To Do list.
Executing Recommended Actions
The To Do list shows actions that Operations Manager recommends. By performing these actions, you can keep your environment within the desired state.
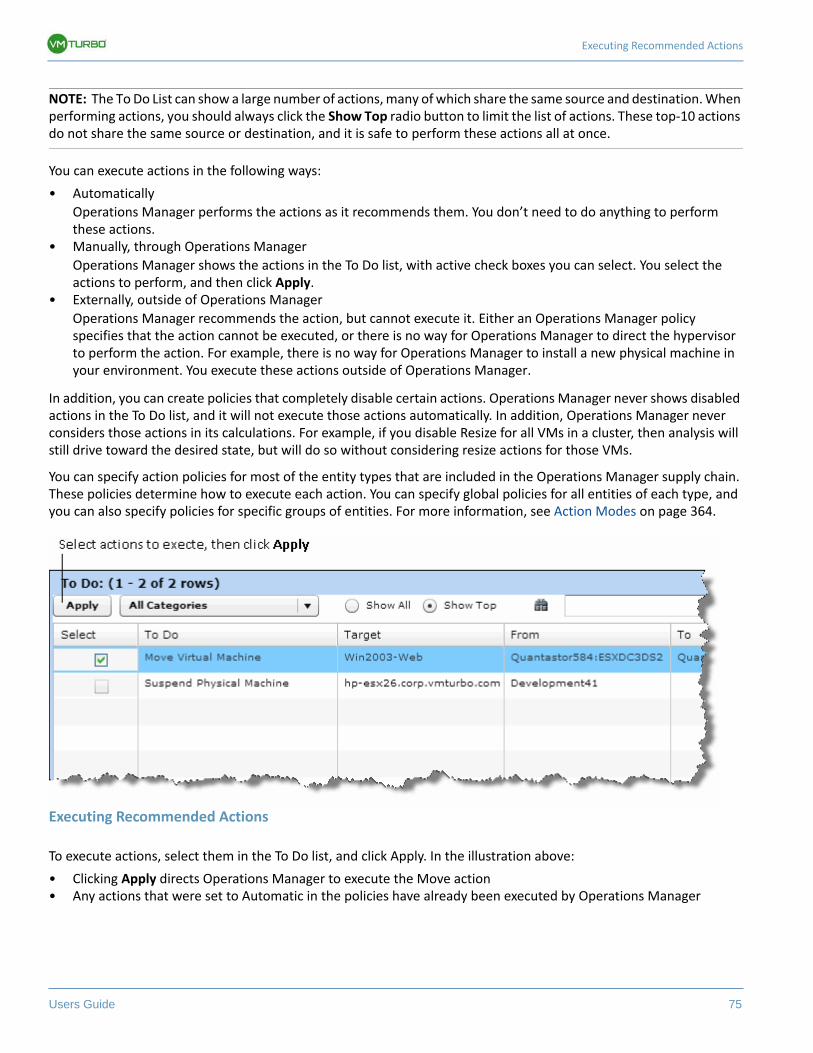
Executing Recommended Actions
Users Guide 75
NOTE: The To Do List can show a large number of actions, many of which share the same source and destination. When performing actions, you should always click the Show Top radio button to limit the list of actions. These top-10 actions do not share the same source or destination, and it is safe to perform these actions all at once.
You can execute actions in the following ways:
• Automatically
Operations Manager performs the actions as it recommends them. You don’t need to do anything to perform these actions.
• Manually, through Operations Manager
Operations Manager shows the actions in the To Do list, with active check boxes you can select. You select the actions to perform, and then click Apply.
• Externally, outside of Operations Manager
Operations Manager recommends the action, but cannot execute it. Either an Operations Manager policy specifies that the action cannot be executed, or there is no way for Operations Manager to direct the hypervisor to perform the action. For example, there is no way for Operations Manager to install a new physical machine in your environment. You execute these actions outside of Operations Manager.
In addition, you can create policies that completely disable certain actions. Operations Manager never shows disabled actions in the To Do list, and it will not execute those actions automatically. In addition, Operations Manager never considers those actions in its calculations. For example, if you disable Resize for all VMs in a cluster, then analysis will still drive toward the desired state, but will do so without considering resize actions for those VMs.
You can specify action policies for most of the entity types that are included in the Operations Manager supply chain. These policies determine how to execute each action. You can specify global policies for all entities of each type, and you can also specify policies for specific groups of entities. For more information, see Action Modes on page 364.
Executing Recommended Actions
To execute actions, select them in the To Do list, and click Apply. In the illustration above:
• Clicking Apply directs Operations Manager to execute the Move action• Any actions that were set to Automatic in the policies have already been executed by Operations Manager
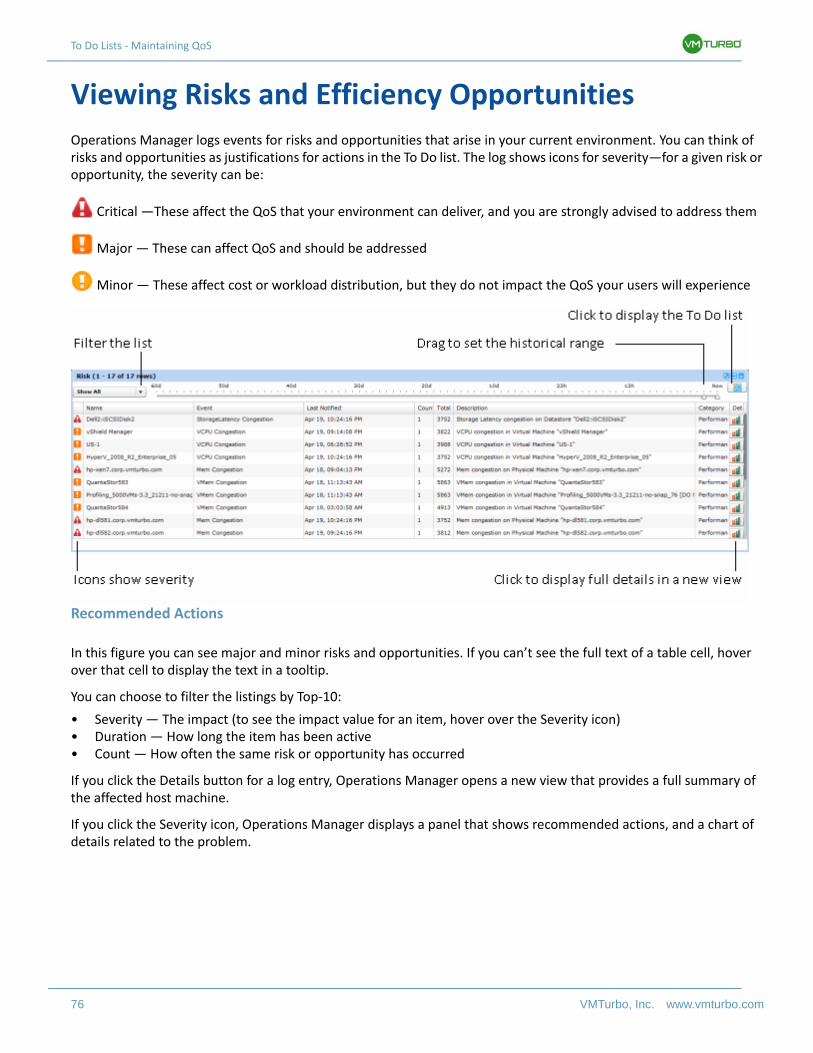
To Do Lists - Maintaining QoS
76 VMTurbo, Inc. www.vmturbo.com
Viewing Risks and Efficiency Opportunities
Operations Manager logs events for risks and opportunities that arise in your current environment. You can think of risks and opportunities as justifications for actions in the To Do list. The log shows icons for severity—for a given risk or opportunity, the severity can be:
Critical —These affect the QoS that your environment can deliver, and you are strongly advised to address them
Major — These can affect QoS and should be addressed
Minor — These affect cost or workload distribution, but they do not impact the QoS your users will experience
Recommended Actions
In this figure you can see major and minor risks and opportunities. If you can’t see the full text of a table cell, hover over that cell to display the text in a tooltip.
You can choose to filter the listings by Top-10:
• Severity — The impact (to see the impact value for an item, hover over the Severity icon)• Duration — How long the item has been active• Count — How often the same risk or opportunity has occurred
If you click the Details button for a log entry, Operations Manager opens a new view that provides a full summary of the affected host machine.
If you click the Severity icon, Operations Manager displays a panel that shows recommended actions, and a chart of details related to the problem.
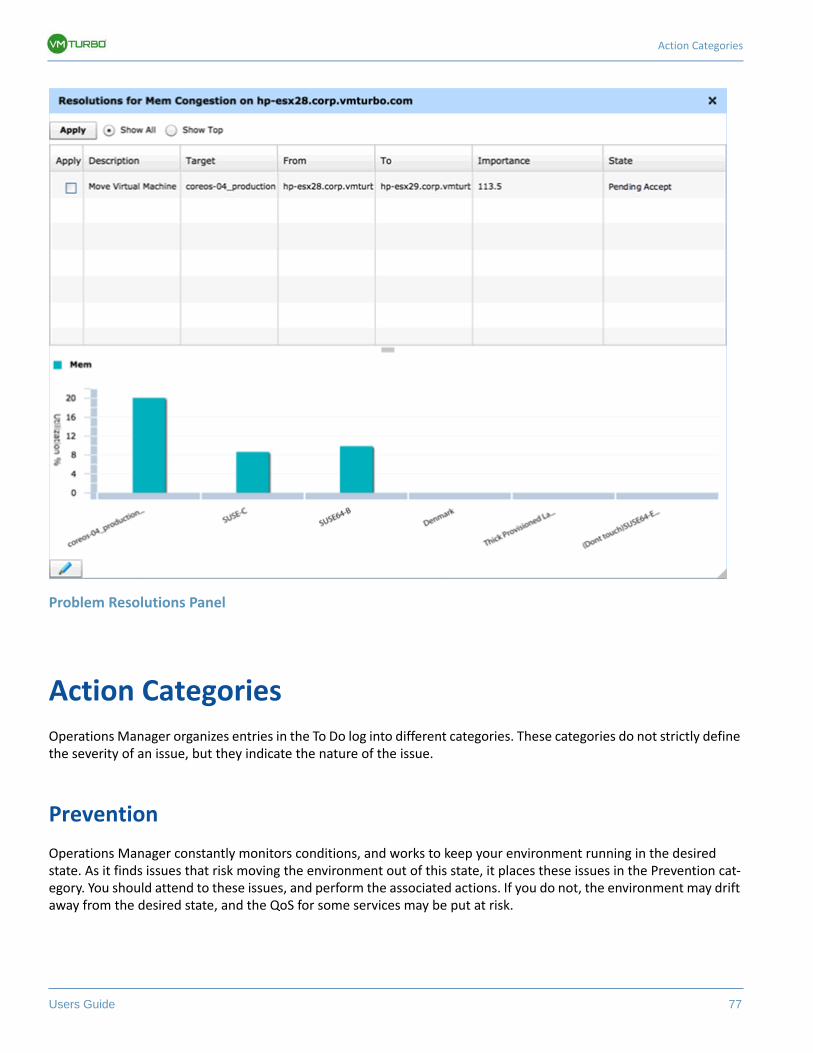
Action Categories
Users Guide 77
Problem Resolutions Panel
Action Categories
Operations Manager organizes entries in the To Do log into different categories. These categories do not strictly define the severity of an issue, but they indicate the nature of the issue.
Prevention
Operations Manager constantly monitors conditions, and works to keep your environment running in the desired state. As it finds issues that risk moving the environment out of this state, it places these issues in the Prevention cat-egory. You should attend to these issues, and perform the associated actions. If you do not, the environment may drift away from the desired state, and the QoS for some services may be put at risk.
To Do Lists - Maintaining QoS
78 VMTurbo, Inc. www.vmturbo.com
Performance Assurance
Ultimately, the reason to keep your environment running within the desired state is to assure performance and meet QoS goals. When Operations Manager detects conditions that directly put QoS at risk, it places the associated actions and risks in the Performance Assurance category. You can consider these critical conditions, and you should execute the recommended actions as soon as possible.
Compliance
A virtual environment can include policies that limit workload placement or availability of resources. It’s possible that the environment configuration violates these defined policies. It’s also possible that an entity is mis-configured in some way. For example, a VM might be configured to access a network that is not available in its current cluster. In such cases, Operations Manager identifies the violation and recommends actions that bring the entity back into com-pliance.
Actions Risks/Opportunities
• Move VM• Start VM or PM
• <Resource> CongestionHigh resource utilization on the named VM, host, or datastore. For example, CPU congestion or Memory congestion can occur on a VM or physical machine, or an IOPS bottleneck can occur on a datastore.
• Workload BalancingExcess workload on a given physical machine that can be addressed by moving a VM to another host.
Actions Risks/Opportunities
• Bind a new application (to a virtual application)
• Provision a new VM, PM, Datastore
• Increase number of VCPUs• Decrease number of VCPUs• Increase resource• Reduce resource
• <Resource> CongestionHigh utilization of application managed by a load balancer. High utilization of resources on VM, PM, or datastore.
Actions Risks/Opportunities
• Move VM• Provision VM, PM,
Datastore, Network
• Placement ViolationThe placement of a VM is in violation of an Operations Manager policy or an imported Placement Policy.
• MisconfigurationThe configuration violates discovered requirements. For example, a VM is configured to access a network that is not available from the current cluster.
Examples of Risks and Actions
Users Guide 79
Efficiency Improvement
Efficient utilization of resources is an important part of running in the desired state. Running efficiently maximizes your investment in hardware and reduces cost. When Operations Manager discovers underutilized resources, it rec-ommends actions to consolidate your operations. For example, it can recommend that you move certain VMs onto a different host. This can free a physical machine to be shut down.
There are times when Operations Manager suspends a VM in order to free up resources for a critical application. When those resources are no longer stressed by the critical application, Operations Manager can restart the sus-pended VM. This is a special type of efficiency improvement—rather than consolidating workload and shutting down unused machines, this action restarts a suspended VM to increase resource utilization and provide more services.
Examples of Risks and Actions
Following are some types of the risks and efficiency opportunities Operations Manager can identify, and actions it can recommend to optimize your system deployment.
Critical Over-Utilization
Whenever any system resource reaches critical utilization, your infrastructure can experience bottlenecks. Applica-tions running on VMs that are hosted by critically over-utilized machines will show performance problems, and so your QoS may suffer.
The resources that can be affected are:
• Memory• CPU• IO• Network utilization• CPU Ready Queues• Data storage
Possible Resolutions:
• Move VMs from the affected host to a host with less utilization. Operations Manager can perform this action automatically.
• Start or provision a new host machine. You must perform this action manually.• Provision a new data store. You must perform this action manually.
Actions Risks/Opportunities
• Disconnect Virtual App• Move VM• Suspend VM• Delete VM• Terminate VM• Reduce resource• Restart suspended VM
• OverprovisioningExcess resource capacity in a PM or datastore.
To Do Lists - Maintaining QoS
80 VMTurbo, Inc. www.vmturbo.com
Low Utilization
Under-utilization presents an opportunity to increase efficiency, because it results in higher costs to maintain exces-sive hardware.
The resources that can be affected are:
• Memory• CPU• IO• Network utilization• CPU Ready Queues
Possible Resolutions:
• Move VMs from an under-utilized host to another host. Operations Manager can perform this action automatically.
• Suspend the under-utilized host. Operations Manager can perform this action automatically.
Mis-configured VMs
Bottlenecks can arise when a VM is not configured with enough virtual processing power to support its applications. For example, reducing the number of VCPUs on a VM can actually improve performance if wait time on the multi-CPU ready queue is excessive. If the CPU utilization can allow reducing the CPUs for the VM, then Operations Manager will recommend that action.
The resources that can be affected are:
• Number of VCPUs in a virtual machine• VMem capacity
Possible Resolutions:
• Reconfigure the affected VM. You must perform this action manually.
Mis-configured Infrastructure
Operations Manager can identify general configuration problems in your infrastructure. These problems can result in poor QoS, even though none of the hosts show over-utilization problems.
The resources that can be affected are configuration of:
• Network• Cluster• Storage
Possible Resolutions:
• Reconfigure the affected infrastructure resource. You must perform these actions manually.
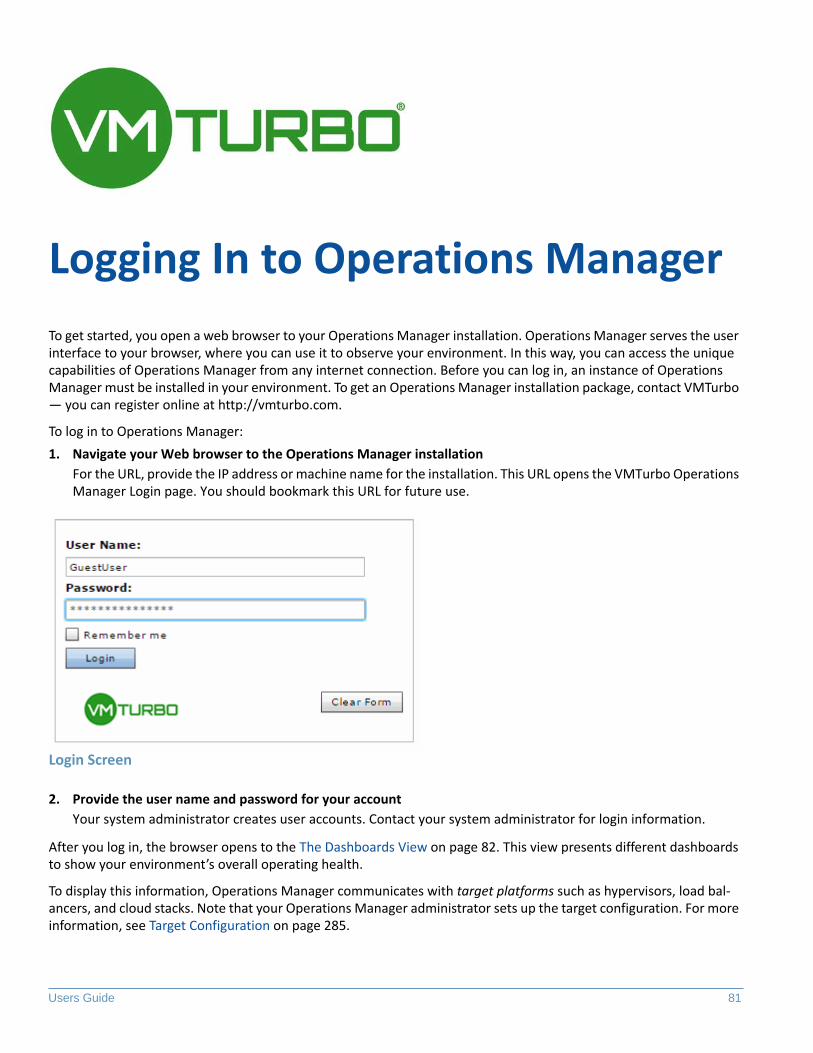
Users Guide 81
Logging In to Operations Manager
To get started, you open a web browser to your Operations Manager installation. Operations Manager serves the user interface to your browser, where you can use it to observe your environment. In this way, you can access the unique capabilities of Operations Manager from any internet connection. Before you can log in, an instance of Operations Manager must be installed in your environment. To get an Operations Manager installation package, contact VMTurbo — you can register online at http://vmturbo.com.
To log in to Operations Manager:
1. Navigate your Web browser to the Operations Manager installation
For the URL, provide the IP address or machine name for the installation. This URL opens the VMTurbo Operations Manager Login page. You should bookmark this URL for future use.
Login Screen
2. Provide the user name and password for your account
Your system administrator creates user accounts. Contact your system administrator for login information.
After you log in, the browser opens to the The Dashboards View on page 82. This view presents different dashboards to show your environment’s overall operating health.
To display this information, Operations Manager communicates with target platforms such as hypervisors, load bal-ancers, and cloud stacks. Note that your Operations Manager administrator sets up the target configuration. For more information, see Target Configuration on page 285.
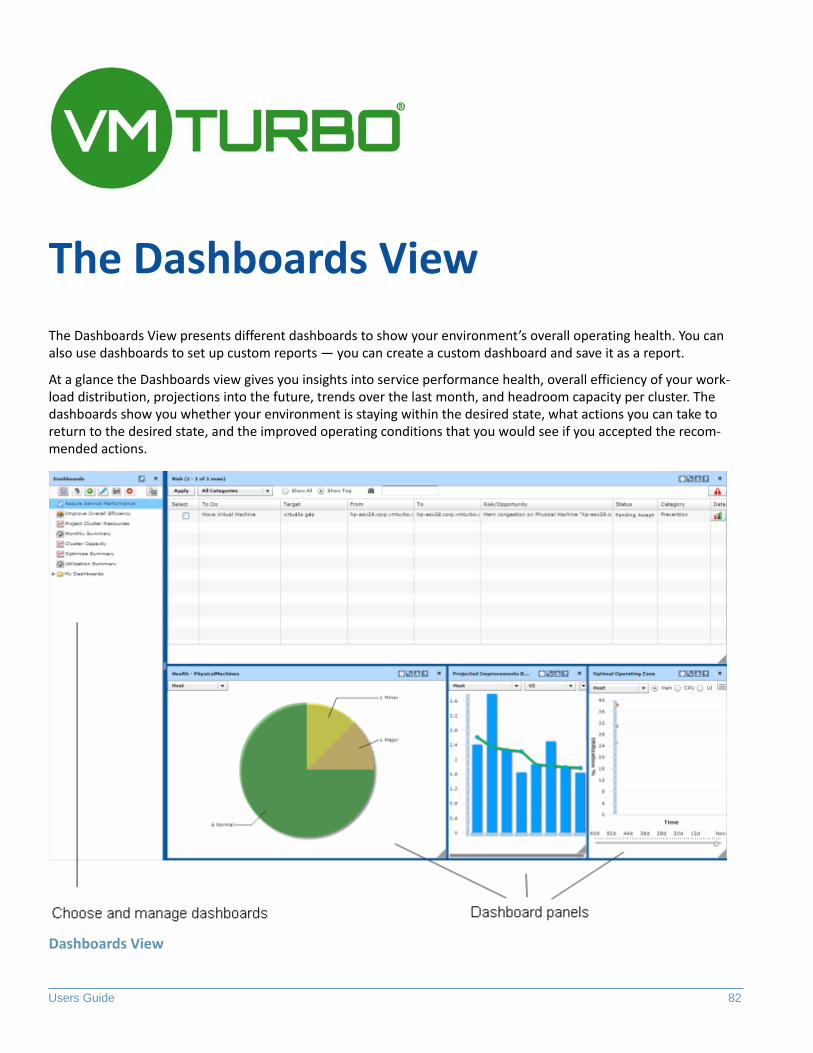
Users Guide 82
The Dashboards View
The Dashboards View presents different dashboards to show your environment’s overall operating health. You can also use dashboards to set up custom reports — you can create a custom dashboard and save it as a report.
At a glance the Dashboards view gives you insights into service performance health, overall efficiency of your work-load distribution, projections into the future, trends over the last month, and headroom capacity per cluster. The dashboards show you whether your environment is staying within the desired state, what actions you can take to return to the desired state, and the improved operating conditions that you would see if you accepted the recom-mended actions.
Dashboards View
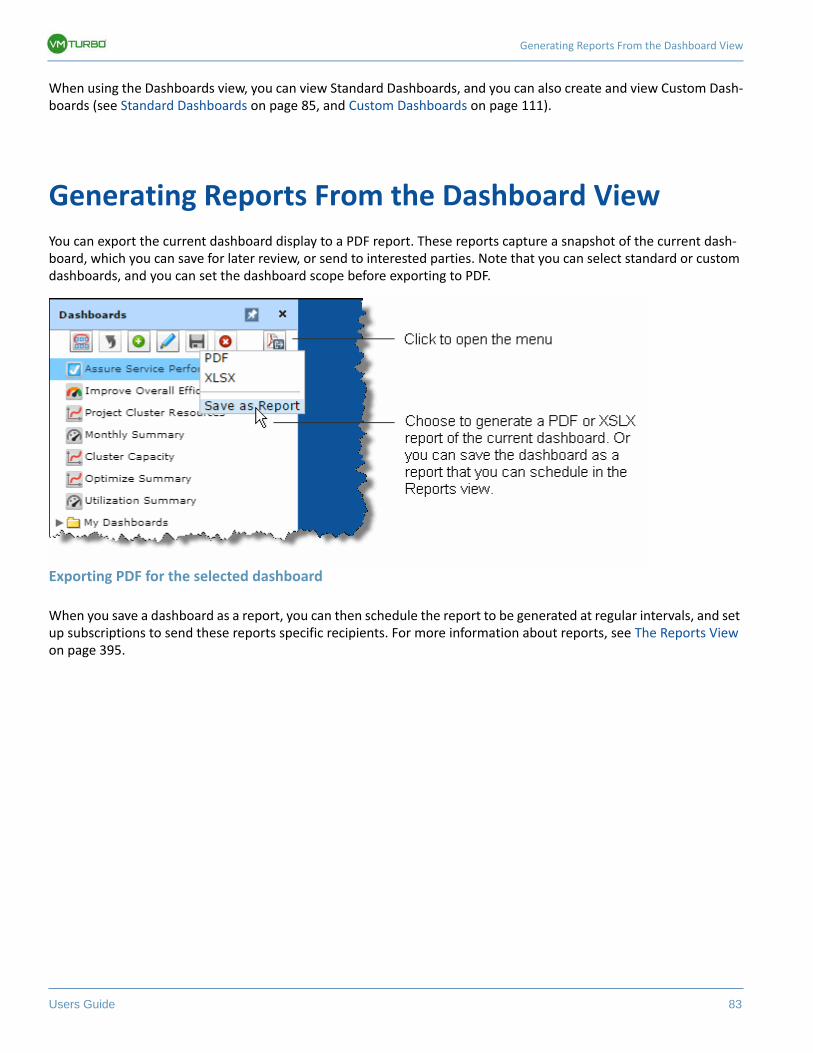
Generating Reports From the Dashboard View
Users Guide 83
When using the Dashboards view, you can view Standard Dashboards, and you can also create and view Custom Dash-boards (see Standard Dashboards on page 85, and Custom Dashboards on page 111).
Generating Reports From the Dashboard View
You can export the current dashboard display to a PDF report. These reports capture a snapshot of the current dash-board, which you can save for later review, or send to interested parties. Note that you can select standard or custom dashboards, and you can set the dashboard scope before exporting to PDF.
Exporting PDF for the selected dashboard
When you save a dashboard as a report, you can then schedule the report to be generated at regular intervals, and set up subscriptions to send these reports specific recipients. For more information about reports, see The Reports View on page 395.
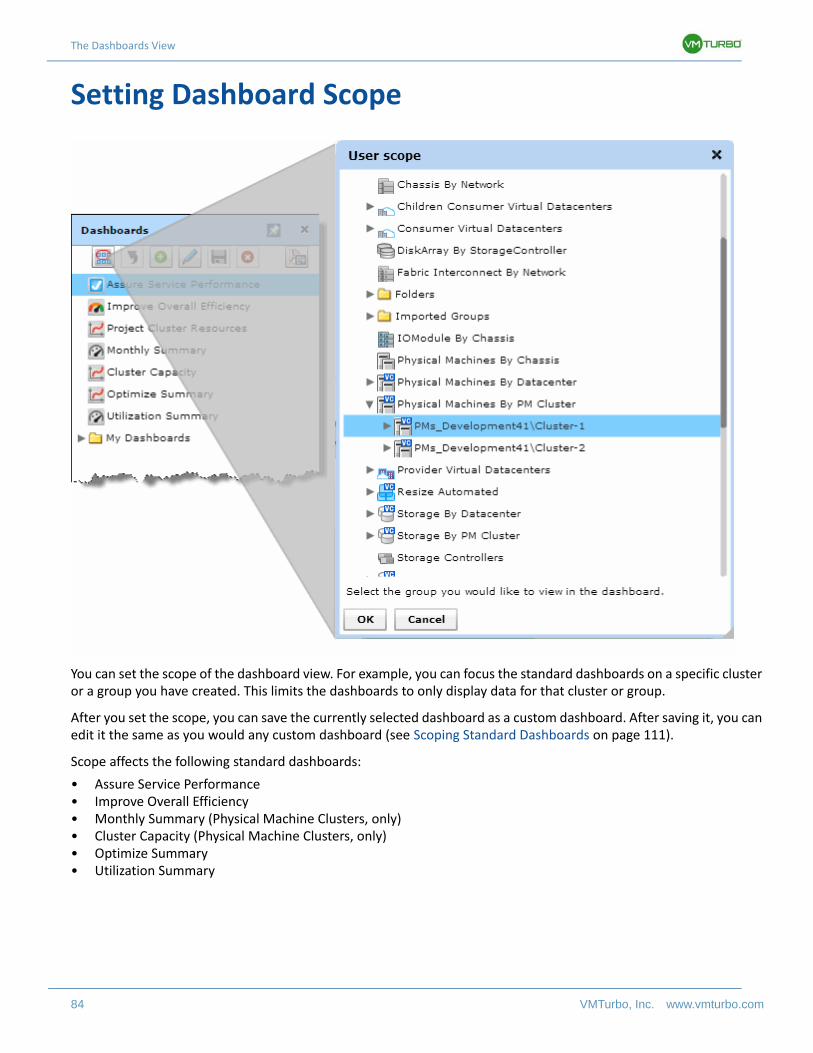
The Dashboards View
84 VMTurbo, Inc. www.vmturbo.com
Setting Dashboard Scope
You can set the scope of the dashboard view. For example, you can focus the standard dashboards on a specific cluster or a group you have created. This limits the dashboards to only display data for that cluster or group.
After you set the scope, you can save the currently selected dashboard as a custom dashboard. After saving it, you can edit it the same as you would any custom dashboard (see Scoping Standard Dashboards on page 111).
Scope affects the following standard dashboards:
• Assure Service Performance• Improve Overall Efficiency• Monthly Summary (Physical Machine Clusters, only)• Cluster Capacity (Physical Machine Clusters, only)• Optimize Summary• Utilization Summary
Standard Dashboards
Users Guide 85
To set the scope of a selected dashboard:
1. Open the Scope dialog box.
Click the Scope button ( ) in the fly-out panel.
2. Choose the scope you want.
Navigate to the cluster or group you want to focus on. The dashboard updates its display to show the scope you have selected.
3. When satisfied with the scope you chose, click OK.
You can always click Cancel to close the dialog box and return to the original scope.
At any time, you can click the Reset Scope button ( ) in the fly-out panel. This returns the dashboard view to the default scope.
Standard Dashboards
Operations Manager ships with the following standard dashboards:
• Assure Service Performance on page 86 — Shows environment health, focusing on actions you can execute to assure performance and QoS.
• Improve Overall Efficiency on page 90 — Shows how you can consolidate services and utilize physical resources more efficiently.
• Project Cluster Resources on page 94 — Based on historical workload data, projects the future capacity requirements for different clusters in your environment.
• Monthly Summary on page 98 — Based on historical data, shows the trend for workload distribution and utilization of resources such as memory and storage space.
• Cluster Capacity on page 99 — Based on capacity planning scenarios, shows how many VMs you can safely add to a given cluster.
• Impact Summary on page 103 — compares the current state of your environment to the state it would be in if you executed all of the recommended actions, in terms of cost for consumers and profit margin for providers.
• Optimize Summary on page 105 — Compares the current state to the state your environment would achieve if you accept all the recommended actions.
• Supply and Demand on page 107 — Compares the efficiency of workload distribution in your environment to the execution of recommended actions.
• QoS on page 109 — Shows how the overall health of your environment affects QoS.
To switch between dashboards, open the Dashboards fly-out panel and choose the one you want from the Dash-boards list.
In addition, from the Dashboards fly-out panel you can perform the following Dashboard actions:
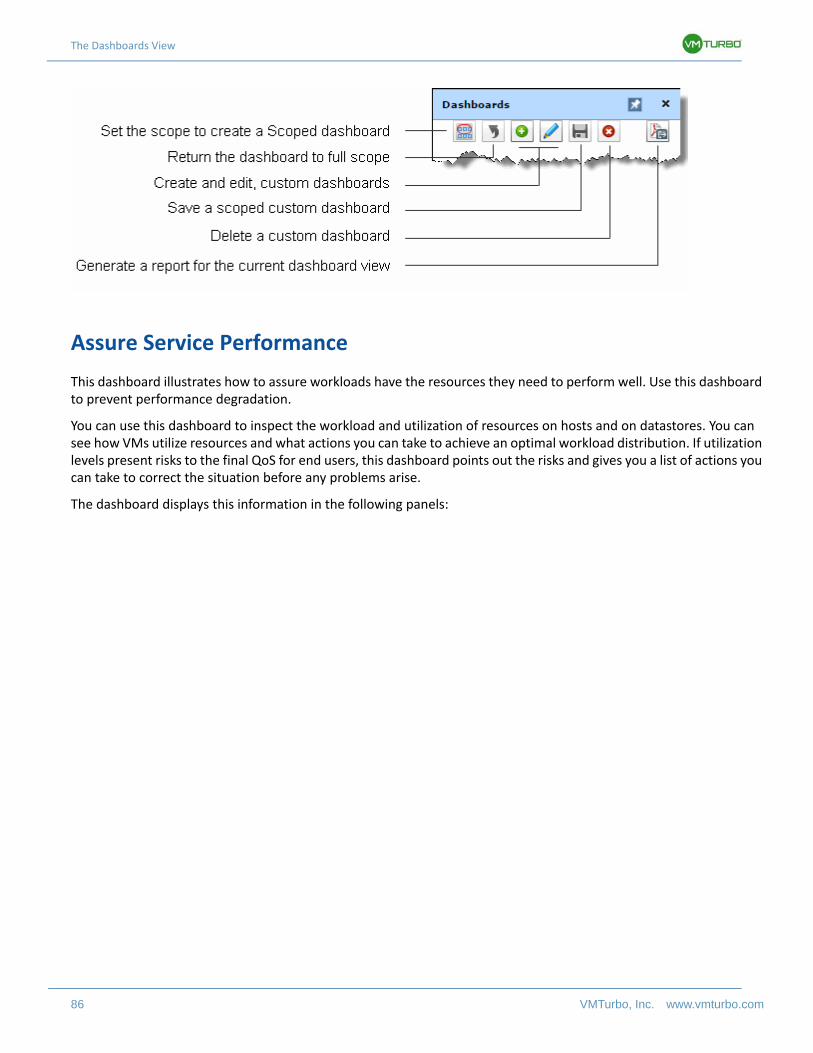
The Dashboards View
86 VMTurbo, Inc. www.vmturbo.com
Assure Service Performance
This dashboard illustrates how to assure workloads have the resources they need to perform well. Use this dashboard to prevent performance degradation.
You can use this dashboard to inspect the workload and utilization of resources on hosts and on datastores. You can see how VMs utilize resources and what actions you can take to achieve an optimal workload distribution. If utilization levels present risks to the final QoS for end users, this dashboard points out the risks and gives you a list of actions you can take to correct the situation before any problems arise.
The dashboard displays this information in the following panels:
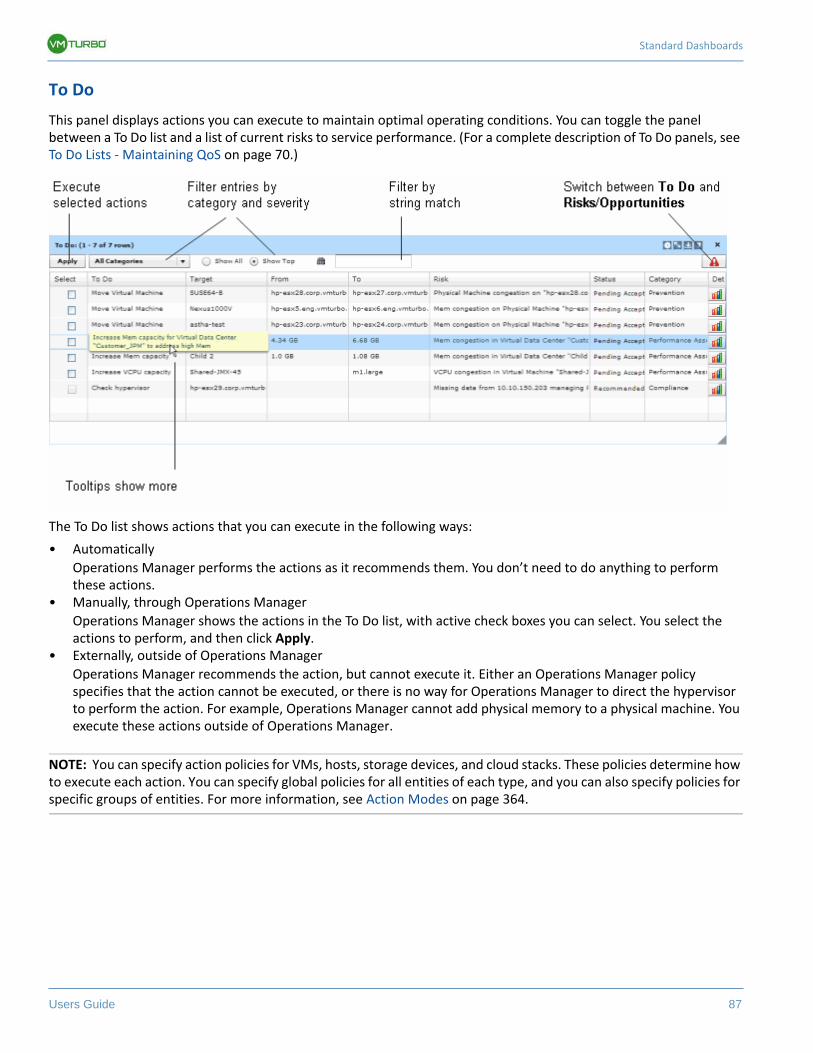
Standard Dashboards
Users Guide 87
To Do
This panel displays actions you can execute to maintain optimal operating conditions. You can toggle the panel between a To Do list and a list of current risks to service performance. (For a complete description of To Do panels, see To Do Lists - Maintaining QoS on page 70.)
The To Do list shows actions that you can execute in the following ways:
• Automatically
Operations Manager performs the actions as it recommends them. You don’t need to do anything to perform these actions.
• Manually, through Operations Manager
Operations Manager shows the actions in the To Do list, with active check boxes you can select. You select the actions to perform, and then click Apply.
• Externally, outside of Operations Manager
Operations Manager recommends the action, but cannot execute it. Either an Operations Manager policy specifies that the action cannot be executed, or there is no way for Operations Manager to direct the hypervisor to perform the action. For example, Operations Manager cannot add physical memory to a physical machine. You execute these actions outside of Operations Manager.
NOTE: You can specify action policies for VMs, hosts, storage devices, and cloud stacks. These policies determine how to execute each action. You can specify global policies for all entities of each type, and you can also specify policies for specific groups of entities. For more information, see Action Modes on page 364.
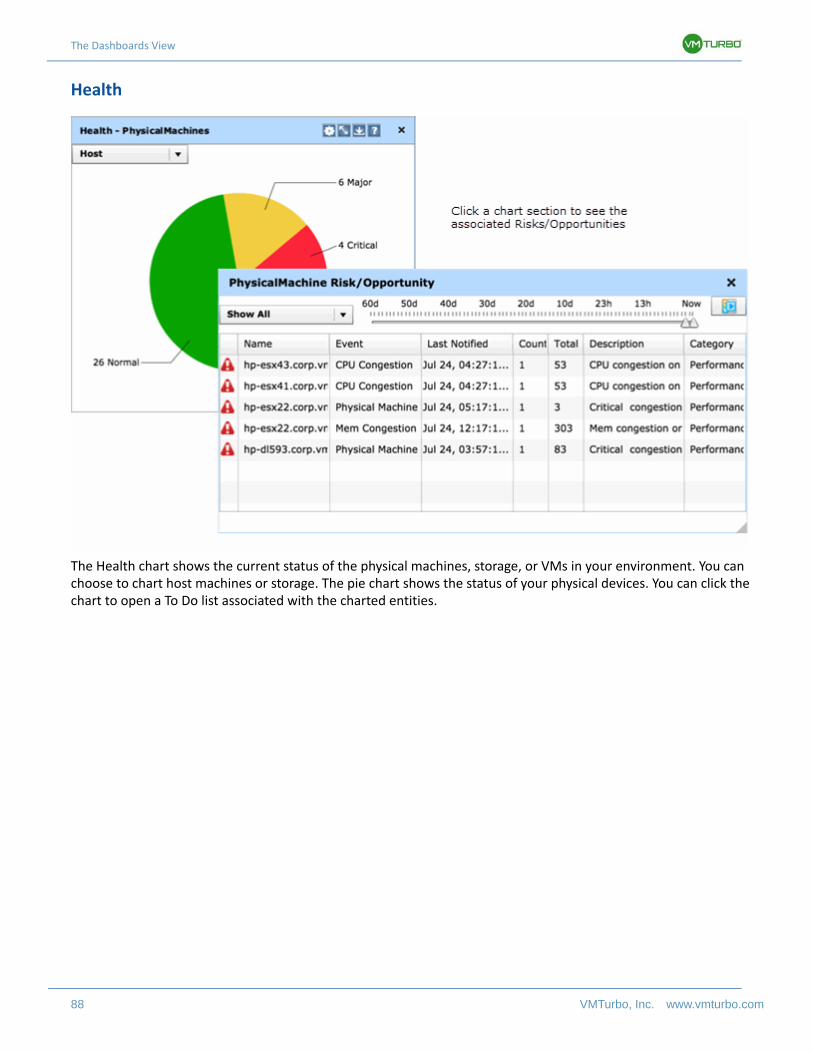
The Dashboards View
88 VMTurbo, Inc. www.vmturbo.com
Health
The Health chart shows the current status of the physical machines, storage, or VMs in your environment. You can choose to chart host machines or storage. The pie chart shows the status of your physical devices. You can click the chart to open a To Do list associated with the charted entities.
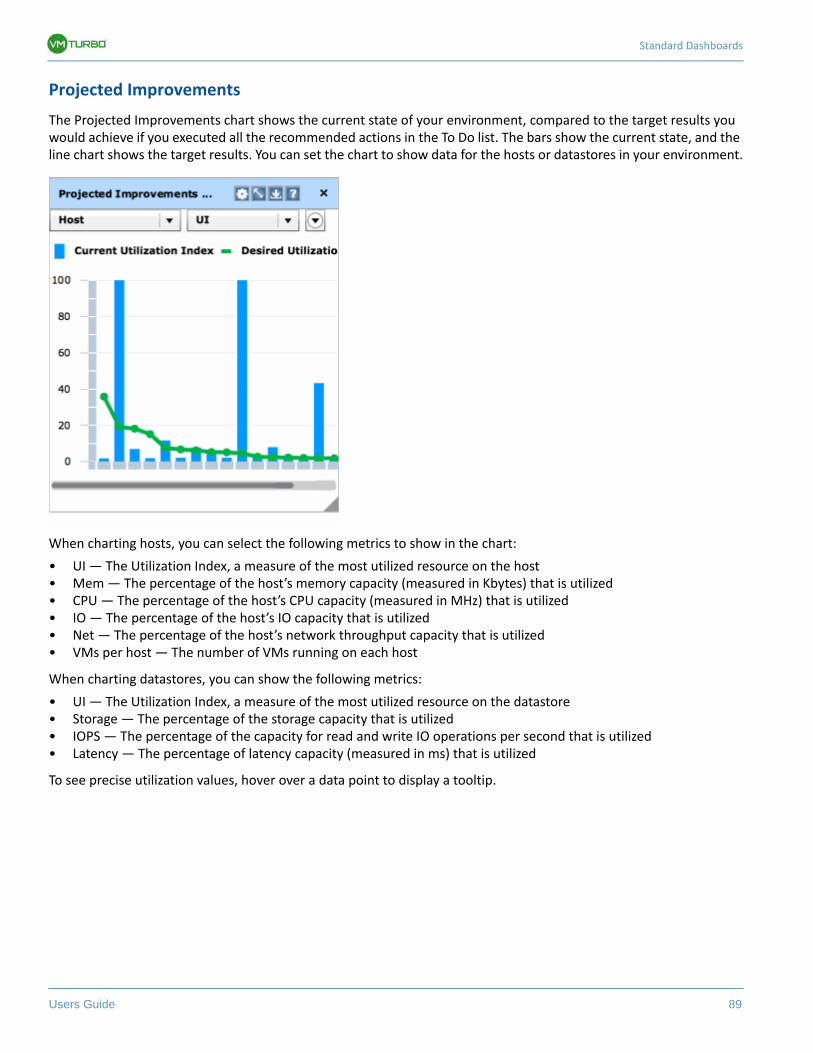
Standard Dashboards
Users Guide 89
Projected Improvements
The Projected Improvements chart shows the current state of your environment, compared to the target results you would achieve if you executed all the recommended actions in the To Do list. The bars show the current state, and the line chart shows the target results. You can set the chart to show data for the hosts or datastores in your environment.
When charting hosts, you can select the following metrics to show in the chart:
• UI — The Utilization Index, a measure of the most utilized resource on the host• Mem — The percentage of the host’s memory capacity (measured in Kbytes) that is utilized• CPU — The percentage of the host’s CPU capacity (measured in MHz) that is utilized• IO — The percentage of the host’s IO capacity that is utilized• Net — The percentage of the host’s network throughput capacity that is utilized• VMs per host — The number of VMs running on each host
When charting datastores, you can show the following metrics:
• UI — The Utilization Index, a measure of the most utilized resource on the datastore• Storage — The percentage of the storage capacity that is utilized• IOPS — The percentage of the capacity for read and write IO operations per second that is utilized• Latency — The percentage of latency capacity (measured in ms) that is utilized
To see precise utilization values, hover over a data point to display a tooltip.
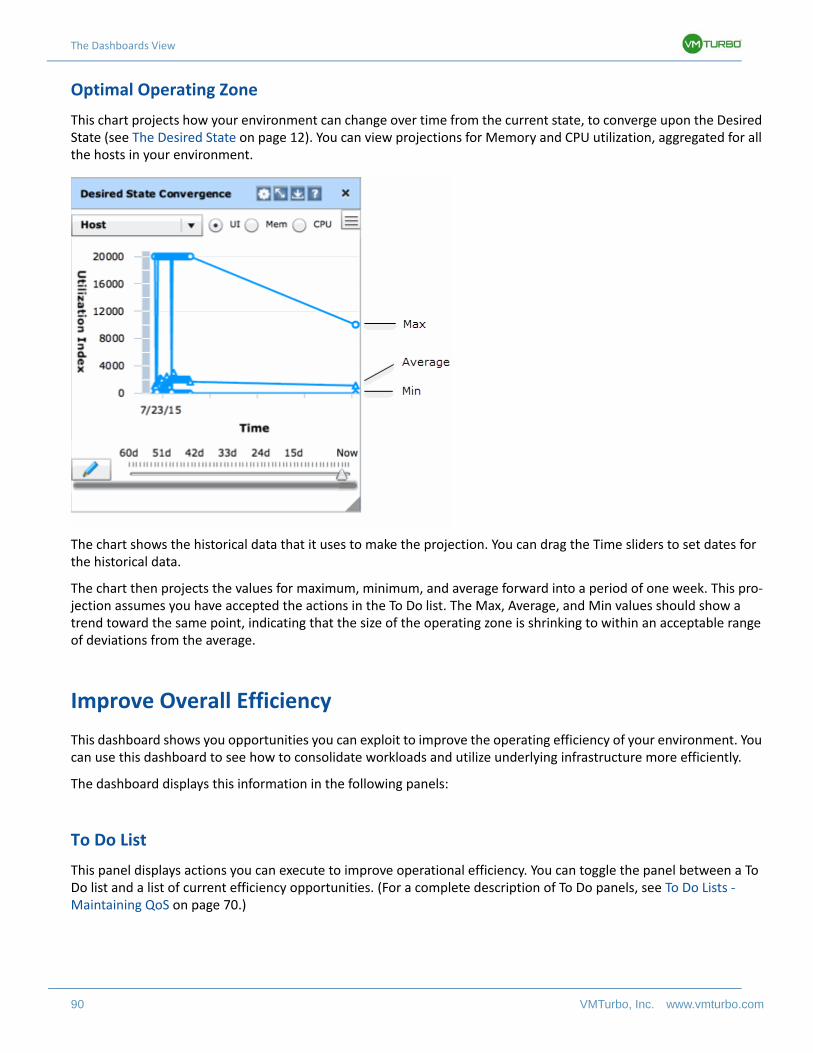
The Dashboards View
90 VMTurbo, Inc. www.vmturbo.com
Optimal Operating Zone
This chart projects how your environment can change over time from the current state, to converge upon the Desired State (see The Desired State on page 12). You can view projections for Memory and CPU utilization, aggregated for all the hosts in your environment.
The chart shows the historical data that it uses to make the projection. You can drag the Time sliders to set dates for the historical data.
The chart then projects the values for maximum, minimum, and average forward into a period of one week. This pro-jection assumes you have accepted the actions in the To Do list. The Max, Average, and Min values should show a trend toward the same point, indicating that the size of the operating zone is shrinking to within an acceptable range of deviations from the average.
Improve Overall Efficiency
This dashboard shows you opportunities you can exploit to improve the operating efficiency of your environment. You can use this dashboard to see how to consolidate workloads and utilize underlying infrastructure more efficiently.
The dashboard displays this information in the following panels:
To Do List
This panel displays actions you can execute to improve operational efficiency. You can toggle the panel between a To Do list and a list of current efficiency opportunities. (For a complete description of To Do panels, see To Do Lists - Maintaining QoS on page 70.)
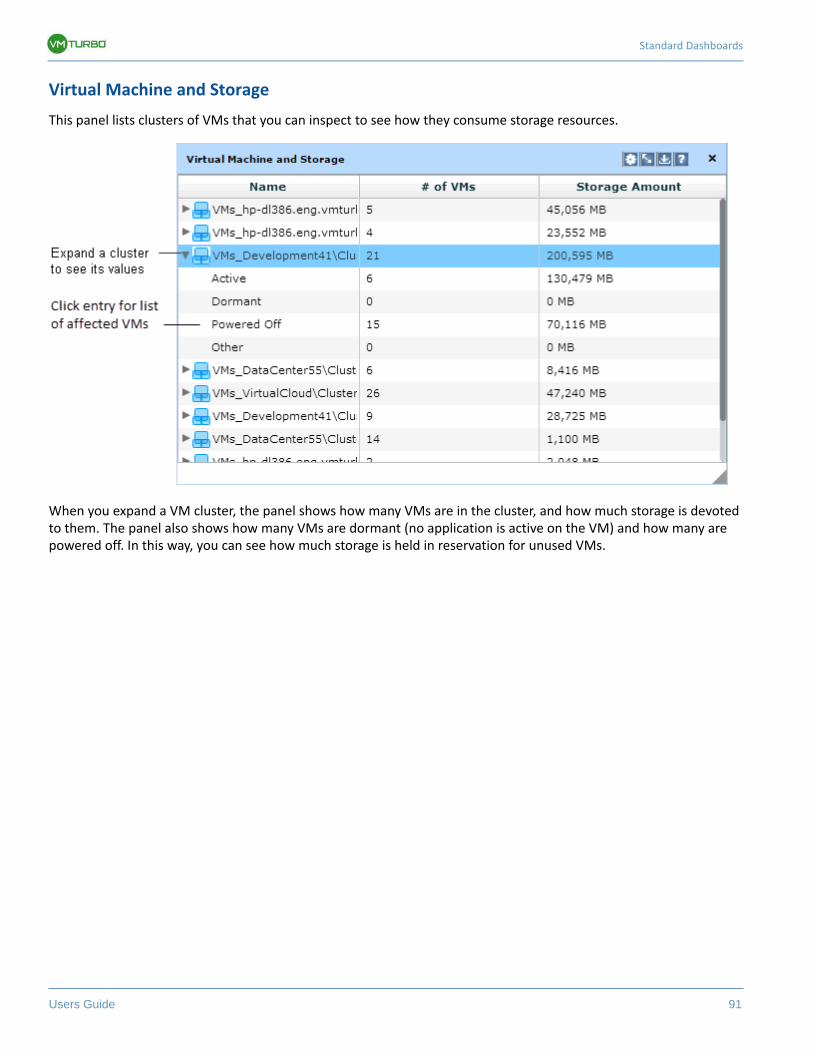
Standard Dashboards
Users Guide 91
Virtual Machine and Storage
This panel lists clusters of VMs that you can inspect to see how they consume storage resources.
When you expand a VM cluster, the panel shows how many VMs are in the cluster, and how much storage is devoted to them. The panel also shows how many VMs are dormant (no application is active on the VM) and how many are powered off. In this way, you can see how much storage is held in reservation for unused VMs.
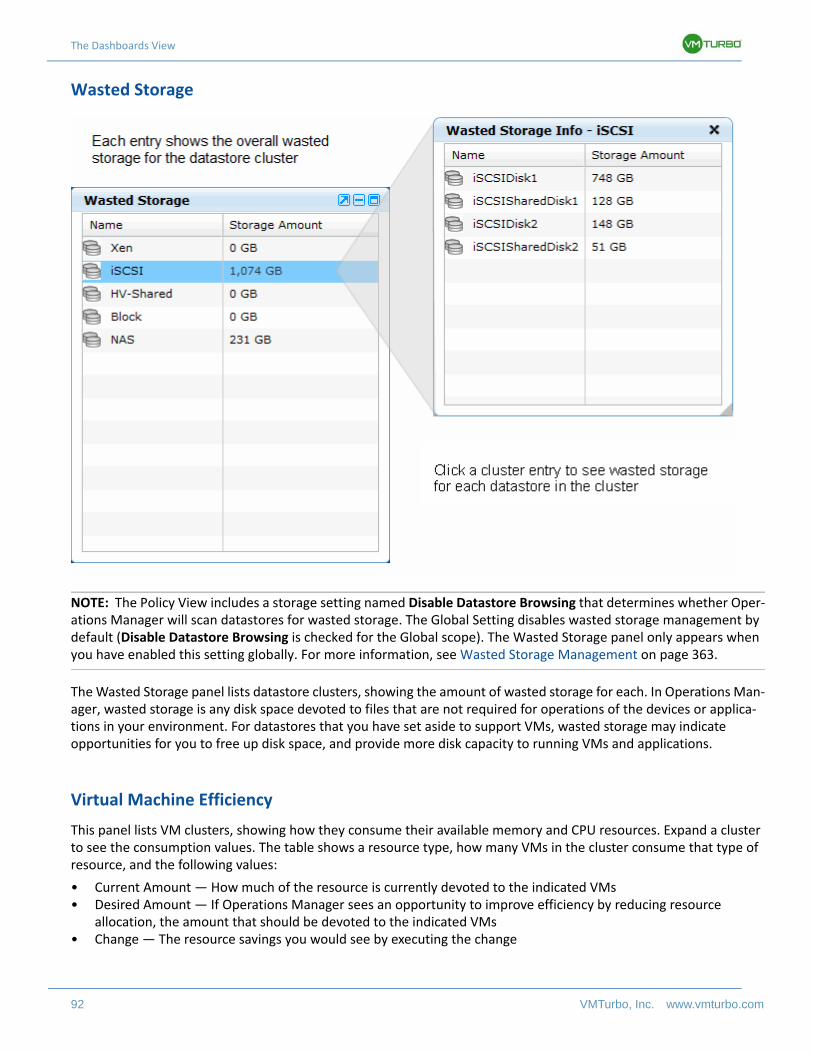
The Dashboards View
92 VMTurbo, Inc. www.vmturbo.com
Wasted Storage
NOTE: The Policy View includes a storage setting named Disable Datastore Browsing that determines whether Oper-ations Manager will scan datastores for wasted storage. The Global Setting disables wasted storage management by default (Disable Datastore Browsing is checked for the Global scope). The Wasted Storage panel only appears when you have enabled this setting globally. For more information, see Wasted Storage Management on page 363.
The Wasted Storage panel lists datastore clusters, showing the amount of wasted storage for each. In Operations Man-ager, wasted storage is any disk space devoted to files that are not required for operations of the devices or applica-tions in your environment. For datastores that you have set aside to support VMs, wasted storage may indicate opportunities for you to free up disk space, and provide more disk capacity to running VMs and applications.
Virtual Machine Efficiency
This panel lists VM clusters, showing how they consume their available memory and CPU resources. Expand a cluster to see the consumption values. The table shows a resource type, how many VMs in the cluster consume that type of resource, and the following values:
• Current Amount — How much of the resource is currently devoted to the indicated VMs• Desired Amount — If Operations Manager sees an opportunity to improve efficiency by reducing resource
allocation, the amount that should be devoted to the indicated VMs• Change — The resource savings you would see by executing the change
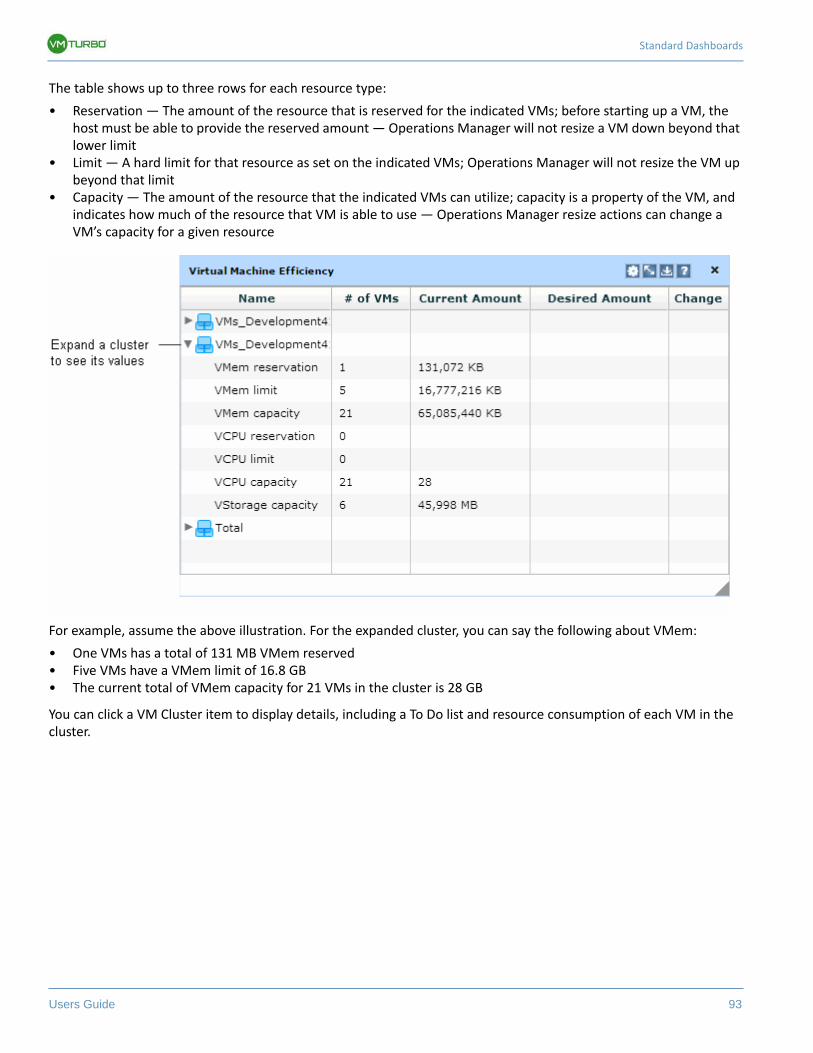
Standard Dashboards
Users Guide 93
The table shows up to three rows for each resource type:
• Reservation — The amount of the resource that is reserved for the indicated VMs; before starting up a VM, the host must be able to provide the reserved amount — Operations Manager will not resize a VM down beyond that lower limit
• Limit — A hard limit for that resource as set on the indicated VMs; Operations Manager will not resize the VM up beyond that limit
• Capacity — The amount of the resource that the indicated VMs can utilize; capacity is a property of the VM, and indicates how much of the resource that VM is able to use — Operations Manager resize actions can change a VM’s capacity for a given resource
For example, assume the above illustration. For the expanded cluster, you can say the following about VMem:
• One VMs has a total of 131 MB VMem reserved• Five VMs have a VMem limit of 16.8 GB• The current total of VMem capacity for 21 VMs in the cluster is 28 GB
You can click a VM Cluster item to display details, including a To Do list and resource consumption of each VM in the cluster.
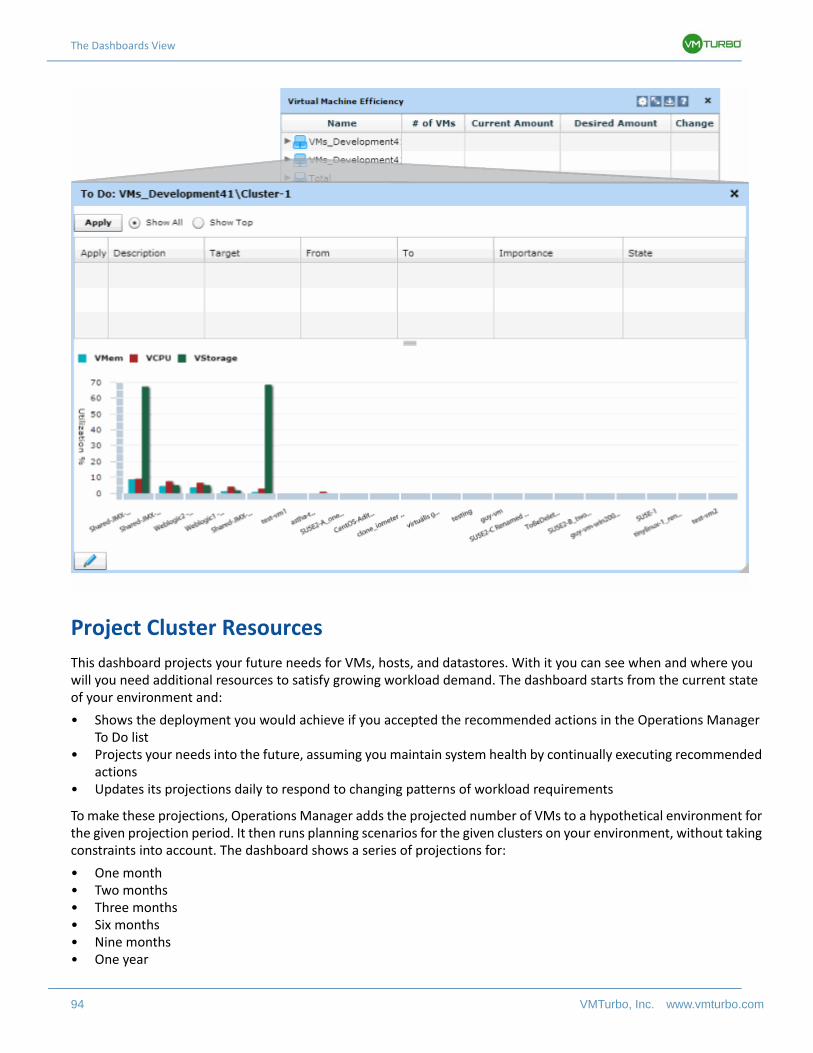
The Dashboards View
94 VMTurbo, Inc. www.vmturbo.com
Project Cluster Resources
This dashboard projects your future needs for VMs, hosts, and datastores. With it you can see when and where you will you need additional resources to satisfy growing workload demand. The dashboard starts from the current state of your environment and:
• Shows the deployment you would achieve if you accepted the recommended actions in the Operations Manager To Do list
• Projects your needs into the future, assuming you maintain system health by continually executing recommended actions
• Updates its projections daily to respond to changing patterns of workload requirements
To make these projections, Operations Manager adds the projected number of VMs to a hypothetical environment for the given projection period. It then runs planning scenarios for the given clusters on your environment, without taking constraints into account. The dashboard shows a series of projections for:
• One month• Two months• Three months• Six months• Nine months• One year
Standard Dashboards
Users Guide 95
NOTE: When you first install and start up Operations Manager, it can take a number of days before it runs projections for all the clusters in your environment.
The reliability of a projection depends on the amount of historical data it can use to establish a curve and extrapolate. For example, a 12 month projection based on two weeks of data is not as reliable as 12 months based on 90 days of historical data. If the system has not been running long enough to accumulate 60 days of data, Operations Manager uses the available data to generate projections as follows:
• With less than 6 days of historical data, the first- and second-month projections will show flat lines. The other projections will be blank.
• With less than 30 days of historical data, the dashboard calculates the first- and second-month projections. The other projections will be blank.
• With more than 30 days of historical data, the dashboard calculates projections up to the 12th-month.
The projections use historical data to investigate how workload has been added in the past, and project the antici-pated workload in the future. For example:
• For the first-month projection, it looks at how many VMs were added in the previous month, and are still present in your environment. For example, if you added 6 VMs last month, and one has been removed, then the 1-month projection adds another five VMs.
• For the second-month projection, Operations Manager uses two months of history in a similar way. For example, if you added eight VMs two months ago, and five of those are still in your environment, then the projection assumes 10 VMs — five for two months ago, and five for last month.
• For the third-month projection, the calculations are the same, only using three months of data.• For the 6-, 9-and 12-month projections, Operations Manager uses the three-month calculation, and multiplies it
by 2, 3, and 4, respectively.
As workload changes and you add more VMs to your environment, the projections assume a similar rate of growth. If growth continues at that rate, the projections show when you will need to add new physical resources to support growing demand.
The dashboard displays the following panels:
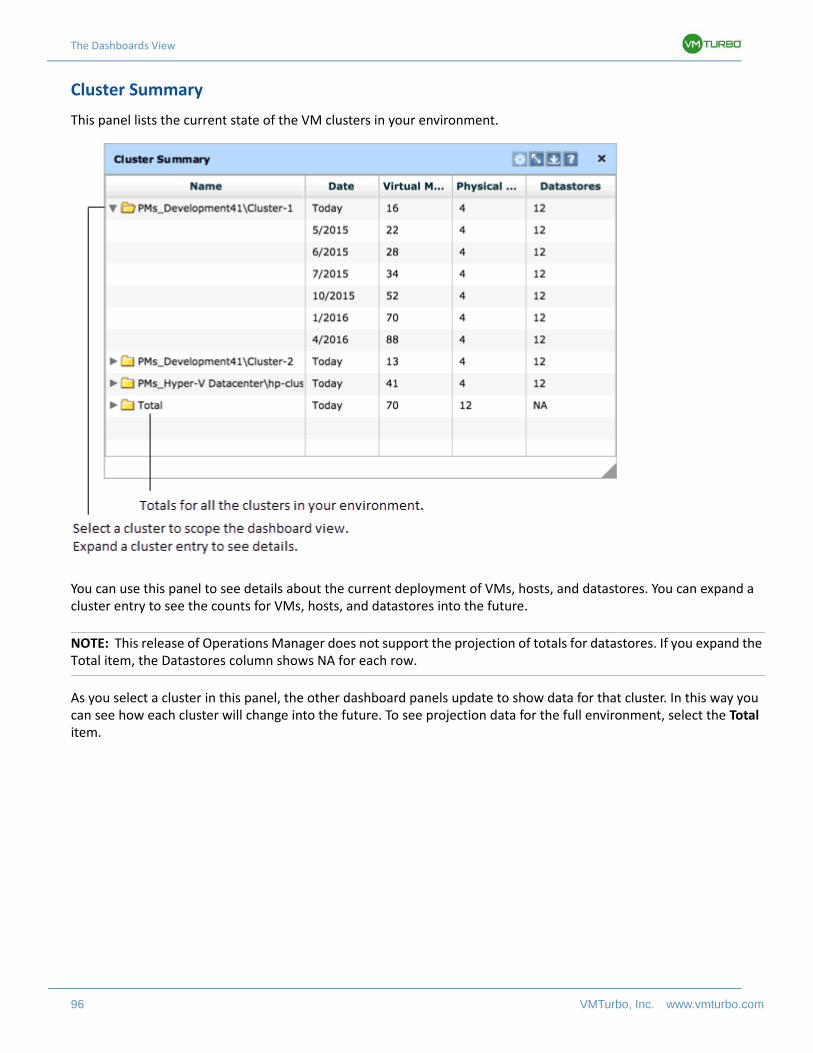
The Dashboards View
96 VMTurbo, Inc. www.vmturbo.com
Cluster Summary
This panel lists the current state of the VM clusters in your environment.
You can use this panel to see details about the current deployment of VMs, hosts, and datastores. You can expand a cluster entry to see the counts for VMs, hosts, and datastores into the future.
NOTE: This release of Operations Manager does not support the projection of totals for datastores. If you expand the Total item, the Datastores column shows NA for each row.
As you select a cluster in this panel, the other dashboard panels update to show data for that cluster. In this way you can see how each cluster will change into the future. To see projection data for the full environment, select the Total item.
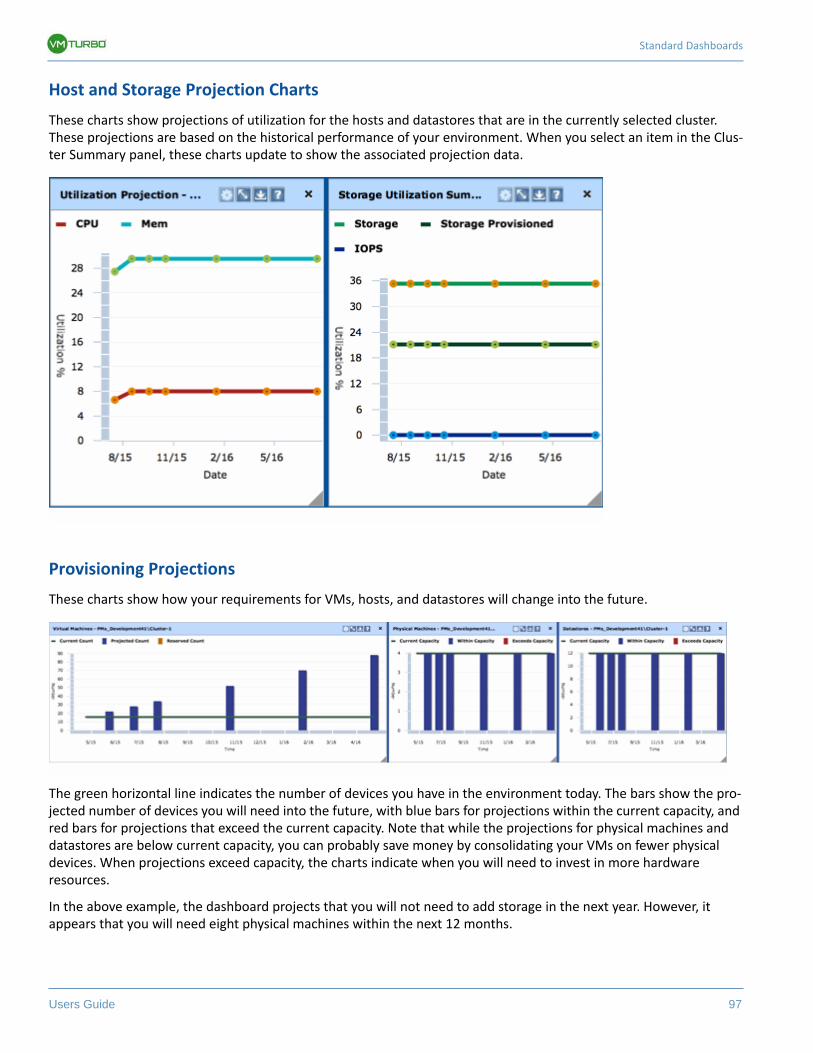
Standard Dashboards
Users Guide 97
Host and Storage Projection Charts
These charts show projections of utilization for the hosts and datastores that are in the currently selected cluster. These projections are based on the historical performance of your environment. When you select an item in the Clus-ter Summary panel, these charts update to show the associated projection data.
Provisioning Projections
These charts show how your requirements for VMs, hosts, and datastores will change into the future.
The green horizontal line indicates the number of devices you have in the environment today. The bars show the pro-jected number of devices you will need into the future, with blue bars for projections within the current capacity, and red bars for projections that exceed the current capacity. Note that while the projections for physical machines and datastores are below current capacity, you can probably save money by consolidating your VMs on fewer physical devices. When projections exceed capacity, the charts indicate when you will need to invest in more hardware resources.
In the above example, the dashboard projects that you will not need to add storage in the next year. However, it appears that you will need eight physical machines within the next 12 months.
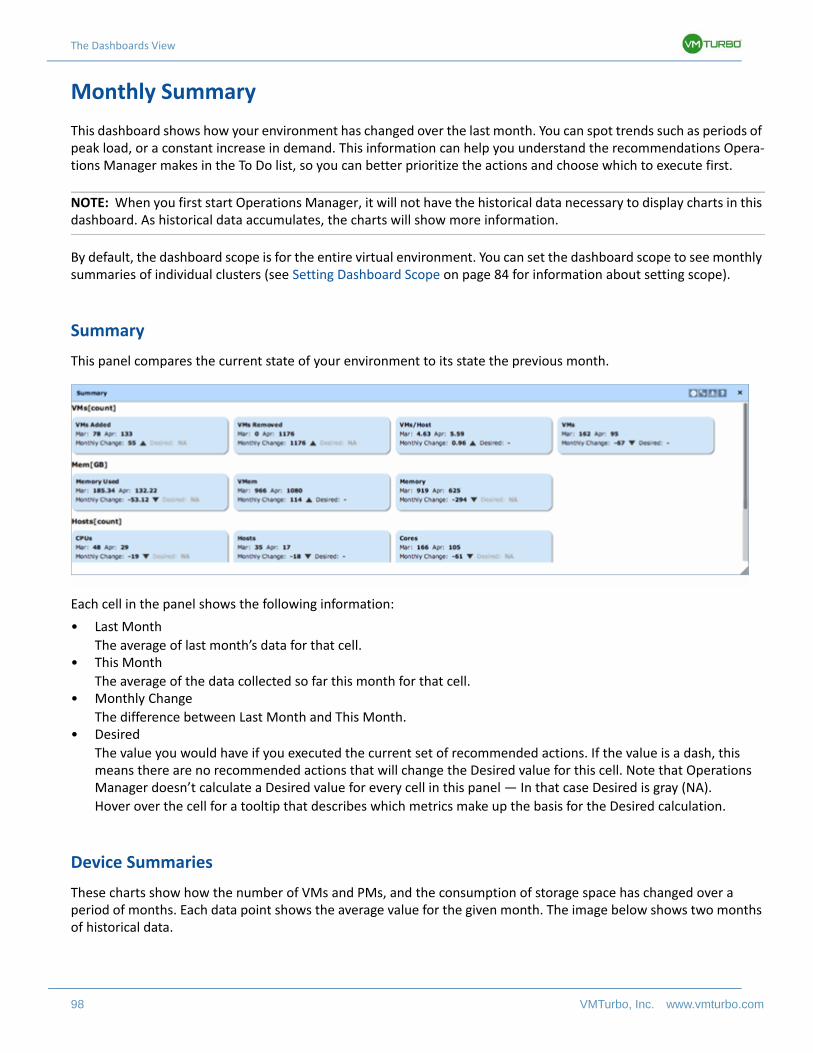
The Dashboards View
98 VMTurbo, Inc. www.vmturbo.com
Monthly Summary
This dashboard shows how your environment has changed over the last month. You can spot trends such as periods of peak load, or a constant increase in demand. This information can help you understand the recommendations Opera-tions Manager makes in the To Do list, so you can better prioritize the actions and choose which to execute first.
NOTE: When you first start Operations Manager, it will not have the historical data necessary to display charts in this dashboard. As historical data accumulates, the charts will show more information.
By default, the dashboard scope is for the entire virtual environment. You can set the dashboard scope to see monthly summaries of individual clusters (see Setting Dashboard Scope on page 84 for information about setting scope).
Summary
This panel compares the current state of your environment to its state the previous month.
Each cell in the panel shows the following information:
• Last Month
The average of last month’s data for that cell.• This Month
The average of the data collected so far this month for that cell.• Monthly Change
The difference between Last Month and This Month.• Desired
The value you would have if you executed the current set of recommended actions. If the value is a dash, this means there are no recommended actions that will change the Desired value for this cell. Note that Operations Manager doesn’t calculate a Desired value for every cell in this panel — In that case Desired is gray (NA).
Hover over the cell for a tooltip that describes which metrics make up the basis for the Desired calculation.
Device Summaries
These charts show how the number of VMs and PMs, and the consumption of storage space has changed over a period of months. Each data point shows the average value for the given month. The image below shows two months of historical data.
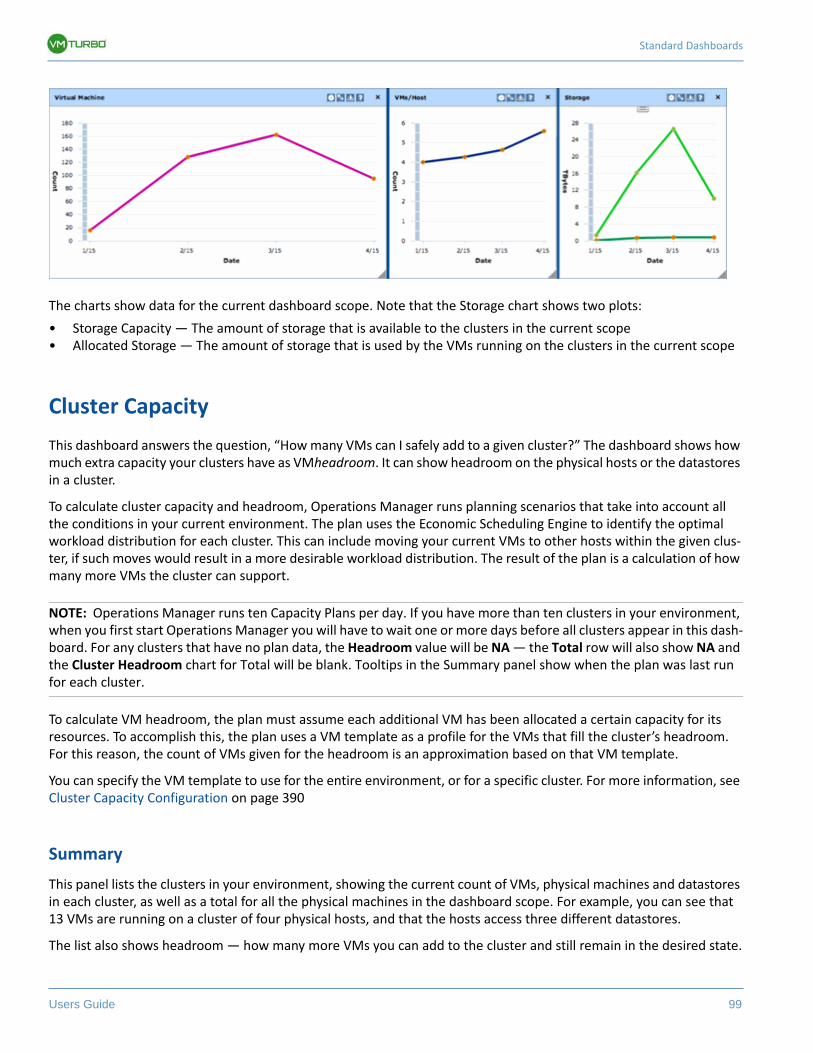
Standard Dashboards
Users Guide 99
The charts show data for the current dashboard scope. Note that the Storage chart shows two plots:
• Storage Capacity — The amount of storage that is available to the clusters in the current scope• Allocated Storage — The amount of storage that is used by the VMs running on the clusters in the current scope
Cluster Capacity
This dashboard answers the question, “How many VMs can I safely add to a given cluster?” The dashboard shows how much extra capacity your clusters have as VMheadroom. It can show headroom on the physical hosts or the datastores in a cluster.
To calculate cluster capacity and headroom, Operations Manager runs planning scenarios that take into account all the conditions in your current environment. The plan uses the Economic Scheduling Engine to identify the optimal workload distribution for each cluster. This can include moving your current VMs to other hosts within the given clus-ter, if such moves would result in a more desirable workload distribution. The result of the plan is a calculation of how many more VMs the cluster can support.
NOTE: Operations Manager runs ten Capacity Plans per day. If you have more than ten clusters in your environment, when you first start Operations Manager you will have to wait one or more days before all clusters appear in this dash-board. For any clusters that have no plan data, the Headroom value will be NA — the Total row will also show NA and the Cluster Headroom chart for Total will be blank. Tooltips in the Summary panel show when the plan was last run for each cluster.
To calculate VM headroom, the plan must assume each additional VM has been allocated a certain capacity for its resources. To accomplish this, the plan uses a VM template as a profile for the VMs that fill the cluster’s headroom. For this reason, the count of VMs given for the headroom is an approximation based on that VM template.
You can specify the VM template to use for the entire environment, or for a specific cluster. For more information, see Cluster Capacity Configuration on page 390
Summary
This panel lists the clusters in your environment, showing the current count of VMs, physical machines and datastores in each cluster, as well as a total for all the physical machines in the dashboard scope. For example, you can see that 13 VMs are running on a cluster of four physical hosts, and that the hosts access three different datastores.
The list also shows headroom — how many more VMs you can add to the cluster and still remain in the desired state.
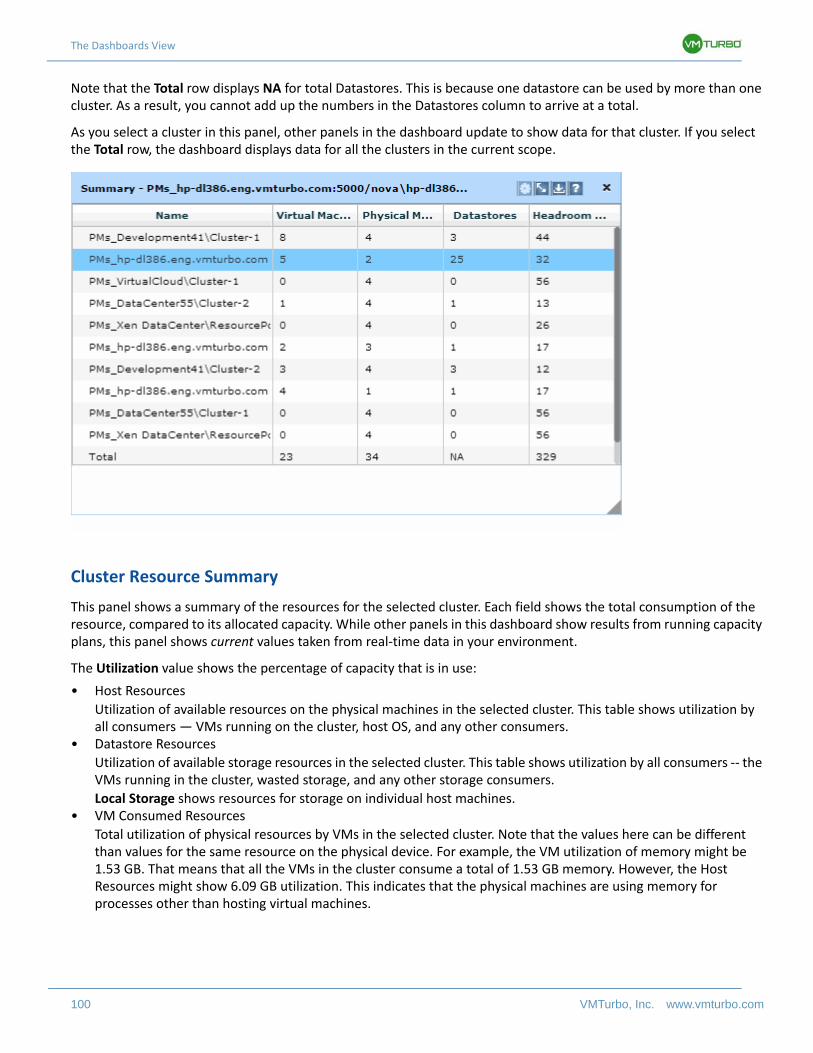
The Dashboards View
100 VMTurbo, Inc. www.vmturbo.com
Note that the Total row displays NA for total Datastores. This is because one datastore can be used by more than one cluster. As a result, you cannot add up the numbers in the Datastores column to arrive at a total.
As you select a cluster in this panel, other panels in the dashboard update to show data for that cluster. If you select the Total row, the dashboard displays data for all the clusters in the current scope.
Cluster Resource Summary
This panel shows a summary of the resources for the selected cluster. Each field shows the total consumption of the resource, compared to its allocated capacity. While other panels in this dashboard show results from running capacity plans, this panel shows current values taken from real-time data in your environment.
The Utilization value shows the percentage of capacity that is in use:
• Host Resources
Utilization of available resources on the physical machines in the selected cluster. This table shows utilization by all consumers — VMs running on the cluster, host OS, and any other consumers.
• Datastore Resources
Utilization of available storage resources in the selected cluster. This table shows utilization by all consumers -- the VMs running in the cluster, wasted storage, and any other storage consumers.
Local Storage shows resources for storage on individual host machines.• VM Consumed Resources
Total utilization of physical resources by VMs in the selected cluster. Note that the values here can be different than values for the same resource on the physical device. For example, the VM utilization of memory might be 1.53 GB. That means that all the VMs in the cluster consume a total of 1.53 GB memory. However, the Host Resources might show 6.09 GB utilization. This indicates that the physical machines are using memory for processes other than hosting virtual machines.
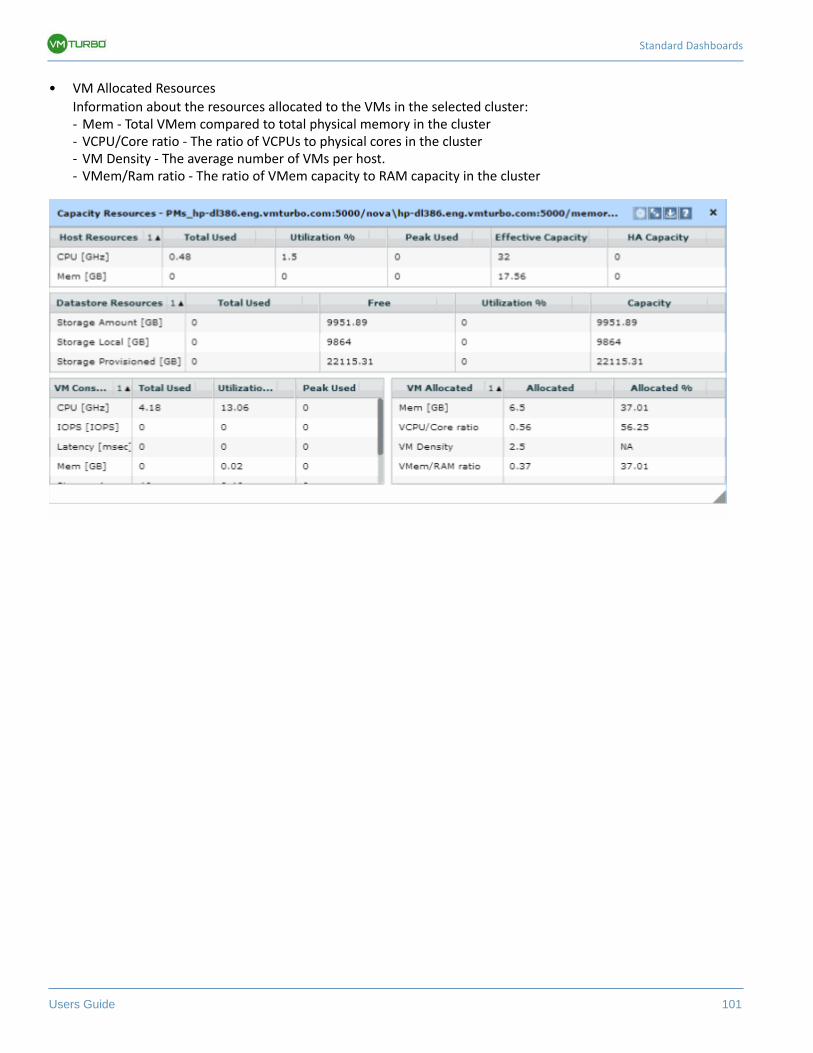
Standard Dashboards
Users Guide 101
• VM Allocated Resources
Information about the resources allocated to the VMs in the selected cluster:- Mem - Total VMem compared to total physical memory in the cluster- VCPU/Core ratio - The ratio of VCPUs to physical cores in the cluster- VM Density - The average number of VMs per host.- VMem/Ram ratio - The ratio of VMem capacity to RAM capacity in the cluster
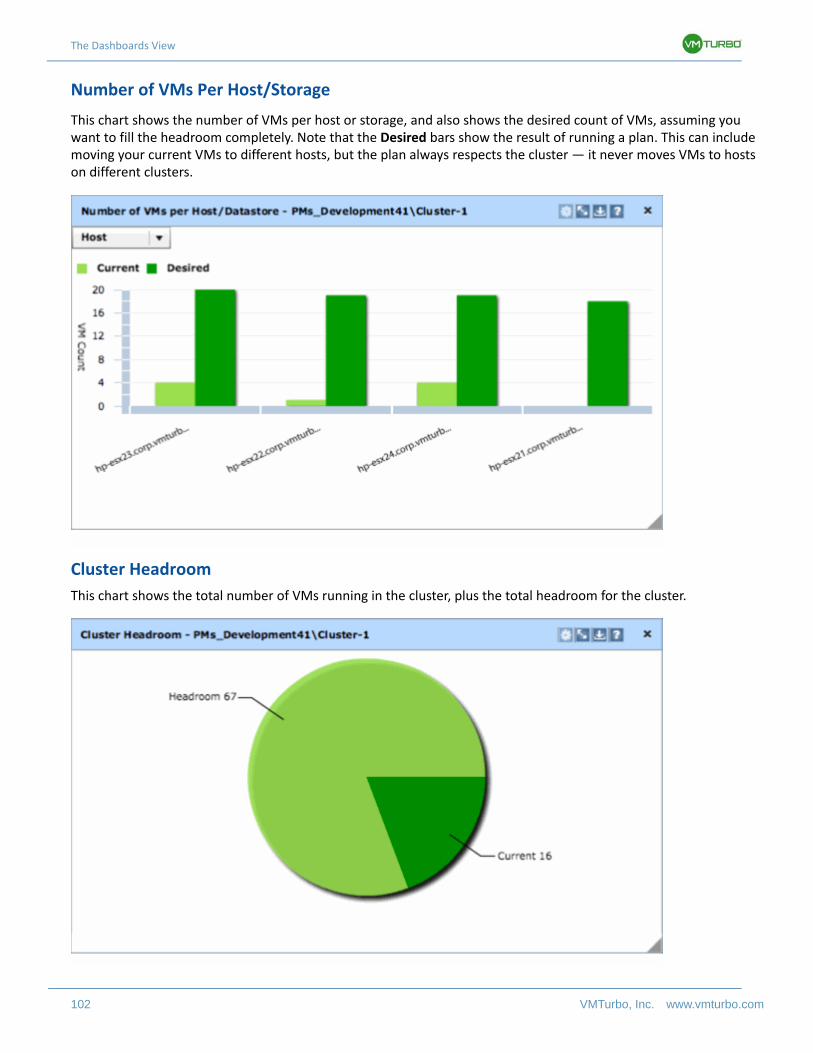
The Dashboards View
102 VMTurbo, Inc. www.vmturbo.com
Number of VMs Per Host/Storage
This chart shows the number of VMs per host or storage, and also shows the desired count of VMs, assuming you want to fill the headroom completely. Note that the Desired bars show the result of running a plan. This can include moving your current VMs to different hosts, but the plan always respects the cluster — it never moves VMs to hosts on different clusters.
Cluster Headroom
This chart shows the total number of VMs running in the cluster, plus the total headroom for the cluster.
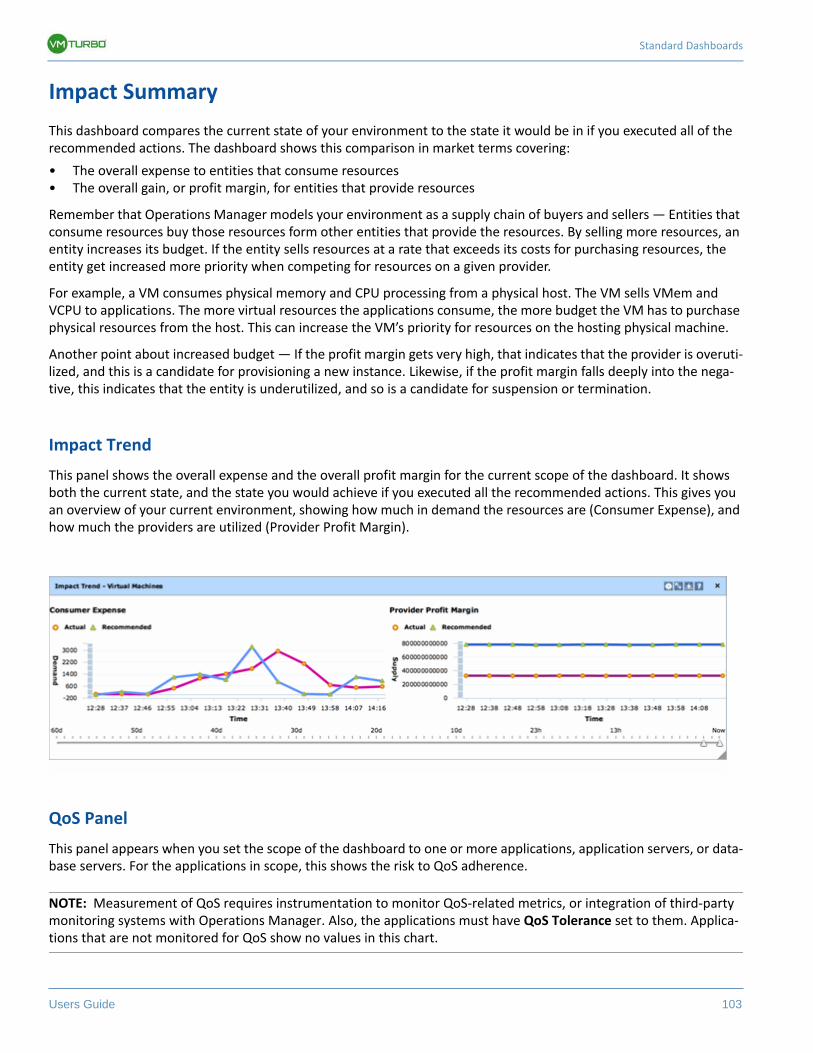
Standard Dashboards
Users Guide 103
Impact Summary
This dashboard compares the current state of your environment to the state it would be in if you executed all of the recommended actions. The dashboard shows this comparison in market terms covering:
• The overall expense to entities that consume resources• The overall gain, or profit margin, for entities that provide resources
Remember that Operations Manager models your environment as a supply chain of buyers and sellers — Entities that consume resources buy those resources form other entities that provide the resources. By selling more resources, an entity increases its budget. If the entity sells resources at a rate that exceeds its costs for purchasing resources, the entity get increased more priority when competing for resources on a given provider.
For example, a VM consumes physical memory and CPU processing from a physical host. The VM sells VMem and VCPU to applications. The more virtual resources the applications consume, the more budget the VM has to purchase physical resources from the host. This can increase the VM’s priority for resources on the hosting physical machine.
Another point about increased budget — If the profit margin gets very high, that indicates that the provider is overuti-lized, and this is a candidate for provisioning a new instance. Likewise, if the profit margin falls deeply into the nega-tive, this indicates that the entity is underutilized, and so is a candidate for suspension or termination.
Impact Trend
This panel shows the overall expense and the overall profit margin for the current scope of the dashboard. It shows both the current state, and the state you would achieve if you executed all the recommended actions. This gives you an overview of your current environment, showing how much in demand the resources are (Consumer Expense), and how much the providers are utilized (Provider Profit Margin).
QoS Panel
This panel appears when you set the scope of the dashboard to one or more applications, application servers, or data-base servers. For the applications in scope, this shows the risk to QoS adherence.
NOTE: Measurement of QoS requires instrumentation to monitor QoS-related metrics, or integration of third-party monitoring systems with Operations Manager. Also, the applications must have QoS Tolerance set to them. Applica-tions that are not monitored for QoS show no values in this chart.
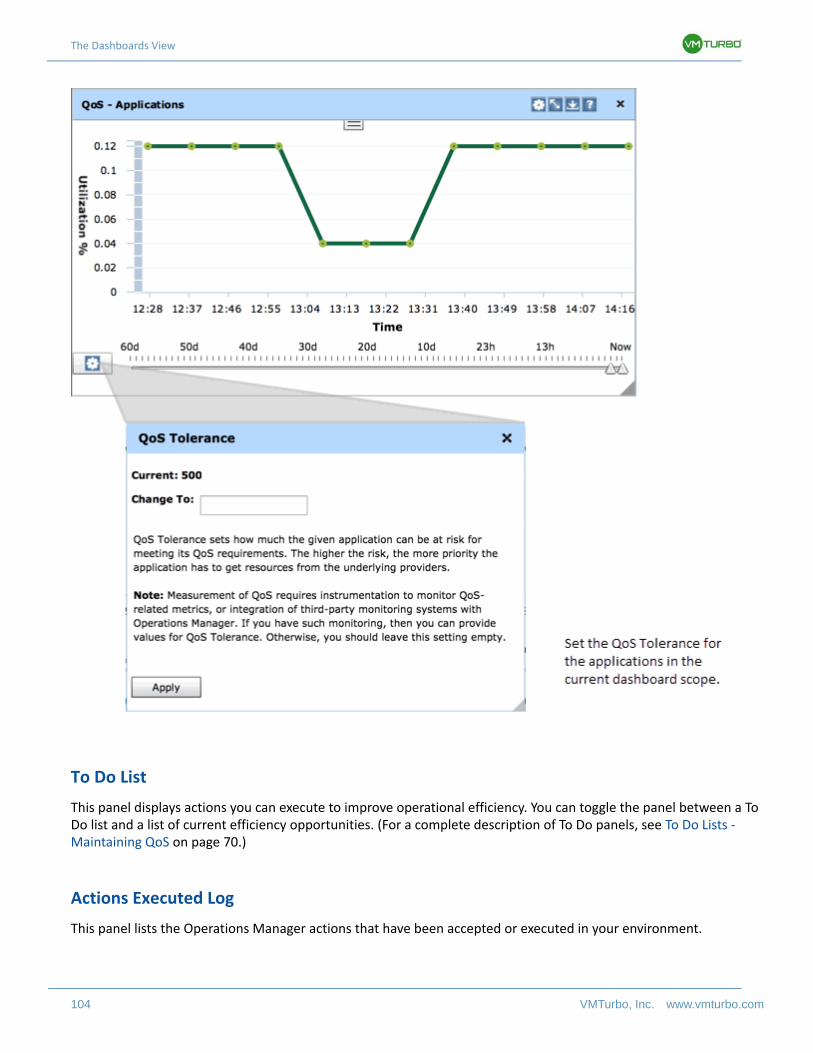
The Dashboards View
104 VMTurbo, Inc. www.vmturbo.com
To Do List
This panel displays actions you can execute to improve operational efficiency. You can toggle the panel between a To Do list and a list of current efficiency opportunities. (For a complete description of To Do panels, see To Do Lists - Maintaining QoS on page 70.)
Actions Executed Log
This panel lists the Operations Manager actions that have been accepted or executed in your environment.
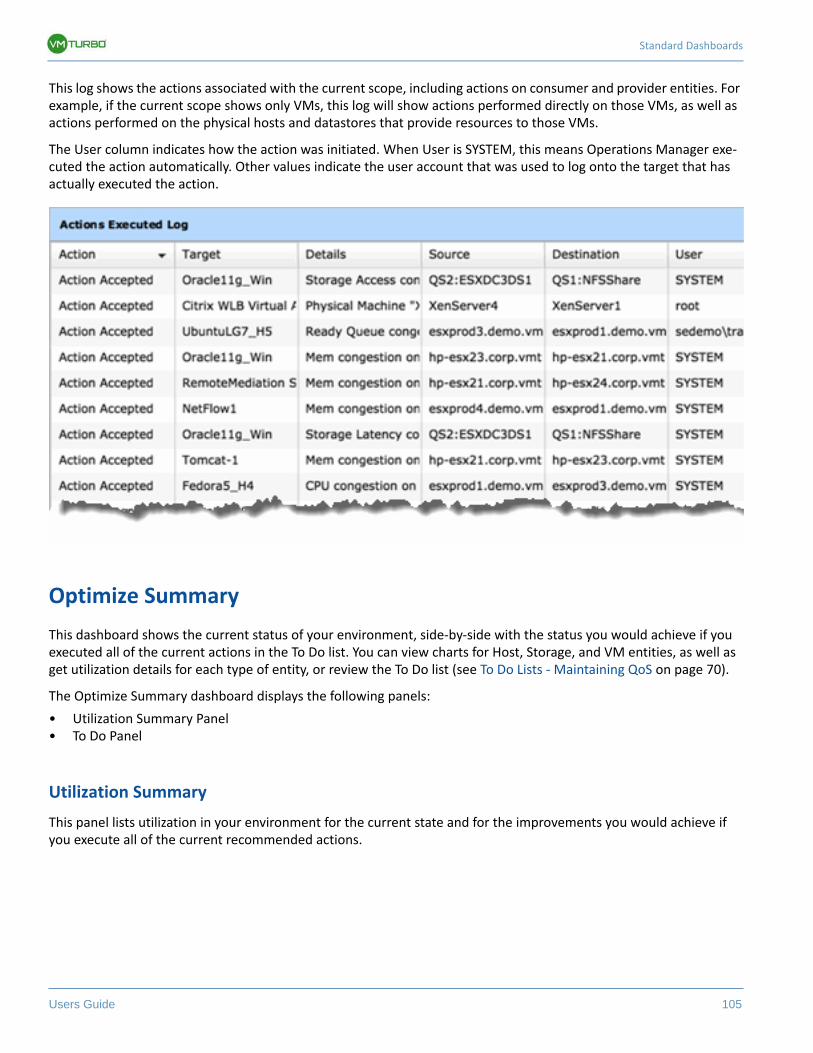
Standard Dashboards
Users Guide 105
This log shows the actions associated with the current scope, including actions on consumer and provider entities. For example, if the current scope shows only VMs, this log will show actions performed directly on those VMs, as well as actions performed on the physical hosts and datastores that provide resources to those VMs.
The User column indicates how the action was initiated. When User is SYSTEM, this means Operations Manager exe-cuted the action automatically. Other values indicate the user account that was used to log onto the target that has actually executed the action.
Optimize Summary
This dashboard shows the current status of your environment, side-by-side with the status you would achieve if you executed all of the current actions in the To Do list. You can view charts for Host, Storage, and VM entities, as well as get utilization details for each type of entity, or review the To Do list (see To Do Lists - Maintaining QoS on page 70).
The Optimize Summary dashboard displays the following panels:
• Utilization Summary Panel• To Do Panel
Utilization Summary
This panel lists utilization in your environment for the current state and for the improvements you would achieve if you execute all of the current recommended actions.
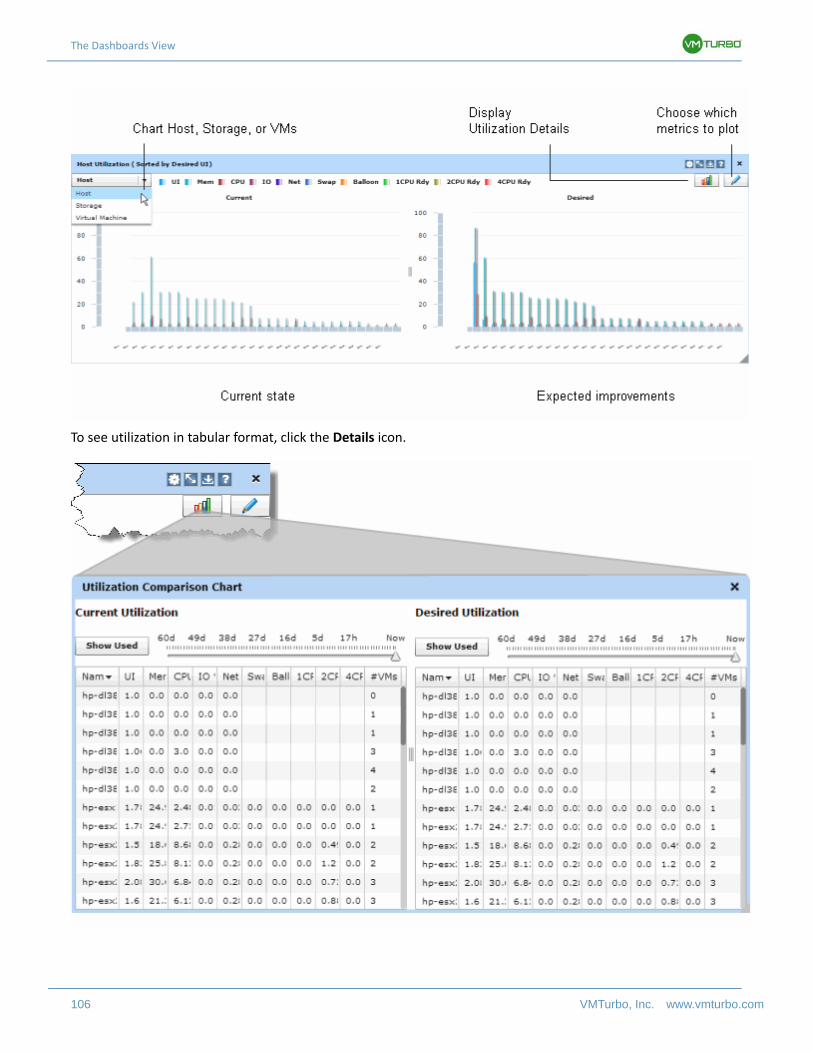
The Dashboards View
106 VMTurbo, Inc. www.vmturbo.com
To see utilization in tabular format, click the Details icon.
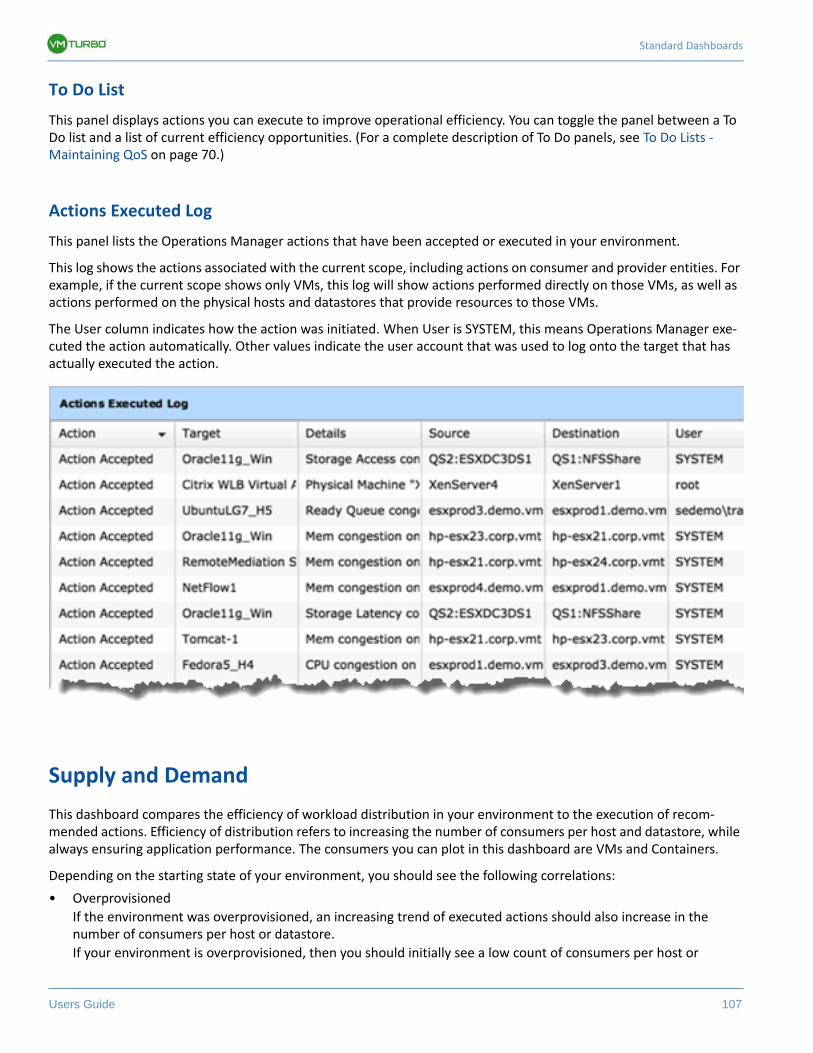
Standard Dashboards
Users Guide 107
To Do List
This panel displays actions you can execute to improve operational efficiency. You can toggle the panel between a To Do list and a list of current efficiency opportunities. (For a complete description of To Do panels, see To Do Lists - Maintaining QoS on page 70.)
Actions Executed Log
This panel lists the Operations Manager actions that have been accepted or executed in your environment.
This log shows the actions associated with the current scope, including actions on consumer and provider entities. For example, if the current scope shows only VMs, this log will show actions performed directly on those VMs, as well as actions performed on the physical hosts and datastores that provide resources to those VMs.
The User column indicates how the action was initiated. When User is SYSTEM, this means Operations Manager exe-cuted the action automatically. Other values indicate the user account that was used to log onto the target that has actually executed the action.
Supply and Demand
This dashboard compares the efficiency of workload distribution in your environment to the execution of recom-mended actions. Efficiency of distribution refers to increasing the number of consumers per host and datastore, while always ensuring application performance. The consumers you can plot in this dashboard are VMs and Containers.
Depending on the starting state of your environment, you should see the following correlations:
• Overprovisioned
If the environment was overprovisioned, an increasing trend of executed actions should also increase in the number of consumers per host or datastore.
If your environment is overprovisioned, then you should initially see a low count of consumers per host or
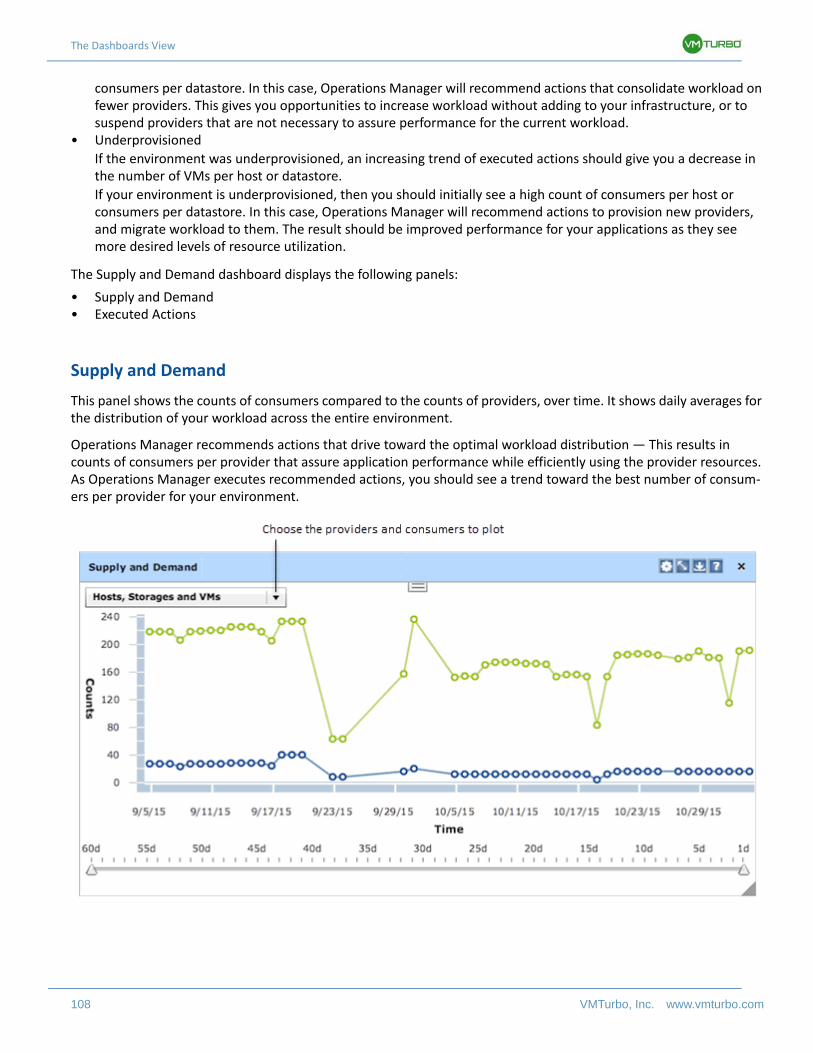
The Dashboards View
108 VMTurbo, Inc. www.vmturbo.com
consumers per datastore. In this case, Operations Manager will recommend actions that consolidate workload on fewer providers. This gives you opportunities to increase workload without adding to your infrastructure, or to suspend providers that are not necessary to assure performance for the current workload.
• Underprovisioned
If the environment was underprovisioned, an increasing trend of executed actions should give you a decrease in the number of VMs per host or datastore.
If your environment is underprovisioned, then you should initially see a high count of consumers per host or consumers per datastore. In this case, Operations Manager will recommend actions to provision new providers, and migrate workload to them. The result should be improved performance for your applications as they see more desired levels of resource utilization.
The Supply and Demand dashboard displays the following panels:
• Supply and Demand• Executed Actions
Supply and Demand
This panel shows the counts of consumers compared to the counts of providers, over time. It shows daily averages for the distribution of your workload across the entire environment.
Operations Manager recommends actions that drive toward the optimal workload distribution — This results in counts of consumers per provider that assure application performance while efficiently using the provider resources. As Operations Manager executes recommended actions, you should see a trend toward the best number of consum-ers per provider for your environment.
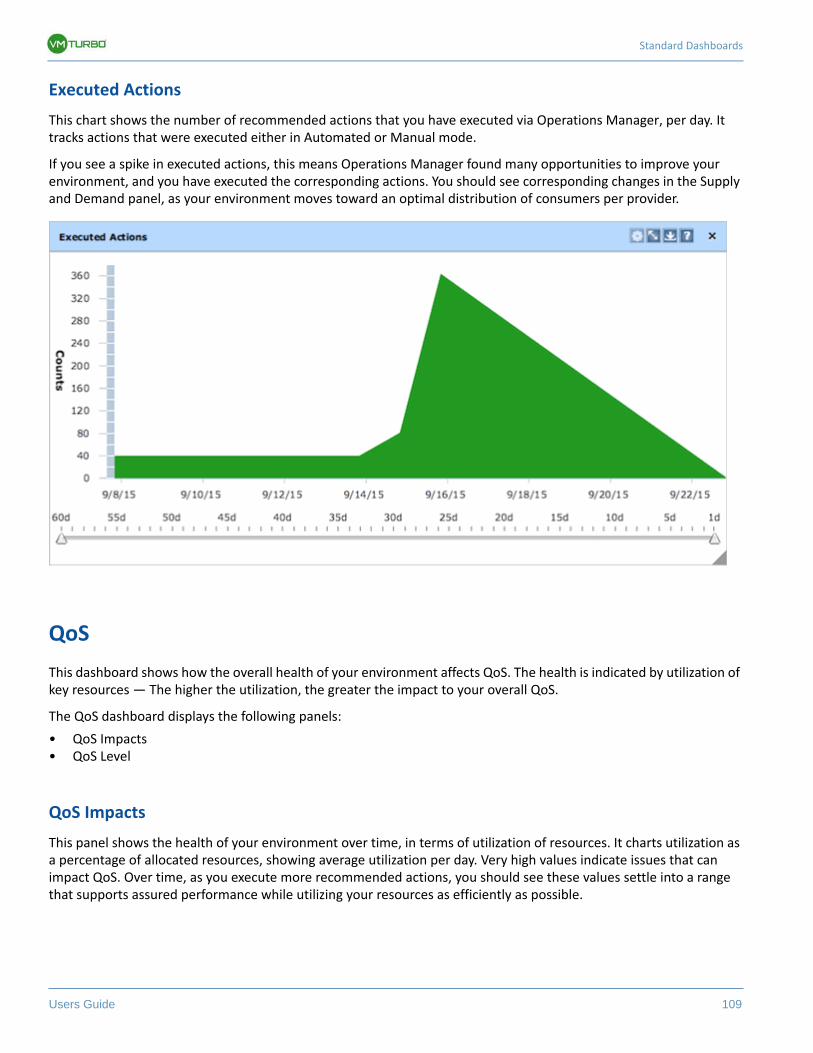
Standard Dashboards
Users Guide 109
Executed Actions
This chart shows the number of recommended actions that you have executed via Operations Manager, per day. It tracks actions that were executed either in Automated or Manual mode.
If you see a spike in executed actions, this means Operations Manager found many opportunities to improve your environment, and you have executed the corresponding actions. You should see corresponding changes in the Supply and Demand panel, as your environment moves toward an optimal distribution of consumers per provider.
QoS
This dashboard shows how the overall health of your environment affects QoS. The health is indicated by utilization of key resources — The higher the utilization, the greater the impact to your overall QoS.
The QoS dashboard displays the following panels:
• QoS Impacts• QoS Level
QoS Impacts
This panel shows the health of your environment over time, in terms of utilization of resources. It charts utilization as a percentage of allocated resources, showing average utilization per day. Very high values indicate issues that can impact QoS. Over time, as you execute more recommended actions, you should see these values settle into a range that supports assured performance while utilizing your resources as efficiently as possible.
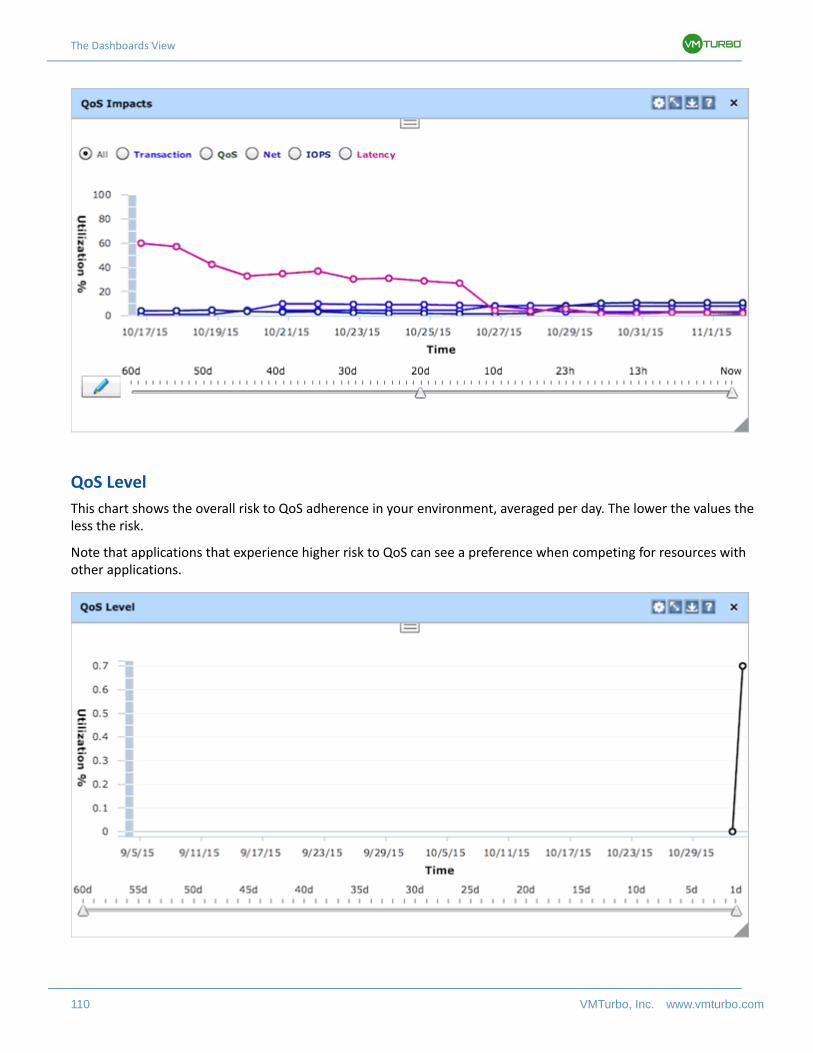
The Dashboards View
110 VMTurbo, Inc. www.vmturbo.com
QoS Level
This chart shows the overall risk to QoS adherence in your environment, averaged per day. The lower the values the less the risk.
Note that applications that experience higher risk to QoS can see a preference when competing for resources with other applications.
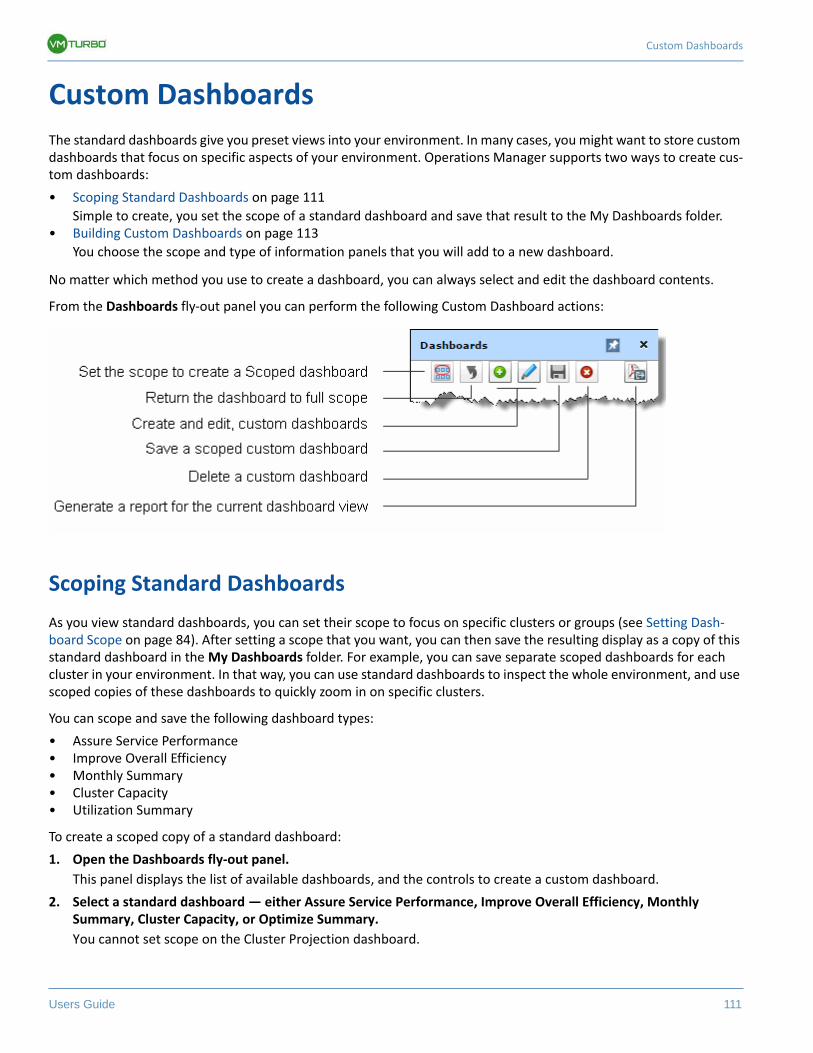
Custom Dashboards
Users Guide 111
Custom Dashboards
The standard dashboards give you preset views into your environment. In many cases, you might want to store custom dashboards that focus on specific aspects of your environment. Operations Manager supports two ways to create cus-tom dashboards:
• Scoping Standard Dashboards on page 111
Simple to create, you set the scope of a standard dashboard and save that result to the My Dashboards folder.• Building Custom Dashboards on page 113
You choose the scope and type of information panels that you will add to a new dashboard.
No matter which method you use to create a dashboard, you can always select and edit the dashboard contents.
From the Dashboards fly-out panel you can perform the following Custom Dashboard actions:
Scoping Standard Dashboards
As you view standard dashboards, you can set their scope to focus on specific clusters or groups (see Setting Dash-board Scope on page 84). After setting a scope that you want, you can then save the resulting display as a copy of this standard dashboard in the My Dashboards folder. For example, you can save separate scoped dashboards for each cluster in your environment. In that way, you can use standard dashboards to inspect the whole environment, and use scoped copies of these dashboards to quickly zoom in on specific clusters.
You can scope and save the following dashboard types:
• Assure Service Performance• Improve Overall Efficiency• Monthly Summary• Cluster Capacity• Utilization Summary
To create a scoped copy of a standard dashboard:
1. Open the Dashboards fly-out panel.
This panel displays the list of available dashboards, and the controls to create a custom dashboard.
2. Select a standard dashboard — either Assure Service Performance, Improve Overall Efficiency, Monthly Summary, Cluster Capacity, or Optimize Summary.
You cannot set scope on the Cluster Projection dashboard.
The Dashboards View
112 VMTurbo, Inc. www.vmturbo.com
3. Set the scope of the current dashboard.
Click the Scope button ( ) to open the User Scope dialog box, then set the scope. For more information, seeSet-ting Dashboard Scope on page 84.
4. Save the scope results as a copy of the standard dashboard
If you are satisfied with the scope results, click the Save button ( ) to open the Enter Scoped Group Name dialog box. Name the dashboard and click Ok.
The new dashboard appears in the My Dashboards folder.
5. Return the standard dashboard to its default scope.
Select the standard dashboard and click the Reset Scope button ( ) to return to the default scope.
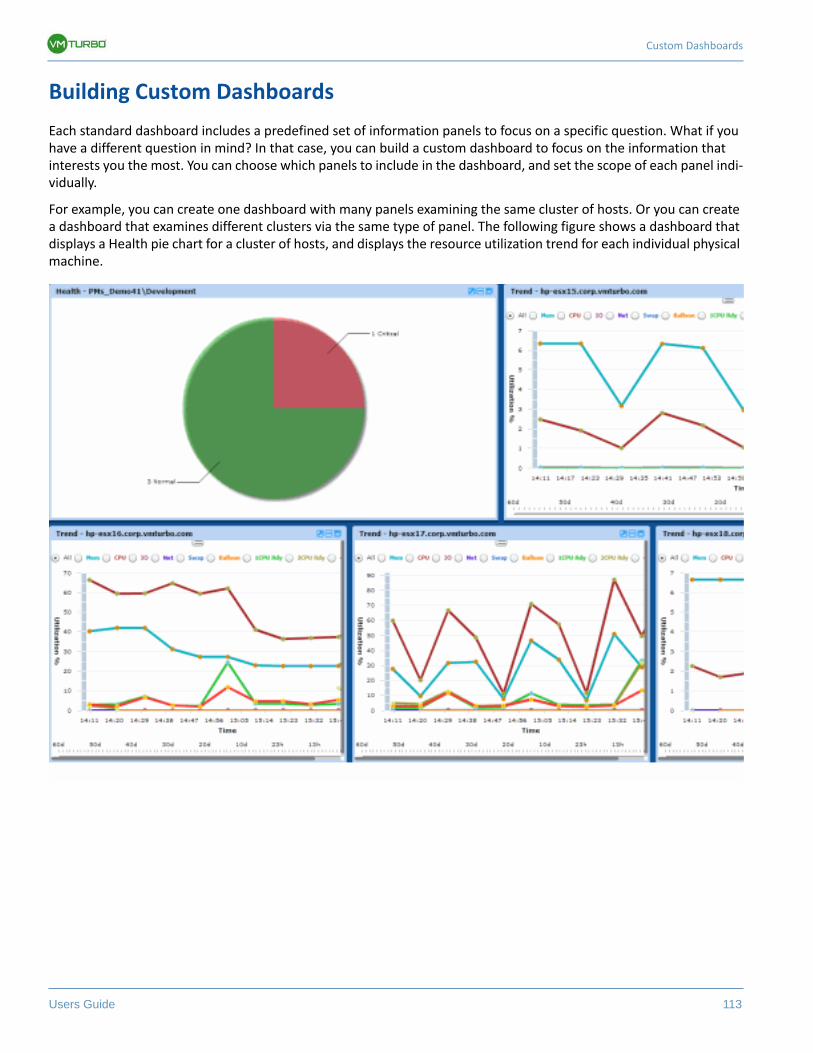
Custom Dashboards
Users Guide 113
Building Custom Dashboards
Each standard dashboard includes a predefined set of information panels to focus on a specific question. What if you have a different question in mind? In that case, you can build a custom dashboard to focus on the information that interests you the most. You can choose which panels to include in the dashboard, and set the scope of each panel indi-vidually.
For example, you can create one dashboard with many panels examining the same cluster of hosts. Or you can create a dashboard that examines different clusters via the same type of panel. The following figure shows a dashboard that displays a Health pie chart for a cluster of hosts, and displays the resource utilization trend for each individual physical machine.
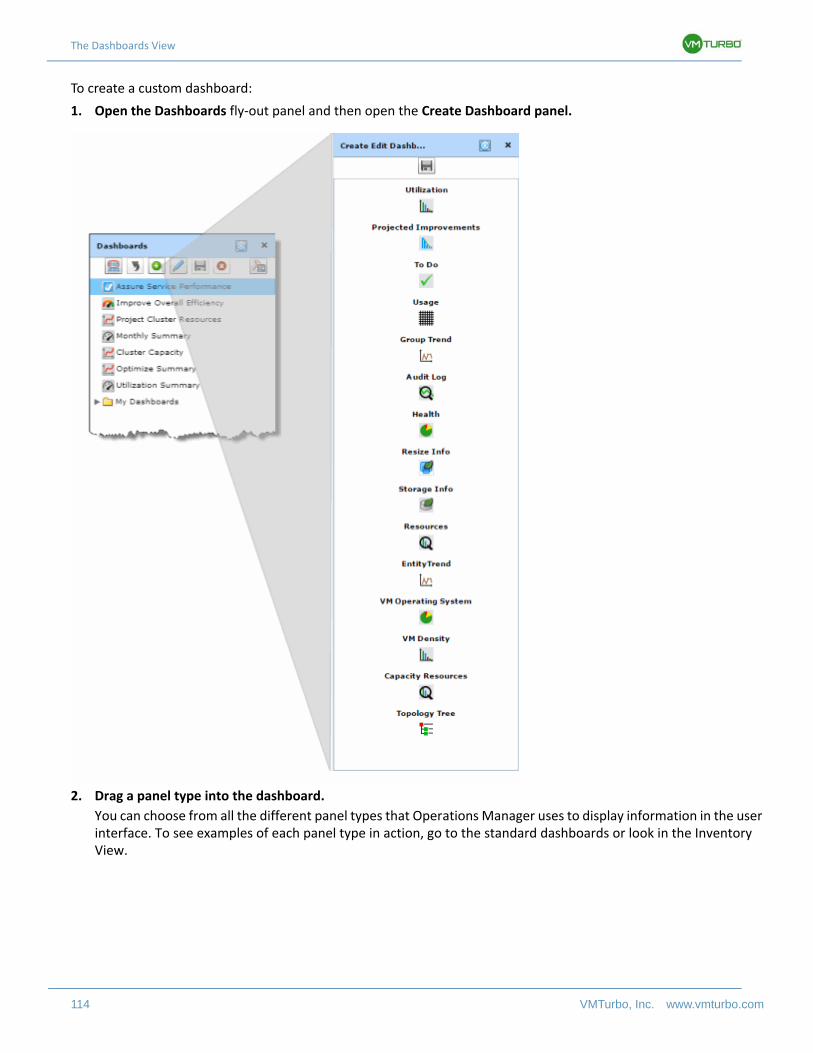
The Dashboards View
114 VMTurbo, Inc. www.vmturbo.com
To create a custom dashboard:
1. Open the Dashboards fly-out panel and then open the Create Dashboard panel.
2. Drag a panel type into the dashboard.
You can choose from all the different panel types that Operations Manager uses to display information in the user interface. To see examples of each panel type in action, go to the standard dashboards or look in the Inventory View.
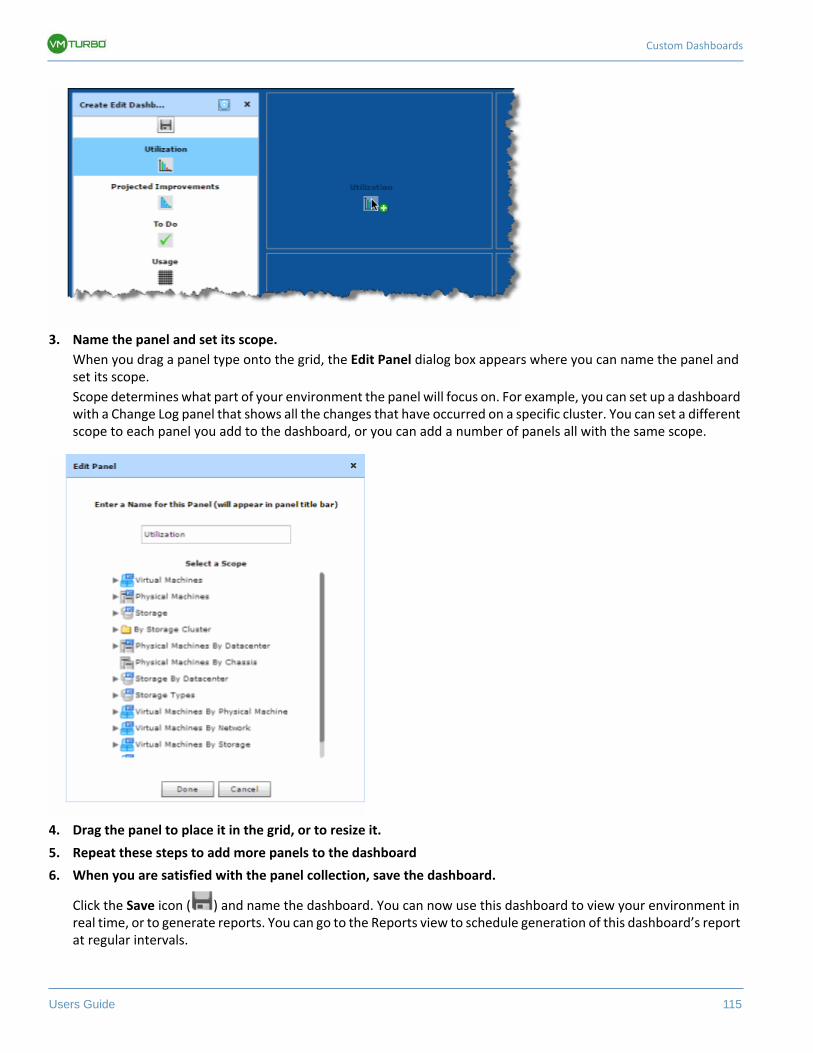
Custom Dashboards
Users Guide 115
3. Name the panel and set its scope.
When you drag a panel type onto the grid, the Edit Panel dialog box appears where you can name the panel and set its scope.
Scope determines what part of your environment the panel will focus on. For example, you can set up a dashboard with a Change Log panel that shows all the changes that have occurred on a specific cluster. You can set a different scope to each panel you add to the dashboard, or you can add a number of panels all with the same scope.
4. Drag the panel to place it in the grid, or to resize it.
5. Repeat these steps to add more panels to the dashboard
6. When you are satisfied with the panel collection, save the dashboard.
Click the Save icon ( ) and name the dashboard. You can now use this dashboard to view your environment in real time, or to generate reports. You can go to the Reports view to schedule generation of this dashboard’s report at regular intervals.
The Dashboards View
116 VMTurbo, Inc. www.vmturbo.com
You can always edit an existing dashboard:
• To drag new panels onto the grid, select the dashboard in the Dashboards fly-out panel and click Edit ( ).
This opens the Create Dashboard panel, which you can use to place different panels on the dashboard.• To change a panel’s scope or name, click the a panel, click the panel’s Settings icon.• To delete the a panel, click the panel’s Close box.
Editing Dashboards
You can always edit an existing custom dashboard, and you can create a customized copy of a standard dashboard. In either case, the steps are the same — you change the layout of the panels in the dashboard, or you change the prop-erties of panels in the dashboard. Then you save your changes.
When you save your changes, you get different results, depending on the type of dashboard you’re editing:
• Standard Dashboard
When you save changes to a standard dashboard, you create a copy of that dashboard — you do not modify the standard dashboard itself. This preserves the same set of standard dashboards for all Operations Manager users.
• Custom Dashboard
When you save changes to a custom dashboard, that preserves the changes you made to the custom dashboard.
The types of changes you can make are:
• Change dashboard layout• Change a panel’s properties• To drag new panels onto the grid, select the dashboard in the Dashboards fly-out panel and click Edit ( ).
This opens• To change a panel’s scope or name, click the a panel, click the panel’s Settings icon.• To delete the a panel, click the panel’s Close box.
Change Dashboard Layout
You can rearrange the panels on a dashboard, delete panels from it, or add new panels to it. After you make you
changes, be sure to click the Save icon ( ).
To rearrange the panels on a dashboard, you simply drag the bottom-right corner to change the panel size. You can drag a panel by its title bar to move it to a different location in the dashboard grid.
To delete a panel, click the panel’s Close box.
To add new panels to the current dashboard, click Edit ( ) to open the list of panel types that you can drag onto the dashboard grid. Before dragging a panel onto the grid, you should rearrange the current panels to make room for the new one.
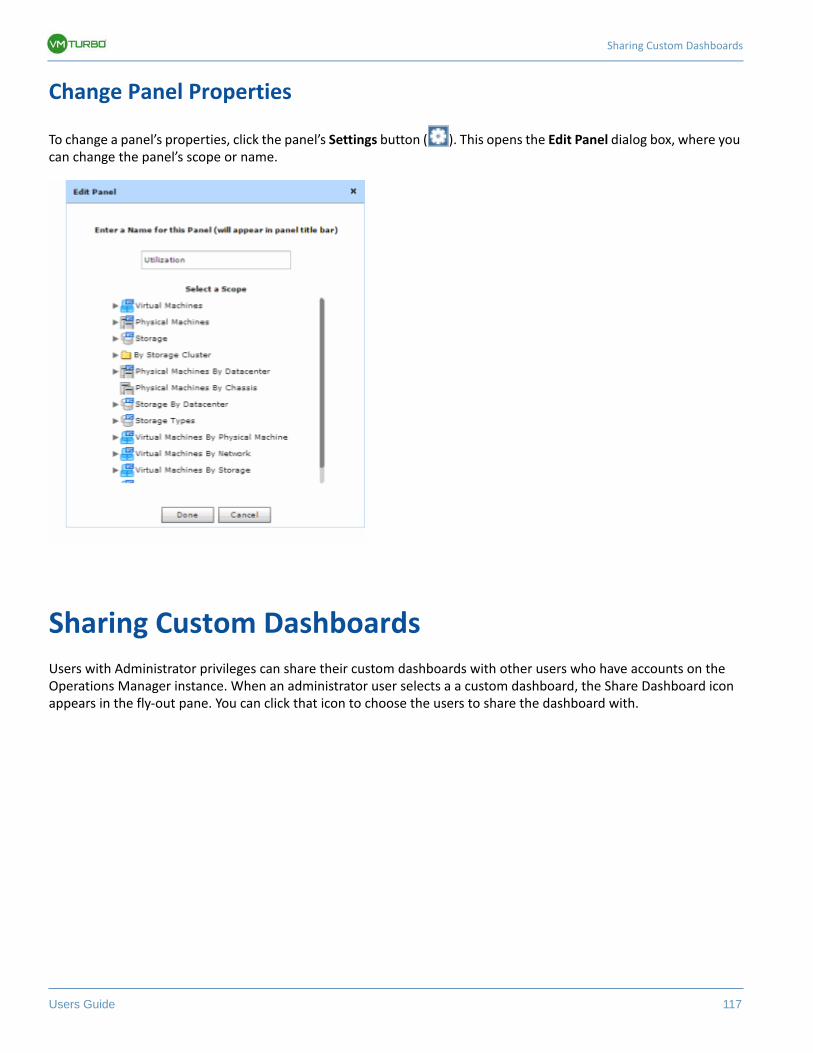
Sharing Custom Dashboards
Users Guide 117
Change Panel Properties
To change a panel’s properties, click the panel’s Settings button ( ). This opens the Edit Panel dialog box, where you can change the panel’s scope or name.
Sharing Custom Dashboards
Users with Administrator privileges can share their custom dashboards with other users who have accounts on the Operations Manager instance. When an administrator user selects a a custom dashboard, the Share Dashboard icon appears in the fly-out pane. You can click that icon to choose the users to share the dashboard with.
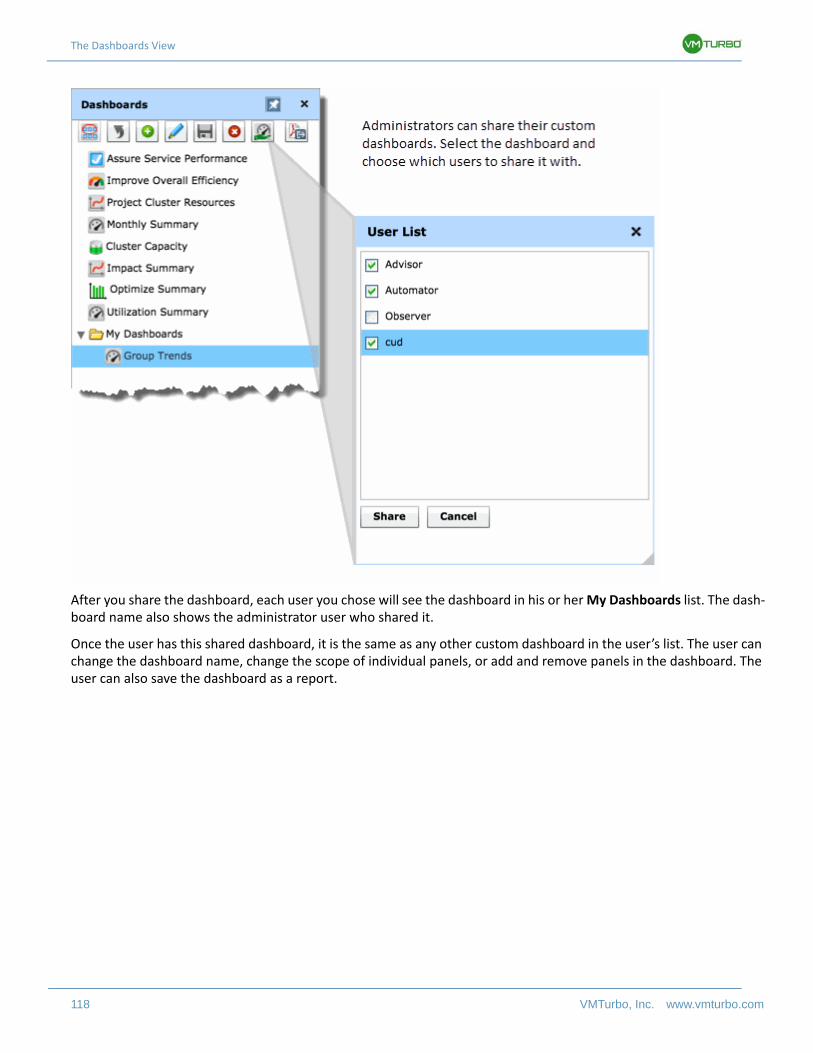
The Dashboards View
118 VMTurbo, Inc. www.vmturbo.com
After you share the dashboard, each user you chose will see the dashboard in his or her My Dashboards list. The dash-board name also shows the administrator user who shared it.
Once the user has this shared dashboard, it is the same as any other custom dashboard in the user’s list. The user can change the dashboard name, change the scope of individual panels, or add and remove panels in the dashboard. The user can also save the dashboard as a report.
Users Guide 119
The Supply Chain View
Operations Manager models your environment as a market of buyers and sellers linked together in a supply chain. This supply chain represents the flow of resources from the datacenter, through the physical tier of your environment into the virtual tier, ultimately delivering these resources to customers through applications. By managing relation-ships between these buyers and sellers, Operations Manager provides closed-loop management of resources, from the datacenter, through to the application. For more information about Operations Manager processing, see How Operations Manager Works on page 11.
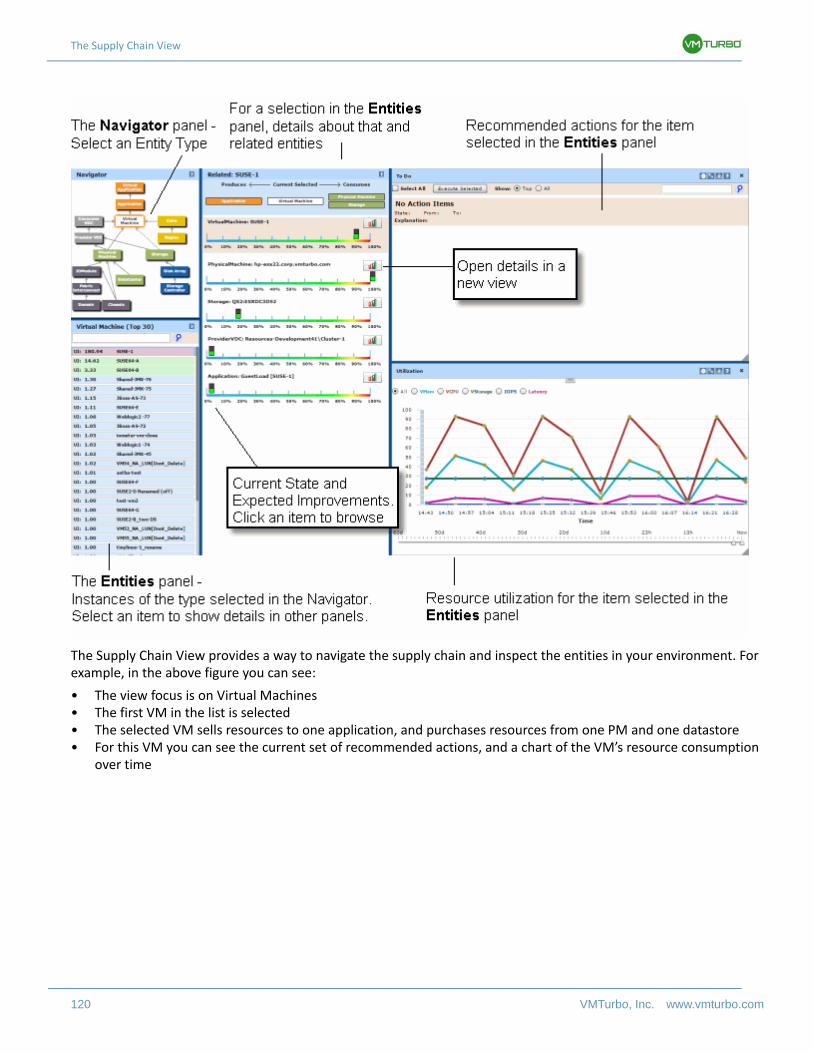
The Supply Chain View
120 VMTurbo, Inc. www.vmturbo.com
The Supply Chain View provides a way to navigate the supply chain and inspect the entities in your environment. For example, in the above figure you can see:
• The view focus is on Virtual Machines• The first VM in the list is selected• The selected VM sells resources to one application, and purchases resources from one PM and one datastore• For this VM you can see the current set of recommended actions, and a chart of the VM’s resource consumption
over time
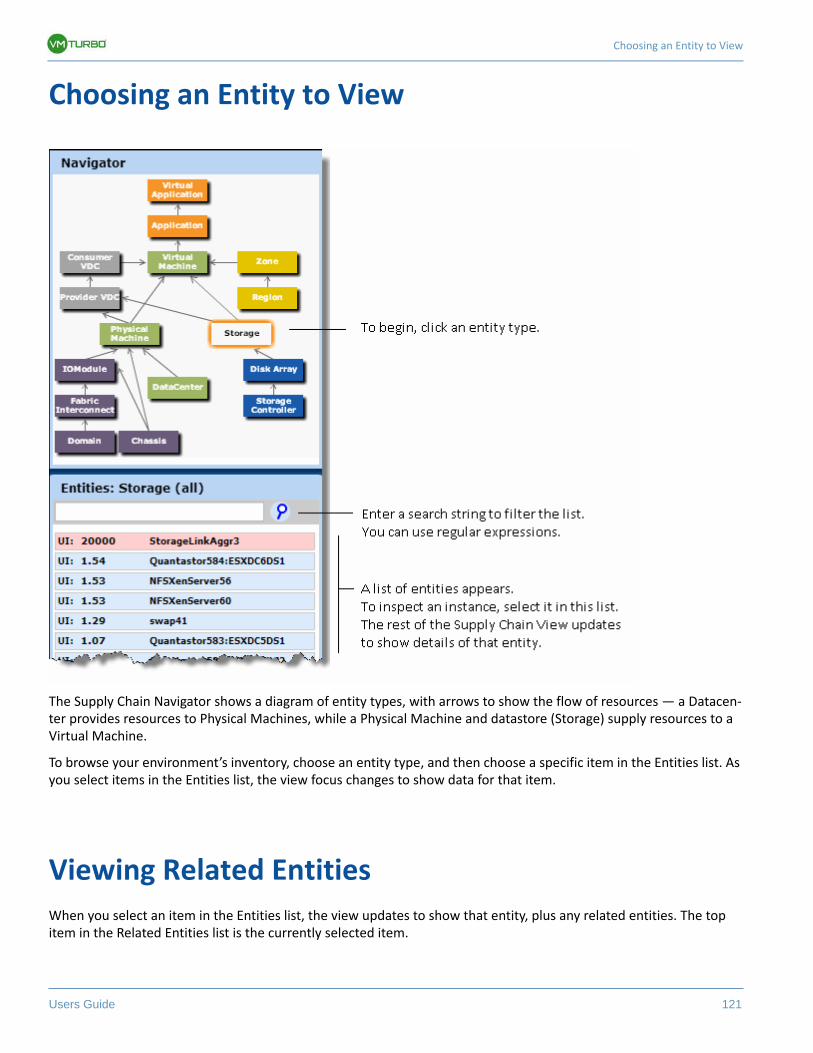
Choosing an Entity to View
Users Guide 121
Choosing an Entity to View
The Supply Chain Navigator shows a diagram of entity types, with arrows to show the flow of resources — a Datacen-ter provides resources to Physical Machines, while a Physical Machine and datastore (Storage) supply resources to a Virtual Machine.
To browse your environment’s inventory, choose an entity type, and then choose a specific item in the Entities list. As you select items in the Entities list, the view focus changes to show data for that item.
Viewing Related Entities
When you select an item in the Entities list, the view updates to show that entity, plus any related entities. The top item in the Related Entities list is the currently selected item.
The Supply Chain View
122 VMTurbo, Inc. www.vmturbo.com
Each entry in the list shows the item’s current utilization, plus the expected improvement for that item. To display full
details for a given item, click its Details icon ( ).
Browsing Supply Chain Entities
You can use the Supply Chain View to browse your environment’s inventory. As you select an item in the Related Enti-ties list, the view updates to focus on that selected entity.
Setting Supply Chain Scope
Users Guide 123
Setting Supply Chain Scope
To set the scope of the view, open the Scope fly-out panel and choose the group or cluster you want to focus on.
The Supply Chain View
124 VMTurbo, Inc. www.vmturbo.com
Supply Chain Entities
The Operations Manager user interface displays the following entity types in the supply chain:
• Supply Chain - Virtual Application on page 127• Supply Chain - Application on page 128• Supply Chain - Virtual Machine on page 131• Supply Chain - Physical Machine on page 133• Supply Chain - Storage on page 135• Supply Chain - Disk Array on page 137• Supply Chain - Storage Controller on page 139• Supply Chain - IO Module on page 141• Supply Chain - Fabric Interconnect on page 142• Supply Chain - Chassis on page 143• Supply Chain - Domain on page 144• Supply Chain - Datacenter on page 145• Supply Chain - Consumer Virtual Datacenter on page 148• Supply Chain - Provider Virtual Datacenter on page 146
Supply Chain Entities
Users Guide 125
• Supply Chain - VPod on page 150• Supply Chain - DPod on page 152• Supply Chain - Zone on page 153• Supply Chain - Region on page 155
Your Operations Manager license determines how much of the supply chain your current installation will manage. The following table illustrates the supply chain that is supported by each license, and lists the targets that Operations Manager supports to manage that supply chain.
License Supply Chain Associated Targets
Virtual Health MonitorOperations Manager (base product)
vCenter ServerRHEV-MHyper-VXenServer
Application Control Module NetScalerIBM WebSphereOracle WebLogicJBossApache TomcatMicrosoft SQL ServerOracle Database Servers
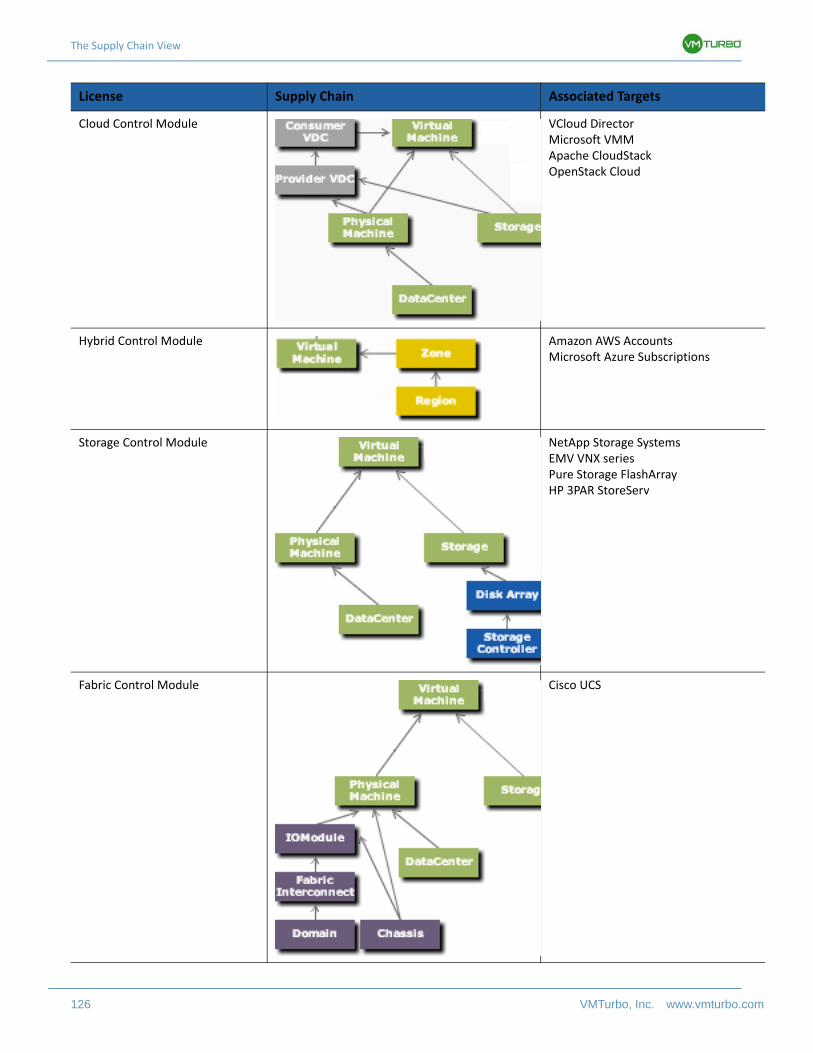
The Supply Chain View
126 VMTurbo, Inc. www.vmturbo.com
Cloud Control Module VCloud DirectorMicrosoft VMMApache CloudStackOpenStack Cloud
Hybrid Control Module Amazon AWS AccountsMicrosoft Azure Subscriptions
Storage Control Module NetApp Storage SystemsEMV VNX seriesPure Storage FlashArrayHP 3PAR StoreServ
Fabric Control Module Cisco UCS
License Supply Chain Associated Targets
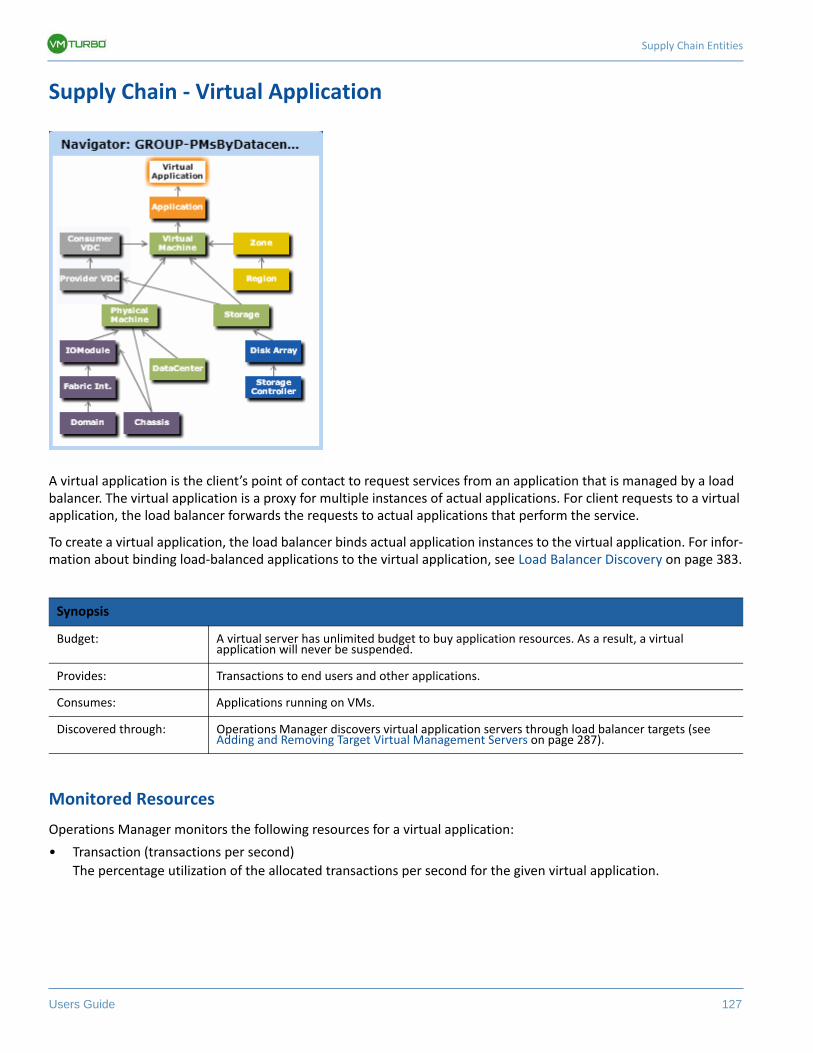
Supply Chain Entities
Users Guide 127
Supply Chain - Virtual Application
A virtual application is the client’s point of contact to request services from an application that is managed by a load balancer. The virtual application is a proxy for multiple instances of actual applications. For client requests to a virtual application, the load balancer forwards the requests to actual applications that perform the service.
To create a virtual application, the load balancer binds actual application instances to the virtual application. For infor-mation about binding load-balanced applications to the virtual application, see Load Balancer Discovery on page 383.
Monitored Resources
Operations Manager monitors the following resources for a virtual application:
• Transaction (transactions per second)
The percentage utilization of the allocated transactions per second for the given virtual application.
Synopsis
Budget: A virtual server has unlimited budget to buy application resources. As a result, a virtual application will never be suspended.
Provides: Transactions to end users and other applications.
Consumes: Applications running on VMs.
Discovered through: Operations Manager discovers virtual application servers through load balancer targets (see Adding and Removing Target Virtual Management Servers on page 287).
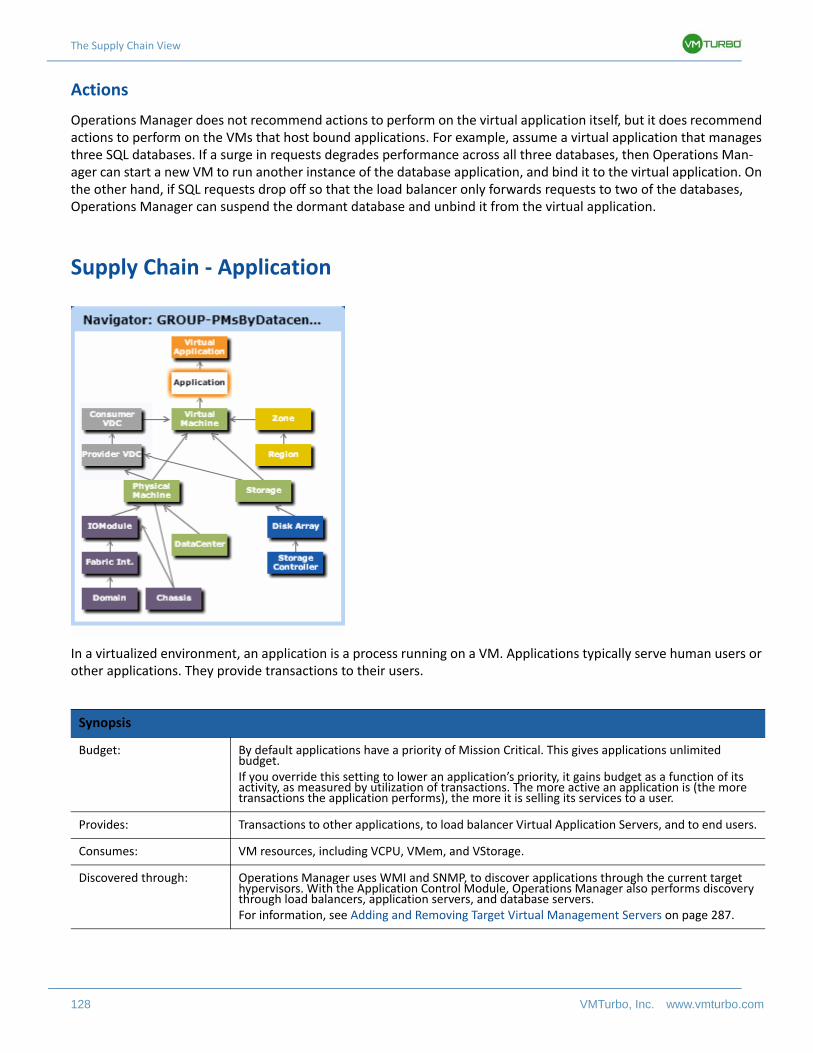
The Supply Chain View
128 VMTurbo, Inc. www.vmturbo.com
Actions
Operations Manager does not recommend actions to perform on the virtual application itself, but it does recommend actions to perform on the VMs that host bound applications. For example, assume a virtual application that manages three SQL databases. If a surge in requests degrades performance across all three databases, then Operations Man-ager can start a new VM to run another instance of the database application, and bind it to the virtual application. On the other hand, if SQL requests drop off so that the load balancer only forwards requests to two of the databases, Operations Manager can suspend the dormant database and unbind it from the virtual application.
Supply Chain - Application
In a virtualized environment, an application is a process running on a VM. Applications typically serve human users or other applications. They provide transactions to their users.
Synopsis
Budget: By default applications have a priority of Mission Critical. This gives applications unlimited budget.If you override this setting to lower an application’s priority, it gains budget as a function of its activity, as measured by utilization of transactions. The more active an application is (the more transactions the application performs), the more it is selling its services to a user.
Provides: Transactions to other applications, to load balancer Virtual Application Servers, and to end users.
Consumes: VM resources, including VCPU, VMem, and VStorage.
Discovered through: Operations Manager uses WMI and SNMP, to discover applications through the current target hypervisors. With the Application Control Module, Operations Manager also performs discovery through load balancers, application servers, and database servers.For information, see Adding and Removing Target Virtual Management Servers on page 287.
Supply Chain Entities
Users Guide 129
Application Discovery
By default, Operations Manager discovers the following applications:
In addition, your installation of Operations Manager might be configured to discover other applications running in your environment. For more information, see Application Discovery on page 379.
If you have installed a license for the Application Control Module, then Operations Manager discovers the following types of entities as well:
• Load Balancers
This version of Operations Manager supports Citrix NetScaler load balancers. Operations Manager discovers NetScaler virtual applications according to application signatures that you provide.
• Application Servers
Operations Manager measures resource consumption on the application server, and can scale it vertically or horizontally in response to demand. This version supports:- IBM WebSphere Application Server- Oracle WebLogic- JBoss- Apache Tomcat
• Database Servers
Similar to management of Application Servers, Operations Manager measures resource consumption on the database server, and can scale it vertically or horizontally in response to demand. This version supports:- Microsoft SQL Server 2008 R2, 2012, and 2014- Oracle 11g R2 and 12c- MySQL 5.5.26 and higher, and all 5.6 releases
• Microsoft Applications- Microsoft Exchange
Application Name Description
LSASS Microsoft Active Directory services
IIS Microsoft Internet Information Services
XenDesktop Citrix XenDesktop
VMView VMware View
MSSQL Microsoft SQL Server
SharePoint Microsoft Sharepoint Server
Guest Load The resources that Operations Manager has not assigned to any specific application. By default, every VM has a Guest Load application. (For more information, see Guest Load, below.)
The Supply Chain View
130 VMTurbo, Inc. www.vmturbo.com
Guest Load
The Apps_GuestLoad item is a special entry in the Applications hierarchy. This item tracks the resources that Opera-tions Manager has not assigned to any specific application. This can occur for the following reasons:
• You do not have the licenses required to support Application monitoring
In this case, Operations Manager lists all the consumed VM resources in the Apps_GuestLoad entry—this is the only entry under Applications.
• Operations Manager cannot discover some applications, or some applications are not registered for discovery (see Application Discovery on page 379).
In this case, Operations Manager displays entries for the applications it has discovered, and lists the VM resources that are not accounted for under Apps_GuestLoad.
• VM resources are devoted to infrastructure, and not part of any application
Operations Manager lists these resources under Apps_GuestLoad, and provides entries for the applications it has discovered.
Monitored Resources
Operations Manager monitors the following resources for an application:
• VMem
The percentage utilization of the VMem (in Kbytes) that was allocated to the hosting VM.• VCPU
The percentage utilization of the VCPU (in MHz) allocated for the hosting VM.• Transaction (transactions per second)
For virtual applications discovered through a Load Balancer target or for application servers, the percentage utilization of the allocated transactions per second.
• Heap
For application servers, the percentage utilization of the application server’s heap.• Transactions
For application servers and database servers, the percentage utilization of the
server’s transaction capacity, in transactions per second.• Response Time
For application servers, the percentage utilization of the server’s allocated response time.• Threads
For application servers, the percentage utilization of the server’s thread capacity.• DBMem
For database servers, the percentage utilization of the database’s memory capacity.• Connection
For database servers, the percentage utilization of the connection capacity.• TransactionLog
For database servers, the percentage utilization of the server’s capacity for storage devoted to transaction logs.
Actions
Operations Manager doesn’t perform actions on applications. Instead, it performs actions on the host VMs. If utiliza-tion is high enough on an application, Operations Manager can create a new copy of the host VM. When an applica-tion is idle, it loses budget. Ultimately, if the budget falls enough, Operations Manager will recommend to suspend or terminate the host VM.
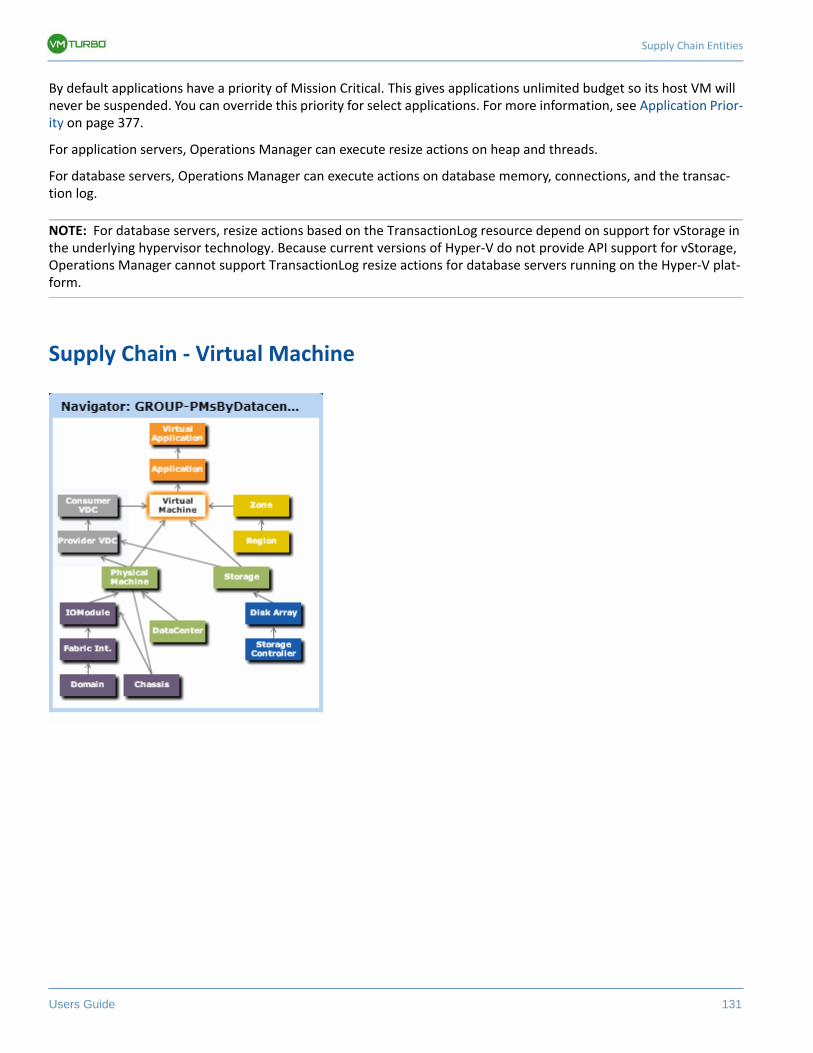
Supply Chain Entities
Users Guide 131
By default applications have a priority of Mission Critical. This gives applications unlimited budget so its host VM will never be suspended. You can override this priority for select applications. For more information, see Application Prior-ity on page 377.
For application servers, Operations Manager can execute resize actions on heap and threads.
For database servers, Operations Manager can execute actions on database memory, connections, and the transac-tion log.
NOTE: For database servers, resize actions based on the TransactionLog resource depend on support for vStorage in the underlying hypervisor technology. Because current versions of Hyper-V do not provide API support for vStorage, Operations Manager cannot support TransactionLog resize actions for database servers running on the Hyper-V plat-form.
Supply Chain - Virtual Machine
The Supply Chain View
132 VMTurbo, Inc. www.vmturbo.com
A virtual machine (VM) is a software emulation of a physical machine, including OS, virtual memory and CPUs, and network ports. VMs host applications.
Note that the Inventory View groups VMs by the physical machines that host them. In the user interface, this is a logi-cal grouping that makes it easier to visualize the distribution of VMs across your environment. Also, the VM icons identify managing hypervisors by vendor and VM state (see Resource Icons on page 50).
Monitored Resources
Operations Manager monitors the following resources for a VM:
• VMem
The percentage utilization of the virtual memory (measured in Kbytes) allocated for the VM.• VCPU
The percentage utilization of the virtual CPU capacity (measured in MHz) allocated for the VM.• VStorage
The percentage utilization of the virtual storage capacity (measured in Kbytes) allocated for the VM.• IOPS (Storage Access Operations per Second)
The percentage utilization of IOPS allocated for the VStorage on the VM.• Latency
The percentage utilization of latency (measured in ms) allocated for the VStorage on the VM.
Actions
Operations Manager recommends the following actions for a VM:
• Terminate (Remove) VM
For a VM that has been suspended for a long period.• Suspend VM
For low utilization of VM’s resources.
Synopsis
Budget: A VM gains its budget by selling resources to the applications it hosts. If utilization is high enough, Operations Manager can allocate more resources to the VM, or move the VM to a host that has more resources.If utilization falls off, the VM loses budget. Ultimately, if the budget isn’t enough to pay for the host services it consumes, Operations Manager will recommend suspending or power off the VM.
Provides: Resources for hosted applications to use:• VMEM (Kbytes)• VCPU (MHz)• VStorage• IOPS (storage access operations per second)• Latency (capacity for disk latency in ms)
Consumes: • Physical host resources, including CPU and Mem• Storage
Discovered through: Operations Manager discovers VMs through hypervisor targets.For information, see Adding and Removing Target Virtual Management Servers on page 287.
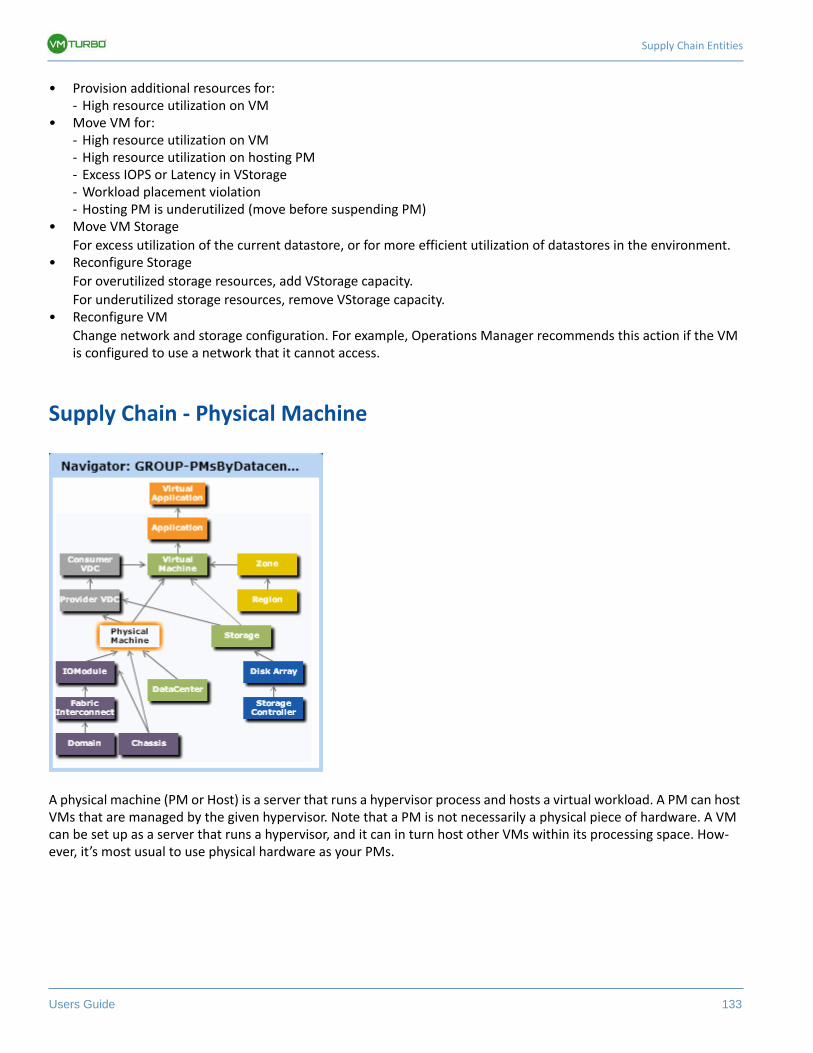
Supply Chain Entities
Users Guide 133
• Provision additional resources for:- High resource utilization on VM
• Move VM for:- High resource utilization on VM- High resource utilization on hosting PM- Excess IOPS or Latency in VStorage- Workload placement violation- Hosting PM is underutilized (move before suspending PM)
• Move VM Storage
For excess utilization of the current datastore, or for more efficient utilization of datastores in the environment.• Reconfigure Storage
For overutilized storage resources, add VStorage capacity.
For underutilized storage resources, remove VStorage capacity.• Reconfigure VM
Change network and storage configuration. For example, Operations Manager recommends this action if the VM is configured to use a network that it cannot access.
Supply Chain - Physical Machine
A physical machine (PM or Host) is a server that runs a hypervisor process and hosts a virtual workload. A PM can host VMs that are managed by the given hypervisor. Note that a PM is not necessarily a physical piece of hardware. A VM can be set up as a server that runs a hypervisor, and it can in turn host other VMs within its processing space. How-ever, it’s most usual to use physical hardware as your PMs.
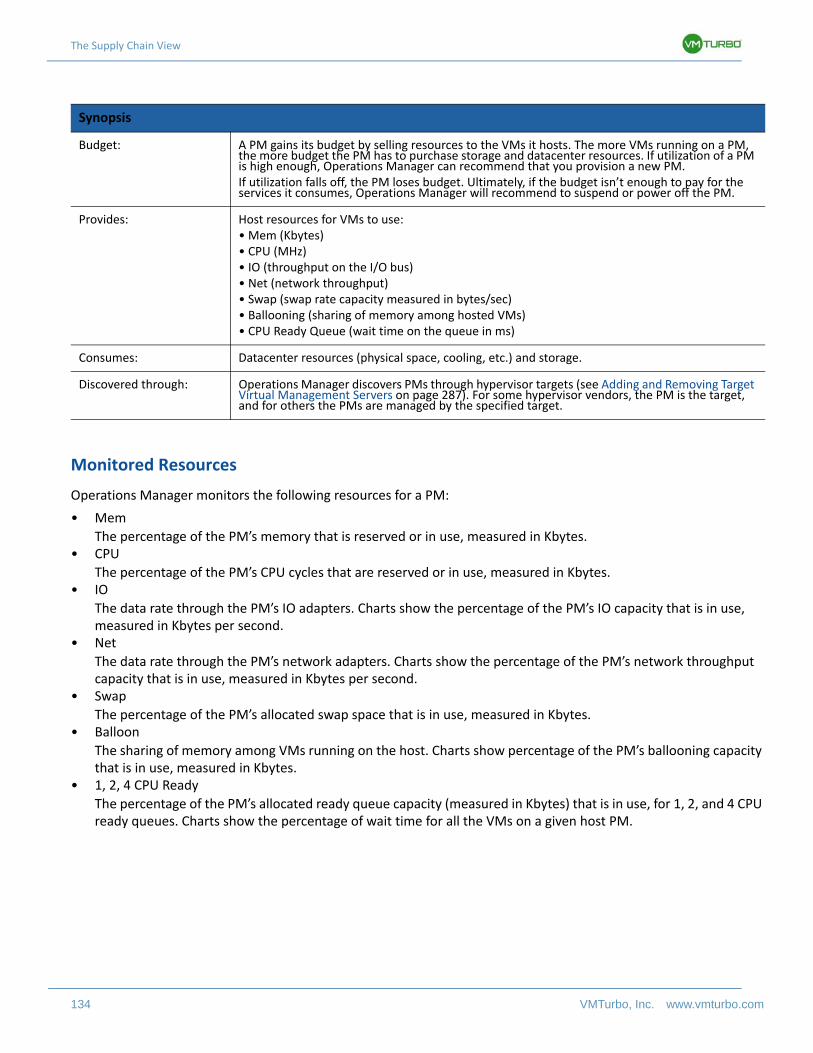
The Supply Chain View
134 VMTurbo, Inc. www.vmturbo.com
Monitored Resources
Operations Manager monitors the following resources for a PM:
• Mem
The percentage of the PM’s memory that is reserved or in use, measured in Kbytes.• CPU
The percentage of the PM’s CPU cycles that are reserved or in use, measured in Kbytes.• IO
The data rate through the PM’s IO adapters. Charts show the percentage of the PM’s IO capacity that is in use, measured in Kbytes per second.
• Net
The data rate through the PM’s network adapters. Charts show the percentage of the PM’s network throughput capacity that is in use, measured in Kbytes per second.
• Swap
The percentage of the PM’s allocated swap space that is in use, measured in Kbytes.• Balloon
The sharing of memory among VMs running on the host. Charts show percentage of the PM’s ballooning capacity that is in use, measured in Kbytes.
• 1, 2, 4 CPU Ready
The percentage of the PM’s allocated ready queue capacity (measured in Kbytes) that is in use, for 1, 2, and 4 CPU ready queues. Charts show the percentage of wait time for all the VMs on a given host PM.
Synopsis
Budget: A PM gains its budget by selling resources to the VMs it hosts. The more VMs running on a PM, the more budget the PM has to purchase storage and datacenter resources. If utilization of a PM is high enough, Operations Manager can recommend that you provision a new PM.If utilization falls off, the PM loses budget. Ultimately, if the budget isn’t enough to pay for the services it consumes, Operations Manager will recommend to suspend or power off the PM.
Provides: Host resources for VMs to use:• Mem (Kbytes)• CPU (MHz)• IO (throughput on the I/O bus)• Net (network throughput)• Swap (swap rate capacity measured in bytes/sec)• Ballooning (sharing of memory among hosted VMs)• CPU Ready Queue (wait time on the queue in ms)
Consumes: Datacenter resources (physical space, cooling, etc.) and storage.
Discovered through: Operations Manager discovers PMs through hypervisor targets (see Adding and Removing Target Virtual Management Servers on page 287). For some hypervisor vendors, the PM is the target, and for others the PMs are managed by the specified target.
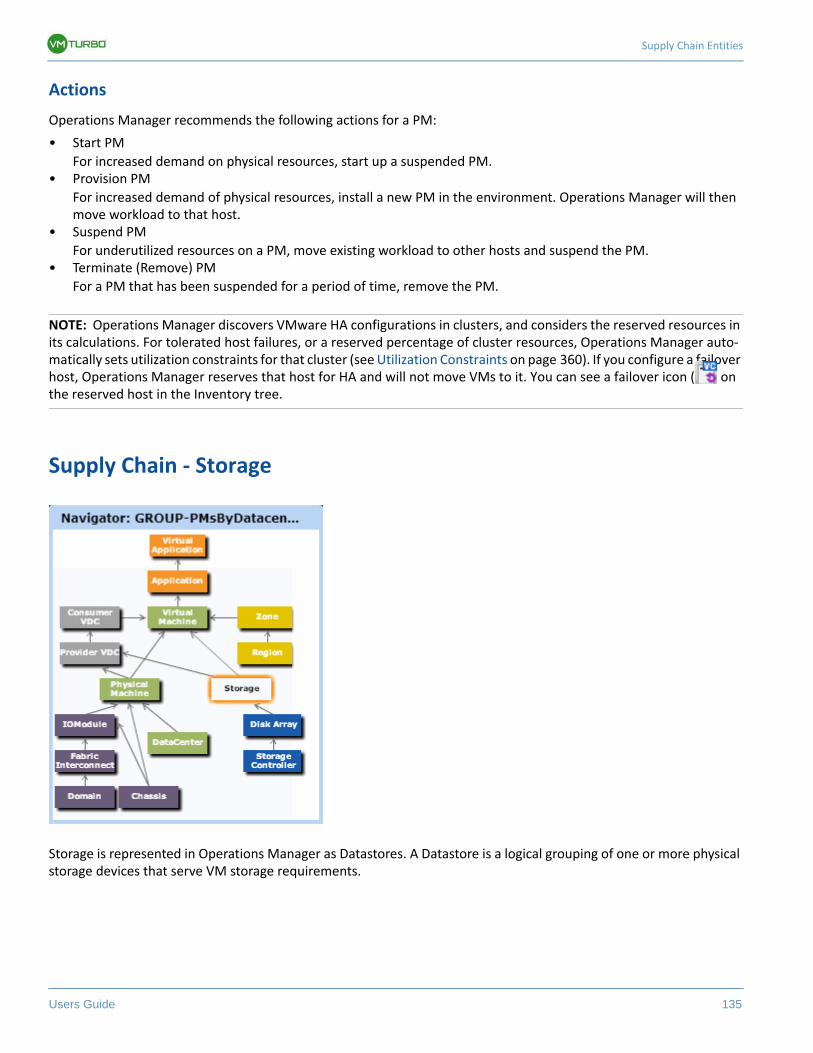
Supply Chain Entities
Users Guide 135
Actions
Operations Manager recommends the following actions for a PM:
• Start PM
For increased demand on physical resources, start up a suspended PM.• Provision PM
For increased demand of physical resources, install a new PM in the environment. Operations Manager will then move workload to that host.
• Suspend PM
For underutilized resources on a PM, move existing workload to other hosts and suspend the PM.• Terminate (Remove) PM
For a PM that has been suspended for a period of time, remove the PM.
NOTE: Operations Manager discovers VMware HA configurations in clusters, and considers the reserved resources in its calculations. For tolerated host failures, or a reserved percentage of cluster resources, Operations Manager auto-matically sets utilization constraints for that cluster (see Utilization Constraints on page 360). If you configure a failover host, Operations Manager reserves that host for HA and will not move VMs to it. You can see a failover icon ( on the reserved host in the Inventory tree.
Supply Chain - Storage
Storage is represented in Operations Manager as Datastores. A Datastore is a logical grouping of one or more physical storage devices that serve VM storage requirements.
The Supply Chain View
136 VMTurbo, Inc. www.vmturbo.com
Monitored Resources
Operations Manager monitors the following resources for a datastore:
• Storage
The percentage of the datastore’s capacity (measured in Kbytes) that is in use.• IOPS
Storage access operations per second. Charts in the user interface show the percentage of allocated IOPS capacity that is used on a datastore.
• Latency
The percentage of allocated latency (measured in ms) that is in use on the datastore. This measures the latency experienced by all VMs and hosts that access the datastore.
Actions
Operations Manager recommends the following actions for a datastore:
• Start Storage
For high utilization of storage resources, start a suspended datastore.• Provision Storage
For high utilization of storage resources, provision a new datastore.• Suspend Storage
For low utilization of storage resources, move served VMs to other datastores and suspend this one.• Terminate Storage (Remove)
For a datastore that has been suspended for a period of time, remove the datastore.• Move (only with the Storage Control Module)
For high utilization of physical storage, move datastore to a different disk array (aggregate).• Resize (only with the Storage Control Module)
Increase or decrease the datastore capacity.
Synopsis
Budget: A Datastore gains its budget by selling resources to the VMs it serves. If utilization of a Datastore is high enough, Operations Manager can recommend that you provision a new one.
Provides: Host resources for VMs to use:• Storage amount• IOPS (storage access operations per second)• Latency (capacity for disk latency in ms)
Consumes: Disk arrays (or aggregates) — with the Storage Control Module, only
Discovered through: Operations Manager discovers Datastores through hypervisor targets (see Adding and Removing Target Virtual Management Servers on page 287).
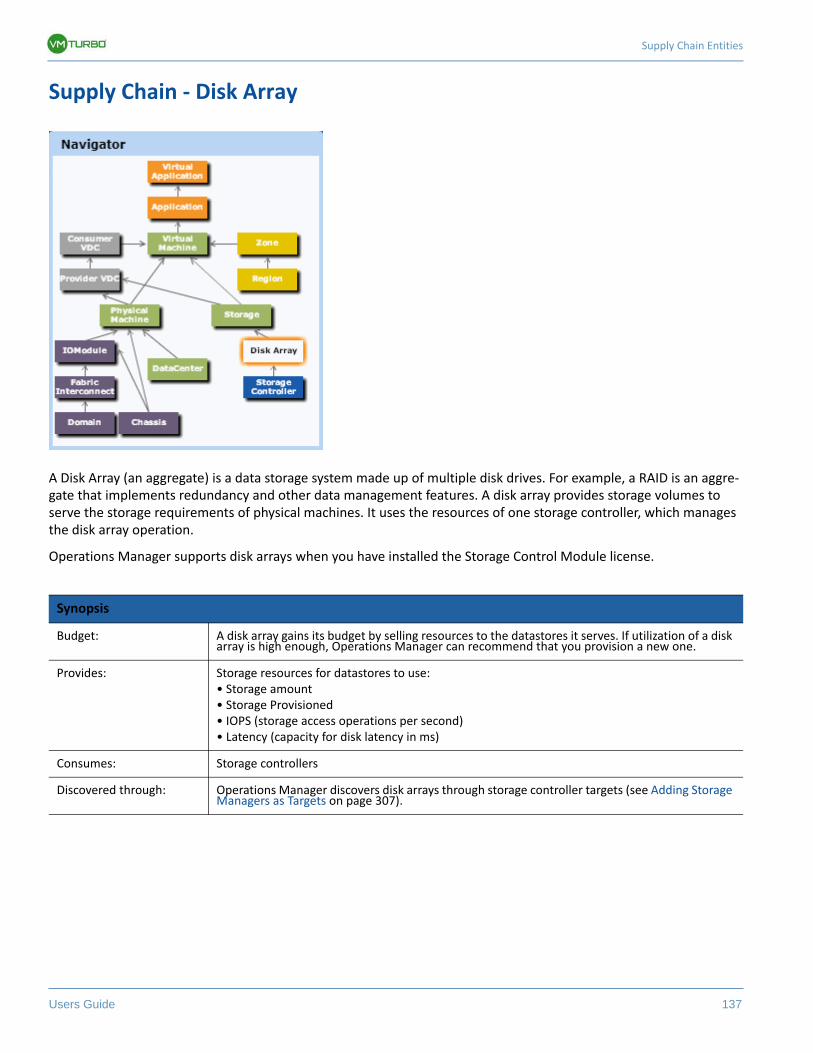
Supply Chain Entities
Users Guide 137
Supply Chain - Disk Array
A Disk Array (an aggregate) is a data storage system made up of multiple disk drives. For example, a RAID is an aggre-gate that implements redundancy and other data management features. A disk array provides storage volumes to serve the storage requirements of physical machines. It uses the resources of one storage controller, which manages the disk array operation.
Operations Manager supports disk arrays when you have installed the Storage Control Module license.
Synopsis
Budget: A disk array gains its budget by selling resources to the datastores it serves. If utilization of a disk array is high enough, Operations Manager can recommend that you provision a new one.
Provides: Storage resources for datastores to use:• Storage amount• Storage Provisioned• IOPS (storage access operations per second)• Latency (capacity for disk latency in ms)
Consumes: Storage controllers
Discovered through: Operations Manager discovers disk arrays through storage controller targets (see Adding Storage Managers as Targets on page 307).
The Supply Chain View
138 VMTurbo, Inc. www.vmturbo.com
Monitored Resources
Operations Manager monitors the following resources for a disk array:
• Storage
The percentage utilization of the storage (measured in Kbytes) allocated for the given disk array. Allocated storage is the sum of the aggregated physical storage that the array exposes to the environment.
• Storage Provisioned
The percentage utilization of the storage that was provisioned for this disk array. This encompasses over-provisioning of storage, as well as thin-provisioning on the VMs, deduplication, compression, and other storage optimizations. For example, assume storage over-provisioning of 200% as the only storage optimization. If Storage Utilization was at 100%, then Storage Provisioned would be 50% (half of the over-provisioned storage in use). A more realistic situation would have the current Storage Utilization at 50%, and Storage Provisioned would show a value of 25%.
• IOPS - Storage Access Operations per Second
The percentage utilization of allocated IOPS. The disk array aggregates this value for all its volumes. In other words, all volumes on a given disk array show the same value for this resource.
• Latency
The percentage utilization of allocated latency. The disk array aggregates this value for all its volumes. In other words, all volumes on a given disk array show the same value for this resource.
Actions
Operations Manager recommends the following actions for a disk array:
• Provision Disk Array
For high utilization of the disk array’s storage, provision a new disk array (recommendation, only).• Start Disk Array
For high utilization of disk array, start a suspended disk array (recommendation, only).• Suspend Disk Array
For low utilization of the disk array’s storage, move VMs to other datastores and suspend volumes on the disk array (recommendation, only).
• Move Disk Array (for NetApp Cluster-Mode, only)
For high utilization of Storage Controller resources, Operations Manager can move an aggregate to another storage controller. The storage controllers must be running.
For high IOPS or Latency, a move is always off of the current disk array. All the volumes on a given disk array show the same IOPS and Latency, so moving to a volume on the same array would not fix these issues.
• Move VM
For high utilization of Storage on a volume, Operations Manager can move a VM to another volume. The new volume can be on the current disk array, on some other disk array, or on any other datastore.
For high IOPS or Latency, a move is always off of the current disk array. All the volumes on a given disk array show the same IOPS and Latency, so moving to a volume on the same array would not fix these issues.
• Move Datastore
To balance utilization of disk array resources, Operations Manager can move a datastore to another array.
Action Automation for NetApp Storage Systems
For NetApp storage systems, the actions Operations Manager can automatically perform depend on the NetApp ver-sion you are running, and whether the system is running in cluster mode:
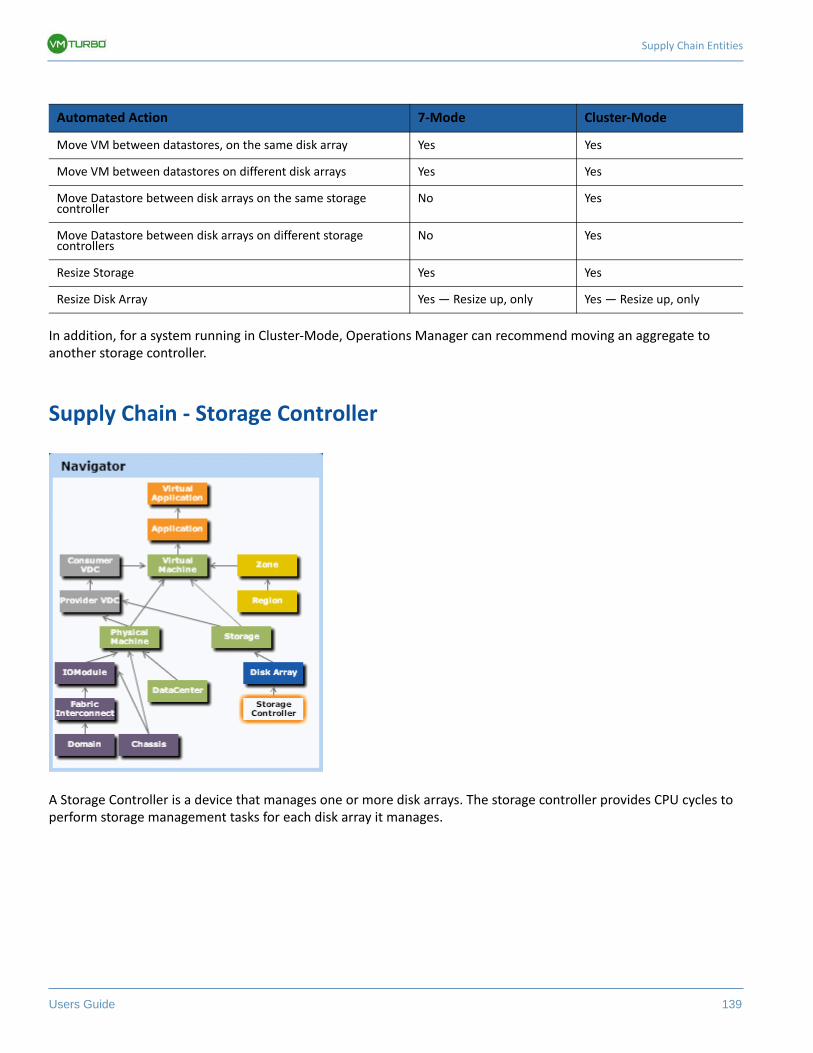
Supply Chain Entities
Users Guide 139
In addition, for a system running in Cluster-Mode, Operations Manager can recommend moving an aggregate to another storage controller.
Supply Chain - Storage Controller
A Storage Controller is a device that manages one or more disk arrays. The storage controller provides CPU cycles to perform storage management tasks for each disk array it manages.
Automated Action 7-Mode Cluster-Mode
Move VM between datastores, on the same disk array Yes Yes
Move VM between datastores on different disk arrays Yes Yes
Move Datastore between disk arrays on the same storage controller
No Yes
Move Datastore between disk arrays on different storage controllers
No Yes
Resize Storage Yes Yes
Resize Disk Array Yes — Resize up, only Yes — Resize up, only
The Supply Chain View
140 VMTurbo, Inc. www.vmturbo.com
Operations Manager supports storage controllers when you have installed the Storage Control Module license.
Monitored Resources
Operations Manager monitors the following resources for a storage controller:
• CPU
The percentage utilization of CPU resources allocated to the storage controller.• Storage
The percentage of the storage capacity that is in use. The storage allocated to a storage controller is the total of all the physical space available to aggregates managed by that storage controller.
• IOPS
Storage access operations per second. Charts show the percentage of allocated IOPS capacity that is used by the aggregates managed by the storage controller.
• Latency
The percentage of allocated latency (measured in ms) that is in use for this storage controller. This measures the latency experienced by all VMs and hosts that access the managed storage.
Actions
Operations Manager recommends the following actions for a storage controller:
• Provision Storage Controller (recommendation, only)
For high utilization of the storage controller’s CPU, provision a new storage controller, and then move disk arrays to it.
Synopsis
Budget: A storage controller gains its budget by selling resources to the disk arrays it manages. If utilization of the storage controller’s CPU resources is high enough, Operations Manager can recommend that you provision a new one and move disk arrays (aggregates) to it.
Provides: CPU resources to manage disk arrays.
Consumes: NA
Discovered through: Operations Manager directly accesses storage controller targets (see Adding Storage Managers as Targets on page 307).
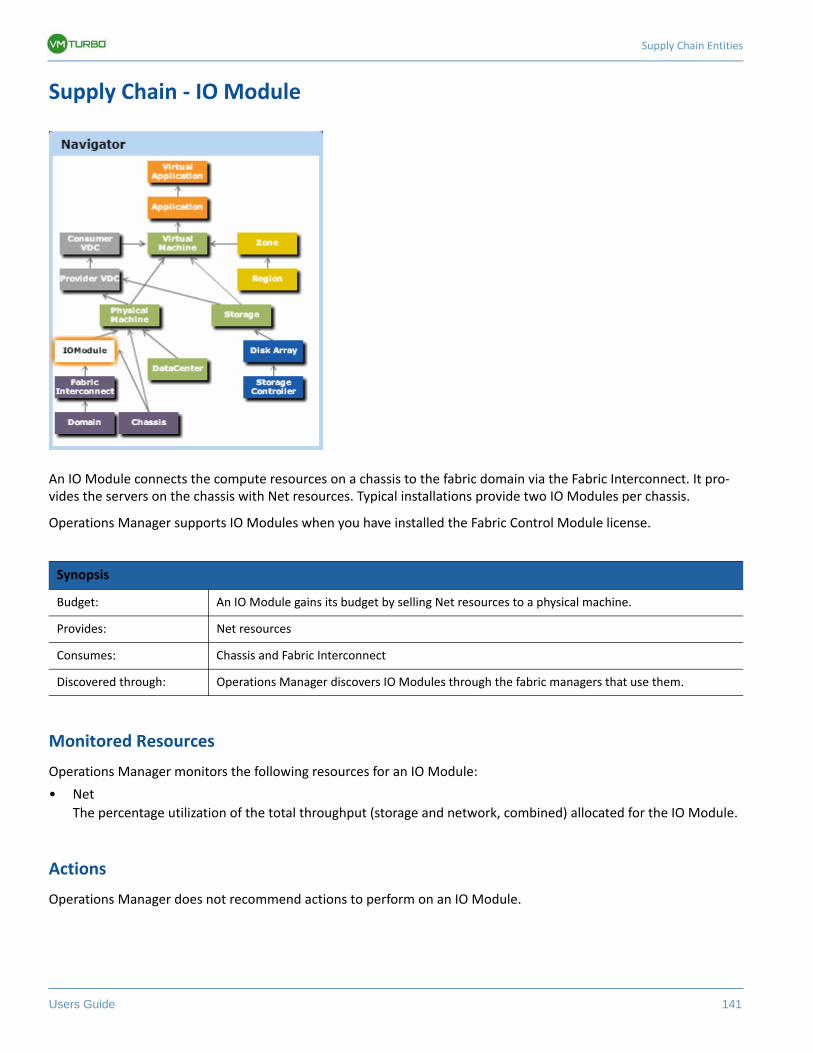
Supply Chain Entities
Users Guide 141
Supply Chain - IO Module
An IO Module connects the compute resources on a chassis to the fabric domain via the Fabric Interconnect. It pro-vides the servers on the chassis with Net resources. Typical installations provide two IO Modules per chassis.
Operations Manager supports IO Modules when you have installed the Fabric Control Module license.
Monitored Resources
Operations Manager monitors the following resources for an IO Module:
• Net
The percentage utilization of the total throughput (storage and network, combined) allocated for the IO Module.
Actions
Operations Manager does not recommend actions to perform on an IO Module.
Synopsis
Budget: An IO Module gains its budget by selling Net resources to a physical machine.
Provides: Net resources
Consumes: Chassis and Fabric Interconnect
Discovered through: Operations Manager discovers IO Modules through the fabric managers that use them.
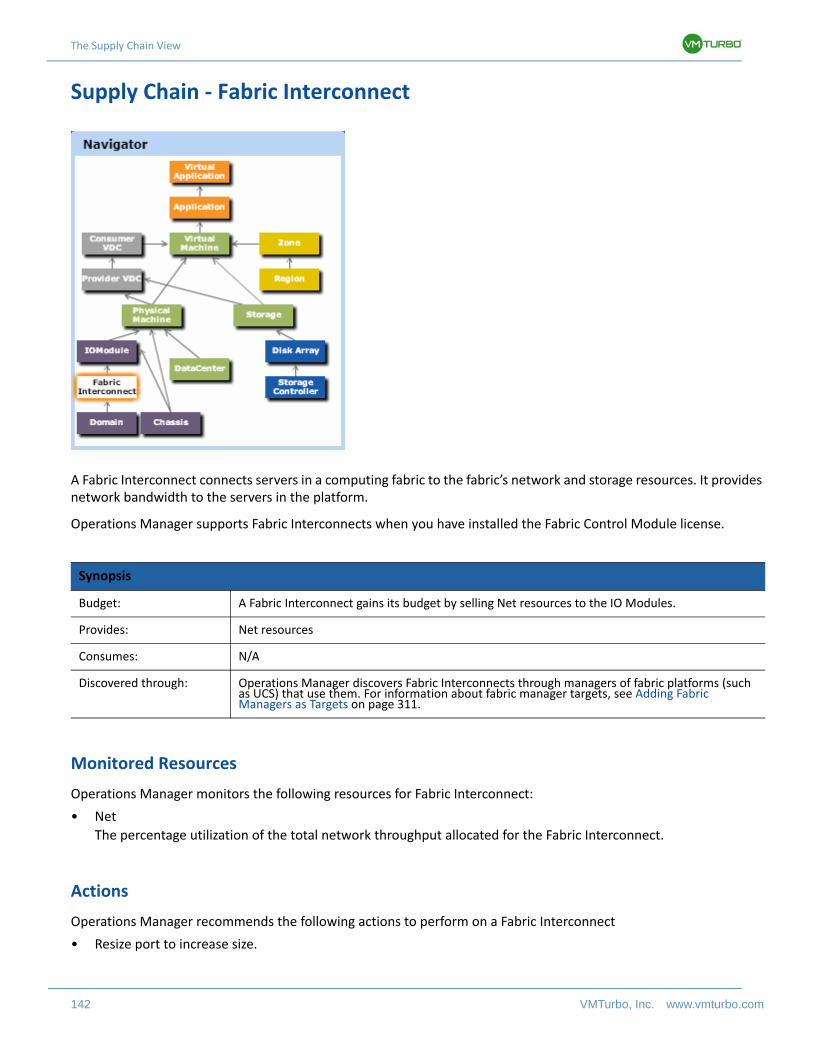
The Supply Chain View
142 VMTurbo, Inc. www.vmturbo.com
Supply Chain - Fabric Interconnect
A Fabric Interconnect connects servers in a computing fabric to the fabric’s network and storage resources. It provides network bandwidth to the servers in the platform.
Operations Manager supports Fabric Interconnects when you have installed the Fabric Control Module license.
Monitored Resources
Operations Manager monitors the following resources for Fabric Interconnect:
• Net
The percentage utilization of the total network throughput allocated for the Fabric Interconnect.
Actions
Operations Manager recommends the following actions to perform on a Fabric Interconnect
• Resize port to increase size.
Synopsis
Budget: A Fabric Interconnect gains its budget by selling Net resources to the IO Modules.
Provides: Net resources
Consumes: N/A
Discovered through: Operations Manager discovers Fabric Interconnects through managers of fabric platforms (such as UCS) that use them. For information about fabric manager targets, see Adding Fabric Managers as Targets on page 311.
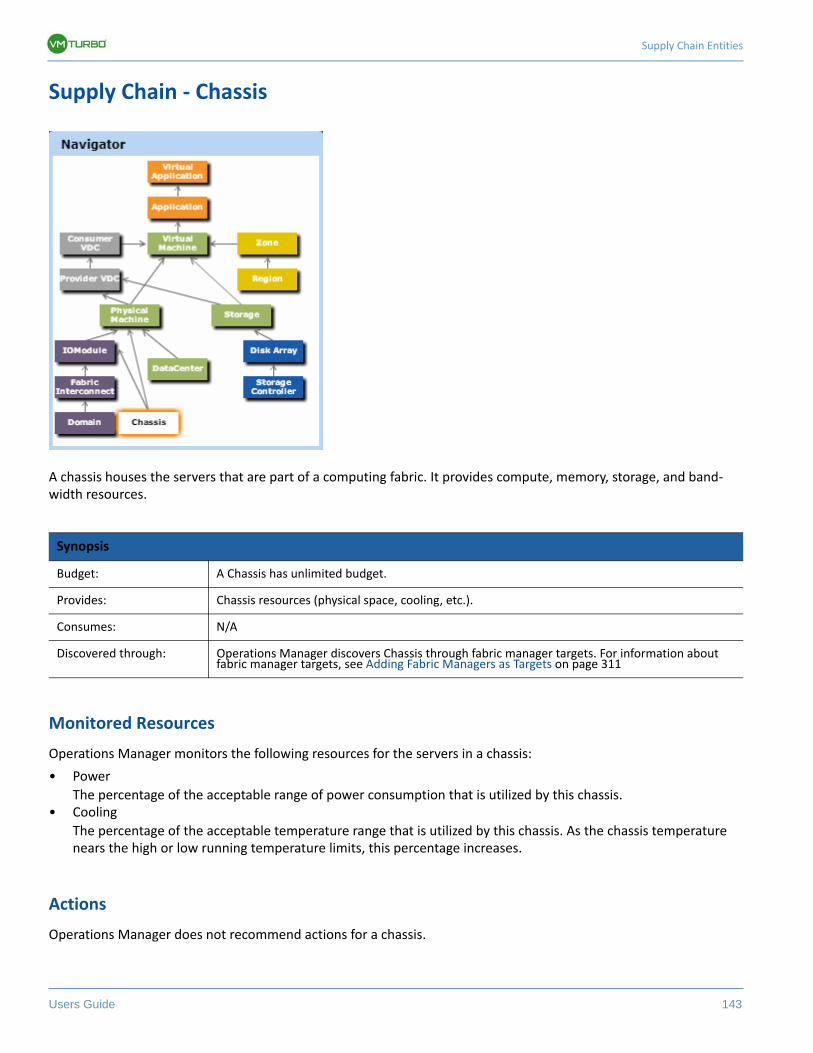
Supply Chain Entities
Users Guide 143
Supply Chain - Chassis
A chassis houses the servers that are part of a computing fabric. It provides compute, memory, storage, and band-width resources.
Monitored Resources
Operations Manager monitors the following resources for the servers in a chassis:
• Power
The percentage of the acceptable range of power consumption that is utilized by this chassis.• Cooling
The percentage of the acceptable temperature range that is utilized by this chassis. As the chassis temperature nears the high or low running temperature limits, this percentage increases.
Actions
Operations Manager does not recommend actions for a chassis.
Synopsis
Budget: A Chassis has unlimited budget.
Provides: Chassis resources (physical space, cooling, etc.).
Consumes: N/A
Discovered through: Operations Manager discovers Chassis through fabric manager targets. For information about fabric manager targets, see Adding Fabric Managers as Targets on page 311
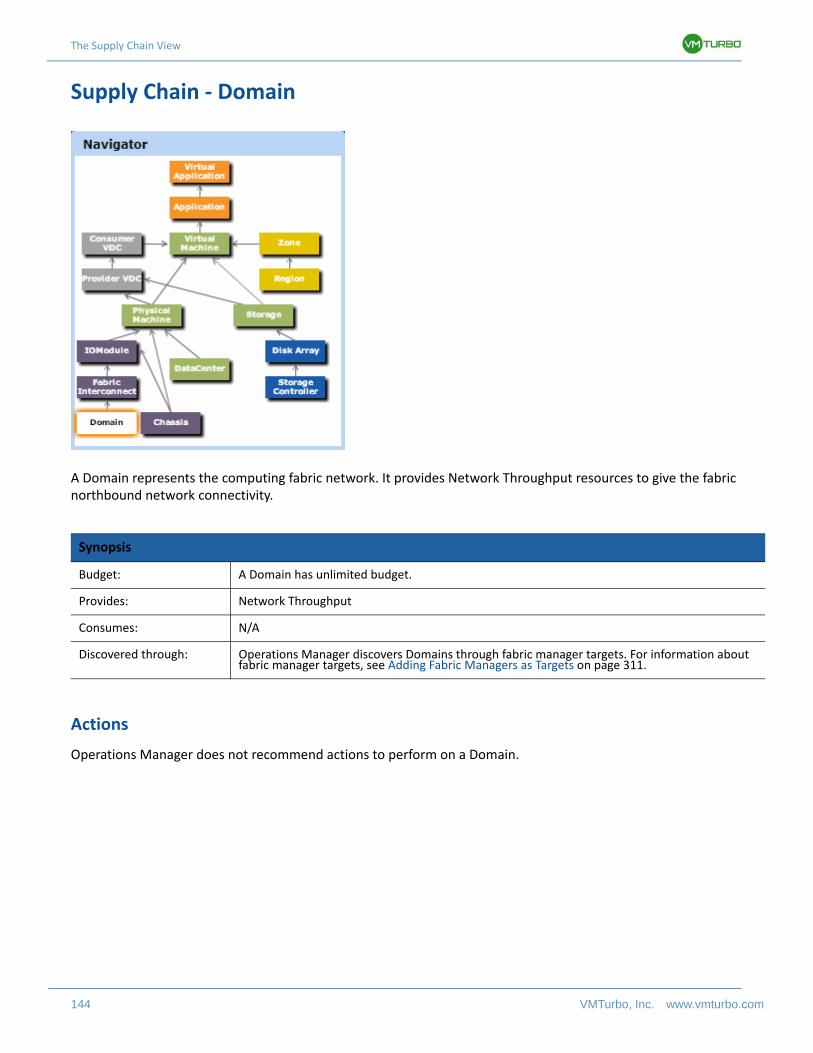
The Supply Chain View
144 VMTurbo, Inc. www.vmturbo.com
Supply Chain - Domain
A Domain represents the computing fabric network. It provides Network Throughput resources to give the fabric northbound network connectivity.
Actions
Operations Manager does not recommend actions to perform on a Domain.
Synopsis
Budget: A Domain has unlimited budget.
Provides: Network Throughput
Consumes: N/A
Discovered through: Operations Manager discovers Domains through fabric manager targets. For information about fabric manager targets, see Adding Fabric Managers as Targets on page 311.
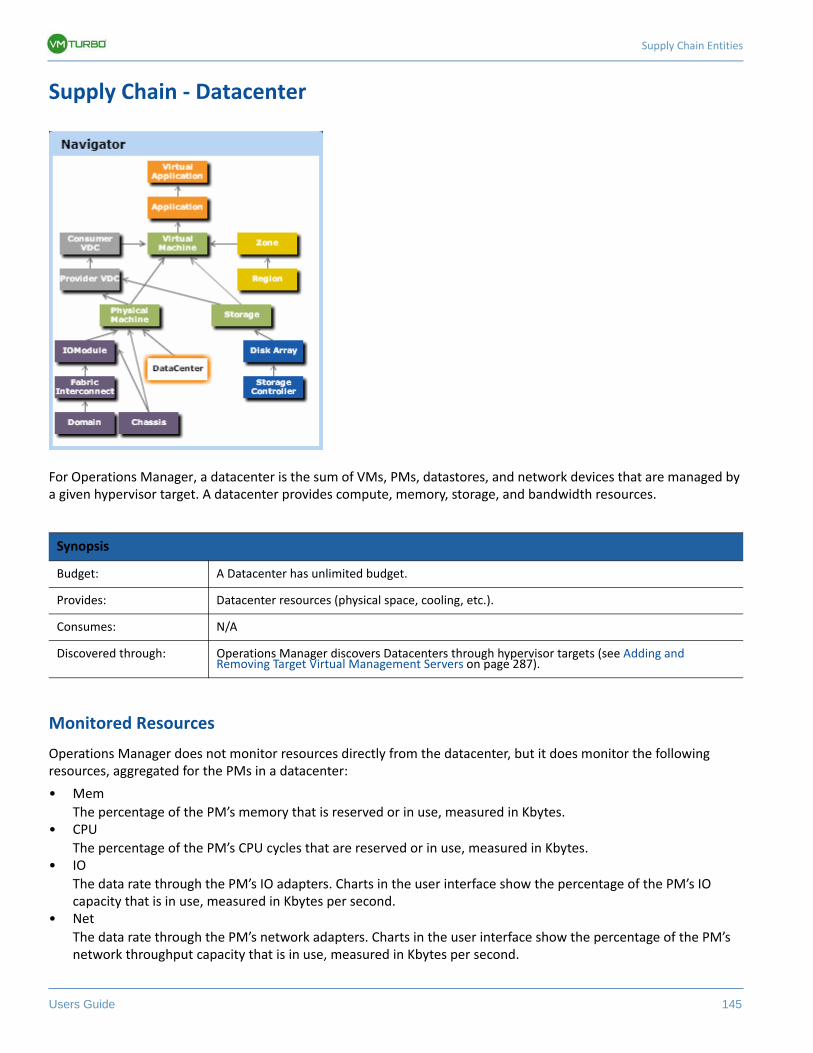
Supply Chain Entities
Users Guide 145
Supply Chain - Datacenter
For Operations Manager, a datacenter is the sum of VMs, PMs, datastores, and network devices that are managed by a given hypervisor target. A datacenter provides compute, memory, storage, and bandwidth resources.
Monitored Resources
Operations Manager does not monitor resources directly from the datacenter, but it does monitor the following resources, aggregated for the PMs in a datacenter:
• Mem
The percentage of the PM’s memory that is reserved or in use, measured in Kbytes.• CPU
The percentage of the PM’s CPU cycles that are reserved or in use, measured in Kbytes.• IO
The data rate through the PM’s IO adapters. Charts in the user interface show the percentage of the PM’s IO capacity that is in use, measured in Kbytes per second.
• Net
The data rate through the PM’s network adapters. Charts in the user interface show the percentage of the PM’s network throughput capacity that is in use, measured in Kbytes per second.
Synopsis
Budget: A Datacenter has unlimited budget.
Provides: Datacenter resources (physical space, cooling, etc.).
Consumes: N/A
Discovered through: Operations Manager discovers Datacenters through hypervisor targets (see Adding and Removing Target Virtual Management Servers on page 287).
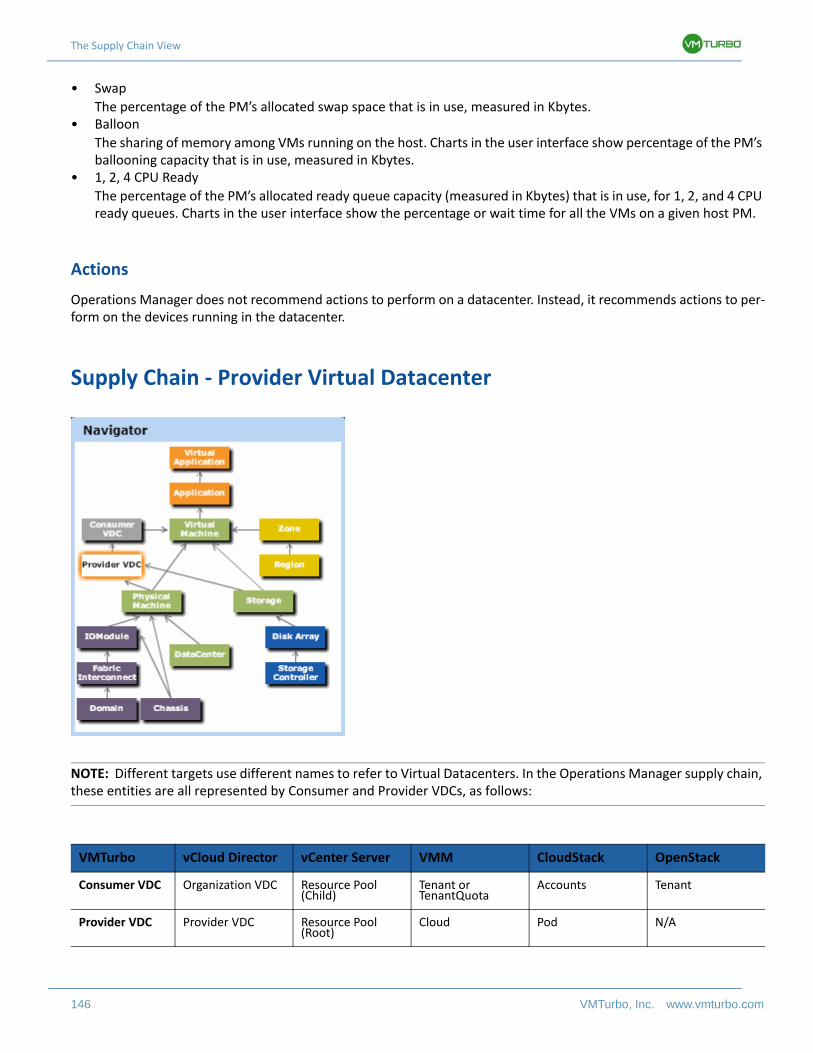
The Supply Chain View
146 VMTurbo, Inc. www.vmturbo.com
• Swap
The percentage of the PM’s allocated swap space that is in use, measured in Kbytes.• Balloon
The sharing of memory among VMs running on the host. Charts in the user interface show percentage of the PM’s ballooning capacity that is in use, measured in Kbytes.
• 1, 2, 4 CPU Ready
The percentage of the PM’s allocated ready queue capacity (measured in Kbytes) that is in use, for 1, 2, and 4 CPU ready queues. Charts in the user interface show the percentage or wait time for all the VMs on a given host PM.
Actions
Operations Manager does not recommend actions to perform on a datacenter. Instead, it recommends actions to per-form on the devices running in the datacenter.
Supply Chain - Provider Virtual Datacenter
NOTE: Different targets use different names to refer to Virtual Datacenters. In the Operations Manager supply chain, these entities are all represented by Consumer and Provider VDCs, as follows:
VMTurbo vCloud Director vCenter Server VMM CloudStack OpenStack
Consumer VDC Organization VDC Resource Pool (Child)
Tenant or TenantQuota
Accounts Tenant
Provider VDC Provider VDC Resource Pool (Root)
Cloud Pod N/A
Supply Chain Entities
Users Guide 147
A provider virtual datacenter (vDC) is a collection of physical resources (PMs and datastores) within a cloud stack. The cloud administrator has access to these resources, and defines the datacenter members. A Provider vDC is created to manage resources that will be allocated to external customers through one or more Consumer vDCs.
Operations Manager supports virtual datacenters when you have installed the Cloud Control Module license.
Monitored Resources
Operations Manager monitors the following resources for a Provider vDC:
• Mem
The percentage of physical machine memory that is reserved or in use, measured in Kbytes.• CPU
The percentage utilization of CPU resources allocated to the Provider vDC.• Storage
The percentage usage of storage that is allocated to the Provider vDC.
Actions
Operations Manager does not recommend actions to perform on a Provider VDC. Instead, it recommends actions to perform on the devices running in the datacenter.
Synopsis
Budget: A Provider vDC gains its budget by selling resources to the Consumer vDCs that it hosts. If utilization falls off, the datacenter loses budget. Ultimately, if the budget isn’t enough to pay for the services it consumes, Operations Manager will recommend decommissioning the Provider vDC.
Provides: Physical resources such as PMs and datastores to Consumer vDCs.
Consumes: PMs and datastores
Discovered through: Operations Manager discovers vDCs through cloud stack managers such as vCloud Director (see Adding and Removing Target Virtual Management Servers on page 287).
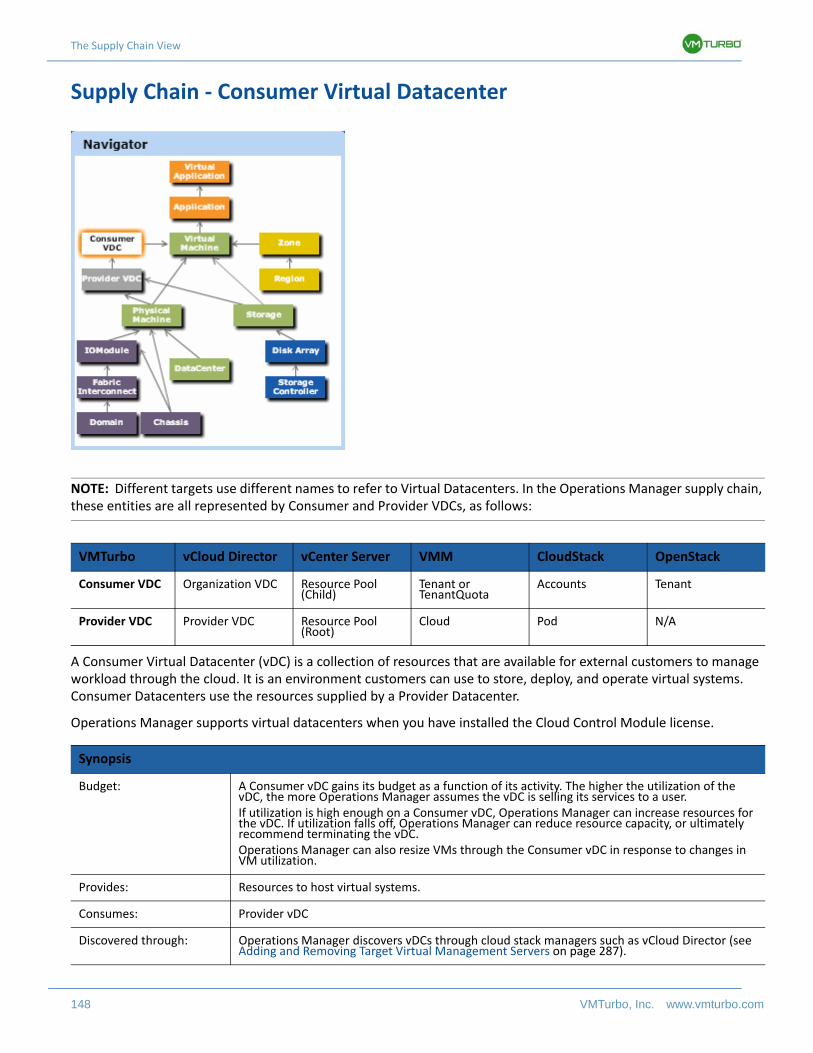
The Supply Chain View
148 VMTurbo, Inc. www.vmturbo.com
Supply Chain - Consumer Virtual Datacenter
NOTE: Different targets use different names to refer to Virtual Datacenters. In the Operations Manager supply chain, these entities are all represented by Consumer and Provider VDCs, as follows:
A Consumer Virtual Datacenter (vDC) is a collection of resources that are available for external customers to manage workload through the cloud. It is an environment customers can use to store, deploy, and operate virtual systems. Consumer Datacenters use the resources supplied by a Provider Datacenter.
Operations Manager supports virtual datacenters when you have installed the Cloud Control Module license.
VMTurbo vCloud Director vCenter Server VMM CloudStack OpenStack
Consumer VDC Organization VDC Resource Pool (Child)
Tenant or TenantQuota
Accounts Tenant
Provider VDC Provider VDC Resource Pool (Root)
Cloud Pod N/A
Synopsis
Budget: A Consumer vDC gains its budget as a function of its activity. The higher the utilization of the vDC, the more Operations Manager assumes the vDC is selling its services to a user.If utilization is high enough on a Consumer vDC, Operations Manager can increase resources for the vDC. If utilization falls off, Operations Manager can reduce resource capacity, or ultimately recommend terminating the vDC.Operations Manager can also resize VMs through the Consumer vDC in response to changes in VM utilization.
Provides: Resources to host virtual systems.
Consumes: Provider vDC
Discovered through: Operations Manager discovers vDCs through cloud stack managers such as vCloud Director (see Adding and Removing Target Virtual Management Servers on page 287).
Supply Chain Entities
Users Guide 149
While users can see some of the physical resources that support the Consumer vDC, consumer-level users cannot modify these physical resources. Users of Consumer vDCs make changes to how the virtual devices are deployed in that environment, but they must ask the Provider vDC administrator to add more physical resources to be used by the Consumer vDC. Likewise, Operations Manager can change resources on the VMs running in the vDC, but it does not make any changes to physical resources through this vDC.
Monitored Resources
Operations Manager monitors the following resources for a Consumer vDC:
• Mem
The percentage of physical machine memory that is reserved or in use for this datacenter, measured in Kbytes.• CPU
The percentage utilization of CPU resources allocated to the datacenter.• Storage
The percentage usage of storage that is allocated to the Consumer vDC.
Actions
Operations Manager recommends the following actions for a Consumer Datacenter:
• Resize Consumer vDC
Resize up to increase memory and CPU.
Resize down if the datacenter resources are underutilized.• Provision Consumer vDC
If resize actions are not executed, Operations Manager can recommend provisioning a new datacenter. For example, Consumer Datacenter users who are billed for additional resources might choose not to execute resize up actions. In that case, Operations Manager could recommend provisioning a new Consumer vDC. Note that Operations Manager will only make this recommendation if there are enough resources on the hosting Provider vDC.
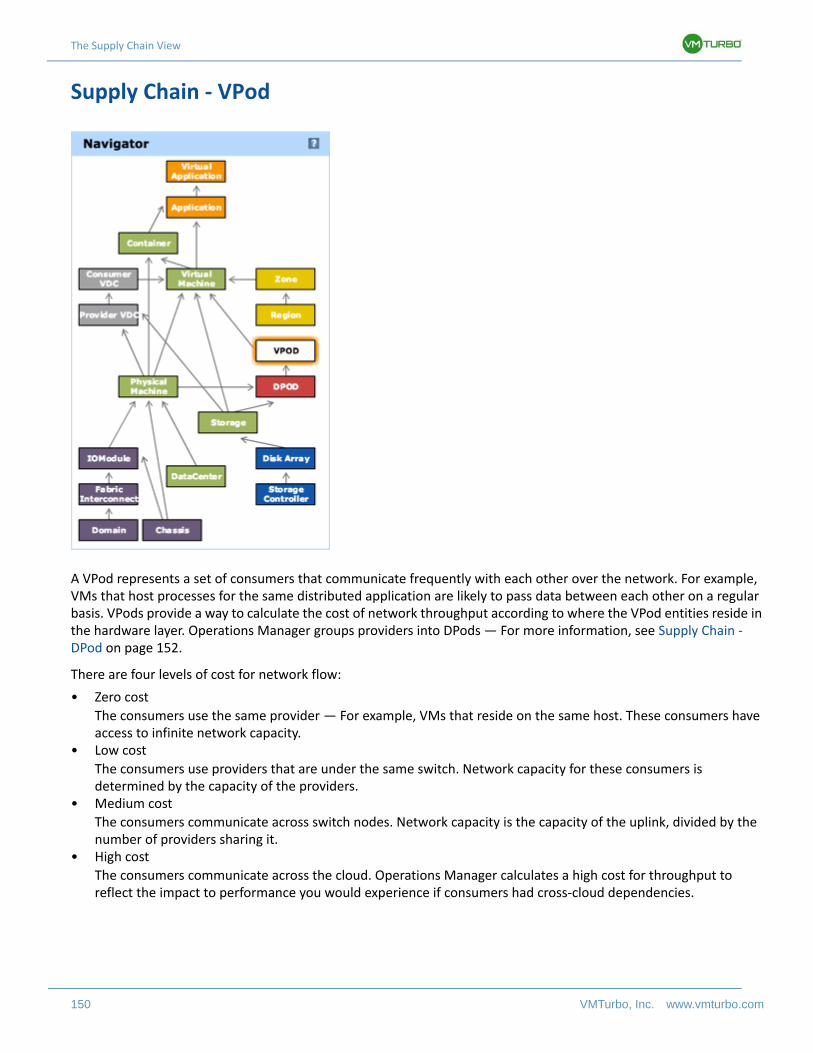
The Supply Chain View
150 VMTurbo, Inc. www.vmturbo.com
Supply Chain - VPod
A VPod represents a set of consumers that communicate frequently with each other over the network. For example, VMs that host processes for the same distributed application are likely to pass data between each other on a regular basis. VPods provide a way to calculate the cost of network throughput according to where the VPod entities reside in the hardware layer. Operations Manager groups providers into DPods — For more information, see Supply Chain - DPod on page 152.
There are four levels of cost for network flow:
• Zero cost
The consumers use the same provider — For example, VMs that reside on the same host. These consumers have access to infinite network capacity.
• Low cost
The consumers use providers that are under the same switch. Network capacity for these consumers is determined by the capacity of the providers.
• Medium cost
The consumers communicate across switch nodes. Network capacity is the capacity of the uplink, divided by the number of providers sharing it.
• High cost
The consumers communicate across the cloud. Operations Manager calculates a high cost for throughput to reflect the impact to performance you would experience if consumers had cross-cloud dependencies.
Supply Chain Entities
Users Guide 151
Monitored Resources
Operations Manager monitors the following resources for a VPod:
• Flow
The percentage of network flow capacity that is utilized by the VPod. This is divided into Flow1 (low cost) and Flow2 (medium cost) utilization.
• Mem
The percentage of providers’ memory that is utilized by the VPod.• CPU
The percentage of the providers’ CPU cycles that are utilized by the VPod.• Storage
The percentage of the providers’ allocated storage that is utilized by the VPod.
Actions
Operations Manager recommends the following actions for a VPod:
• Move a VPod to different DPods (to providers under a different switch)
In addition, Operations Manager can move a VMs into a VPod to reduce network latency.
Synopsis
Budget: VPods have infinite budget — They can consume whatever network resources they need.
Provides: Network throughput to VMs.
Consumes: Network throughput.
Discovered through: Operations Manager discovers VPods through network flow collectors, and also through supported switches.For information, see Adding Network Flow Targets on page 310.
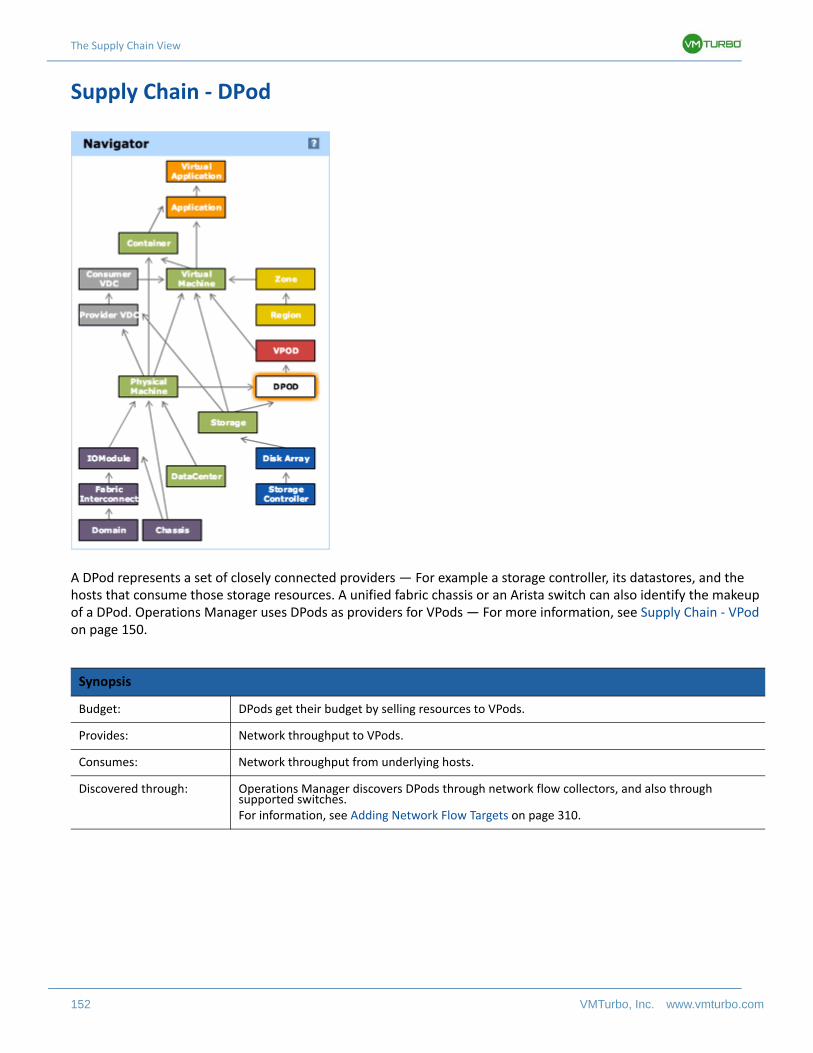
The Supply Chain View
152 VMTurbo, Inc. www.vmturbo.com
Supply Chain - DPod
A DPod represents a set of closely connected providers — For example a storage controller, its datastores, and the hosts that consume those storage resources. A unified fabric chassis or an Arista switch can also identify the makeup of a DPod. Operations Manager uses DPods as providers for VPods — For more information, see Supply Chain - VPod on page 150.
Synopsis
Budget: DPods get their budget by selling resources to VPods.
Provides: Network throughput to VPods.
Consumes: Network throughput from underlying hosts.
Discovered through: Operations Manager discovers DPods through network flow collectors, and also through supported switches.For information, see Adding Network Flow Targets on page 310.
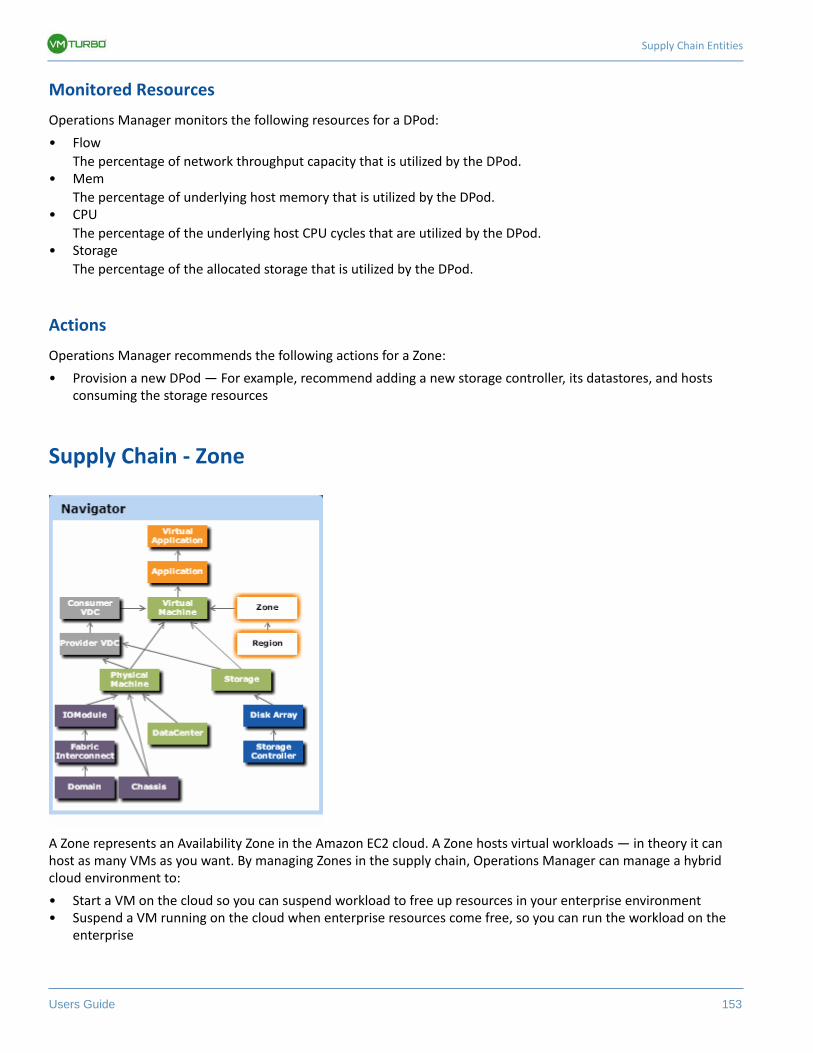
Supply Chain Entities
Users Guide 153
Monitored Resources
Operations Manager monitors the following resources for a DPod:
• Flow
The percentage of network throughput capacity that is utilized by the DPod.• Mem
The percentage of underlying host memory that is utilized by the DPod.• CPU
The percentage of the underlying host CPU cycles that are utilized by the DPod.• Storage
The percentage of the allocated storage that is utilized by the DPod.
Actions
Operations Manager recommends the following actions for a Zone:
• Provision a new DPod — For example, recommend adding a new storage controller, its datastores, and hosts consuming the storage resources
Supply Chain - Zone
A Zone represents an Availability Zone in the Amazon EC2 cloud. A Zone hosts virtual workloads — in theory it can host as many VMs as you want. By managing Zones in the supply chain, Operations Manager can manage a hybrid cloud environment to:
• Start a VM on the cloud so you can suspend workload to free up resources in your enterprise environment• Suspend a VM running on the cloud when enterprise resources come free, so you can run the workload on the
enterprise
The Supply Chain View
154 VMTurbo, Inc. www.vmturbo.com
Monitored Resources
Operations Manager monitors the following resources for a Zone:
• Mem
The percentage of the PM’s memory that is reserved or in use, measured in Kbytes.• CPU
The percentage of the PM’s CPU cycles that are reserved or in use, measured in Kbytes.• IO
The data rate through the PM’s IO adapters. Charts show the percentage of the PM’s IO capacity that is in use, measured in Kbytes per second.
• Net
The data rate through the PM’s network adapters. Charts show the percentage of the PM’s network throughput capacity that is in use, measured in Kbytes per second.
• Swap
The percentage of the PM’s allocated swap space that is in use, measured in Kbytes.• Balloon
The sharing of memory among VMs running on the host. Charts show percentage of the PM’s ballooning capacity that is in use, measured in Kbytes.
• 1, 2, 4 CPU Ready
The percentage of the PM’s allocated ready queue capacity (measured in Kbytes) that is in use, for 1, 2, and 4 CPU ready queues. Charts show the percentage or wait time for all the VMs on a given host PM.
Actions
Operations Manager recommends the following actions for a Zone:
• Start VM on the Zone• Suspend VM running on the Zone
Synopsis
Budget: Operations Manager assumes a Zone has infinite resources.
Provides: Compute and storage resources to VMs.
Consumes: Region resources.
Discovered through: Operations Manager discovers Zones through Region targets.
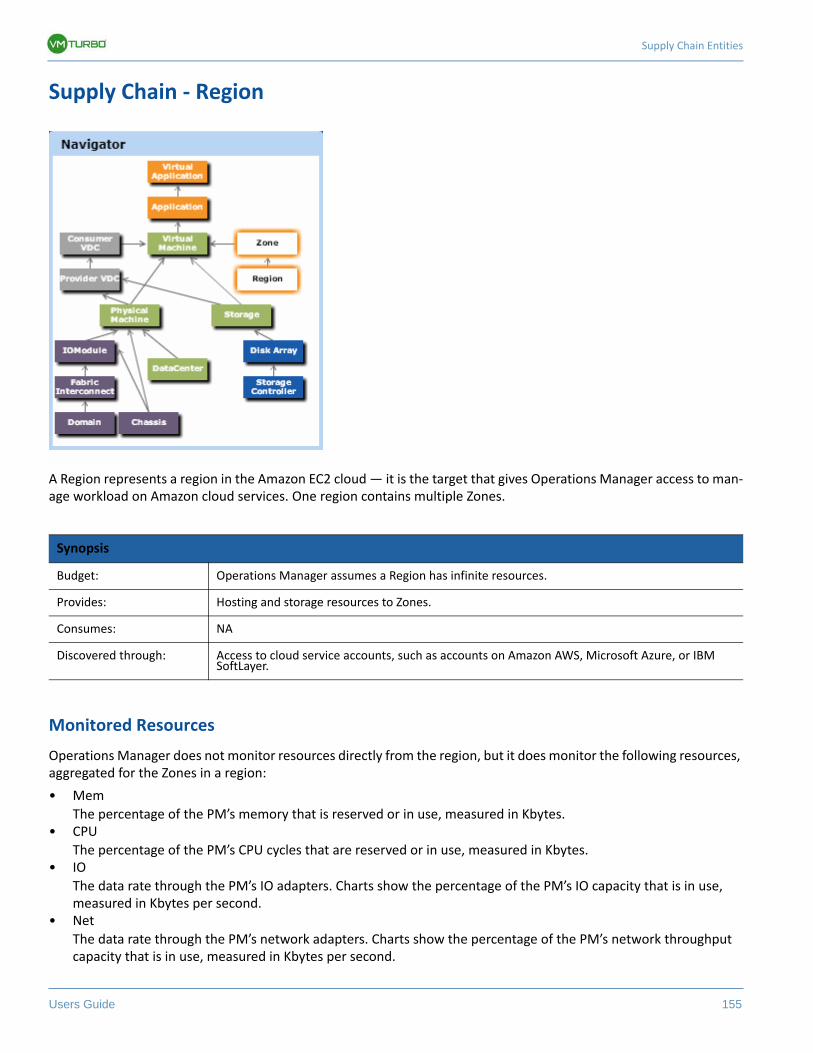
Supply Chain Entities
Users Guide 155
Supply Chain - Region
A Region represents a region in the Amazon EC2 cloud — it is the target that gives Operations Manager access to man-age workload on Amazon cloud services. One region contains multiple Zones.
Monitored Resources
Operations Manager does not monitor resources directly from the region, but it does monitor the following resources, aggregated for the Zones in a region:
• Mem
The percentage of the PM’s memory that is reserved or in use, measured in Kbytes.• CPU
The percentage of the PM’s CPU cycles that are reserved or in use, measured in Kbytes.• IO
The data rate through the PM’s IO adapters. Charts show the percentage of the PM’s IO capacity that is in use, measured in Kbytes per second.
• Net
The data rate through the PM’s network adapters. Charts show the percentage of the PM’s network throughput capacity that is in use, measured in Kbytes per second.
Synopsis
Budget: Operations Manager assumes a Region has infinite resources.
Provides: Hosting and storage resources to Zones.
Consumes: NA
Discovered through: Access to cloud service accounts, such as accounts on Amazon AWS, Microsoft Azure, or IBM SoftLayer.
The Supply Chain View
156 VMTurbo, Inc. www.vmturbo.com
• Swap
The percentage of the PM’s allocated swap space that is in use, measured in Kbytes.• Balloon
The sharing of memory among VMs running on the host. Charts show percentage of the PM’s ballooning capacity that is in use, measured in Kbytes.
• 1, 2, 4 CPU Ready
The percentage of the PM’s allocated ready queue capacity (measured in Kbytes) that is in use, for 1, 2, and 4 CPU ready queues. Charts show the percentage or wait time for all the VMs on a given host PM.
Actions
Operations Manager does not recommend actions for a Region.
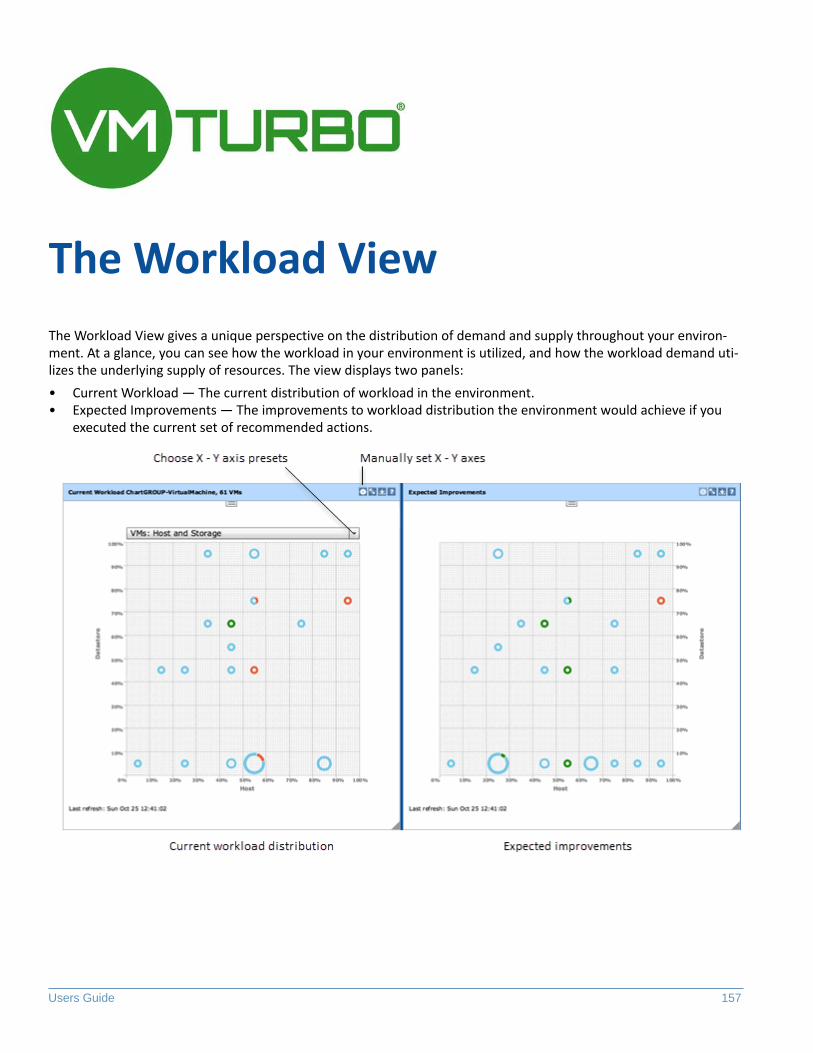
Users Guide 157
The Workload View
The Workload View gives a unique perspective on the distribution of demand and supply throughout your environ-ment. At a glance, you can see how the workload in your environment is utilized, and how the workload demand uti-lizes the underlying supply of resources. The view displays two panels:
• Current Workload — The current distribution of workload in the environment.• Expected Improvements — The improvements to workload distribution the environment would achieve if you
executed the current set of recommended actions.
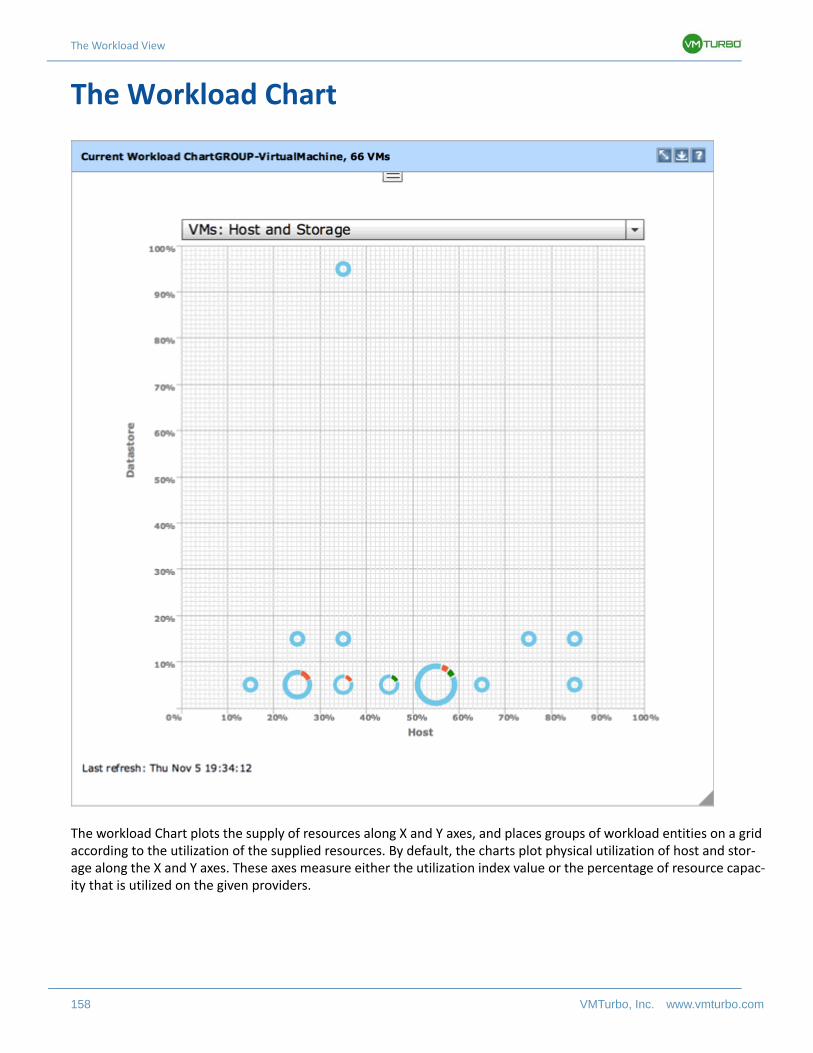
The Workload View
158 VMTurbo, Inc. www.vmturbo.com
The Workload Chart
The workload Chart plots the supply of resources along X and Y axes, and places groups of workload entities on a grid according to the utilization of the supplied resources. By default, the charts plot physical utilization of host and stor-age along the X and Y axes. These axes measure either the utilization index value or the percentage of resource capac-ity that is utilized on the given providers.
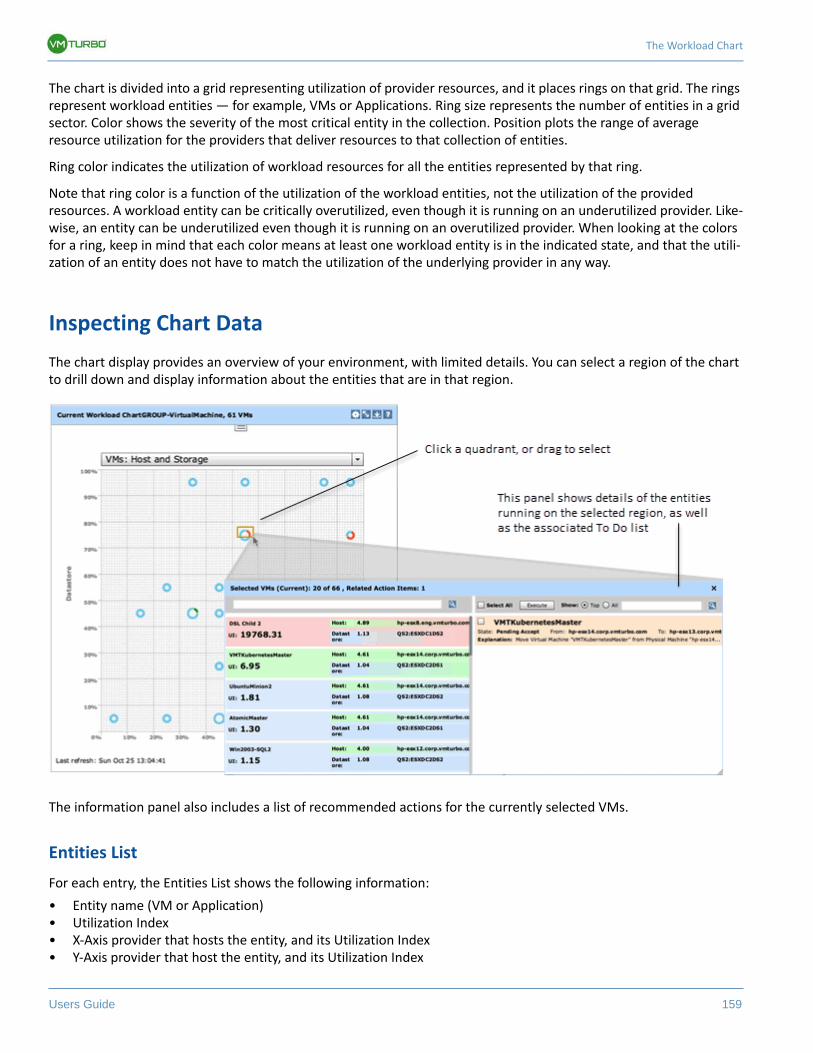
The Workload Chart
Users Guide 159
The chart is divided into a grid representing utilization of provider resources, and it places rings on that grid. The rings represent workload entities — for example, VMs or Applications. Ring size represents the number of entities in a grid sector. Color shows the severity of the most critical entity in the collection. Position plots the range of average resource utilization for the providers that deliver resources to that collection of entities.
Ring color indicates the utilization of workload resources for all the entities represented by that ring.
Note that ring color is a function of the utilization of the workload entities, not the utilization of the provided resources. A workload entity can be critically overutilized, even though it is running on an underutilized provider. Like-wise, an entity can be underutilized even though it is running on an overutilized provider. When looking at the colors for a ring, keep in mind that each color means at least one workload entity is in the indicated state, and that the utili-zation of an entity does not have to match the utilization of the underlying provider in any way.
Inspecting Chart Data
The chart display provides an overview of your environment, with limited details. You can select a region of the chart to drill down and display information about the entities that are in that region.
The information panel also includes a list of recommended actions for the currently selected VMs.
Entities List
For each entry, the Entities List shows the following information:
• Entity name (VM or Application)• Utilization Index• X-Axis provider that hosts the entity, and its Utilization Index• Y-Axis provider that host the entity, and its Utilization Index
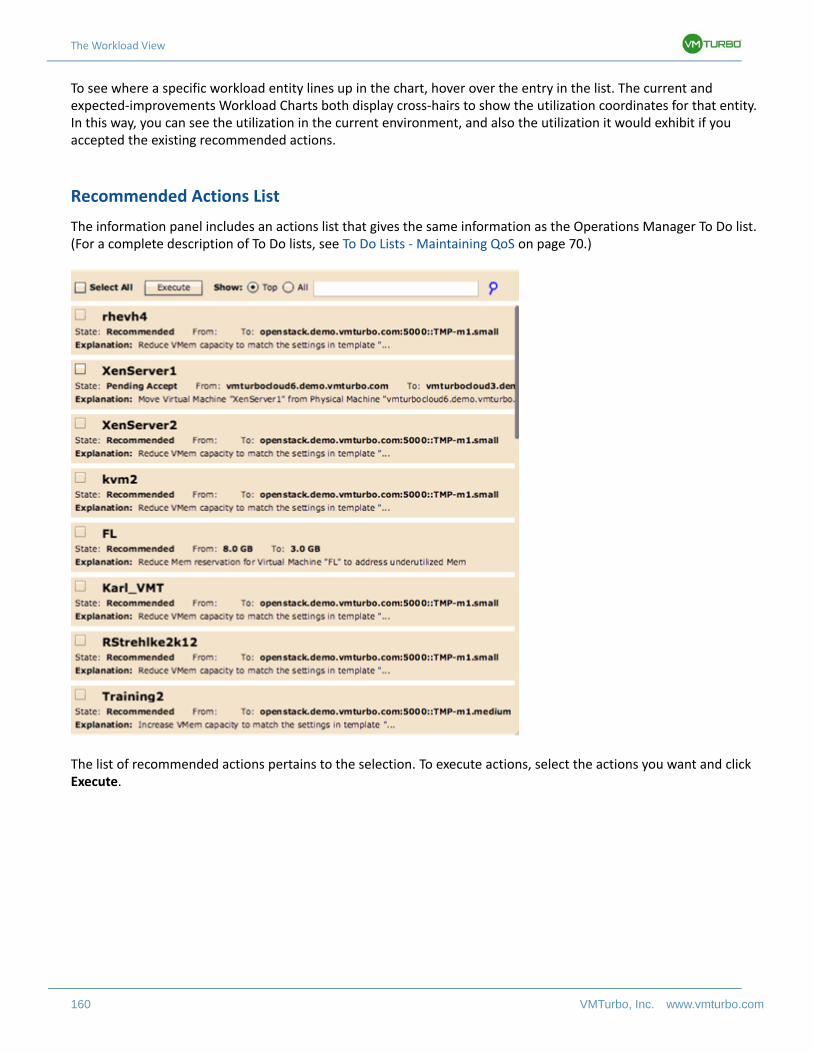
The Workload View
160 VMTurbo, Inc. www.vmturbo.com
To see where a specific workload entity lines up in the chart, hover over the entry in the list. The current and expected-improvements Workload Charts both display cross-hairs to show the utilization coordinates for that entity. In this way, you can see the utilization in the current environment, and also the utilization it would exhibit if you accepted the existing recommended actions.
Recommended Actions List
The information panel includes an actions list that gives the same information as the Operations Manager To Do list. (For a complete description of To Do lists, see To Do Lists - Maintaining QoS on page 70.)
The list of recommended actions pertains to the selection. To execute actions, select the actions you want and click Execute.
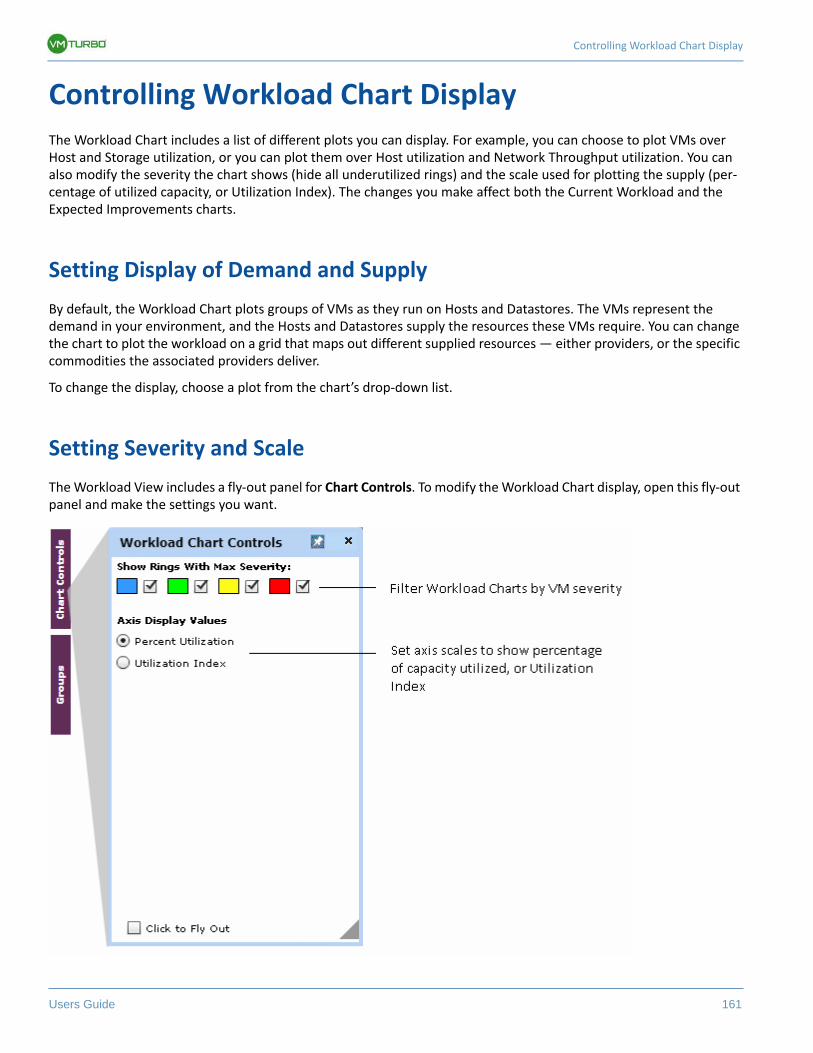
Controlling Workload Chart Display
Users Guide 161
Controlling Workload Chart Display
The Workload Chart includes a list of different plots you can display. For example, you can choose to plot VMs over Host and Storage utilization, or you can plot them over Host utilization and Network Throughput utilization. You can also modify the severity the chart shows (hide all underutilized rings) and the scale used for plotting the supply (per-centage of utilized capacity, or Utilization Index). The changes you make affect both the Current Workload and the Expected Improvements charts.
Setting Display of Demand and Supply
By default, the Workload Chart plots groups of VMs as they run on Hosts and Datastores. The VMs represent the demand in your environment, and the Hosts and Datastores supply the resources these VMs require. You can change the chart to plot the workload on a grid that maps out different supplied resources — either providers, or the specific commodities the associated providers deliver.
To change the display, choose a plot from the chart’s drop-down list.
Setting Severity and Scale
The Workload View includes a fly-out panel for Chart Controls. To modify the Workload Chart display, open this fly-out panel and make the settings you want.
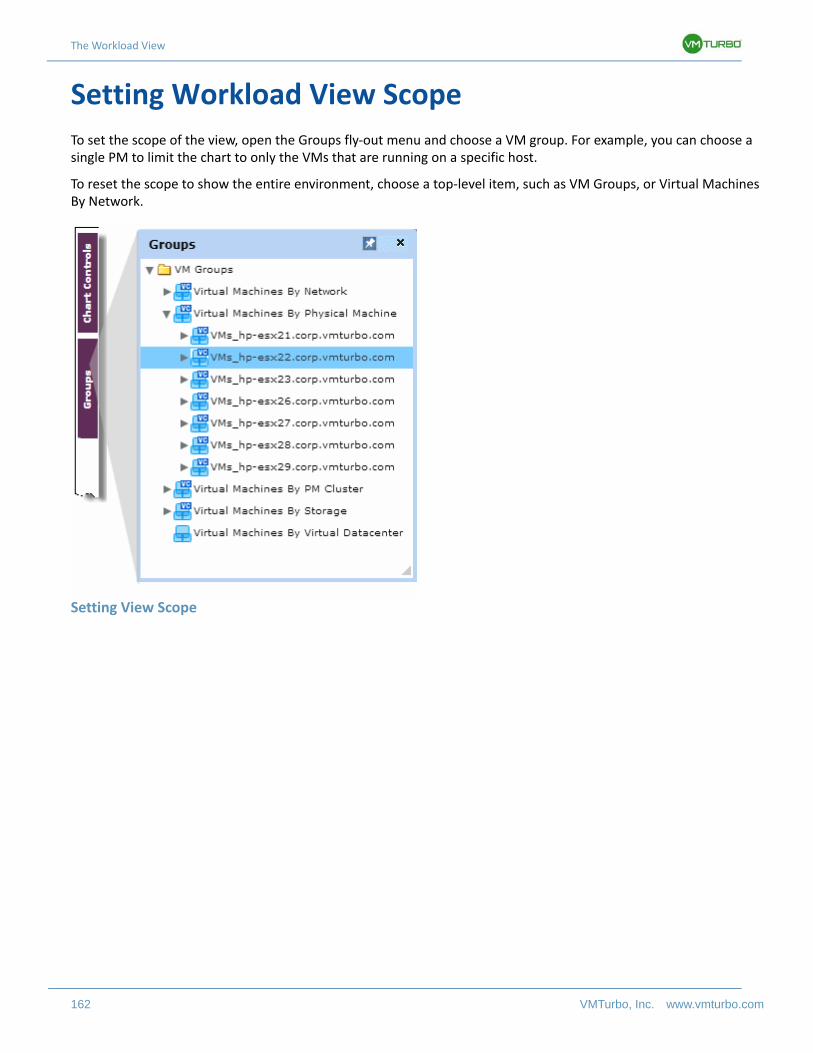
The Workload View
162 VMTurbo, Inc. www.vmturbo.com
Setting Workload View Scope
To set the scope of the view, open the Groups fly-out menu and choose a VM group. For example, you can choose a single PM to limit the chart to only the VMs that are running on a specific host.
To reset the scope to show the entire environment, choose a top-level item, such as VM Groups, or Virtual Machines By Network.
Setting View Scope
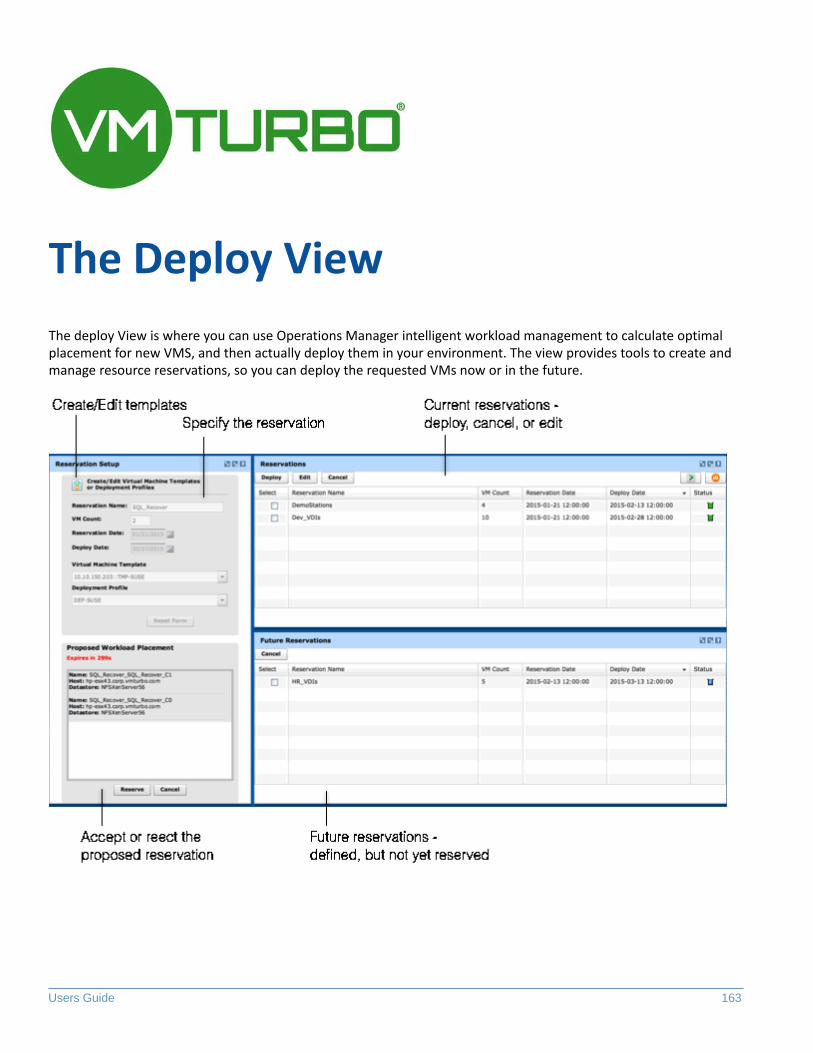
Users Guide 163
The Deploy View
The deploy View is where you can use Operations Manager intelligent workload management to calculate optimal placement for new VMS, and then actually deploy them in your environment. The view provides tools to create and manage resource reservations, so you can deploy the requested VMs now or in the future.
The Deploy View
164 VMTurbo, Inc. www.vmturbo.com
To deploy VMs in this view, you will perform the following steps:
• Define a reservation
Specify the resource requirements for each VM, and how many VMs of that type you want to deploy• Request the resources
Operations Manager calculates the resource requirements. If your system has sufficient resources, Operations Manager lists the placement it recommends for each proposed VM.
• Accept the reservation
If you agree with the proposed VM placement, accept the reservation — If you set a future deploy date, this places the reservation in the Reservations list. If you set a deploy date of today, this will deploy the VMs immediately.
• Deploy the reservation
As long as the reservation is active, you can deploy it. Operations Manager creates the VMs and places them on hosts in your environment.
This view keeps lists of reservations that are in one of the following states:
• Current Reservations
Operations Manager adds the reserved VMs to your inventory, and calculates their placement as though they are real VMs. In this way, you can see how your environment accommodates the additional workload, and you can run plans that take this reserved workload into account. A reservation remains active until you deploy it, cancel it, or the Deploy Date has passed.
There’s no guarantee that your environment has enough resources to place all the VMs in your reservation. In that case, Operations Manager calculates placement for the VMs that it can place, and marks the reservation as unfulfilled. For more information, see Active Reservations on page 168.
• Future Reservations
If you set a future date for the Reservation Date, this puts the reservation in the Future Reservations list. Operations Manager does not calculate placement at this time — the future reservation saves the definition, and Operations Manager will calculate placement and reserve the VMs at the time of the reservation date.
The following topics describe how to use the Deploy view:
• Creating Reservations on page 164• Active Reservations on page 168• Future Reservations on page 172• Deploying VMs on page 172• Creating and Editing Templates on page 174
Creating Reservations
Reservations set aside resources for anticipated workload — they can be Active or Pending. While a reservation is Active, Operations Manager continually calculates placement for the associated VMs, both in the real-time market and in any plans you might run.
To create a reservation, perform the following steps:
• Define the reservation, including workload to reserve and a deploy-by date• Request the reservation• Accept the reservation
If the system has sufficient resources to place the workload, the reservation is active. Otherwise the reservation is pending.
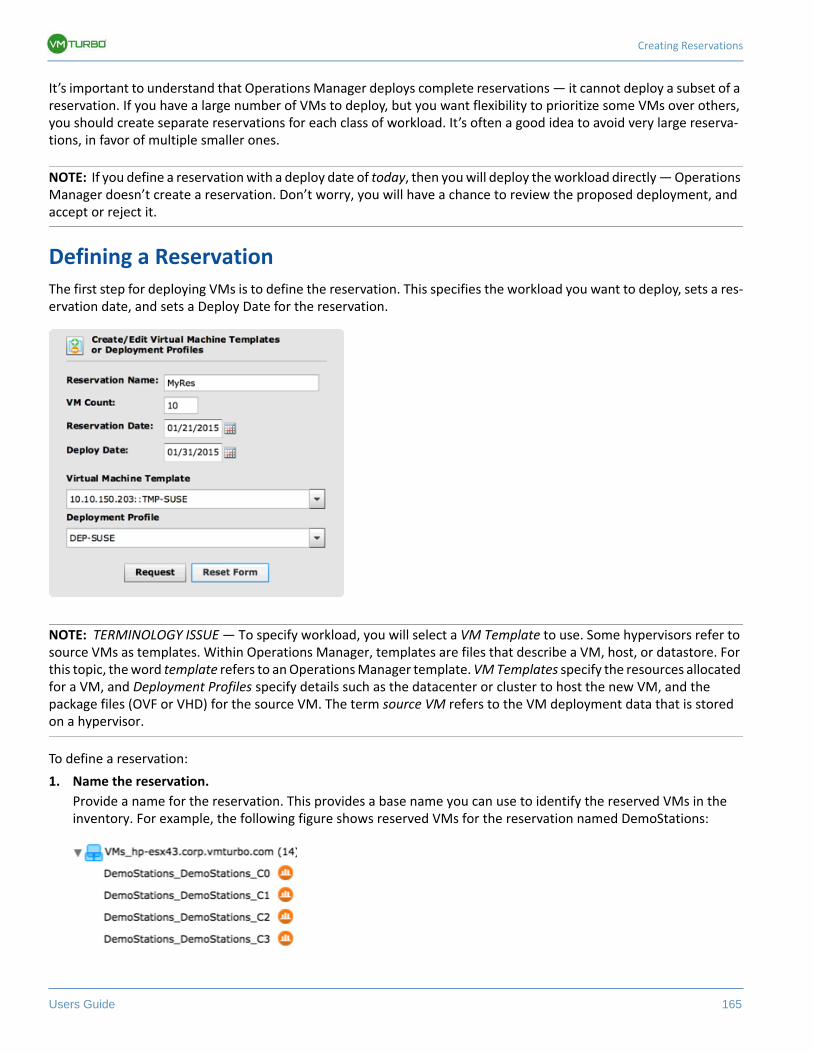
Creating Reservations
Users Guide 165
It’s important to understand that Operations Manager deploys complete reservations — it cannot deploy a subset of a reservation. If you have a large number of VMs to deploy, but you want flexibility to prioritize some VMs over others, you should create separate reservations for each class of workload. It’s often a good idea to avoid very large reserva-tions, in favor of multiple smaller ones.
NOTE: If you define a reservation with a deploy date of today, then you will deploy the workload directly — Operations Manager doesn’t create a reservation. Don’t worry, you will have a chance to review the proposed deployment, and accept or reject it.
Defining a ReservationThe first step for deploying VMs is to define the reservation. This specifies the workload you want to deploy, sets a res-ervation date, and sets a Deploy Date for the reservation.
NOTE: TERMINOLOGY ISSUE — To specify workload, you will select a VM Template to use. Some hypervisors refer to source VMs as templates. Within Operations Manager, templates are files that describe a VM, host, or datastore. For this topic, the word template refers to an Operations Manager template. VM Templates specify the resources allocated for a VM, and Deployment Profiles specify details such as the datacenter or cluster to host the new VM, and the package files (OVF or VHD) for the source VM. The term source VM refers to the VM deployment data that is stored on a hypervisor.
To define a reservation:
1. Name the reservation.
Provide a name for the reservation. This provides a base name you can use to identify the reserved VMs in the inventory. For example, the following figure shows reserved VMs for the reservation named DemoStations:
The Deploy View
166 VMTurbo, Inc. www.vmturbo.com
2. Specify VM Count — how many VMs to deploy with this reservation.
3. Set the Reservation Date.
This sets when to reserve the VM resources. If the date is in the future, then the reservation definition will be saved in the Future Reservations list. Operations Manager does not calculate placement for future reservations. If you give the current date, the reservation is active, and placed in the Reservations list.
4. Set the Deploy Date.
This sets how long the reservation will remain in the Deploy View. If you have not deployed by this date, and the reservation can be fulfilled, Operations Manager automatically deploys the reservation.
To deploy the workload directly, set today’s date in this field. Operations Manager will deploy the workload as soon as you accept the proposed deployment (see Accepting a Reservation on page 167).
5. Choose the VM Template to use for the reserved VMs.
VM Templates specify the resources available to the VM, including:• VCPUs• Virtual Memory• Storage• Network Throughput• IOPS• IO Throughput
Note that you must choose a template that is mapped to a Deployment Profile. When you choose a template, the Deployment Profiles list updates to include the profiles that map to that template.
To inspect VM Templates, open the Template Catalog ( ) and select the template you’re interested in. (For more information about using this dialog box, see Creating VM Templates on page 175.)
If the VM Template was discovered, its name begins with the IP address of the hypervisor that manages that VM template data. Also, a discovered template is read-only (you cannot edit discovered templates).
6. Choose the Deployment Profile to use as the basis of your new VMs.
The Deployment Profile specifies physical details about how to deploy the VM, including:• The path to the VM package files (OVF or VHD) that will be copied to deploy this VM. Note that if the Deploy-
ment Profile data was discovered by Operations Manager, then the profile does not show a path to the VM package files. Also, you cannot edit a discovered Deployment Profile.
• Optional placement constraints (constrain to datacenter or cluster) If the Deployment Profile does not specify a datacenter or cluster, then Operations Manager is free to deploy the VM anywhere in your virtual environ-ment.
To inspect Deployment Profiles, open the Edit Templates dialog box and select the profile you’re interested in. (For more information about using this dialog box, see Creating Deployment Profiles on page 176.) If the Deployment Profile was discovered, its name begins with the characters DEP- for “Deployment”. A discovered profile is read-only.
Requesting a Reservation
After you have defined the reservation, click Request.
If you gave the current date for the reservation, Operations Manager starts to calculate the optimal placement for the VMs you have specified for the reservation. You may have to wait briefly while Operations Manager makes these cal-culations.
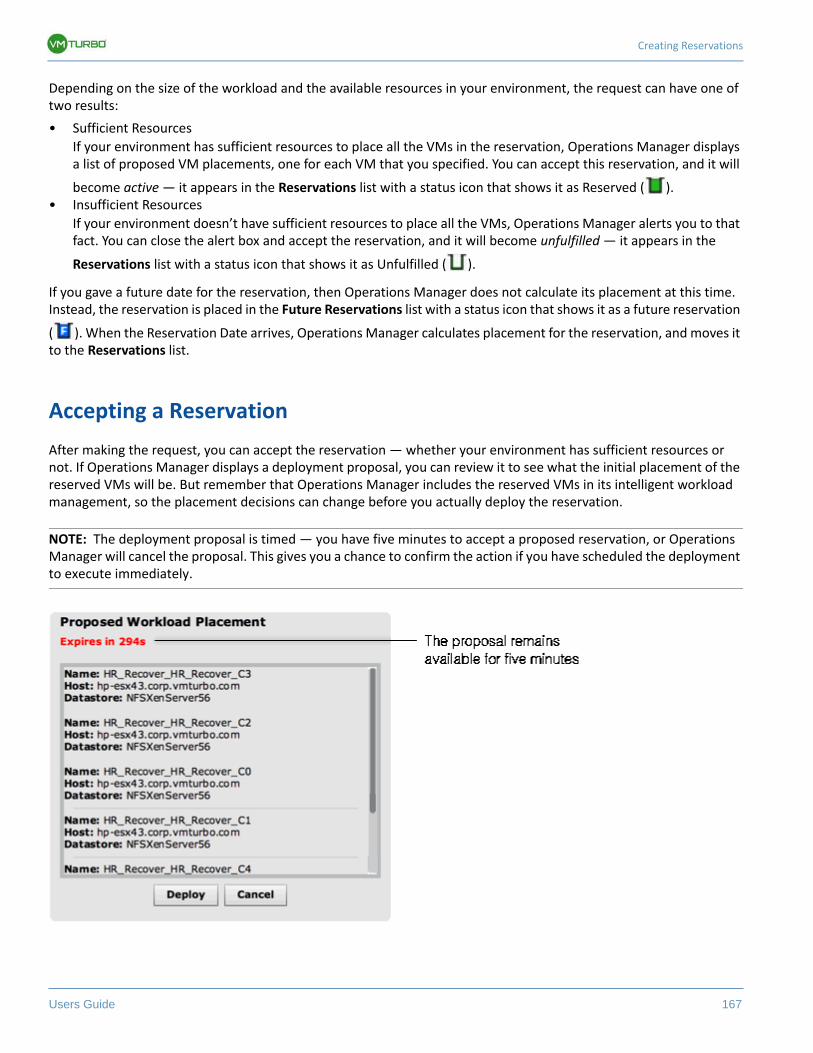
Creating Reservations
Users Guide 167
Depending on the size of the workload and the available resources in your environment, the request can have one of two results:
• Sufficient Resources
If your environment has sufficient resources to place all the VMs in the reservation, Operations Manager displays a list of proposed VM placements, one for each VM that you specified. You can accept this reservation, and it will
become active — it appears in the Reservations list with a status icon that shows it as Reserved ( ).• Insufficient Resources
If your environment doesn’t have sufficient resources to place all the VMs, Operations Manager alerts you to that fact. You can close the alert box and accept the reservation, and it will become unfulfilled — it appears in the
Reservations list with a status icon that shows it as Unfulfilled ( ).
If you gave a future date for the reservation, then Operations Manager does not calculate its placement at this time. Instead, the reservation is placed in the Future Reservations list with a status icon that shows it as a future reservation
( ). When the Reservation Date arrives, Operations Manager calculates placement for the reservation, and moves it to the Reservations list.
Accepting a Reservation
After making the request, you can accept the reservation — whether your environment has sufficient resources or not. If Operations Manager displays a deployment proposal, you can review it to see what the initial placement of the reserved VMs will be. But remember that Operations Manager includes the reserved VMs in its intelligent workload management, so the placement decisions can change before you actually deploy the reservation.
NOTE: The deployment proposal is timed — you have five minutes to accept a proposed reservation, or Operations Manager will cancel the proposal. This gives you a chance to confirm the action if you have scheduled the deployment to execute immediately.
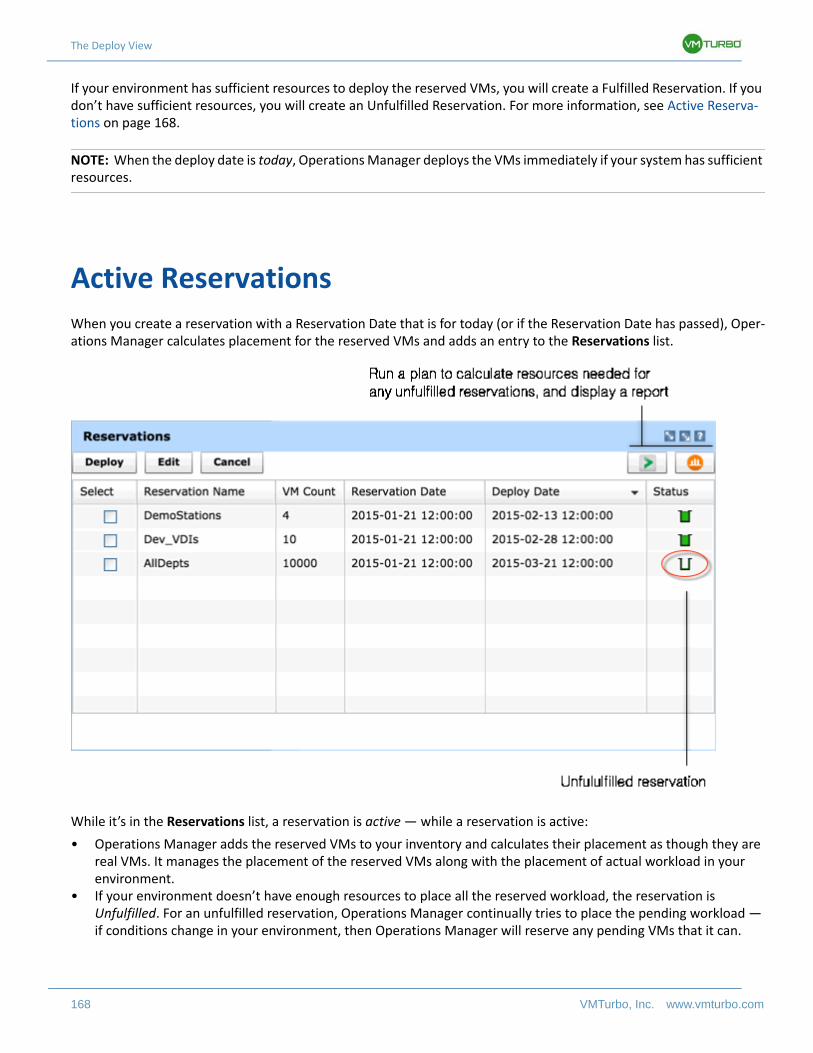
The Deploy View
168 VMTurbo, Inc. www.vmturbo.com
If your environment has sufficient resources to deploy the reserved VMs, you will create a Fulfilled Reservation. If you don’t have sufficient resources, you will create an Unfulfilled Reservation. For more information, see Active Reserva-tions on page 168.
NOTE: When the deploy date is today, Operations Manager deploys the VMs immediately if your system has sufficient resources.
Active Reservations
When you create a reservation with a Reservation Date that is for today (or if the Reservation Date has passed), Oper-ations Manager calculates placement for the reserved VMs and adds an entry to the Reservations list.
While it’s in the Reservations list, a reservation is active — while a reservation is active:
• Operations Manager adds the reserved VMs to your inventory and calculates their placement as though they are real VMs. It manages the placement of the reserved VMs along with the placement of actual workload in your environment.
• If your environment doesn’t have enough resources to place all the reserved workload, the reservation is Unfulfilled. For an unfulfilled reservation, Operations Manager continually tries to place the pending workload — if conditions change in your environment, then Operations Manager will reserve any pending VMs that it can.
Active Reservations
Users Guide 169
• You can see reserved VMs in your inventory, alongside actual workload. This includes the Dashboard, Supply Chain, Workload, and Inventory views.
• You can run plans that take the reserved VMs into account. In addition, plans that are used to generate data in dashboards also include reserved VMs in their calculations
A reservation remains active until one of the following occurs:
• You select the reservation and deploy it
When you deploy a reservation, Operations Manager deploys the indicated VMs at the locations currently occupied by the reserved VMs. Before deploying, you can use different Operations Manager views to inspect the placement of the reserved VMs.
• You select the reservation and cancel it
Canceling a reservation removes the reserved VMs from the market — Operations Manager no longer includes these VMs in its workload placement calculations.
• The Deploy Date has passed
If the reservation is fulfilled, Operations Manager automatically deploys the reservation on the Deploy Date. If the reservation is unfulfilled, Operations Manager cancels the reservation.
NOTE: Operations Manager will only deploy a reservation that is completely fulfilled. If the deploy date passes for an unfulfilled reservation, or if you select it and click Deploy, then Operations Manager cancels the reservation. If any VMs from an unfulfilled reservation were reserved in your environment, they will be removed.
Reservation Details
To see details about an active reservation, click the Details button ( )in the Active Reservations list.
To edit a reservation, select it in the list, and click the Edit button( ). This displays the Update Reservation dia-log box. You can use this dialog box to change the reservation’s name or deploy date.
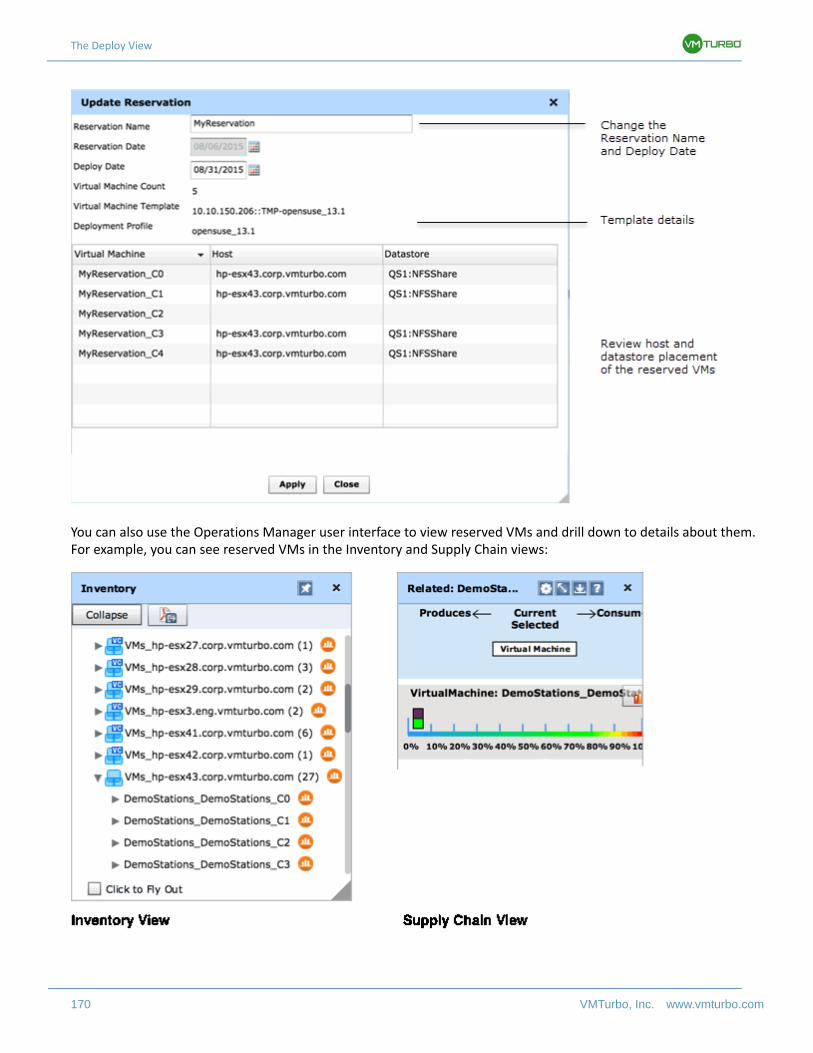
The Deploy View
170 VMTurbo, Inc. www.vmturbo.com
You can also use the Operations Manager user interface to view reserved VMs and drill down to details about them. For example, you can see reserved VMs in the Inventory and Supply Chain views:
Active Reservations
Users Guide 171
Placement Calculations
To place reserved VMs on Hosts and Datastores in your environment, Operations Manager measures the VM con-sumption of the following resources:
• MEM Overprovisioned• CPU Overprovisioned• StorageProvisioned
By default, storage overprovisioning is set to 200%, and Mem and CPU overprovisioning is set to 1000%.
These resources measure consumption of overprovisioned capacity for host MEM and CPU, as well as consumption of StorageProvisioned capacity on the datastores. Each reserved VM consumes a fixed amount of these resources, according to the settings in its template. By using the overprovisioned resources, Operations Manager can calculate the placement of reserved VMs even though they don’t consume any actual resources in the environment.
For example, assume a host machine with MEM capacity of 512 GB. By default, MEM overprovisioning is set to 1000%, so the MEM Overprovisioned capacity is five Tb, or 5120 GB. Assume 10 reserved VMs created from a tem-plate that assigns it 3072 MB of virtual memory to each VM, and assigns a Mem Consumed Factor of 1 to each VM. In that case, Operations Manager calculates utilization of 30720 MB for the reservation, which is approximately 0.59% of the host’s MEM Overprovisioned capacity.
Note that actual VMs and reserved VMs all use the overprovisioned resource. If the actual VMs start to utilize more memory, the utilization of MEM Overprovisioned will increase on the host. If it increases enough, Operations Manager can move VMs off of that host — it might move the actual VMs, or it might move the reserved VMs. Conversely, if uti-lization drops it can move more workload onto the host. In this way, the placement of reserved VMs remains up to date, and that placement will be valid when you choose to deploy the reservation.
Unfulfilled Reservations
If Operations Manager can’t place all the VMs defined in your reservation, it places those VMs that it can, and puts the
reservation into the Reservations list with a status of Unfulfilled ( ). As long as the reservation is active (the deploy date hasn’t passed, and you haven’t canceled the reservation), Operations Manager continues to try and place the pending VMs.
If conditions in your environment have changed, and Operations Manager can place all the VMs for that reservation, it
then chances the reservation status ( ). When it’s time to deploy, Operations Manager will deploy all the associated VMs.
If the deploy date comes and Operations Manager has not been able to place all the VMs, then it cancels the reserva-tion. In other words, Operations Manager will not deploy a partial reservation — it’s all or nothing.
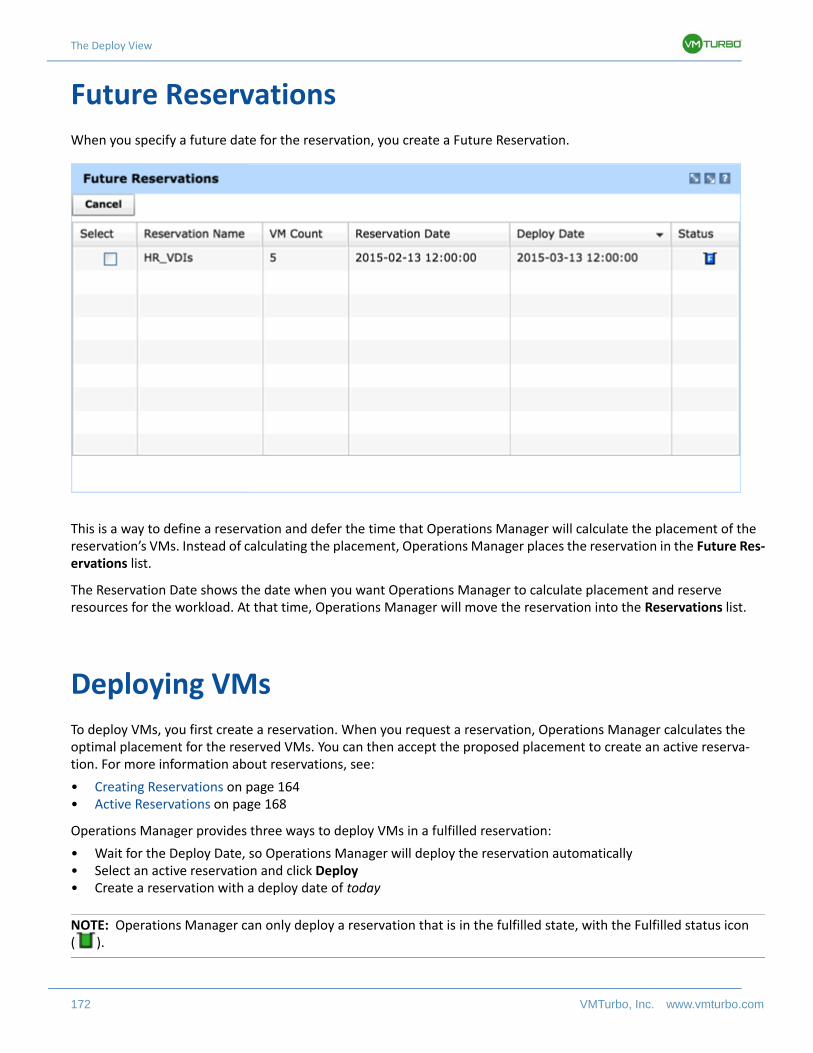
The Deploy View
172 VMTurbo, Inc. www.vmturbo.com
Future Reservations
When you specify a future date for the reservation, you create a Future Reservation.
This is a way to define a reservation and defer the time that Operations Manager will calculate the placement of the reservation’s VMs. Instead of calculating the placement, Operations Manager places the reservation in the Future Res-ervations list.
The Reservation Date shows the date when you want Operations Manager to calculate placement and reserve resources for the workload. At that time, Operations Manager will move the reservation into the Reservations list.
Deploying VMs
To deploy VMs, you first create a reservation. When you request a reservation, Operations Manager calculates the optimal placement for the reserved VMs. You can then accept the proposed placement to create an active reserva-tion. For more information about reservations, see:
• Creating Reservations on page 164• Active Reservations on page 168
Operations Manager provides three ways to deploy VMs in a fulfilled reservation:
• Wait for the Deploy Date, so Operations Manager will deploy the reservation automatically• Select an active reservation and click Deploy• Create a reservation with a deploy date of today
NOTE: Operations Manager can only deploy a reservation that is in the fulfilled state, with the Fulfilled status icon ( ).
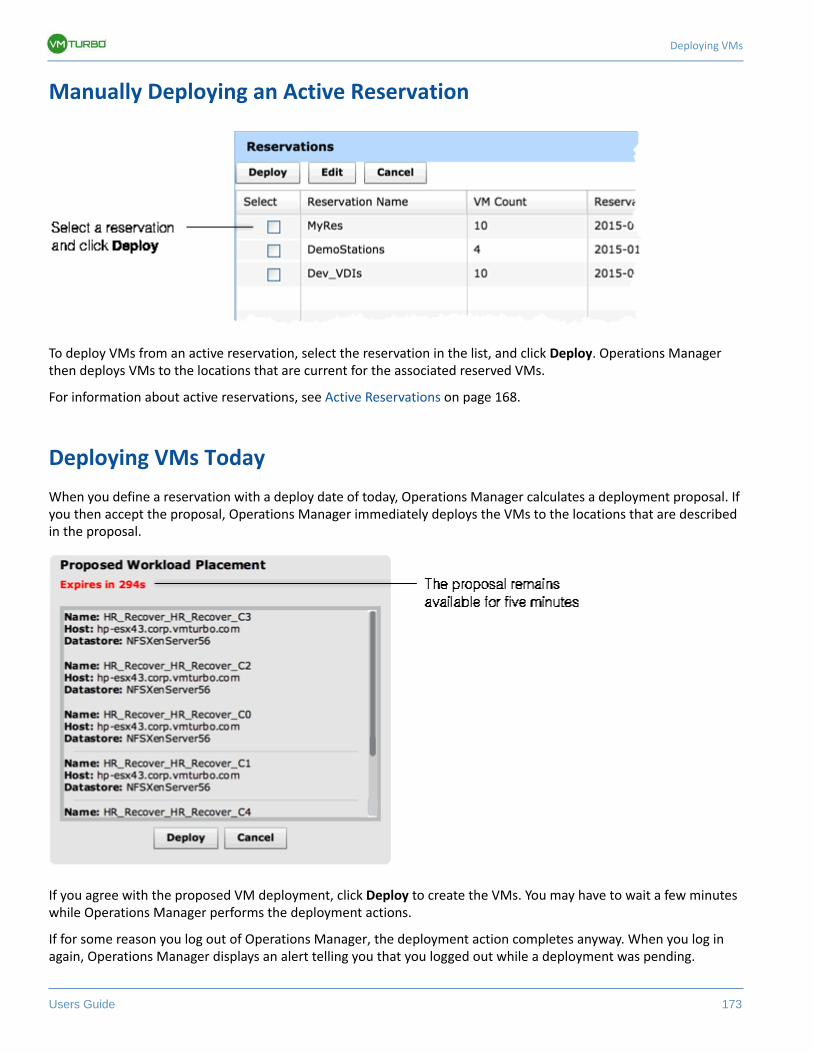
Deploying VMs
Users Guide 173
Manually Deploying an Active Reservation
To deploy VMs from an active reservation, select the reservation in the list, and click Deploy. Operations Manager then deploys VMs to the locations that are current for the associated reserved VMs.
For information about active reservations, see Active Reservations on page 168.
Deploying VMs Today
When you define a reservation with a deploy date of today, Operations Manager calculates a deployment proposal. If you then accept the proposal, Operations Manager immediately deploys the VMs to the locations that are described in the proposal.
If you agree with the proposed VM deployment, click Deploy to create the VMs. You may have to wait a few minutes while Operations Manager performs the deployment actions.
If for some reason you log out of Operations Manager, the deployment action completes anyway. When you log in again, Operations Manager displays an alert telling you that you logged out while a deployment was pending.
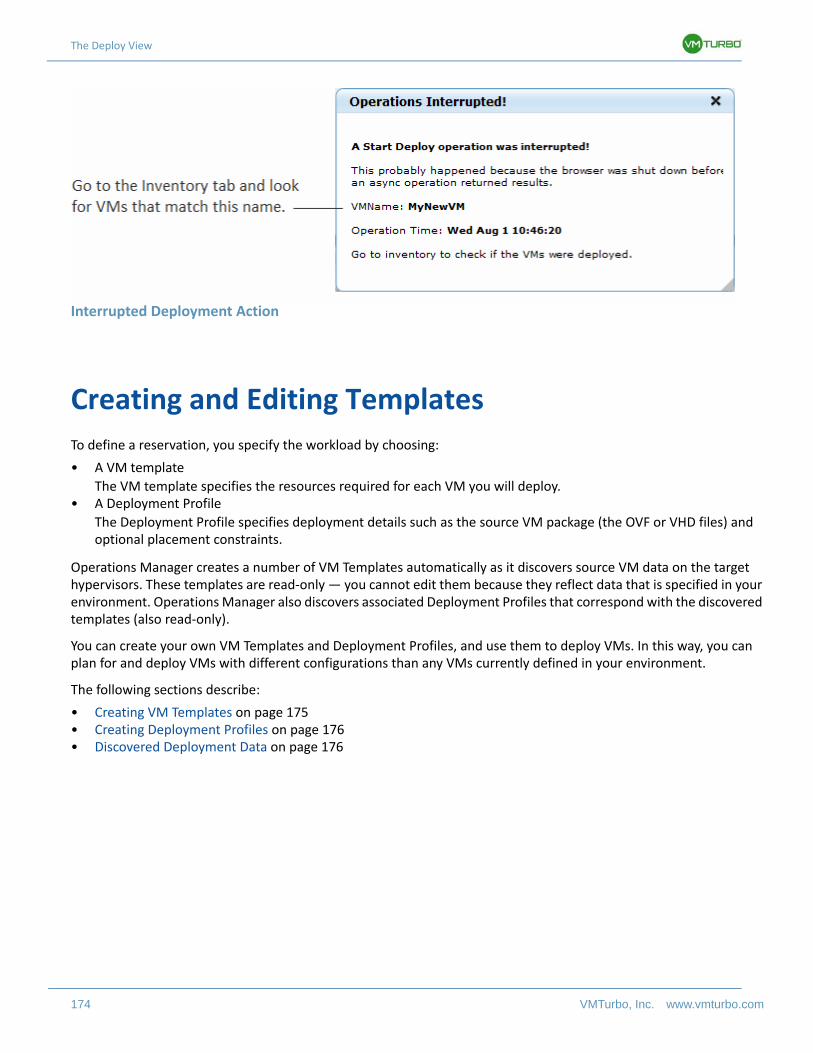
The Deploy View
174 VMTurbo, Inc. www.vmturbo.com
Interrupted Deployment Action
Creating and Editing Templates
To define a reservation, you specify the workload by choosing:
• A VM template
The VM template specifies the resources required for each VM you will deploy.• A Deployment Profile
The Deployment Profile specifies deployment details such as the source VM package (the OVF or VHD files) and optional placement constraints.
Operations Manager creates a number of VM Templates automatically as it discovers source VM data on the target hypervisors. These templates are read-only — you cannot edit them because they reflect data that is specified in your environment. Operations Manager also discovers associated Deployment Profiles that correspond with the discovered templates (also read-only).
You can create your own VM Templates and Deployment Profiles, and use them to deploy VMs. In this way, you can plan for and deploy VMs with different configurations than any VMs currently defined in your environment.
The following sections describe:
• Creating VM Templates on page 175• Creating Deployment Profiles on page 176• Discovered Deployment Data on page 176
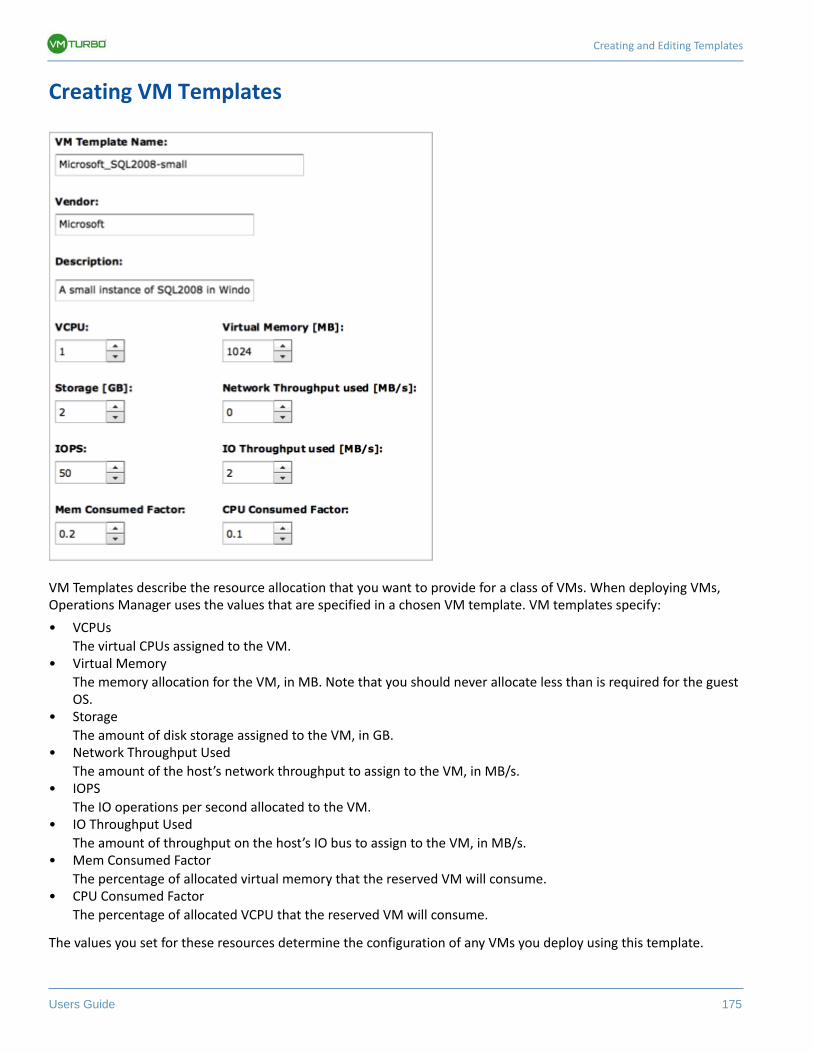
Creating and Editing Templates
Users Guide 175
Creating VM Templates
VM Templates describe the resource allocation that you want to provide for a class of VMs. When deploying VMs, Operations Manager uses the values that are specified in a chosen VM template. VM templates specify:
• VCPUs
The virtual CPUs assigned to the VM.• Virtual Memory
The memory allocation for the VM, in MB. Note that you should never allocate less than is required for the guest OS.
• Storage
The amount of disk storage assigned to the VM, in GB.• Network Throughput Used
The amount of the host’s network throughput to assign to the VM, in MB/s.• IOPS
The IO operations per second allocated to the VM.• IO Throughput Used
The amount of throughput on the host’s IO bus to assign to the VM, in MB/s.• Mem Consumed Factor
The percentage of allocated virtual memory that the reserved VM will consume.• CPU Consumed Factor
The percentage of allocated VCPU that the reserved VM will consume.
The values you set for these resources determine the configuration of any VMs you deploy using this template.
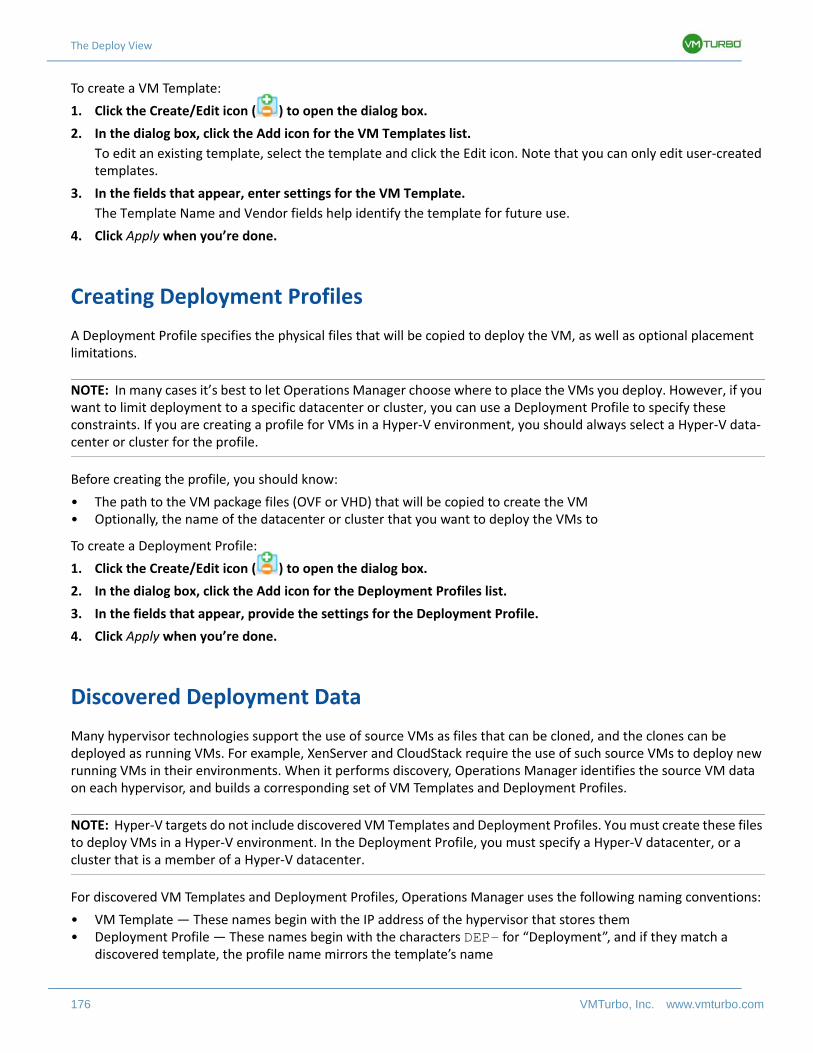
The Deploy View
176 VMTurbo, Inc. www.vmturbo.com
To create a VM Template:
1. Click the Create/Edit icon ( ) to open the dialog box.
2. In the dialog box, click the Add icon for the VM Templates list.
To edit an existing template, select the template and click the Edit icon. Note that you can only edit user-created templates.
3. In the fields that appear, enter settings for the VM Template.
The Template Name and Vendor fields help identify the template for future use.
4. Click Apply when you’re done.
Creating Deployment Profiles
A Deployment Profile specifies the physical files that will be copied to deploy the VM, as well as optional placement limitations.
NOTE: In many cases it’s best to let Operations Manager choose where to place the VMs you deploy. However, if you want to limit deployment to a specific datacenter or cluster, you can use a Deployment Profile to specify these constraints. If you are creating a profile for VMs in a Hyper-V environment, you should always select a Hyper-V data-center or cluster for the profile.
Before creating the profile, you should know:
• The path to the VM package files (OVF or VHD) that will be copied to create the VM• Optionally, the name of the datacenter or cluster that you want to deploy the VMs to
To create a Deployment Profile:
1. Click the Create/Edit icon ( ) to open the dialog box.
2. In the dialog box, click the Add icon for the Deployment Profiles list.
3. In the fields that appear, provide the settings for the Deployment Profile.
4. Click Apply when you’re done.
Discovered Deployment Data
Many hypervisor technologies support the use of source VMs as files that can be cloned, and the clones can be deployed as running VMs. For example, XenServer and CloudStack require the use of such source VMs to deploy new running VMs in their environments. When it performs discovery, Operations Manager identifies the source VM data on each hypervisor, and builds a corresponding set of VM Templates and Deployment Profiles.
NOTE: Hyper-V targets do not include discovered VM Templates and Deployment Profiles. You must create these files to deploy VMs in a Hyper-V environment. In the Deployment Profile, you must specify a Hyper-V datacenter, or a cluster that is a member of a Hyper-V datacenter.
For discovered VM Templates and Deployment Profiles, Operations Manager uses the following naming conventions:
• VM Template — These names begin with the IP address of the hypervisor that stores them• Deployment Profile — These names begin with the characters DEP- for “Deployment”, and if they match a
discovered template, the profile name mirrors the template’s name
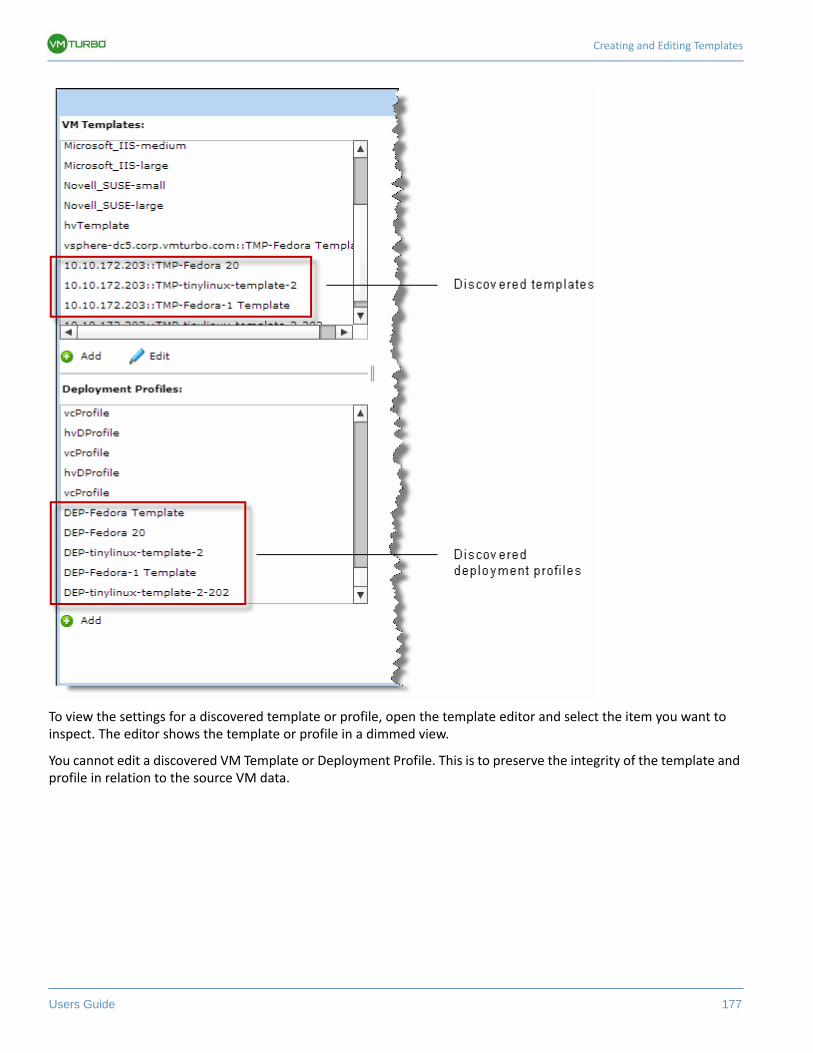
Creating and Editing Templates
Users Guide 177
To view the settings for a discovered template or profile, open the template editor and select the item you want to inspect. The editor shows the template or profile in a dimmed view.
You cannot edit a discovered VM Template or Deployment Profile. This is to preserve the integrity of the template and profile in relation to the source VM data.
Users Guide 178
The Plan View
The Plan View runs simulations for what-if scenarios that explore possibilities such as:
• Optimal workload distribution across existing resources• Changing hardware supply• Impact of downsizing, or removing resources• Optimal workload distribution to meet historical peaks demands• Projected infrastructure requirements
To run these scenarios, Operations Manager creates a snapshot copy of your real-time market. It then uses the Eco-nomic Scheduling Engine to perform analysis on that snapshot market. You can modify the snapshot market by chang-ing the workload, adding or removing hardware resources, or eliminating constraints such as cluster boundaries or placement policies.
Use Cases
Users Guide 179
As it runs a planning scenario, Operations Manager repeatedly executes shopping cycles on the snapshot market until it arrives at the optimal conditions that market can achieve. When it reaches that point, the Economic Scheduling Engine cannot find better prices for any of the resources demanded by the workload — the scenario stops running, and it displays the results as the desired state. The display includes the resulting workload distribution across hosts and datastores, as well as the actions the scenario executed to achieve the desired result.
For example, assume you run a plan that adds virtual machines to a cluster. The plan runs repeated shopping cycles, where each entity in the supply chain shops for the resources it needs, always looking for a better price — looking for those resources from less-utilized suppliers. These shopping cycles continue until all the resources are provided at the best possible price.
The results might show that you can add more workload to your environment, even if you reduce compute resources by suspending physical machines. The recommended actions would then indicate which hosts you can take offline, and how to distribute your virtual machines among the remaining hosts.
To run plans, open the Plan View, start a new plan, then configure and run the plan. Plan setup includes the following:
Use Cases
The Plan View is where you create What-If scenarios that are especially useful for system architects, system adminis-trators, and capacity planners.
Scope Limit the physical devices that are included in the planning scenario—for example, limit to a given cluster. See Setting Plan Scope on page 193.
Projection Enable Projection Planning, then specify the end date and the frequency for a projection plan. A projection plan reiterates its runs to calculate requirements into the future. For each time period you specify, a plan runs to add workload or perform the specified changes on top of the previously run results. This shows how your environment will change over time.
Demand Specify workload parameters for the plan—add or remove VMs, to change load, or demand in your environment. See Specifying the Plan Resources on page 197.
Supply Specify resource parameters for the plan—add or remove hosts or datastores, to change supply in your environment. See Specifying the Plan Resources on page 197.
Baseline Specify baseline utilization statistics for the plan. The baseline types you can set are:
• Historical
• High-Demand
• Percentage Increase
For more information, see Set Baseline from History on page 208.
Advanced Settings Specify advanced parameters for utilization, VM Constraints, and Workload Placement. See Setting Advanced Options on page 212.
Run the plan. The plan can recognize existing constraints (clusters, network/storage constraints, and workload placement policies), or it can disable the constraints before running (Ignore constraints). While a plan is running, the Stop button appears. You can stop a running plan if necessary. See Running Plans on page 188.
The Plan View
180 VMTurbo, Inc. www.vmturbo.com
System architects can use the Plan View to investigate how to expand the physical and virtual inventory to the best effect. A scenario can indicate how much new hardware to add, how to distribute VMs among clusters of hosts, and whether components of the proposed network will be over- or under-utilized.
System administrators can use the Plan View to answer immediate questions. If you expect a surge in utilization or demand, you can run a scenario to explore how to deploy new VMs that perform specific functions.
The following sections show example scenarios that can address these use cases:
• Increasing Virtual Load under Existing Constraints on page 180• Decommission a Cluster or Datacenter on page 184
Increasing Virtual Load under Existing Constraints
Assume you want to determine the load distribution if you add more VMs to your environment. To do this, you would create a Workload Distribution scenario that adds the new VMs, and then determines the best way to run existing and new load on your physical hosts and datastores.
Your environment already has its physical systems assigned to clusters and resource pools. As you add VMs to the environment, you want to respect these constraints. When thinking about this scenario, imagine asking, “What would happen if I add ten VMs running Web servers, and ten VMs running database servers? How can I optimally deploy these VMs in my current environment?”
To plan out the best way to add these VMs to your inventory, you can create a Workload Distribution scenario that:
• Specifies how many VMs to add• Uses an existing Web server VM as a model for your new Web server VMs• Uses an existing database VM as a model for your new database VMs
Use Cases
Users Guide 181
The following steps show how to create such a scenario in the Plan view:
1. Start a New plan to add VMs.
Click the NEW button ( ) to open the Plan Wizard, and choose the Added VMs scenario. This clears the loaded plan so you can specify a new plan based on your current environment.
2. Define the scope of the plan.
By default, a plan loads a snapshot of your complete environment. Setting scope to the plan limits the processing to only those parts of the environment that interest you for this scenario. When you’re done, click Next.
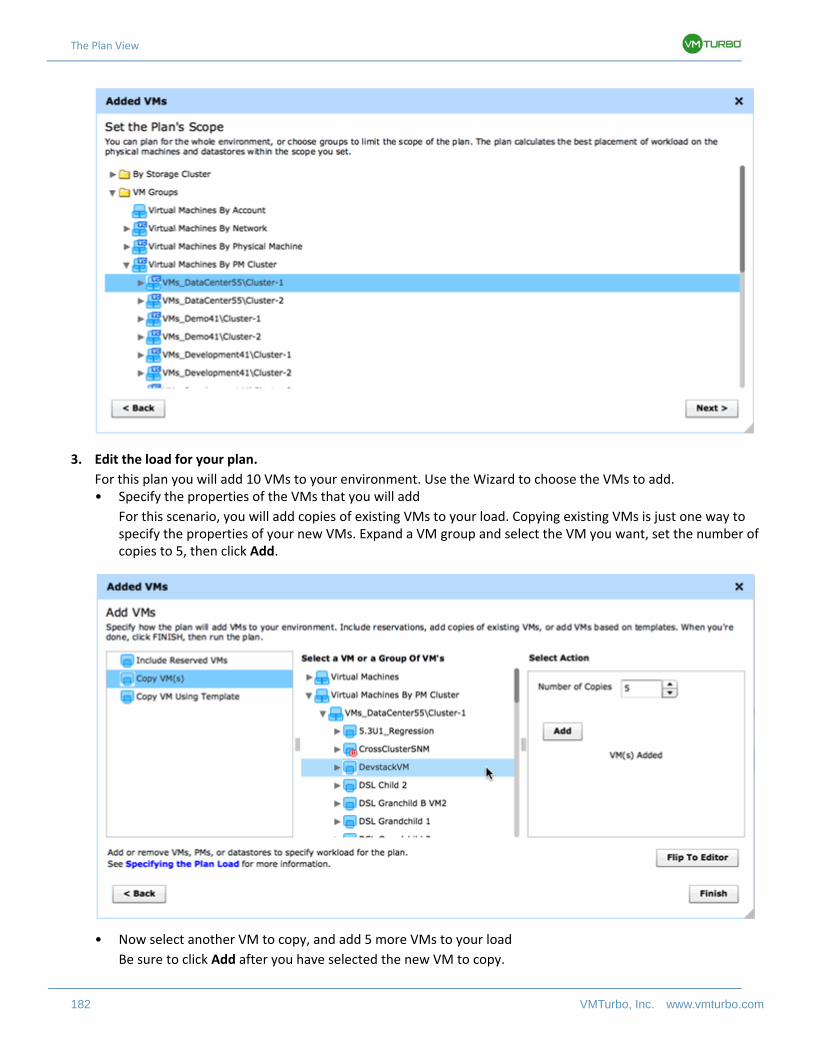
The Plan View
182 VMTurbo, Inc. www.vmturbo.com
3. Edit the load for your plan.
For this plan you will add 10 VMs to your environment. Use the Wizard to choose the VMs to add.• Specify the properties of the VMs that you will add
For this scenario, you will add copies of existing VMs to your load. Copying existing VMs is just one way to specify the properties of your new VMs. Expand a VM group and select the VM you want, set the number of copies to 5, then click Add.
• Now select another VM to copy, and add 5 more VMs to your load
Be sure to click Add after you have selected the new VM to copy.
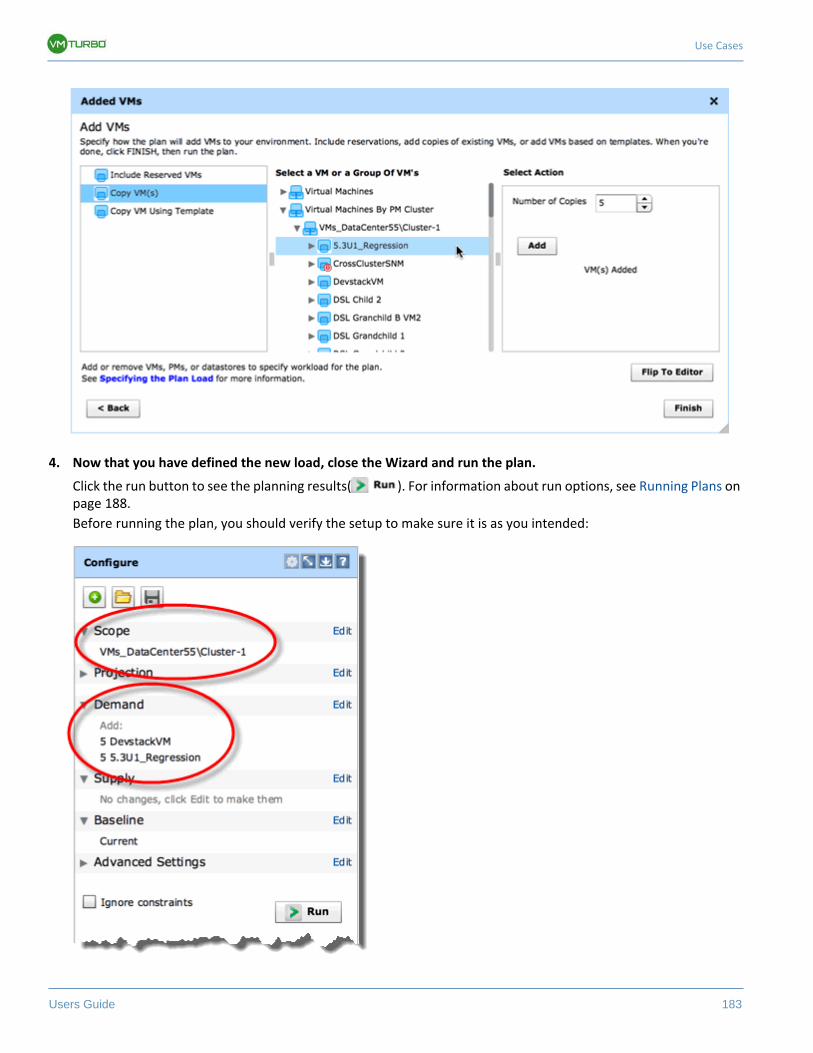
Use Cases
Users Guide 183
4. Now that you have defined the new load, close the Wizard and run the plan.
Click the run button to see the planning results( ). For information about run options, see Running Plans on page 188.
Before running the plan, you should verify the setup to make sure it is as you intended:
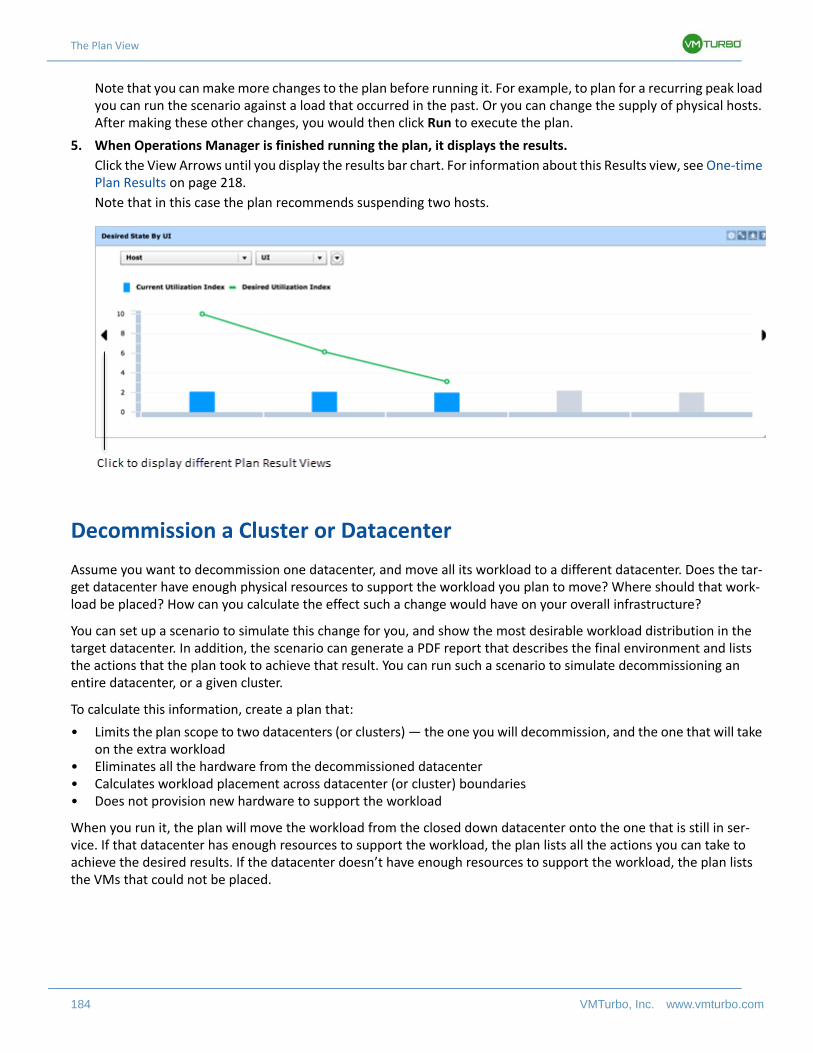
The Plan View
184 VMTurbo, Inc. www.vmturbo.com
Note that you can make more changes to the plan before running it. For example, to plan for a recurring peak load you can run the scenario against a load that occurred in the past. Or you can change the supply of physical hosts. After making these other changes, you would then click Run to execute the plan.
5. When Operations Manager is finished running the plan, it displays the results.
Click the View Arrows until you display the results bar chart. For information about this Results view, see One-time Plan Results on page 218.
Note that in this case the plan recommends suspending two hosts.
Decommission a Cluster or Datacenter
Assume you want to decommission one datacenter, and move all its workload to a different datacenter. Does the tar-get datacenter have enough physical resources to support the workload you plan to move? Where should that work-load be placed? How can you calculate the effect such a change would have on your overall infrastructure?
You can set up a scenario to simulate this change for you, and show the most desirable workload distribution in the target datacenter. In addition, the scenario can generate a PDF report that describes the final environment and lists the actions that the plan took to achieve that result. You can run such a scenario to simulate decommissioning an entire datacenter, or a given cluster.
To calculate this information, create a plan that:
• Limits the plan scope to two datacenters (or clusters) — the one you will decommission, and the one that will take on the extra workload
• Eliminates all the hardware from the decommissioned datacenter• Calculates workload placement across datacenter (or cluster) boundaries• Does not provision new hardware to support the workload
When you run it, the plan will move the workload from the closed down datacenter onto the one that is still in ser-vice. If that datacenter has enough resources to support the workload, the plan lists all the actions you can take to achieve the desired results. If the datacenter doesn’t have enough resources to support the workload, the plan lists the VMs that could not be placed.
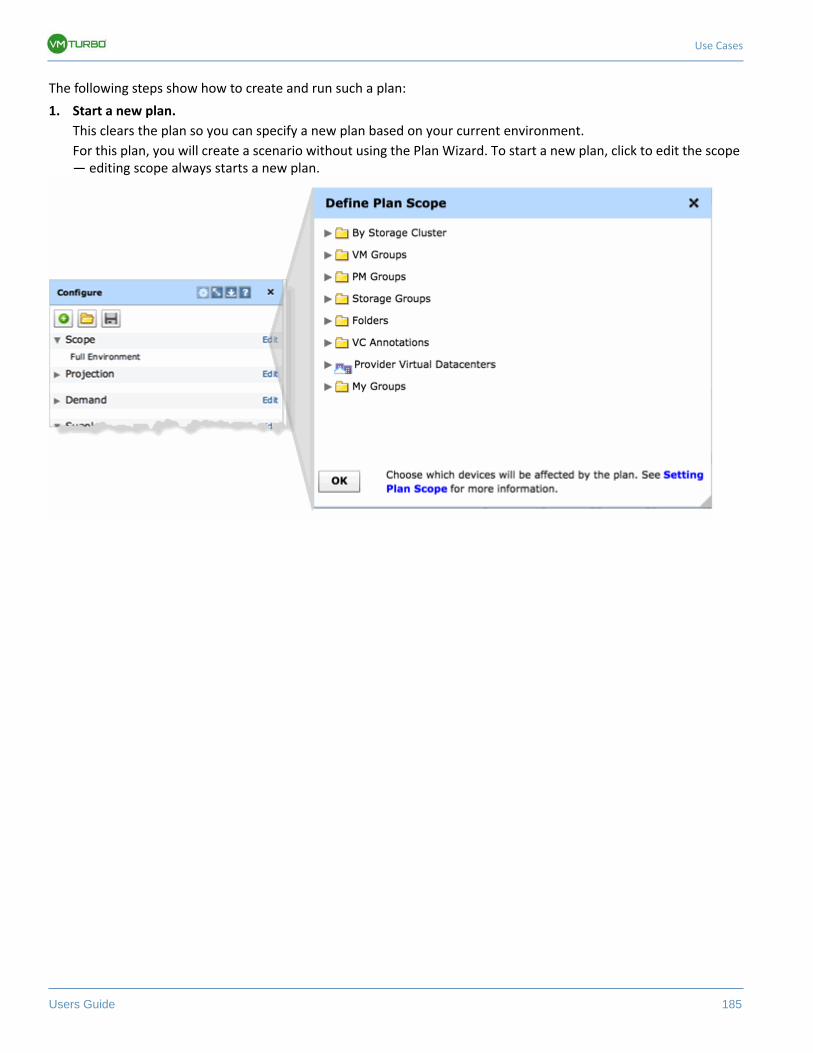
Use Cases
Users Guide 185
The following steps show how to create and run such a plan:
1. Start a new plan.
This clears the plan so you can specify a new plan based on your current environment.
For this plan, you will create a scenario without using the Plan Wizard. To start a new plan, click to edit the scope — editing scope always starts a new plan.
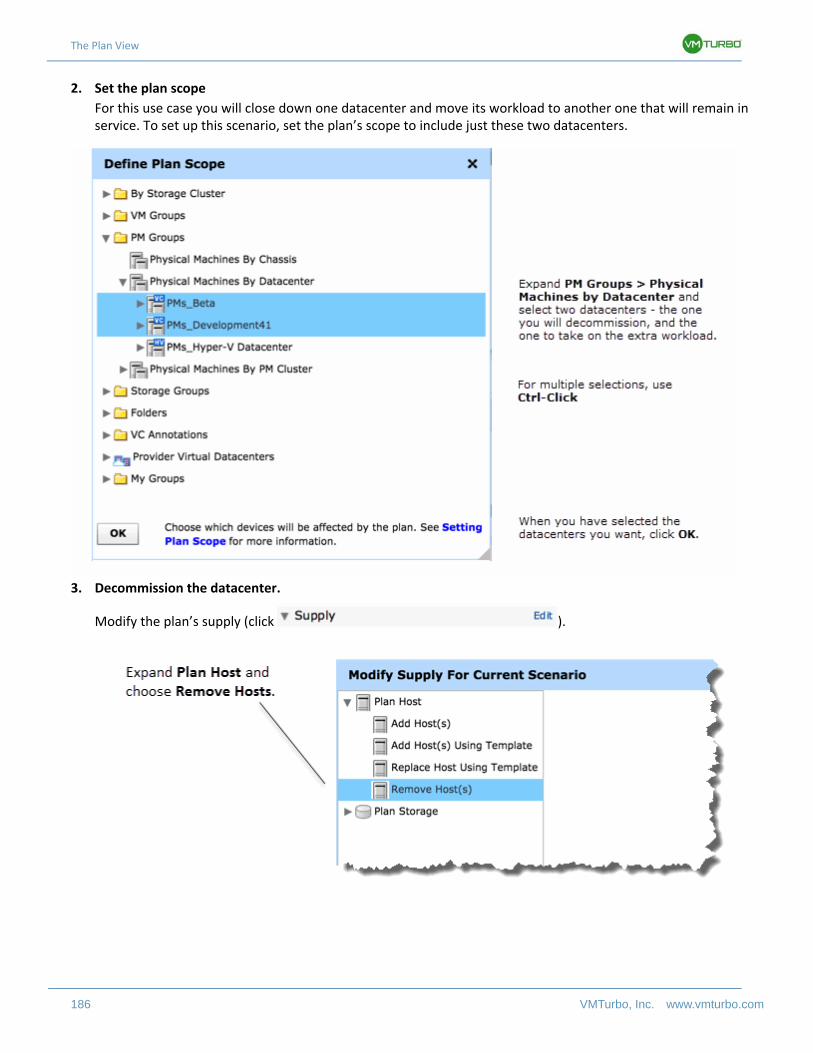
The Plan View
186 VMTurbo, Inc. www.vmturbo.com
2. Set the plan scope
For this use case you will close down one datacenter and move its workload to another one that will remain in service. To set up this scenario, set the plan’s scope to include just these two datacenters.
3. Decommission the datacenter.
Modify the plan’s supply (click ).
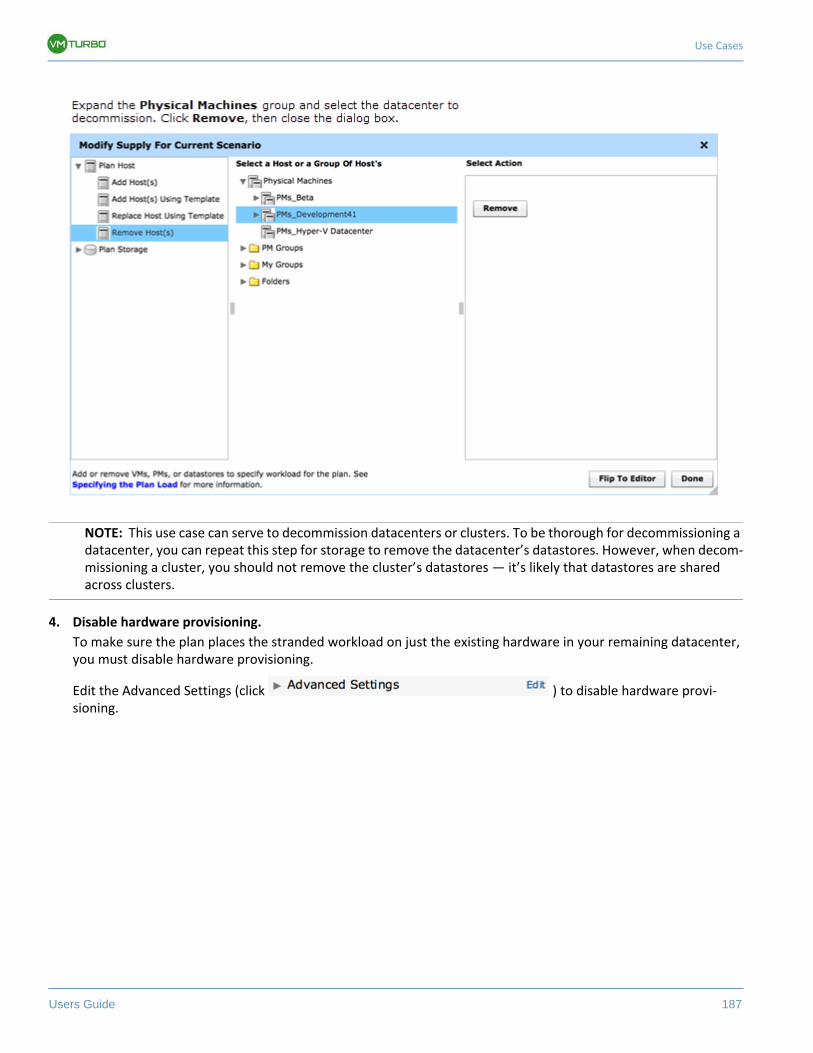
Use Cases
Users Guide 187
NOTE: This use case can serve to decommission datacenters or clusters. To be thorough for decommissioning a datacenter, you can repeat this step for storage to remove the datacenter’s datastores. However, when decom-missioning a cluster, you should not remove the cluster’s datastores — it’s likely that datastores are shared across clusters.
4. Disable hardware provisioning.
To make sure the plan places the stranded workload on just the existing hardware in your remaining datacenter, you must disable hardware provisioning.
Edit the Advanced Settings (click ) to disable hardware provi-sioning.
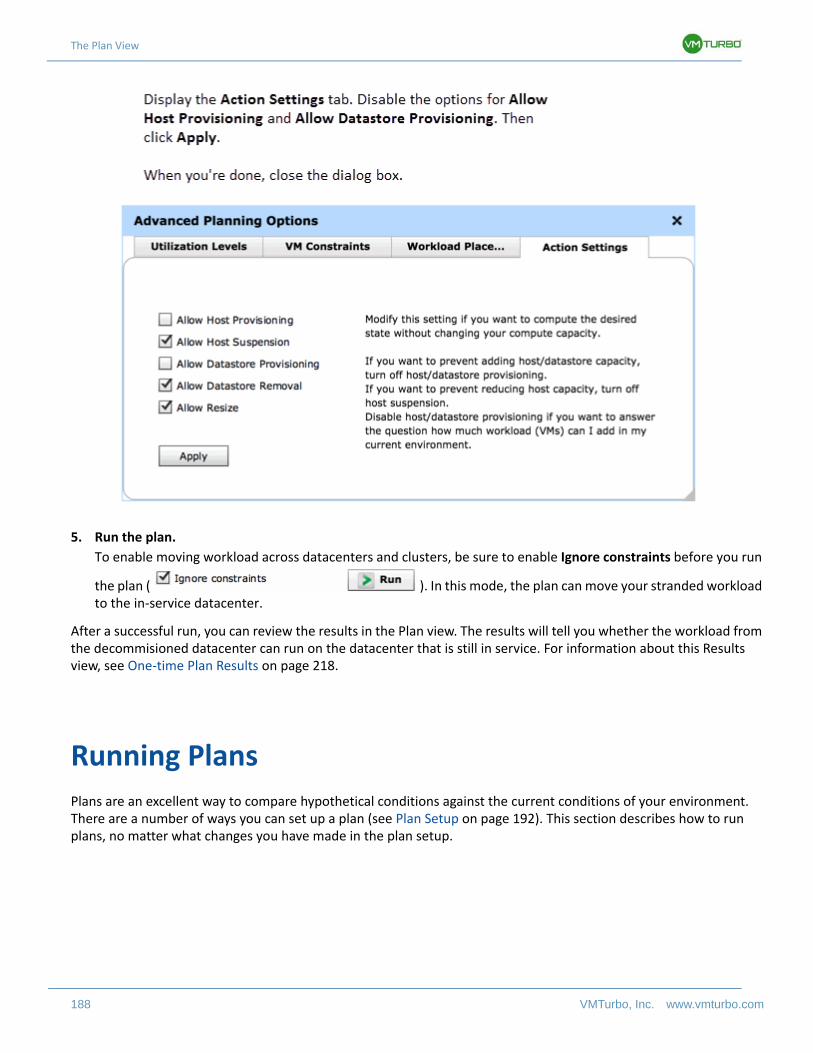
The Plan View
188 VMTurbo, Inc. www.vmturbo.com
5. Run the plan.
To enable moving workload across datacenters and clusters, be sure to enable Ignore constraints before you run
the plan ( ). In this mode, the plan can move your stranded workload to the in-service datacenter.
After a successful run, you can review the results in the Plan view. The results will tell you whether the workload from the decommisioned datacenter can run on the datacenter that is still in service. For information about this Results view, see One-time Plan Results on page 218.
Running Plans
Plans are an excellent way to compare hypothetical conditions against the current conditions of your environment. There are a number of ways you can set up a plan (see Plan Setup on page 192). This section describes how to run plans, no matter what changes you have made in the plan setup.
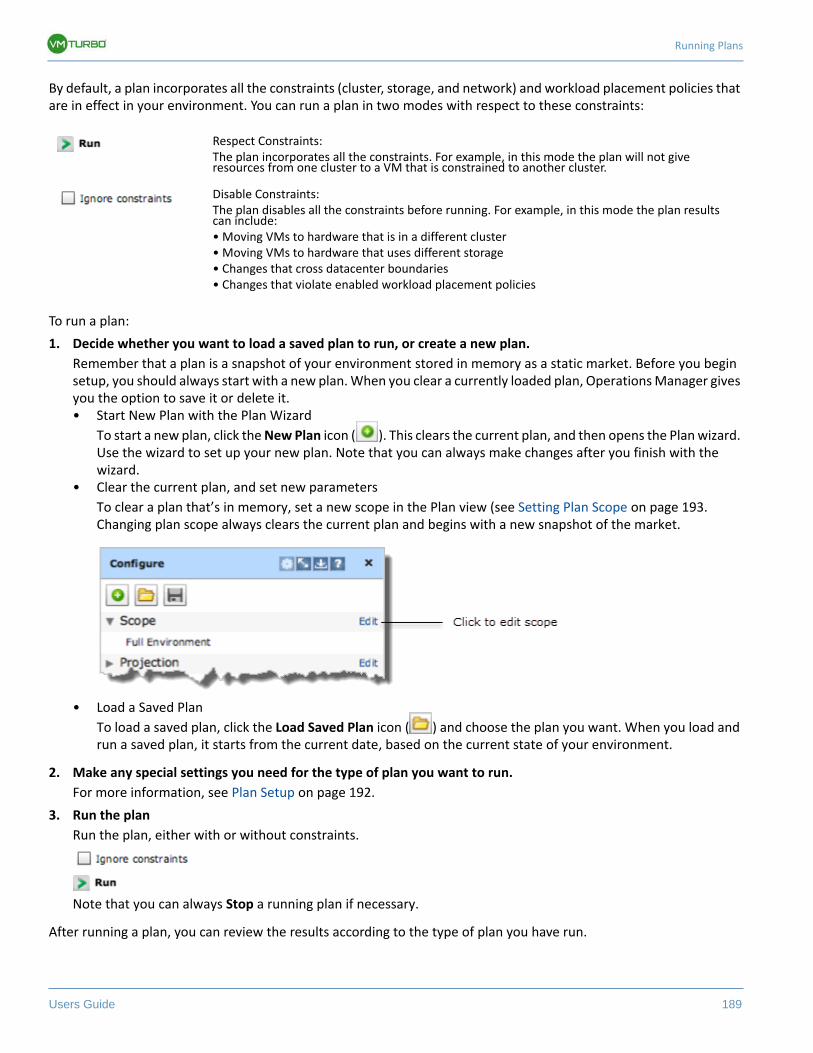
Running Plans
Users Guide 189
By default, a plan incorporates all the constraints (cluster, storage, and network) and workload placement policies that are in effect in your environment. You can run a plan in two modes with respect to these constraints:
To run a plan:
1. Decide whether you want to load a saved plan to run, or create a new plan.
Remember that a plan is a snapshot of your environment stored in memory as a static market. Before you begin setup, you should always start with a new plan. When you clear a currently loaded plan, Operations Manager gives you the option to save it or delete it.• Start New Plan with the Plan Wizard
To start a new plan, click the New Plan icon ( ). This clears the current plan, and then opens the Plan wizard. Use the wizard to set up your new plan. Note that you can always make changes after you finish with the wizard.
• Clear the current plan, and set new parameters
To clear a plan that’s in memory, set a new scope in the Plan view (see Setting Plan Scope on page 193. Changing plan scope always clears the current plan and begins with a new snapshot of the market.
• Load a Saved Plan
To load a saved plan, click the Load Saved Plan icon ( ) and choose the plan you want. When you load and run a saved plan, it starts from the current date, based on the current state of your environment.
2. Make any special settings you need for the type of plan you want to run.
For more information, see Plan Setup on page 192.
3. Run the plan
Run the plan, either with or without constraints.
Note that you can always Stop a running plan if necessary.
After running a plan, you can review the results according to the type of plan you have run.
Respect Constraints:The plan incorporates all the constraints. For example, in this mode the plan will not give resources from one cluster to a VM that is constrained to another cluster.
Disable Constraints:The plan disables all the constraints before running. For example, in this mode the plan results can include:• Moving VMs to hardware that is in a different cluster• Moving VMs to hardware that uses different storage• Changes that cross datacenter boundaries• Changes that violate enabled workload placement policies
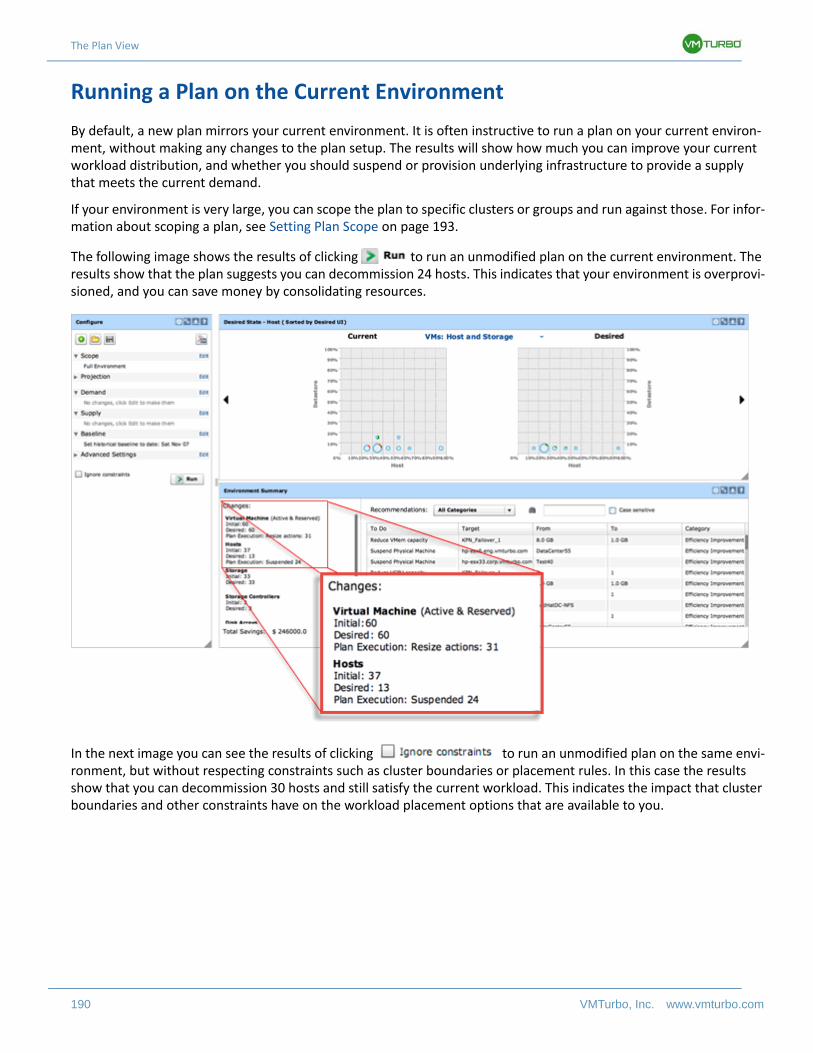
The Plan View
190 VMTurbo, Inc. www.vmturbo.com
Running a Plan on the Current Environment
By default, a new plan mirrors your current environment. It is often instructive to run a plan on your current environ-ment, without making any changes to the plan setup. The results will show how much you can improve your current workload distribution, and whether you should suspend or provision underlying infrastructure to provide a supply that meets the current demand.
If your environment is very large, you can scope the plan to specific clusters or groups and run against those. For infor-mation about scoping a plan, see Setting Plan Scope on page 193.
The following image shows the results of clicking to run an unmodified plan on the current environment. The results show that the plan suggests you can decommission 24 hosts. This indicates that your environment is overprovi-sioned, and you can save money by consolidating resources.
In the next image you can see the results of clicking to run an unmodified plan on the same envi-ronment, but without respecting constraints such as cluster boundaries or placement rules. In this case the results show that you can decommission 30 hosts and still satisfy the current workload. This indicates the impact that cluster boundaries and other constraints have on the workload placement options that are available to you.
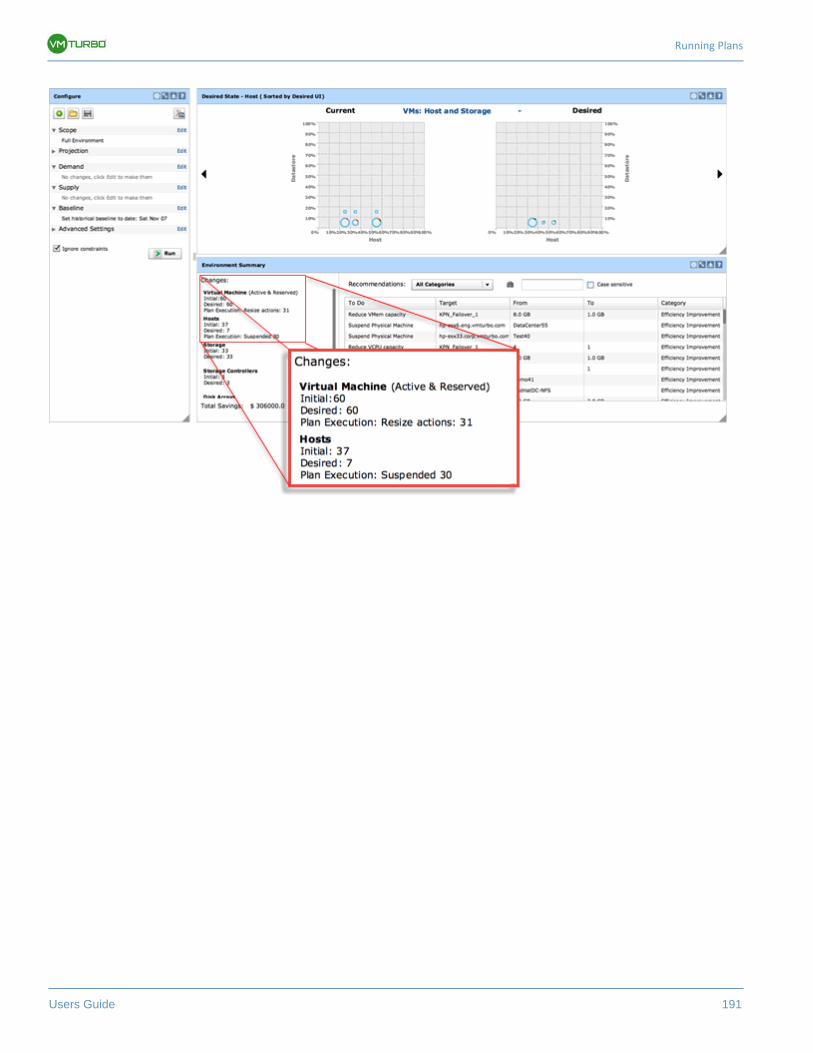
Running Plans
Users Guide 191
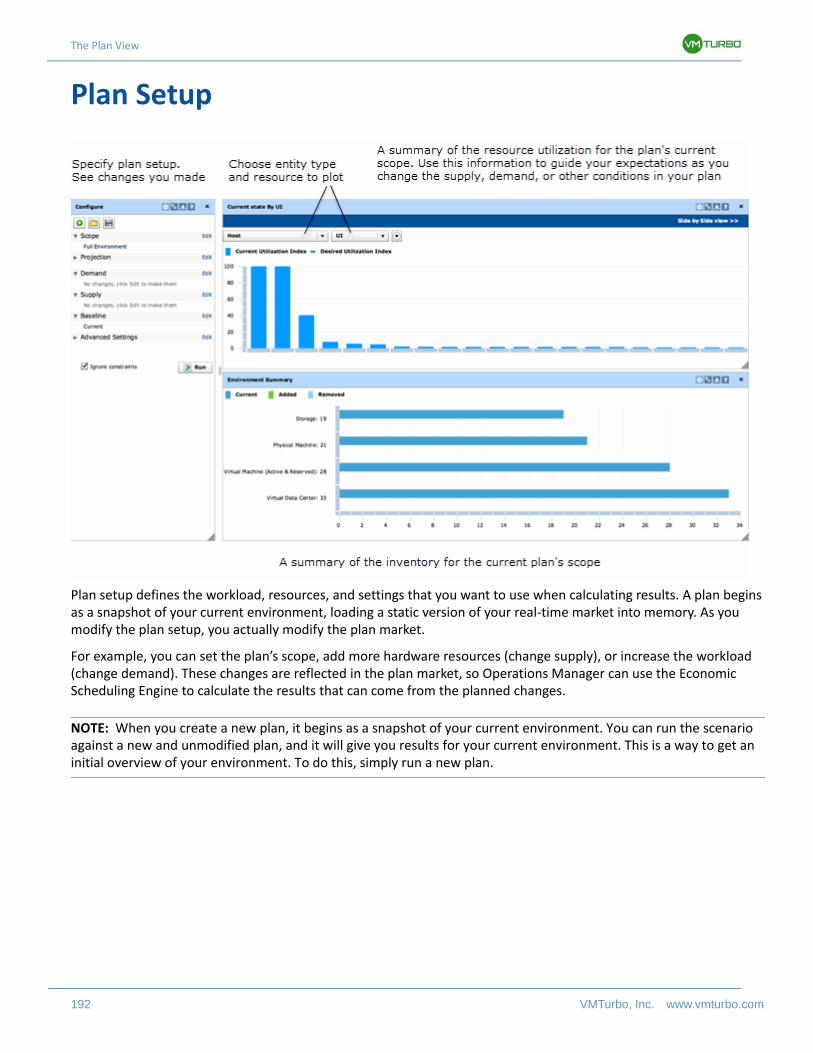
The Plan View
192 VMTurbo, Inc. www.vmturbo.com
Plan Setup
Plan setup defines the workload, resources, and settings that you want to use when calculating results. A plan begins as a snapshot of your current environment, loading a static version of your real-time market into memory. As you modify the plan setup, you actually modify the plan market.
For example, you can set the plan’s scope, add more hardware resources (change supply), or increase the workload (change demand). These changes are reflected in the plan market, so Operations Manager can use the Economic Scheduling Engine to calculate the results that can come from the planned changes.
NOTE: When you create a new plan, it begins as a snapshot of your current environment. You can run the scenario against a new and unmodified plan, and it will give you results for your current environment. This is a way to get an initial overview of your environment. To do this, simply run a new plan.
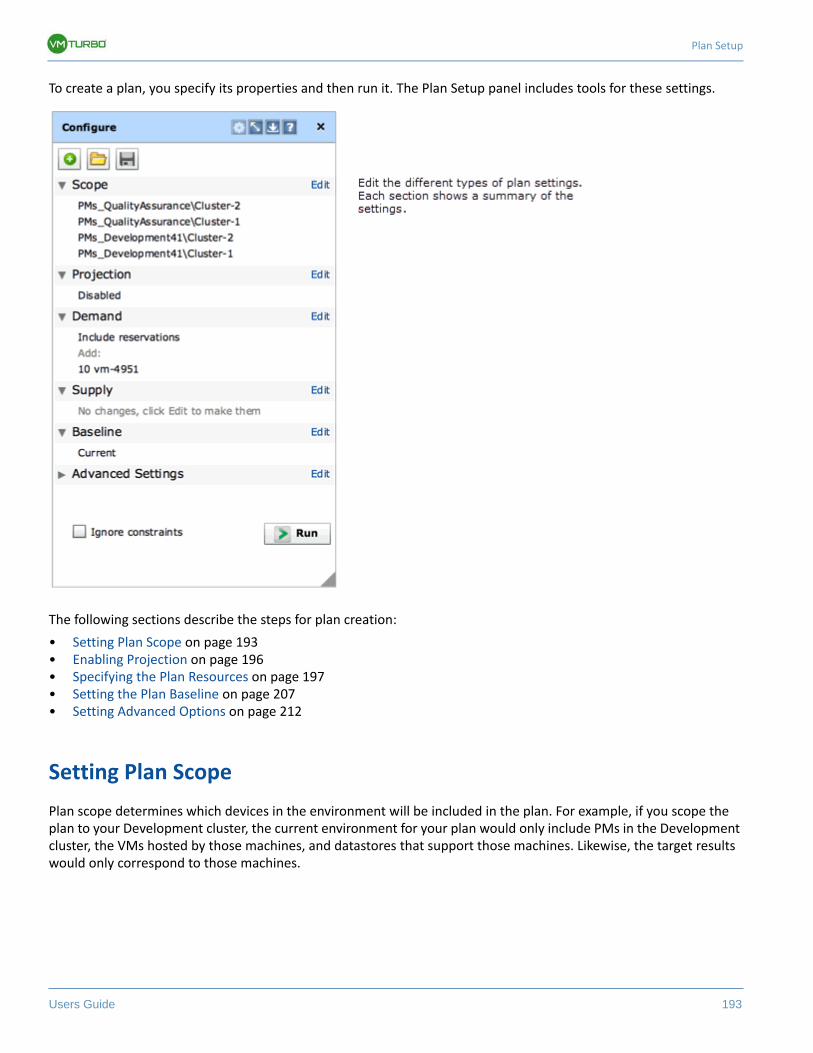
Plan Setup
Users Guide 193
To create a plan, you specify its properties and then run it. The Plan Setup panel includes tools for these settings.
The following sections describe the steps for plan creation:
• Setting Plan Scope on page 193• Enabling Projection on page 196• Specifying the Plan Resources on page 197• Setting the Plan Baseline on page 207• Setting Advanced Options on page 212
Setting Plan Scope
Plan scope determines which devices in the environment will be included in the plan. For example, if you scope the plan to your Development cluster, the current environment for your plan would only include PMs in the Development cluster, the VMs hosted by those machines, and datastores that support those machines. Likewise, the target results would only correspond to those machines.
The Plan View
194 VMTurbo, Inc. www.vmturbo.com
Note that you can only set scope to a new plan. If you have a defined plan resident in memory, setting scope opens the Save Plan dialog box where you can choose to cancel, save the current plan, or discard the current plan before you start the new plan. Changing scope requires that you start a new plan after:
• You have opened a saved plan• You have run a plan• You have made any changes in Plan Setup
The plan determines scope differently, depending on the type of entity you base it on:
• Scope by VM
Limits the plan to the physical hosts that those VMs are able to run on. Likewise, the plan includes all the datastores that are available to the VMs in your scope.
• Scope by PM
Limits the plan to those physical hosts. For datastores, Operations Manager identifies all the VMs that can run on the hosts in your scope, and identifies all the datastores that are available for those VMs.
• Scope by Storage
The plan includes the VMs that can run on those datastores, and the physical hosts that those VMs are able to run on.
• Scope by Provider Virtual Datacenter
Limits the plan to the VMs on the virtual datacenters — For those VMs, the scope operates similarly to scope by VM.
NOTE: When setting scope for a plan, you can choose multiple groups. However, you should be sure to choose groups of the same type. For example, you should not scope by PM and VM groups for the same plan.
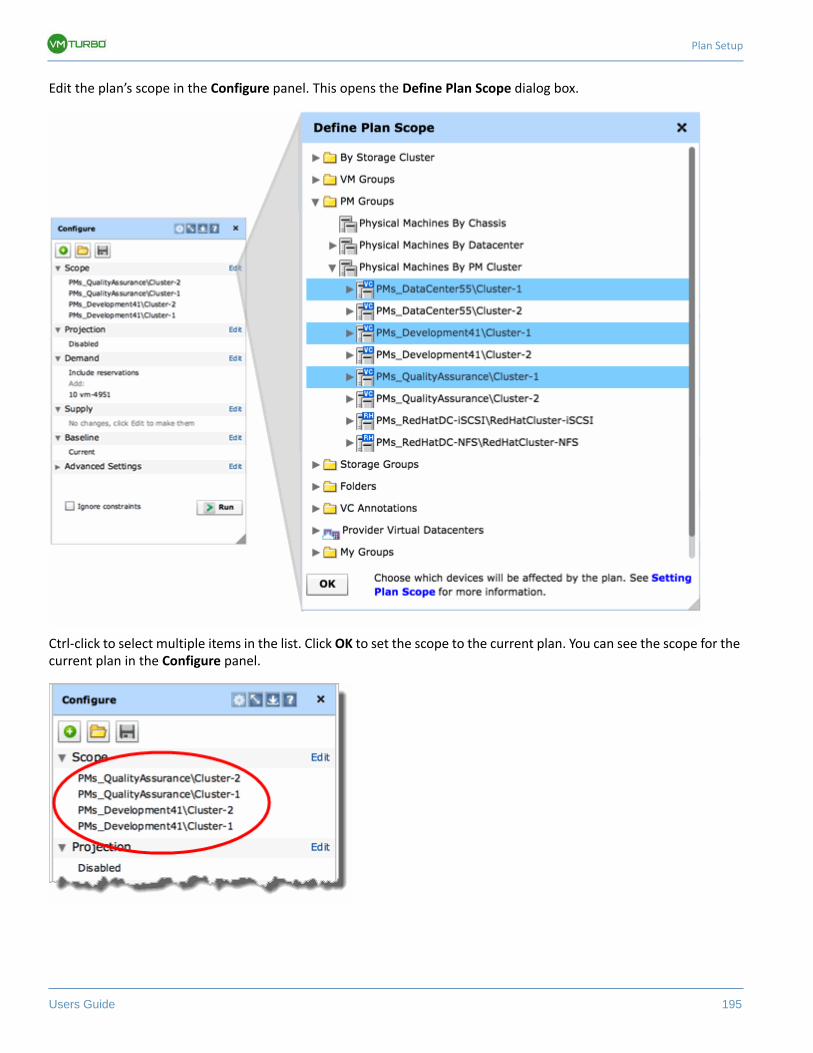
Plan Setup
Users Guide 195
Edit the plan’s scope in the Configure panel. This opens the Define Plan Scope dialog box.
Ctrl-click to select multiple items in the list. Click OK to set the scope to the current plan. You can see the scope for the current plan in the Configure panel.
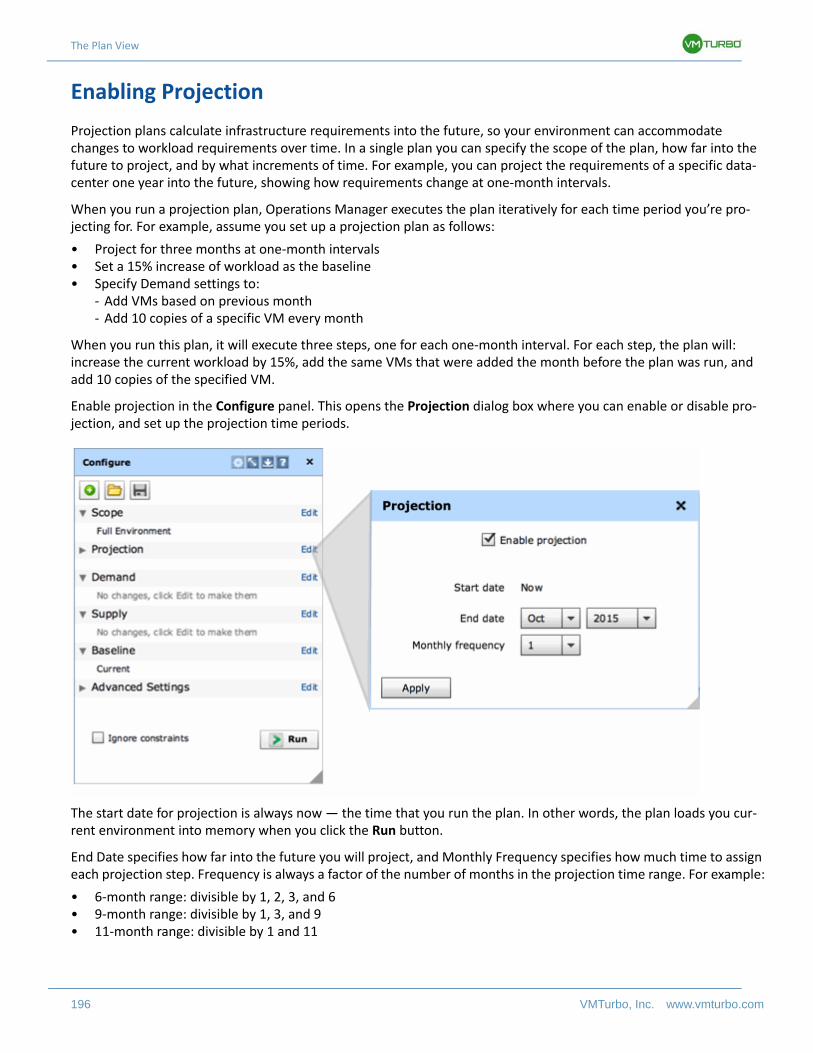
The Plan View
196 VMTurbo, Inc. www.vmturbo.com
Enabling Projection
Projection plans calculate infrastructure requirements into the future, so your environment can accommodate changes to workload requirements over time. In a single plan you can specify the scope of the plan, how far into the future to project, and by what increments of time. For example, you can project the requirements of a specific data-center one year into the future, showing how requirements change at one-month intervals.
When you run a projection plan, Operations Manager executes the plan iteratively for each time period you’re pro-jecting for. For example, assume you set up a projection plan as follows:
• Project for three months at one-month intervals• Set a 15% increase of workload as the baseline• Specify Demand settings to:
- Add VMs based on previous month- Add 10 copies of a specific VM every month
When you run this plan, it will execute three steps, one for each one-month interval. For each step, the plan will: increase the current workload by 15%, add the same VMs that were added the month before the plan was run, and add 10 copies of the specified VM.
Enable projection in the Configure panel. This opens the Projection dialog box where you can enable or disable pro-jection, and set up the projection time periods.
The start date for projection is always now — the time that you run the plan. In other words, the plan loads you cur-rent environment into memory when you click the Run button.
End Date specifies how far into the future you will project, and Monthly Frequency specifies how much time to assign each projection step. Frequency is always a factor of the number of months in the projection time range. For example:
• 6-month range: divisible by 1, 2, 3, and 6• 9-month range: divisible by 1, 3, and 9• 11-month range: divisible by 1 and 11
Plan Setup
Users Guide 197
Specifying the Plan Resources
The plan workload is determined by the set of VMs that are deployed in your environment, compared to the PMs and datastores that provide resources to them. In other words, plan workload is determined by the plan’s supply and demand.
The more VMs you have for a given number of PMs and datastores, the greater the load will be on these physical devices. With a plan you can add or remove VMs to change the demand. You can also add or remove PMs and data-stores to change the supply. Then you can run the plan to see what the results would be.
For example, you can define a plan that adds VMs to the same set of PMs and datastores. Or you can upgrade your physical hosts so they have more CPU or memory resources, and see how that would affect the way your environment supports the current crop of VMs.
To set the plan’s workload, modify the plan’s Demand or Supply. For more information, see:
• Demand on page 198• Supply on page 204• Creating Templates on page 205
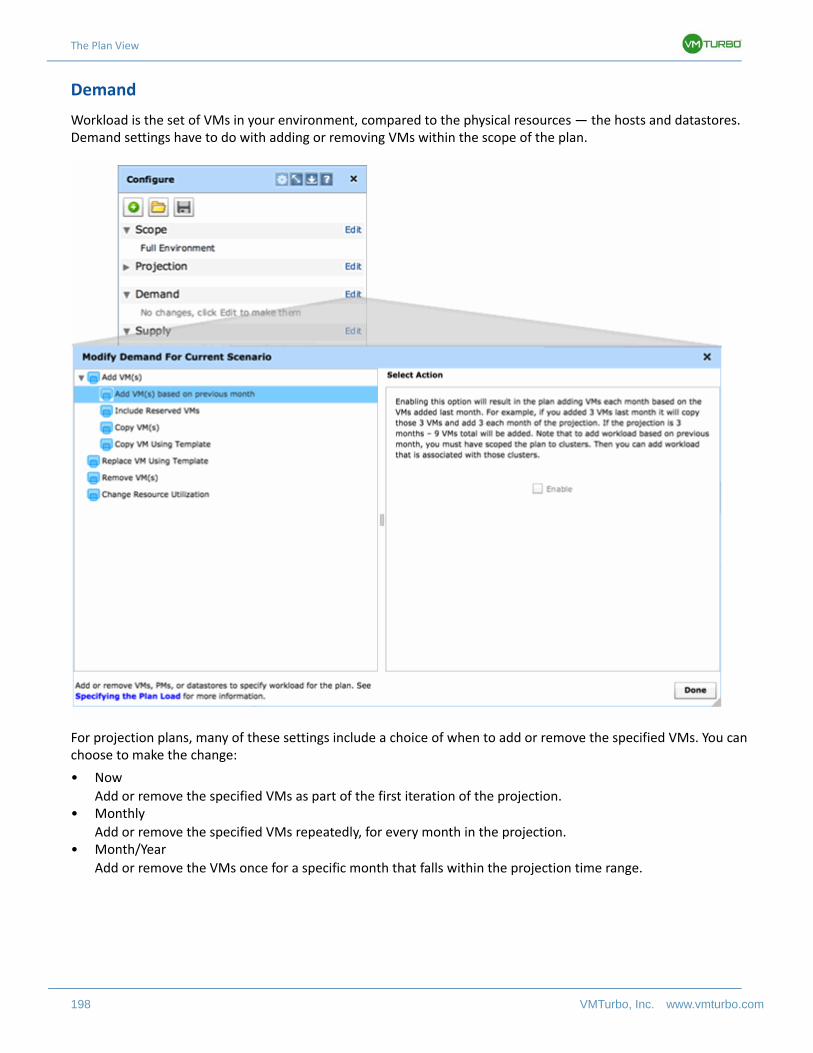
The Plan View
198 VMTurbo, Inc. www.vmturbo.com
Demand
Workload is the set of VMs in your environment, compared to the physical resources — the hosts and datastores. Demand settings have to do with adding or removing VMs within the scope of the plan.
For projection plans, many of these settings include a choice of when to add or remove the specified VMs. You can choose to make the change:
• Now
Add or remove the specified VMs as part of the first iteration of the projection.• Monthly
Add or remove the specified VMs repeatedly, for every month in the projection.• Month/Year
Add or remove the VMs once for a specific month that falls within the projection time range.
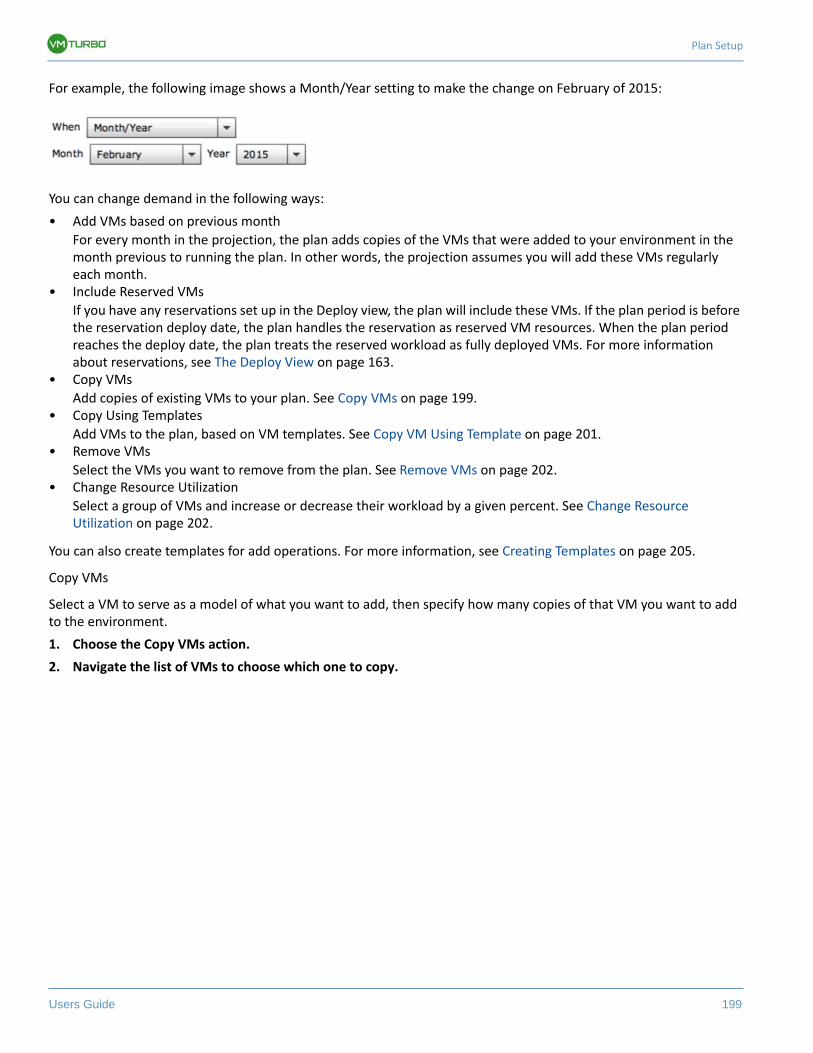
Plan Setup
Users Guide 199
For example, the following image shows a Month/Year setting to make the change on February of 2015:
You can change demand in the following ways:
• Add VMs based on previous month
For every month in the projection, the plan adds copies of the VMs that were added to your environment in the month previous to running the plan. In other words, the projection assumes you will add these VMs regularly each month.
• Include Reserved VMs
If you have any reservations set up in the Deploy view, the plan will include these VMs. If the plan period is before the reservation deploy date, the plan handles the reservation as reserved VM resources. When the plan period reaches the deploy date, the plan treats the reserved workload as fully deployed VMs. For more information about reservations, see The Deploy View on page 163.
• Copy VMs
Add copies of existing VMs to your plan. See Copy VMs on page 199.• Copy Using Templates
Add VMs to the plan, based on VM templates. See Copy VM Using Template on page 201.• Remove VMs
Select the VMs you want to remove from the plan. See Remove VMs on page 202.• Change Resource Utilization
Select a group of VMs and increase or decrease their workload by a given percent. See Change Resource Utilization on page 202.
You can also create templates for add operations. For more information, see Creating Templates on page 205.
Copy VMs
Select a VM to serve as a model of what you want to add, then specify how many copies of that VM you want to add to the environment.
1. Choose the Copy VMs action.
2. Navigate the list of VMs to choose which one to copy.
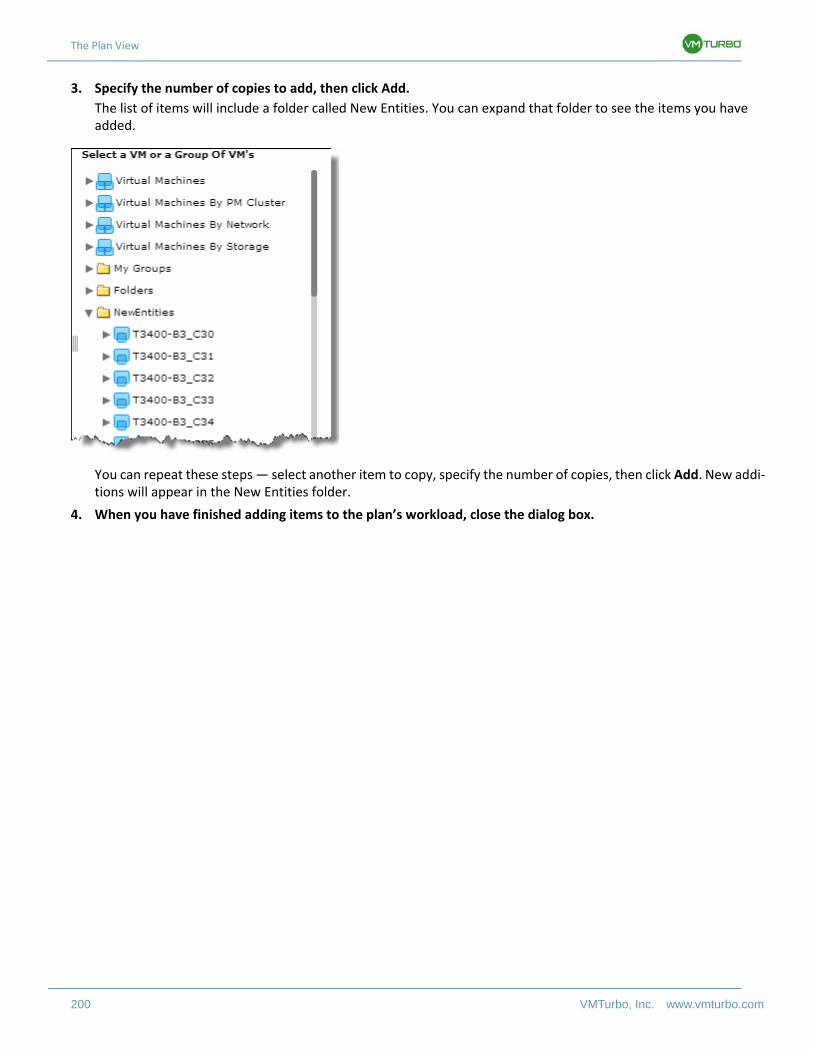
The Plan View
200 VMTurbo, Inc. www.vmturbo.com
3. Specify the number of copies to add, then click Add.
The list of items will include a folder called New Entities. You can expand that folder to see the items you have added.
You can repeat these steps — select another item to copy, specify the number of copies, then click Add. New addi-tions will appear in the New Entities folder.
4. When you have finished adding items to the plan’s workload, close the dialog box.
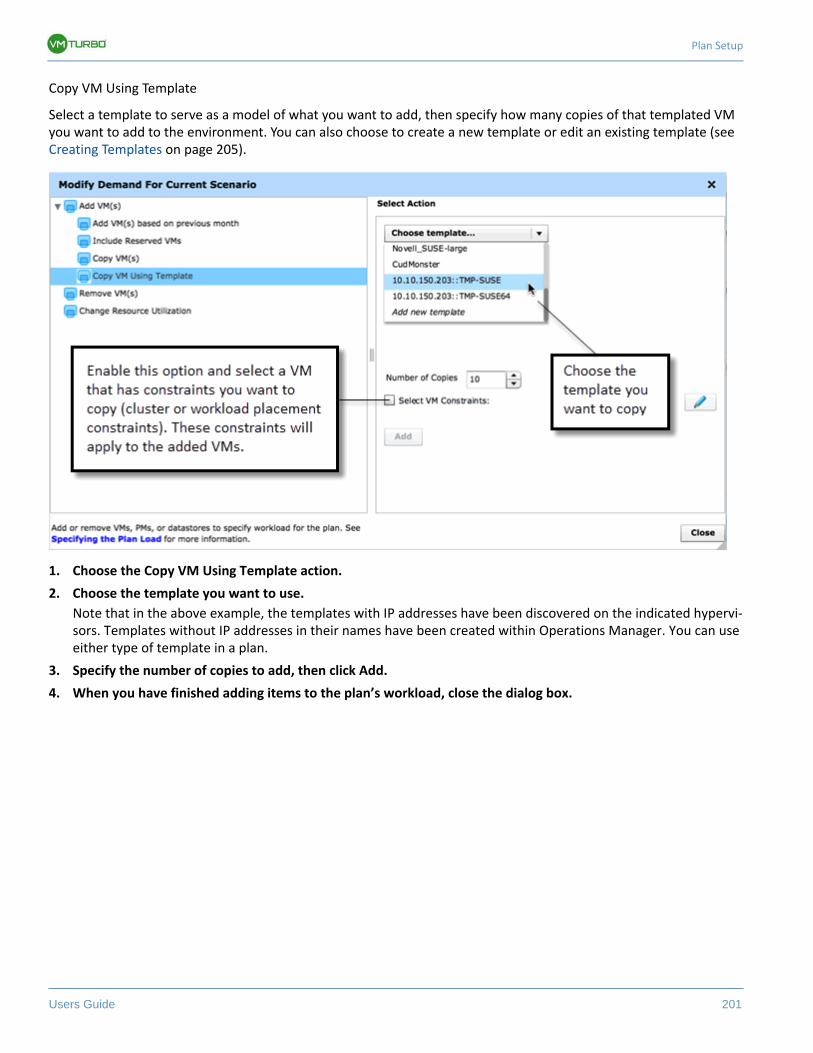
Plan Setup
Users Guide 201
Copy VM Using Template
Select a template to serve as a model of what you want to add, then specify how many copies of that templated VM you want to add to the environment. You can also choose to create a new template or edit an existing template (see Creating Templates on page 205).
1. Choose the Copy VM Using Template action.
2. Choose the template you want to use.
Note that in the above example, the templates with IP addresses have been discovered on the indicated hypervi-sors. Templates without IP addresses in their names have been created within Operations Manager. You can use either type of template in a plan.
3. Specify the number of copies to add, then click Add.
4. When you have finished adding items to the plan’s workload, close the dialog box.
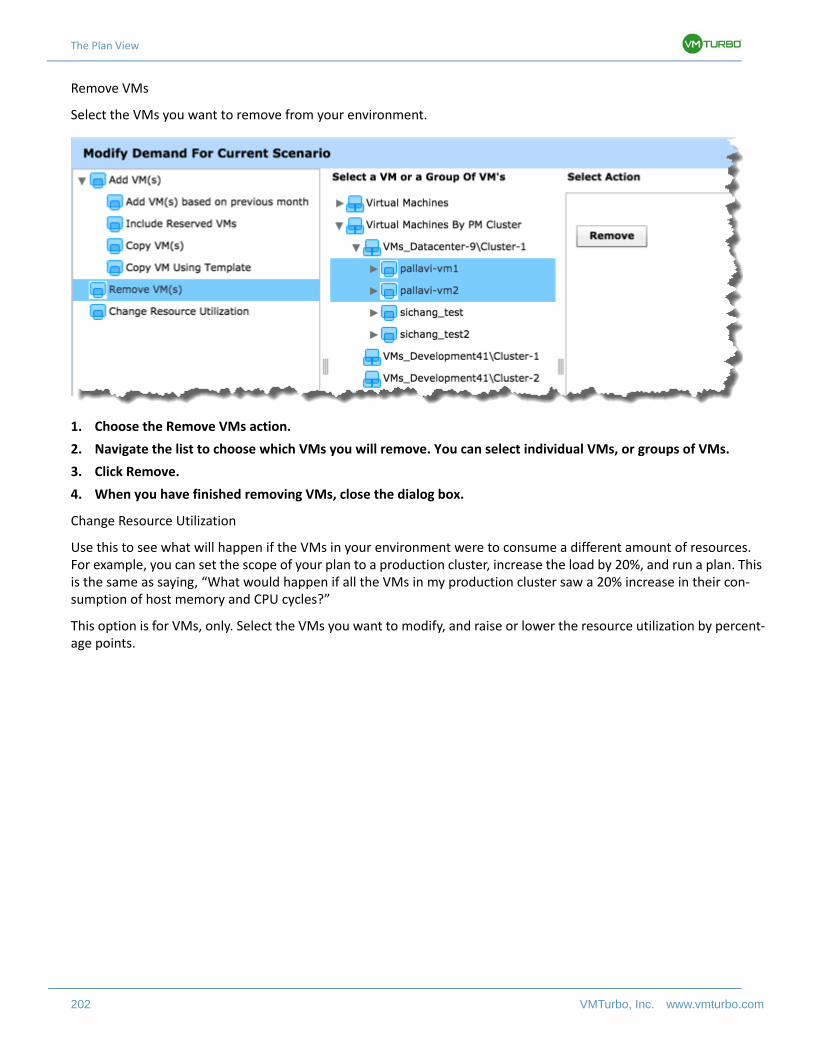
The Plan View
202 VMTurbo, Inc. www.vmturbo.com
Remove VMs
Select the VMs you want to remove from your environment.
1. Choose the Remove VMs action.
2. Navigate the list to choose which VMs you will remove. You can select individual VMs, or groups of VMs.
3. Click Remove.
4. When you have finished removing VMs, close the dialog box.
Change Resource Utilization
Use this to see what will happen if the VMs in your environment were to consume a different amount of resources. For example, you can set the scope of your plan to a production cluster, increase the load by 20%, and run a plan. This is the same as saying, “What would happen if all the VMs in my production cluster saw a 20% increase in their con-sumption of host memory and CPU cycles?”
This option is for VMs, only. Select the VMs you want to modify, and raise or lower the resource utilization by percent-age points.
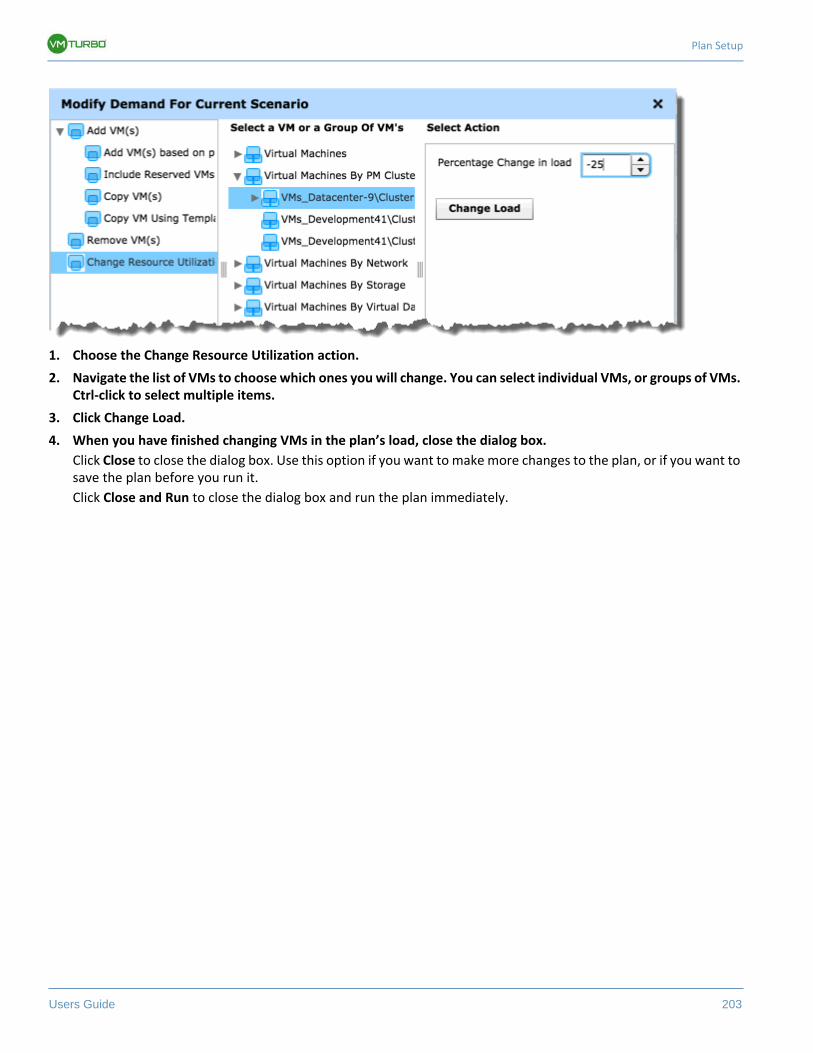
Plan Setup
Users Guide 203
1. Choose the Change Resource Utilization action.
2. Navigate the list of VMs to choose which ones you will change. You can select individual VMs, or groups of VMs. Ctrl-click to select multiple items.
3. Click Change Load.
4. When you have finished changing VMs in the plan’s load, close the dialog box.
Click Close to close the dialog box. Use this option if you want to make more changes to the plan, or if you want to save the plan before you run it.
Click Close and Run to close the dialog box and run the plan immediately.
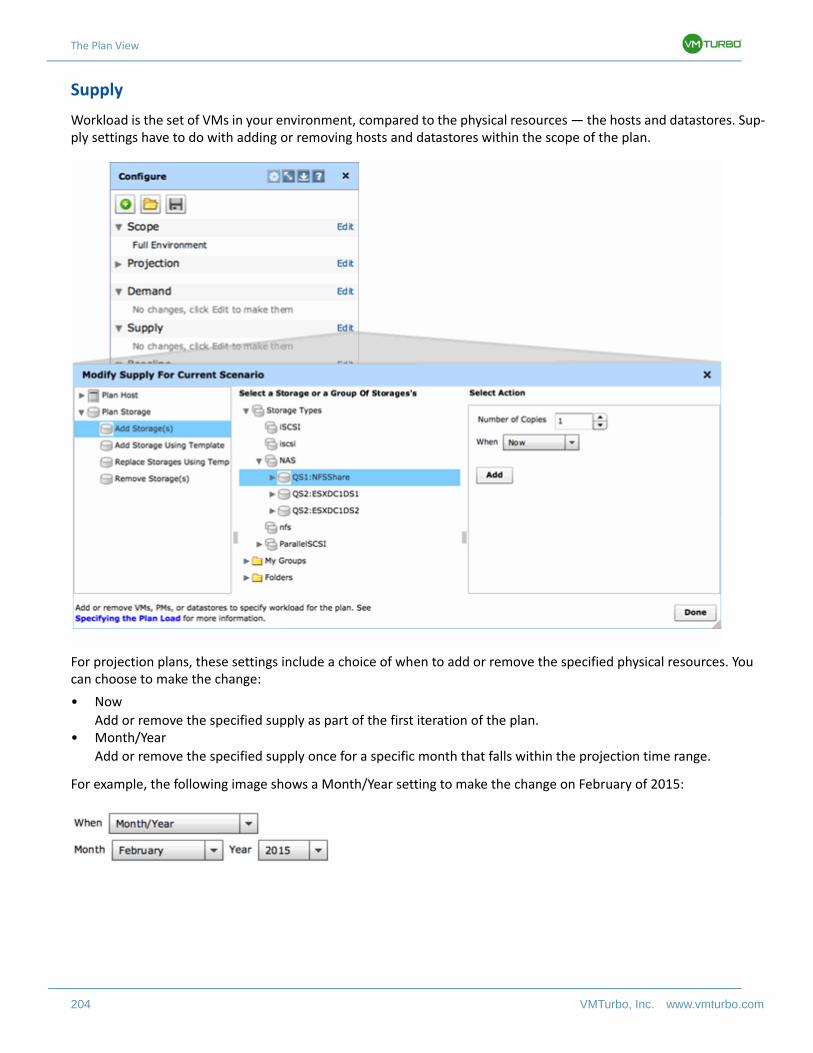
The Plan View
204 VMTurbo, Inc. www.vmturbo.com
Supply
Workload is the set of VMs in your environment, compared to the physical resources — the hosts and datastores. Sup-ply settings have to do with adding or removing hosts and datastores within the scope of the plan.
For projection plans, these settings include a choice of when to add or remove the specified physical resources. You can choose to make the change:
• Now
Add or remove the specified supply as part of the first iteration of the plan.• Month/Year
Add or remove the specified supply once for a specific month that falls within the projection time range.
For example, the following image shows a Month/Year setting to make the change on February of 2015:
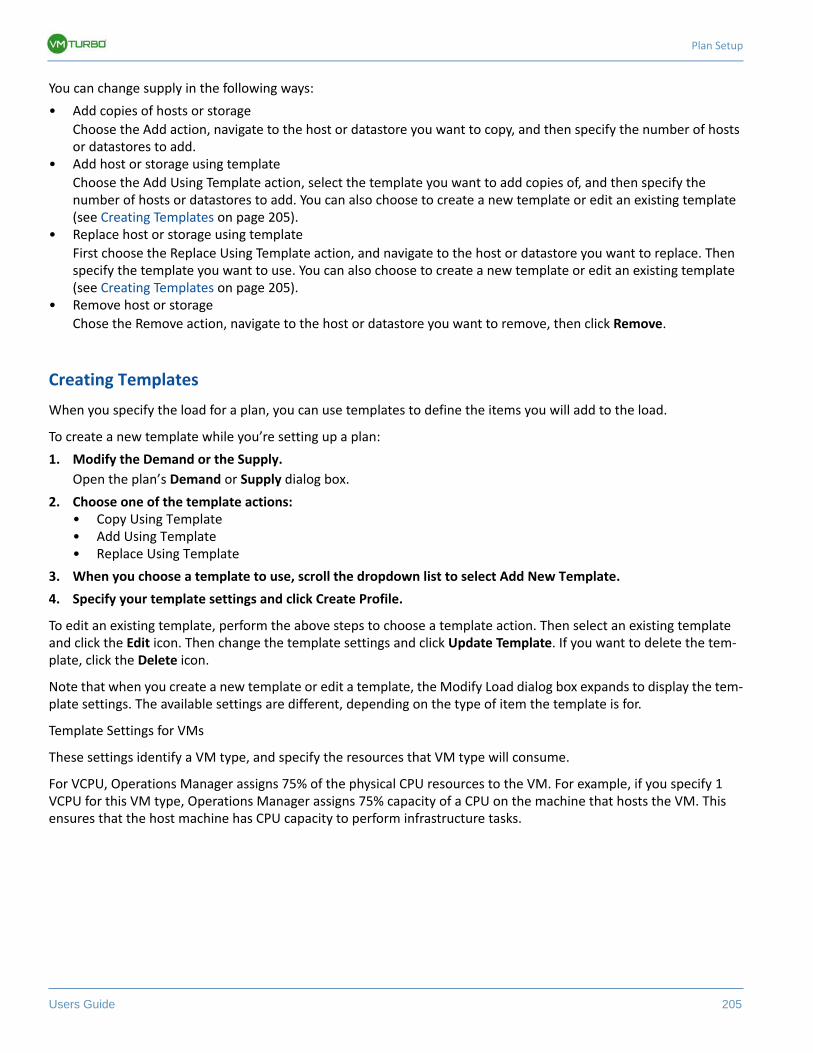
Plan Setup
Users Guide 205
You can change supply in the following ways:
• Add copies of hosts or storage
Choose the Add action, navigate to the host or datastore you want to copy, and then specify the number of hosts or datastores to add.
• Add host or storage using template
Choose the Add Using Template action, select the template you want to add copies of, and then specify the number of hosts or datastores to add. You can also choose to create a new template or edit an existing template (see Creating Templates on page 205).
• Replace host or storage using template
First choose the Replace Using Template action, and navigate to the host or datastore you want to replace. Then specify the template you want to use. You can also choose to create a new template or edit an existing template (see Creating Templates on page 205).
• Remove host or storage
Chose the Remove action, navigate to the host or datastore you want to remove, then click Remove.
Creating Templates
When you specify the load for a plan, you can use templates to define the items you will add to the load.
To create a new template while you’re setting up a plan:
1. Modify the Demand or the Supply.
Open the plan’s Demand or Supply dialog box.
2. Choose one of the template actions:• Copy Using Template• Add Using Template• Replace Using Template
3. When you choose a template to use, scroll the dropdown list to select Add New Template.
4. Specify your template settings and click Create Profile.
To edit an existing template, perform the above steps to choose a template action. Then select an existing template and click the Edit icon. Then change the template settings and click Update Template. If you want to delete the tem-plate, click the Delete icon.
Note that when you create a new template or edit a template, the Modify Load dialog box expands to display the tem-plate settings. The available settings are different, depending on the type of item the template is for.
Template Settings for VMs
These settings identify a VM type, and specify the resources that VM type will consume.
For VCPU, Operations Manager assigns 75% of the physical CPU resources to the VM. For example, if you specify 1 VCPU for this VM type, Operations Manager assigns 75% capacity of a CPU on the machine that hosts the VM. This ensures that the host machine has CPU capacity to perform infrastructure tasks.
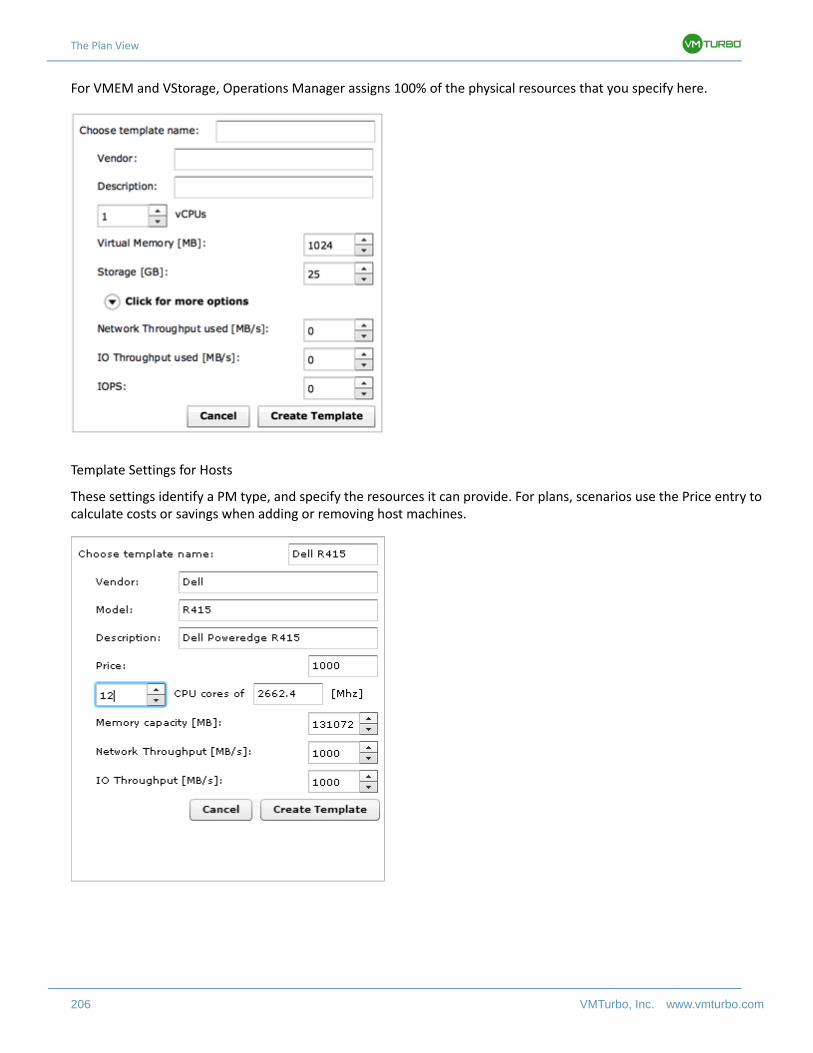
The Plan View
206 VMTurbo, Inc. www.vmturbo.com
For VMEM and VStorage, Operations Manager assigns 100% of the physical resources that you specify here.
Template Settings for Hosts
These settings identify a PM type, and specify the resources it can provide. For plans, scenarios use the Price entry to calculate costs or savings when adding or removing host machines.
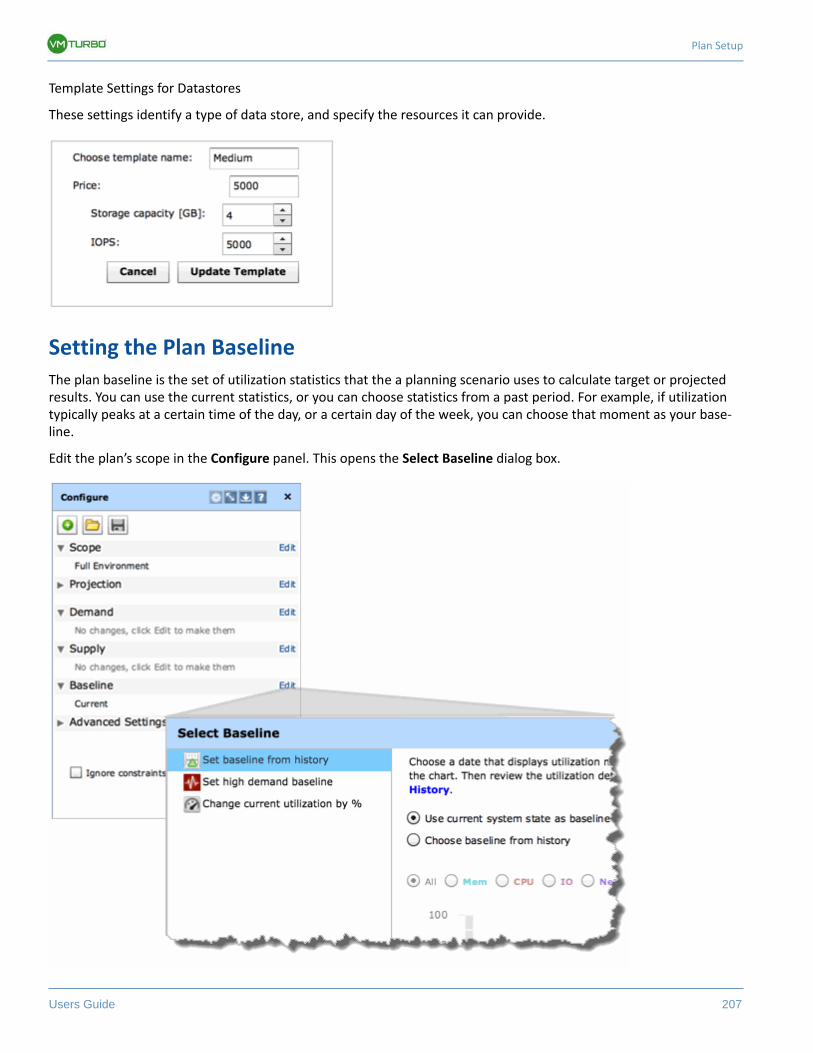
Plan Setup
Users Guide 207
Template Settings for Datastores
These settings identify a type of data store, and specify the resources it can provide.
Setting the Plan BaselineThe plan baseline is the set of utilization statistics that the a planning scenario uses to calculate target or projected results. You can use the current statistics, or you can choose statistics from a past period. For example, if utilization typically peaks at a certain time of the day, or a certain day of the week, you can choose that moment as your base-line.
Edit the plan’s scope in the Configure panel. This opens the Select Baseline dialog box.
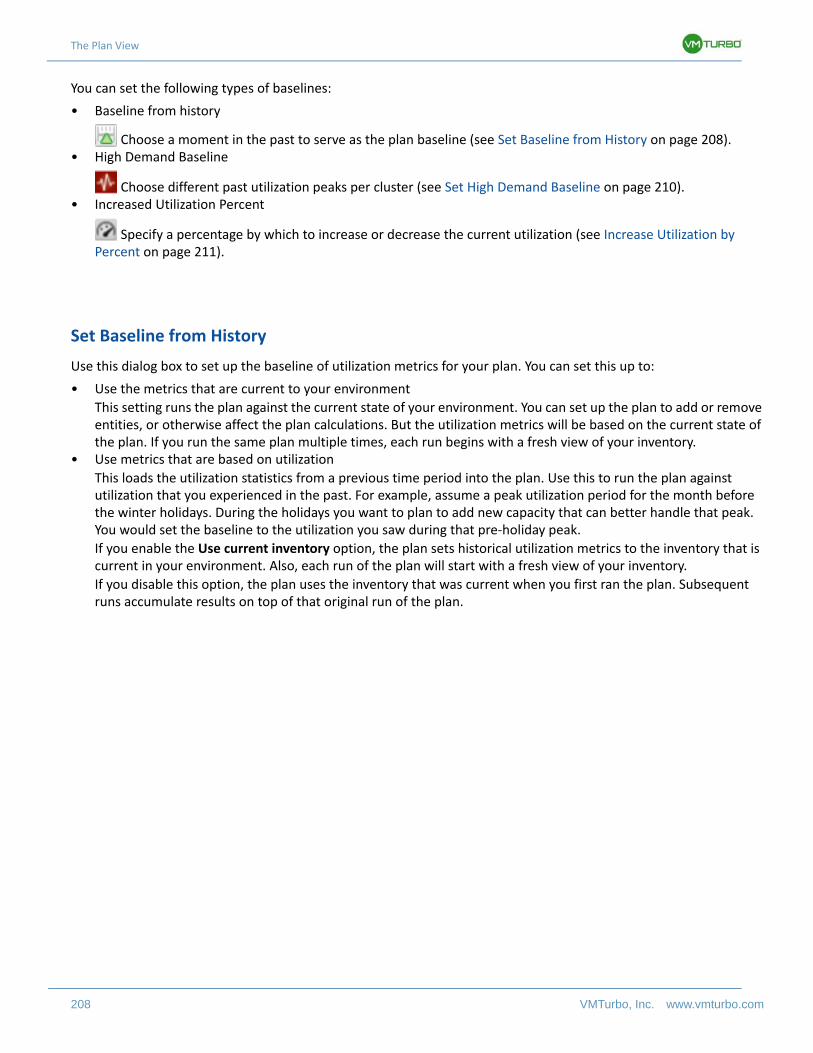
The Plan View
208 VMTurbo, Inc. www.vmturbo.com
You can set the following types of baselines:
• Baseline from history
Choose a moment in the past to serve as the plan baseline (see Set Baseline from History on page 208).• High Demand Baseline
Choose different past utilization peaks per cluster (see Set High Demand Baseline on page 210).• Increased Utilization Percent
Specify a percentage by which to increase or decrease the current utilization (see Increase Utilization by Percent on page 211).
Set Baseline from History
Use this dialog box to set up the baseline of utilization metrics for your plan. You can set this up to:
• Use the metrics that are current to your environment
This setting runs the plan against the current state of your environment. You can set up the plan to add or remove entities, or otherwise affect the plan calculations. But the utilization metrics will be based on the current state of the plan. If you run the same plan multiple times, each run begins with a fresh view of your inventory.
• Use metrics that are based on utilization
This loads the utilization statistics from a previous time period into the plan. Use this to run the plan against utilization that you experienced in the past. For example, assume a peak utilization period for the month before the winter holidays. During the holidays you want to plan to add new capacity that can better handle that peak. You would set the baseline to the utilization you saw during that pre-holiday peak.
If you enable the Use current inventory option, the plan sets historical utilization metrics to the inventory that is current in your environment. Also, each run of the plan will start with a fresh view of your inventory.
If you disable this option, the plan uses the inventory that was current when you first ran the plan. Subsequent runs accumulate results on top of that original run of the plan.
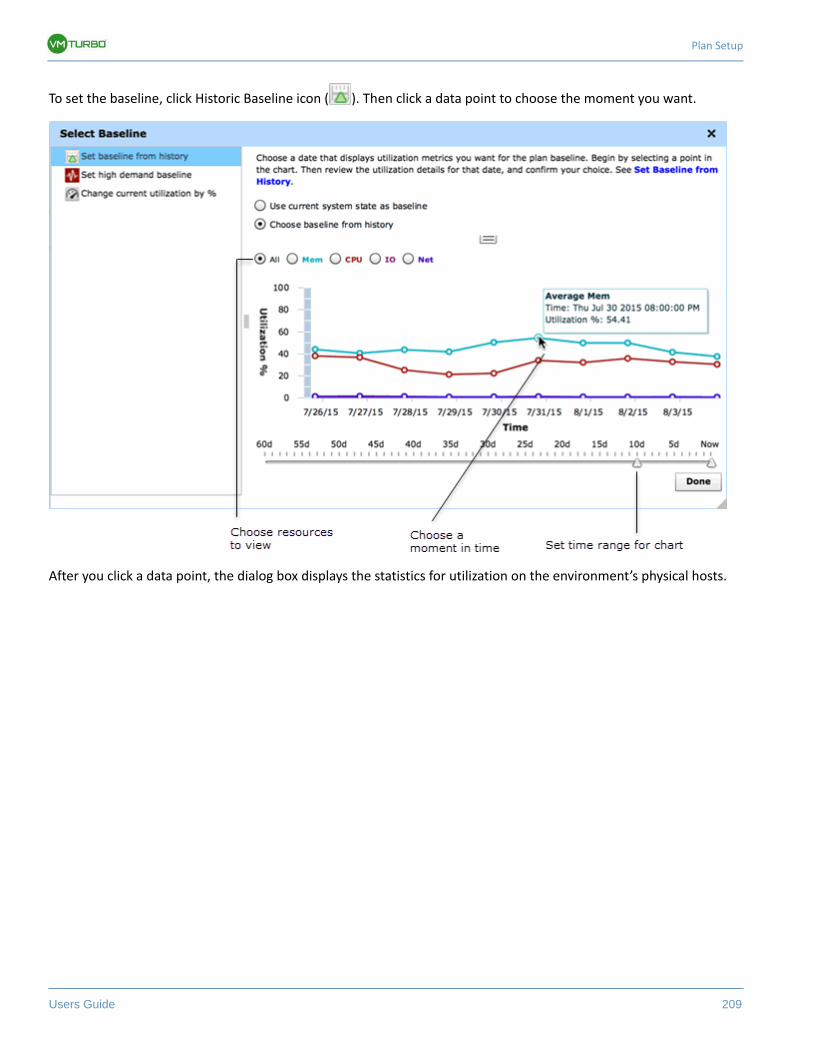
Plan Setup
Users Guide 209
To set the baseline, click Historic Baseline icon ( ). Then click a data point to choose the moment you want.
After you click a data point, the dialog box displays the statistics for utilization on the environment’s physical hosts.
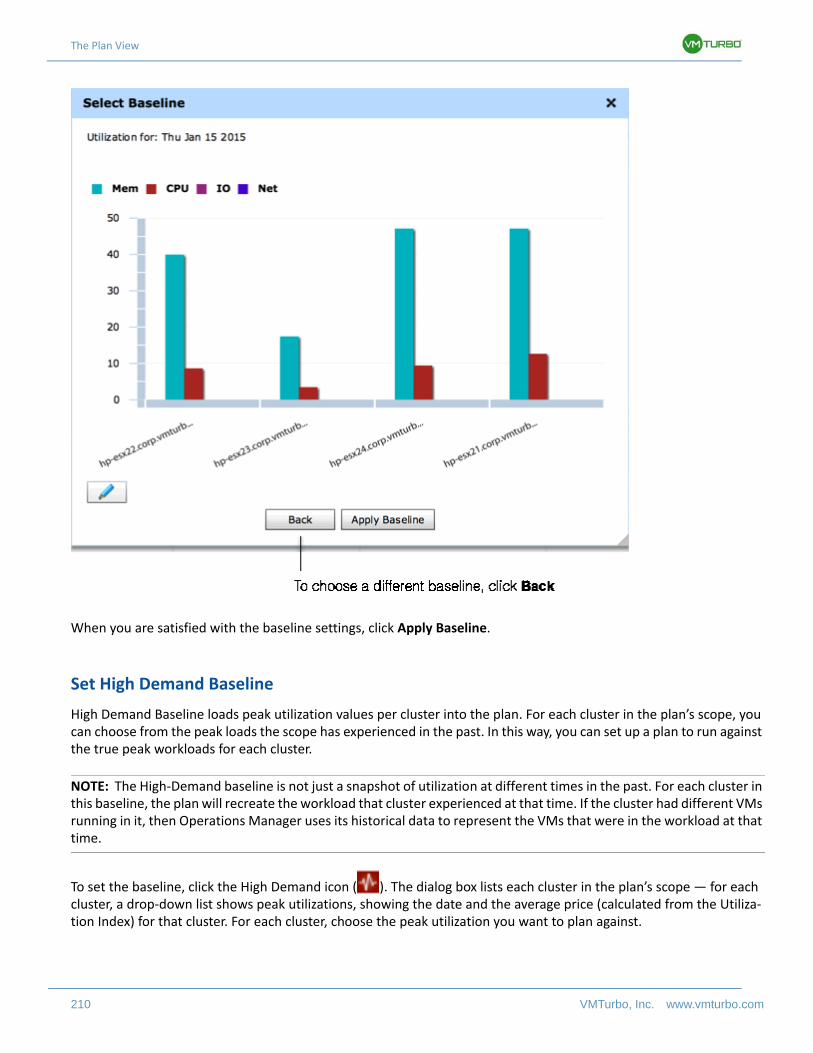
The Plan View
210 VMTurbo, Inc. www.vmturbo.com
When you are satisfied with the baseline settings, click Apply Baseline.
Set High Demand Baseline
High Demand Baseline loads peak utilization values per cluster into the plan. For each cluster in the plan’s scope, you can choose from the peak loads the scope has experienced in the past. In this way, you can set up a plan to run against the true peak workloads for each cluster.
NOTE: The High-Demand baseline is not just a snapshot of utilization at different times in the past. For each cluster in this baseline, the plan will recreate the workload that cluster experienced at that time. If the cluster had different VMs running in it, then Operations Manager uses its historical data to represent the VMs that were in the workload at that time.
To set the baseline, click the High Demand icon ( ). The dialog box lists each cluster in the plan’s scope — for each cluster, a drop-down list shows peak utilizations, showing the date and the average price (calculated from the Utiliza-tion Index) for that cluster. For each cluster, choose the peak utilization you want to plan against.
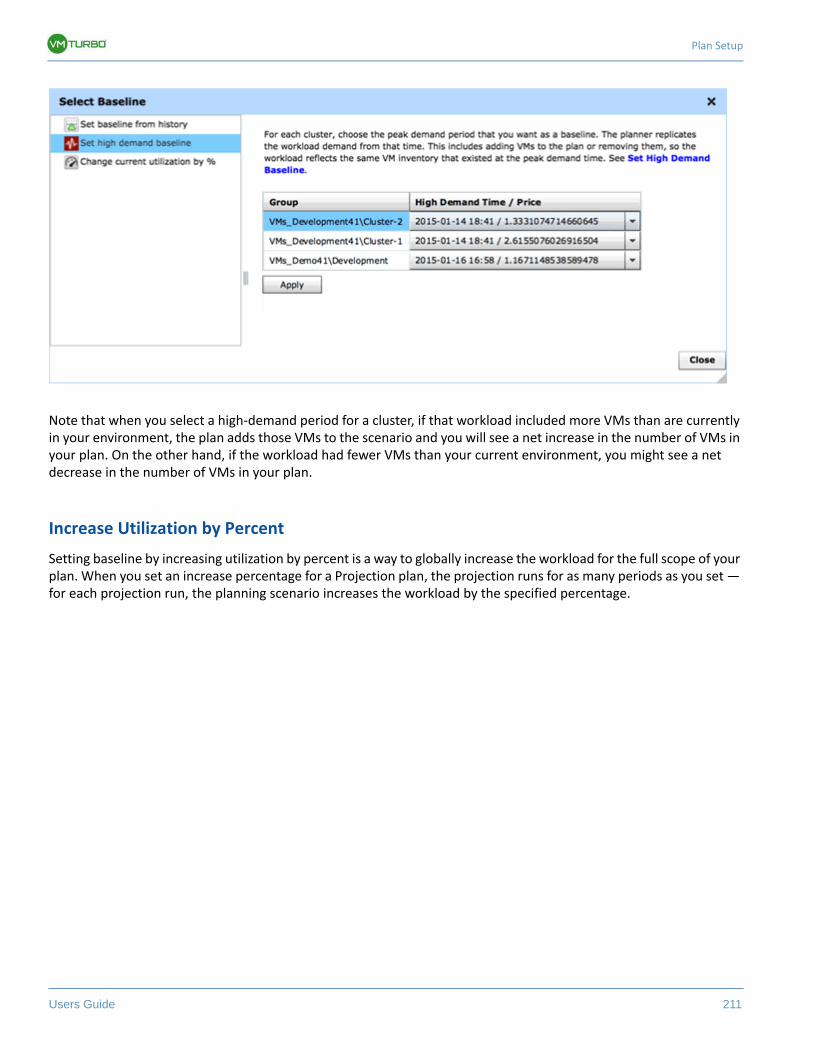
Plan Setup
Users Guide 211
Note that when you select a high-demand period for a cluster, if that workload included more VMs than are currently in your environment, the plan adds those VMs to the scenario and you will see a net increase in the number of VMs in your plan. On the other hand, if the workload had fewer VMs than your current environment, you might see a net decrease in the number of VMs in your plan.
Increase Utilization by Percent
Setting baseline by increasing utilization by percent is a way to globally increase the workload for the full scope of your plan. When you set an increase percentage for a Projection plan, the projection runs for as many periods as you set — for each projection run, the planning scenario increases the workload by the specified percentage.
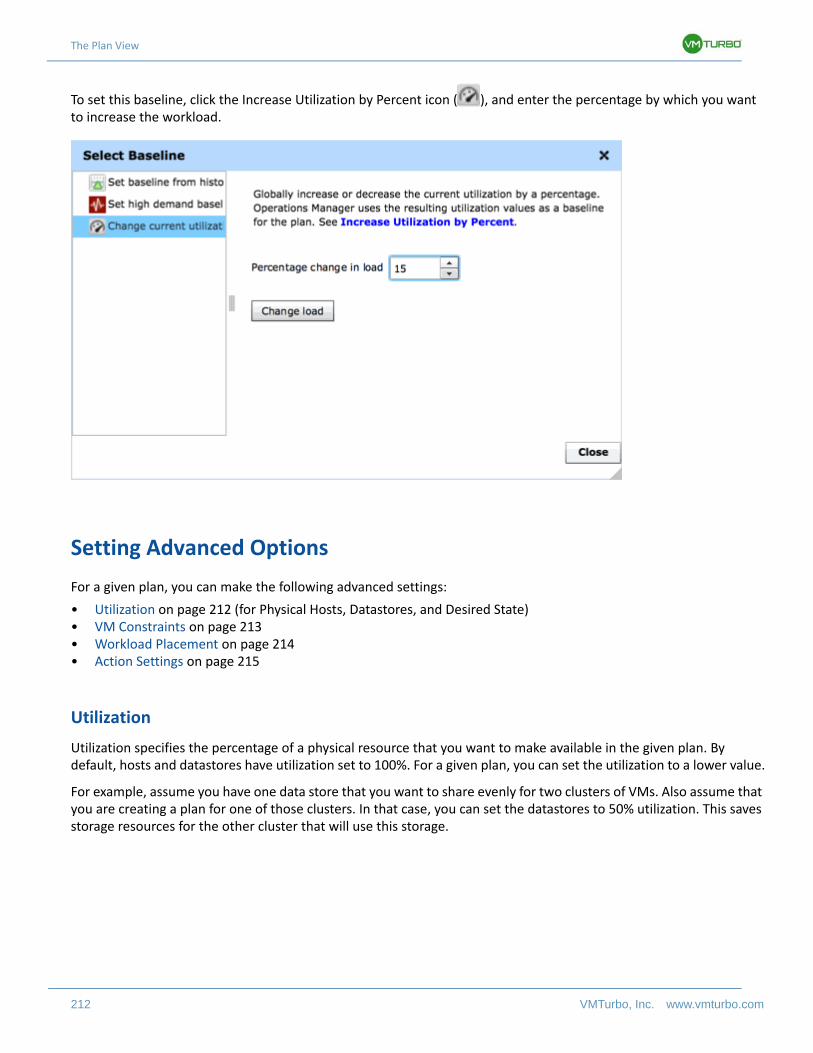
The Plan View
212 VMTurbo, Inc. www.vmturbo.com
To set this baseline, click the Increase Utilization by Percent icon ( ), and enter the percentage by which you want to increase the workload.
Setting Advanced Options
For a given plan, you can make the following advanced settings:
• Utilization on page 212 (for Physical Hosts, Datastores, and Desired State)• VM Constraints on page 213• Workload Placement on page 214• Action Settings on page 215
Utilization
Utilization specifies the percentage of a physical resource that you want to make available in the given plan. By default, hosts and datastores have utilization set to 100%. For a given plan, you can set the utilization to a lower value.
For example, assume you have one data store that you want to share evenly for two clusters of VMs. Also assume that you are creating a plan for one of those clusters. In that case, you can set the datastores to 50% utilization. This saves storage resources for the other cluster that will use this storage.
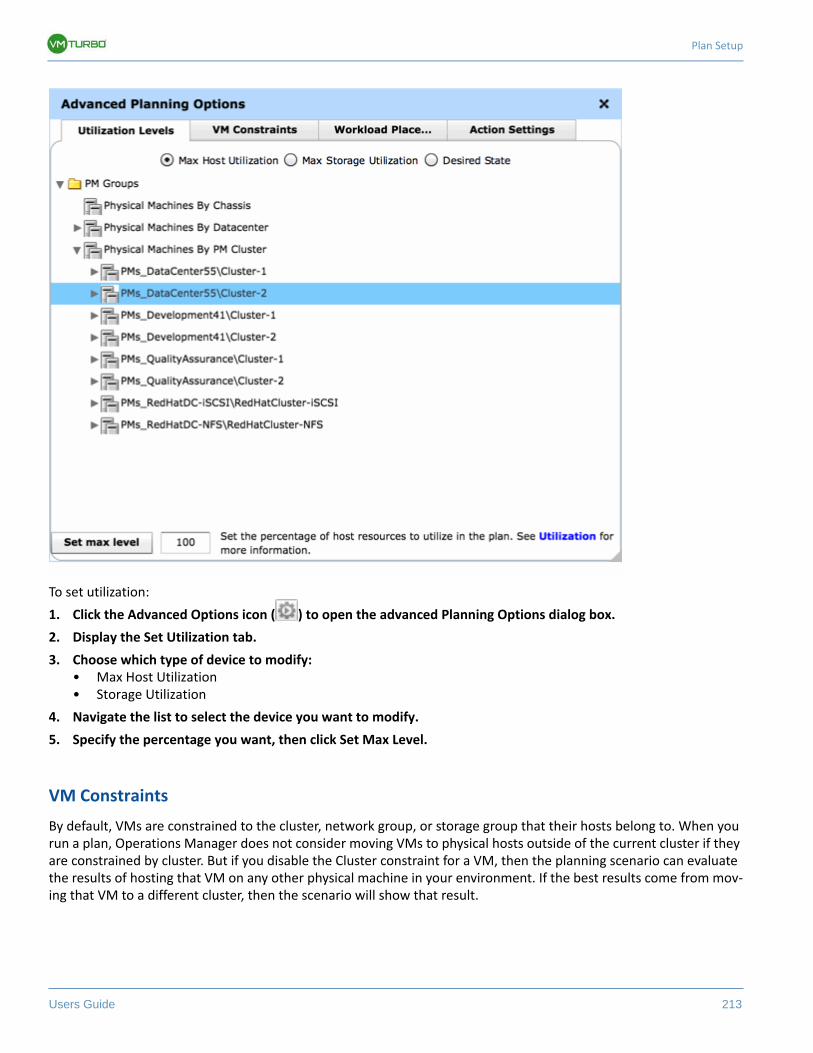
Plan Setup
Users Guide 213
To set utilization:
1. Click the Advanced Options icon ( ) to open the advanced Planning Options dialog box.
2. Display the Set Utilization tab.
3. Choose which type of device to modify:• Max Host Utilization• Storage Utilization
4. Navigate the list to select the device you want to modify.
5. Specify the percentage you want, then click Set Max Level.
VM Constraints
By default, VMs are constrained to the cluster, network group, or storage group that their hosts belong to. When you run a plan, Operations Manager does not consider moving VMs to physical hosts outside of the current cluster if they are constrained by cluster. But if you disable the Cluster constraint for a VM, then the planning scenario can evaluate the results of hosting that VM on any other physical machine in your environment. If the best results come from mov-ing that VM to a different cluster, then the scenario will show that result.
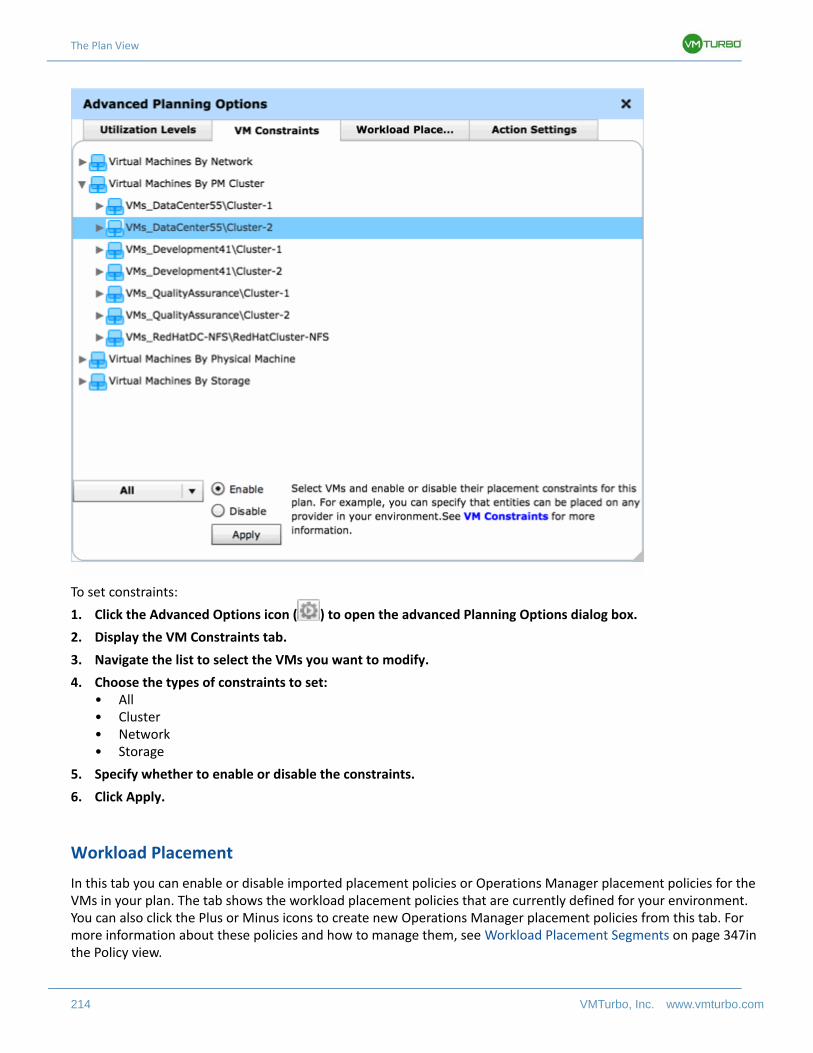
The Plan View
214 VMTurbo, Inc. www.vmturbo.com
To set constraints:
1. Click the Advanced Options icon ( ) to open the advanced Planning Options dialog box.
2. Display the VM Constraints tab.
3. Navigate the list to select the VMs you want to modify.
4. Choose the types of constraints to set:• All• Cluster• Network• Storage
5. Specify whether to enable or disable the constraints.
6. Click Apply.
Workload Placement
In this tab you can enable or disable imported placement policies or Operations Manager placement policies for the VMs in your plan. The tab shows the workload placement policies that are currently defined for your environment. You can also click the Plus or Minus icons to create new Operations Manager placement policies from this tab. For more information about these policies and how to manage them, see Workload Placement Segments on page 347in the Policy view.
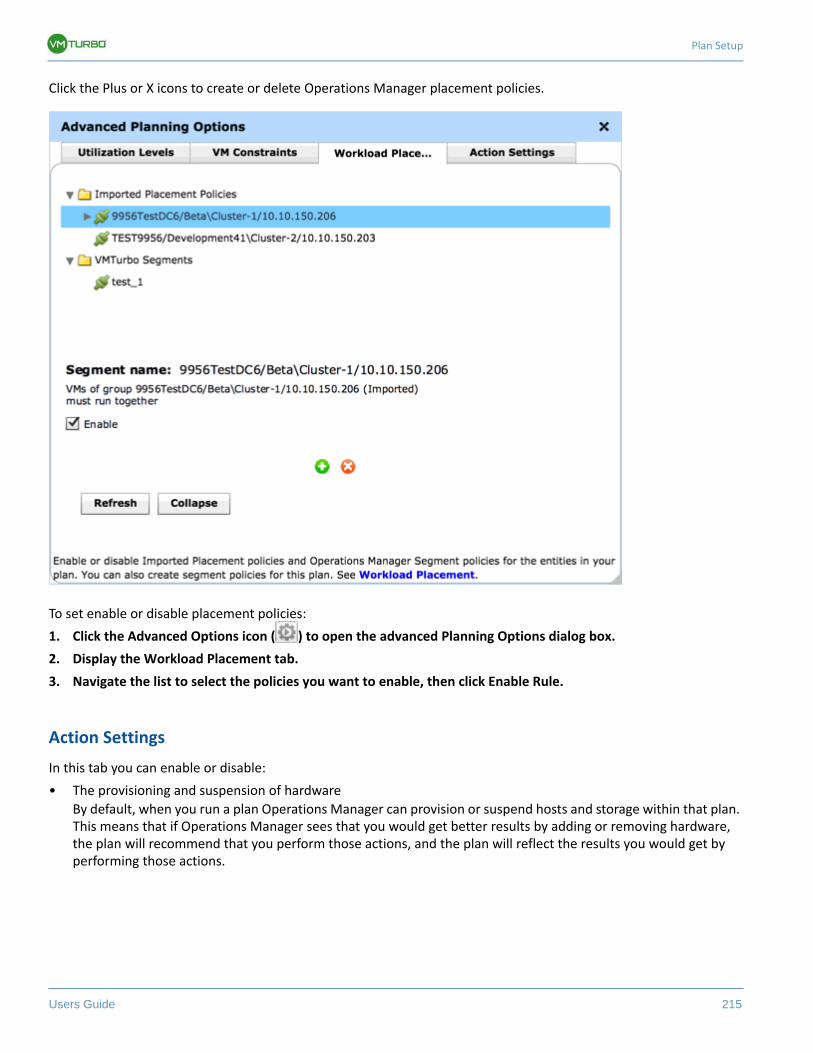
Plan Setup
Users Guide 215
Click the Plus or X icons to create or delete Operations Manager placement policies.
To set enable or disable placement policies:
1. Click the Advanced Options icon ( ) to open the advanced Planning Options dialog box.
2. Display the Workload Placement tab.
3. Navigate the list to select the policies you want to enable, then click Enable Rule.
Action Settings
In this tab you can enable or disable:
• The provisioning and suspension of hardware
By default, when you run a plan Operations Manager can provision or suspend hosts and storage within that plan. This means that if Operations Manager sees that you would get better results by adding or removing hardware, the plan will recommend that you perform those actions, and the plan will reflect the results you would get by performing those actions.
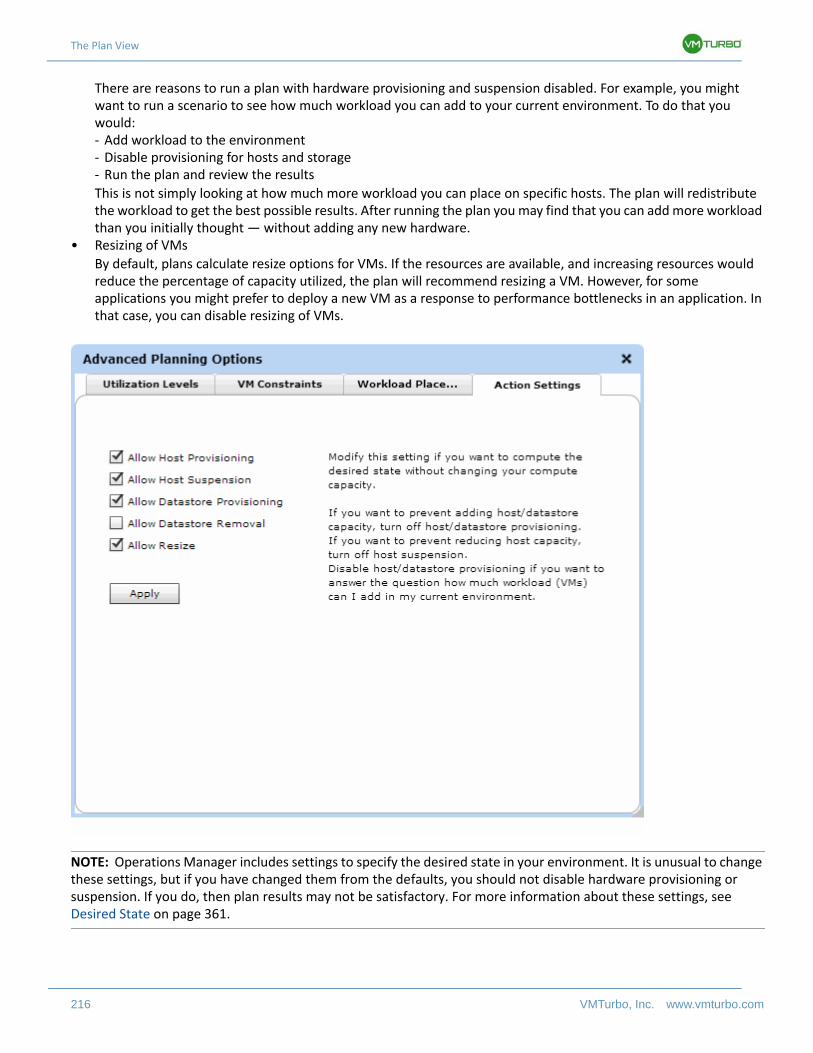
The Plan View
216 VMTurbo, Inc. www.vmturbo.com
There are reasons to run a plan with hardware provisioning and suspension disabled. For example, you might want to run a scenario to see how much workload you can add to your current environment. To do that you would:- Add workload to the environment- Disable provisioning for hosts and storage- Run the plan and review the results
This is not simply looking at how much more workload you can place on specific hosts. The plan will redistribute the workload to get the best possible results. After running the plan you may find that you can add more workload than you initially thought — without adding any new hardware.
• Resizing of VMs
By default, plans calculate resize options for VMs. If the resources are available, and increasing resources would reduce the percentage of capacity utilized, the plan will recommend resizing a VM. However, for some applications you might prefer to deploy a new VM as a response to performance bottlenecks in an application. In that case, you can disable resizing of VMs.
NOTE: Operations Manager includes settings to specify the desired state in your environment. It is unusual to change these settings, but if you have changed them from the defaults, you should not disable hardware provisioning or suspension. If you do, then plan results may not be satisfactory. For more information about these settings, see Desired State on page 361.
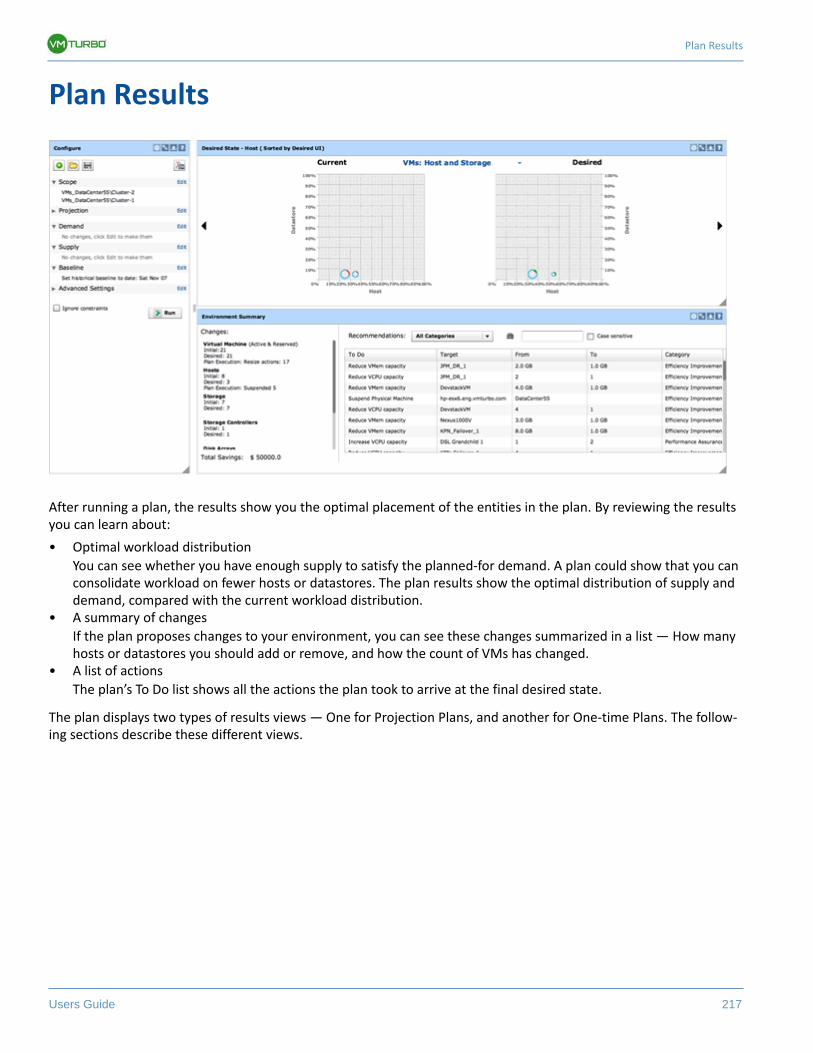
Plan Results
Users Guide 217
Plan Results
After running a plan, the results show you the optimal placement of the entities in the plan. By reviewing the results you can learn about:
• Optimal workload distribution
You can see whether you have enough supply to satisfy the planned-for demand. A plan could show that you can consolidate workload on fewer hosts or datastores. The plan results show the optimal distribution of supply and demand, compared with the current workload distribution.
• A summary of changes
If the plan proposes changes to your environment, you can see these changes summarized in a list — How many hosts or datastores you should add or remove, and how the count of VMs has changed.
• A list of actions
The plan’s To Do list shows all the actions the plan took to arrive at the final desired state.
The plan displays two types of results views — One for Projection Plans, and another for One-time Plans. The follow-ing sections describe these different views.
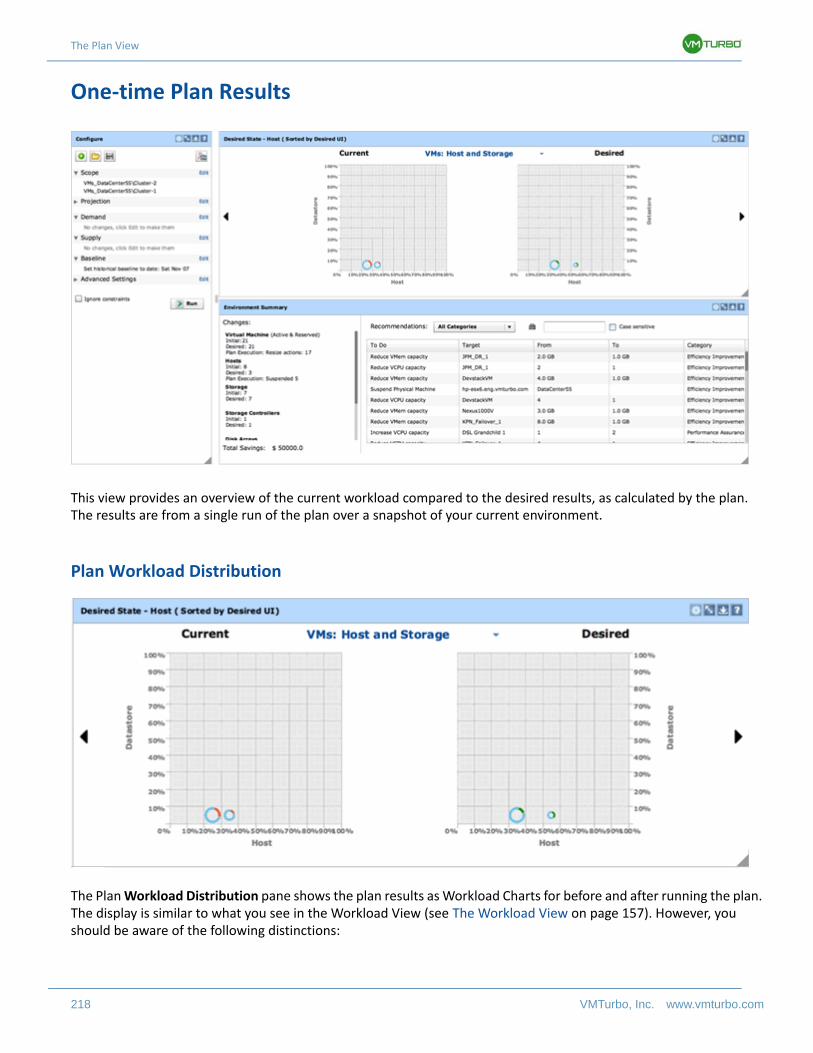
The Plan View
218 VMTurbo, Inc. www.vmturbo.com
One-time Plan Results
This view provides an overview of the current workload compared to the desired results, as calculated by the plan. The results are from a single run of the plan over a snapshot of your current environment.
Plan Workload Distribution
The Plan Workload Distribution pane shows the plan results as Workload Charts for before and after running the plan. The display is similar to what you see in the Workload View (see The Workload View on page 157). However, you should be aware of the following distinctions:
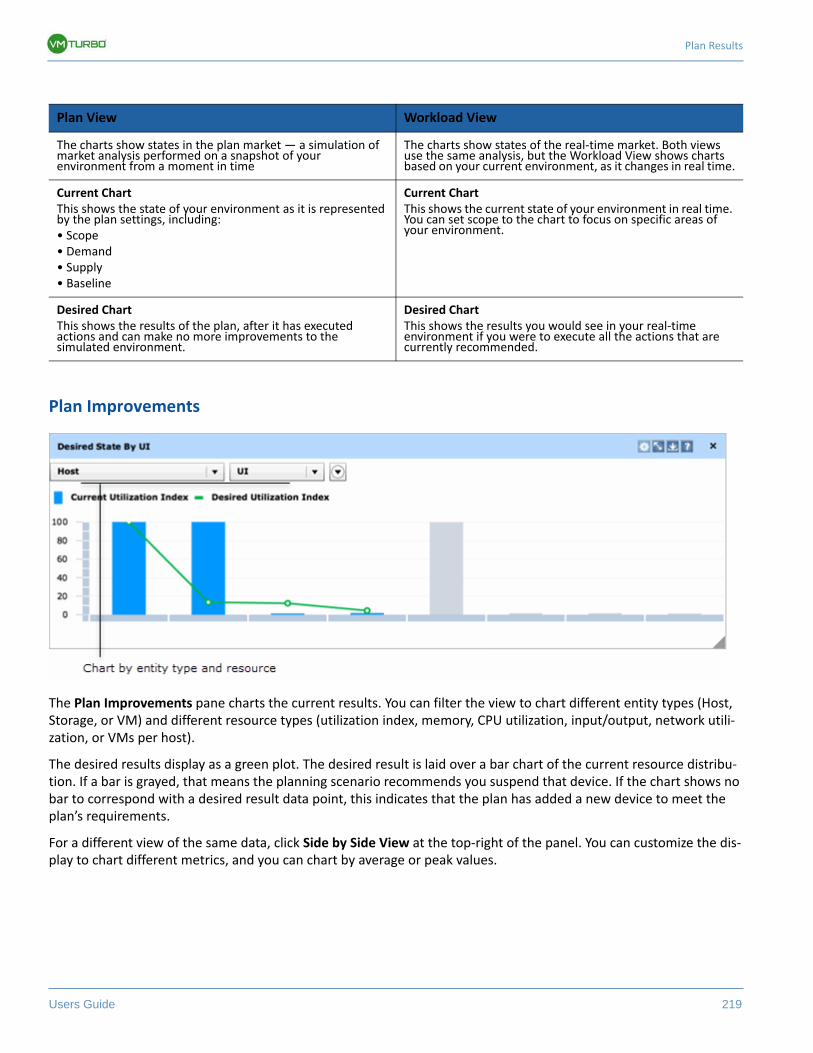
Plan Results
Users Guide 219
Plan Improvements
The Plan Improvements pane charts the current results. You can filter the view to chart different entity types (Host, Storage, or VM) and different resource types (utilization index, memory, CPU utilization, input/output, network utili-zation, or VMs per host).
The desired results display as a green plot. The desired result is laid over a bar chart of the current resource distribu-tion. If a bar is grayed, that means the planning scenario recommends you suspend that device. If the chart shows no bar to correspond with a desired result data point, this indicates that the plan has added a new device to meet the plan’s requirements.
For a different view of the same data, click Side by Side View at the top-right of the panel. You can customize the dis-play to chart different metrics, and you can chart by average or peak values.
Plan View Workload View
The charts show states in the plan market — a simulation of market analysis performed on a snapshot of your environment from a moment in time
The charts show states of the real-time market. Both views use the same analysis, but the Workload View shows charts based on your current environment, as it changes in real time.
Current ChartThis shows the state of your environment as it is represented by the plan settings, including:• Scope• Demand• Supply• Baseline
Current ChartThis shows the current state of your environment in real time. You can set scope to the chart to focus on specific areas of your environment.
Desired ChartThis shows the results of the plan, after it has executed actions and can make no more improvements to the simulated environment.
Desired ChartThis shows the results you would see in your real-time environment if you were to execute all the actions that are currently recommended.
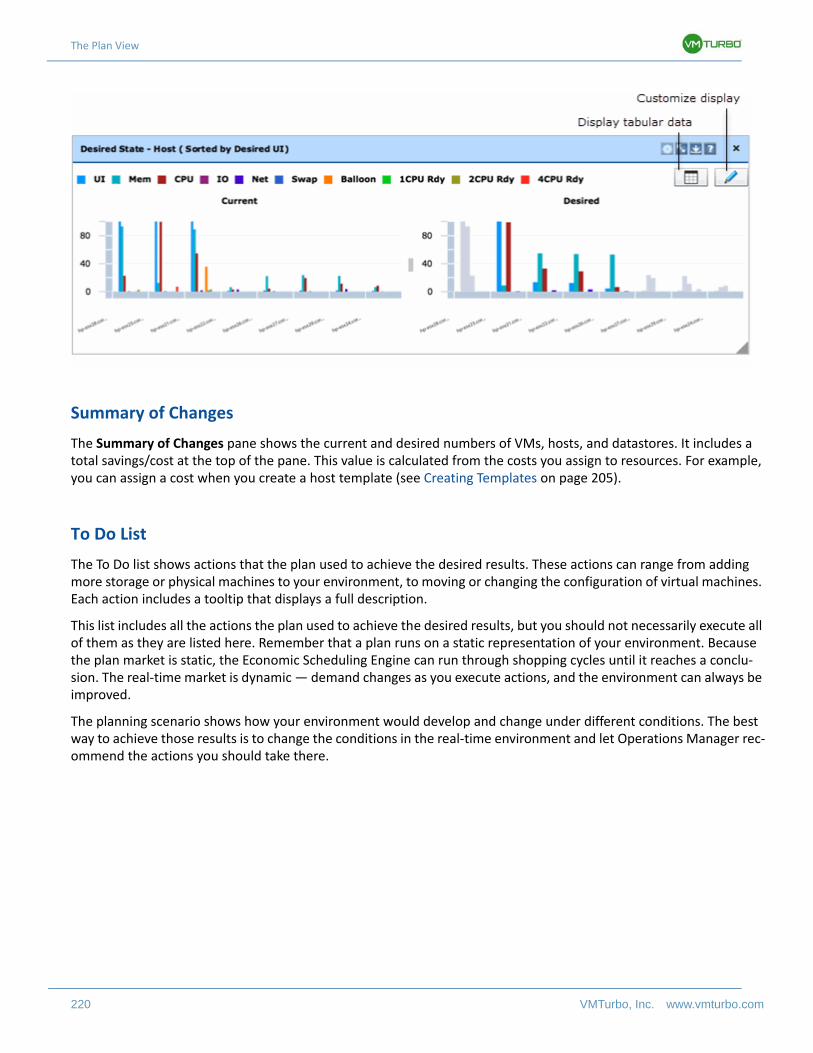
The Plan View
220 VMTurbo, Inc. www.vmturbo.com
Summary of Changes
The Summary of Changes pane shows the current and desired numbers of VMs, hosts, and datastores. It includes a total savings/cost at the top of the pane. This value is calculated from the costs you assign to resources. For example, you can assign a cost when you create a host template (see Creating Templates on page 205).
To Do List
The To Do list shows actions that the plan used to achieve the desired results. These actions can range from adding more storage or physical machines to your environment, to moving or changing the configuration of virtual machines. Each action includes a tooltip that displays a full description.
This list includes all the actions the plan used to achieve the desired results, but you should not necessarily execute all of them as they are listed here. Remember that a plan runs on a static representation of your environment. Because the plan market is static, the Economic Scheduling Engine can run through shopping cycles until it reaches a conclu-sion. The real-time market is dynamic — demand changes as you execute actions, and the environment can always be improved.
The planning scenario shows how your environment would develop and change under different conditions. The best way to achieve those results is to change the conditions in the real-time environment and let Operations Manager rec-ommend the actions you should take there.
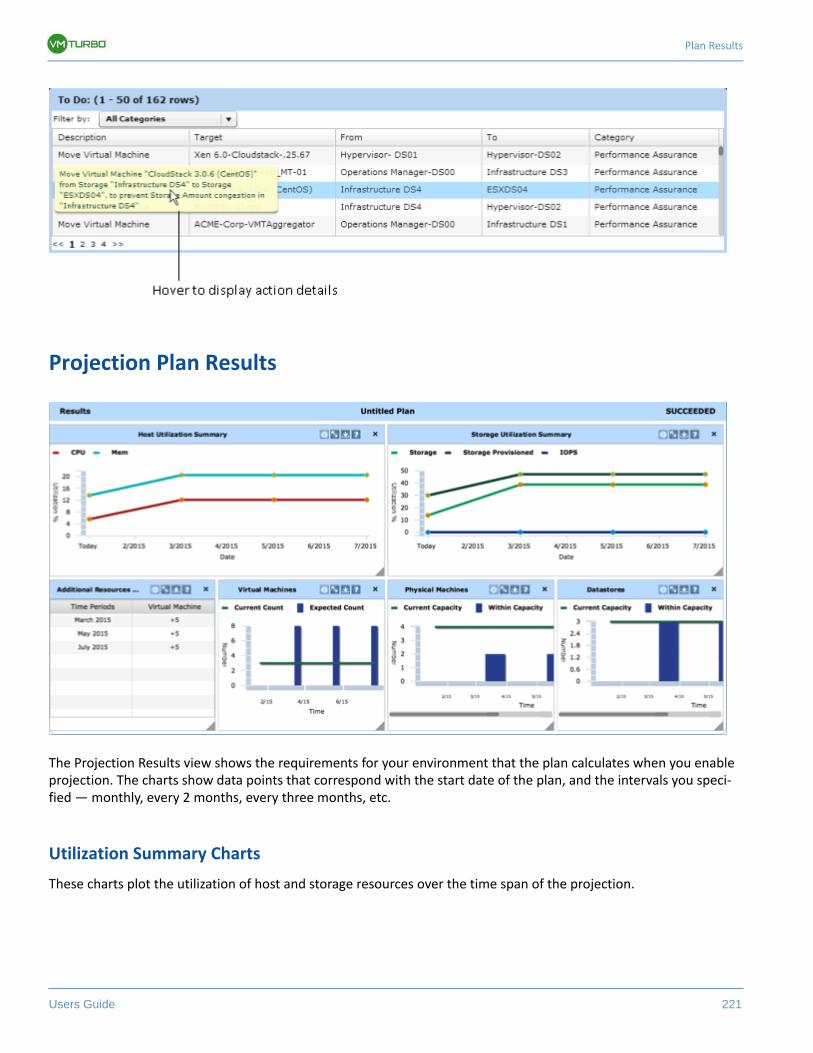
Plan Results
Users Guide 221
Projection Plan Results
The Projection Results view shows the requirements for your environment that the plan calculates when you enable projection. The charts show data points that correspond with the start date of the plan, and the intervals you speci-fied — monthly, every 2 months, every three months, etc.
Utilization Summary Charts
These charts plot the utilization of host and storage resources over the time span of the projection.
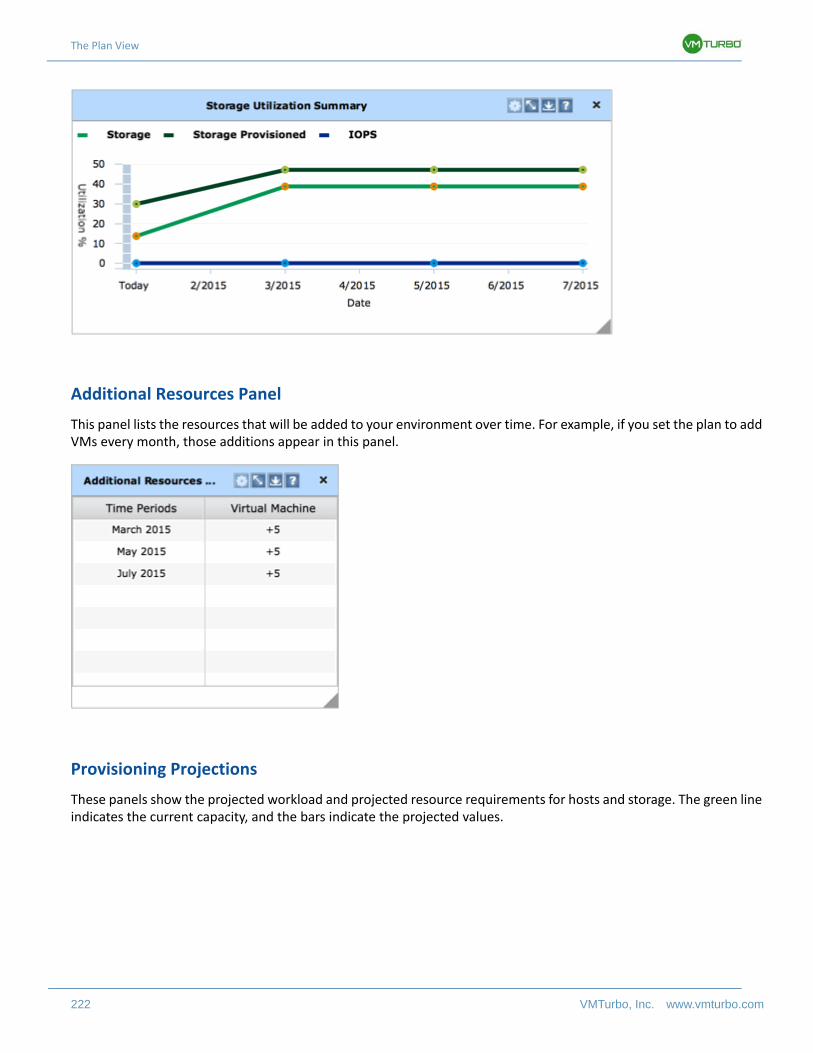
The Plan View
222 VMTurbo, Inc. www.vmturbo.com
Additional Resources Panel
This panel lists the resources that will be added to your environment over time. For example, if you set the plan to add VMs every month, those additions appear in this panel.
Provisioning Projections
These panels show the projected workload and projected resource requirements for hosts and storage. The green line indicates the current capacity, and the bars indicate the projected values.
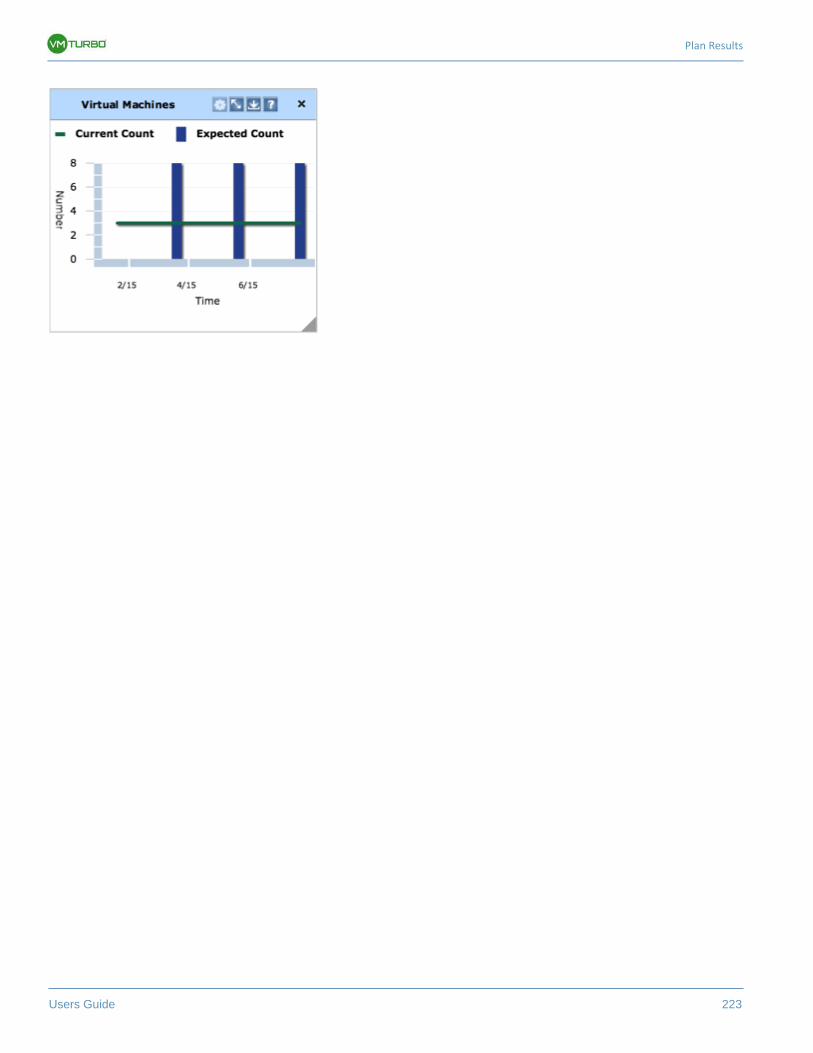
Plan Results
Users Guide 223
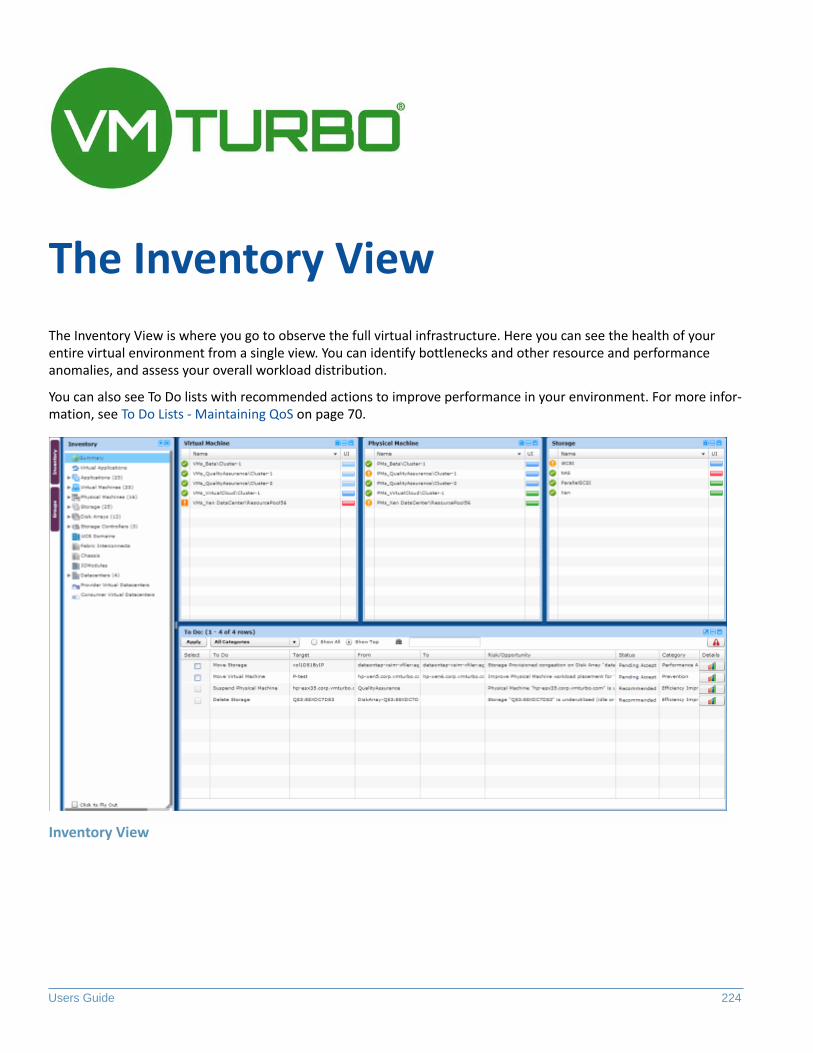
Users Guide 224
The Inventory View
The Inventory View is where you go to observe the full virtual infrastructure. Here you can see the health of your entire virtual environment from a single view. You can identify bottlenecks and other resource and performance anomalies, and assess your overall workload distribution.
You can also see To Do lists with recommended actions to improve performance in your environment. For more infor-mation, see To Do Lists - Maintaining QoS on page 70.
Inventory View
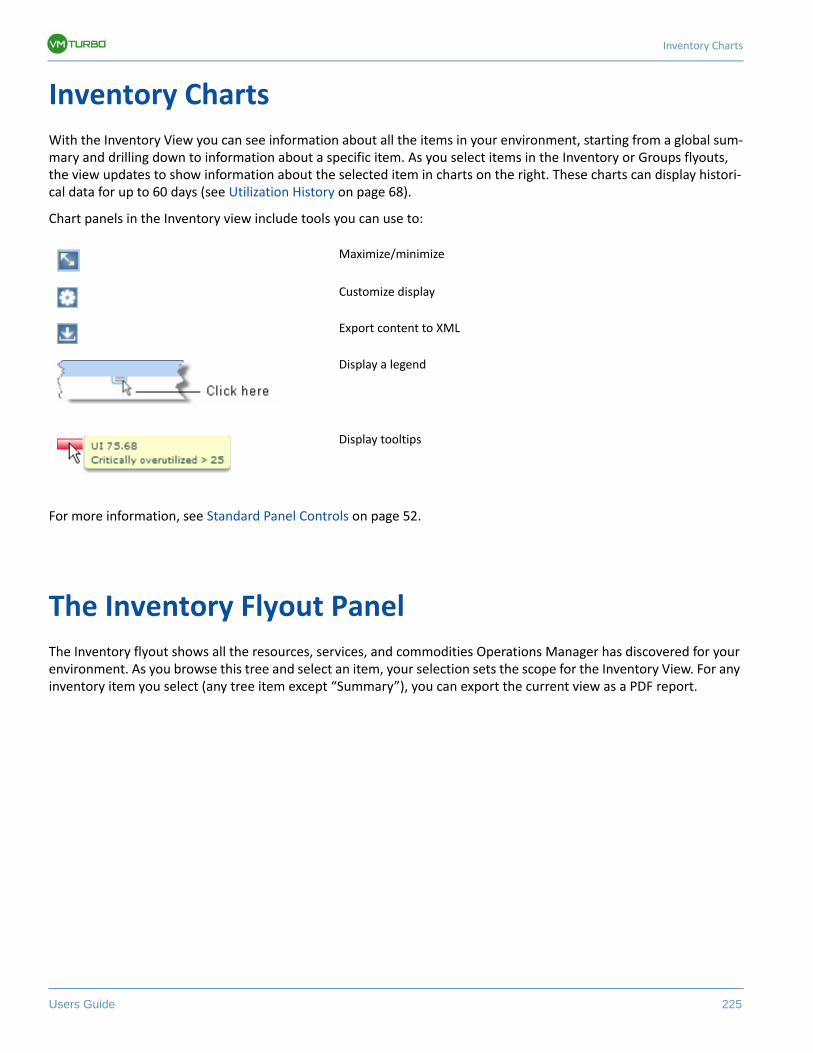
Inventory Charts
Users Guide 225
Inventory Charts
With the Inventory View you can see information about all the items in your environment, starting from a global sum-mary and drilling down to information about a specific item. As you select items in the Inventory or Groups flyouts, the view updates to show information about the selected item in charts on the right. These charts can display histori-cal data for up to 60 days (see Utilization History on page 68).
Chart panels in the Inventory view include tools you can use to:
For more information, see Standard Panel Controls on page 52.
The Inventory Flyout Panel
The Inventory flyout shows all the resources, services, and commodities Operations Manager has discovered for your environment. As you browse this tree and select an item, your selection sets the scope for the Inventory View. For any inventory item you select (any tree item except “Summary”), you can export the current view as a PDF report.
Maximize/minimize
Customize display
Export content to XML
Display a legend
Display tooltips
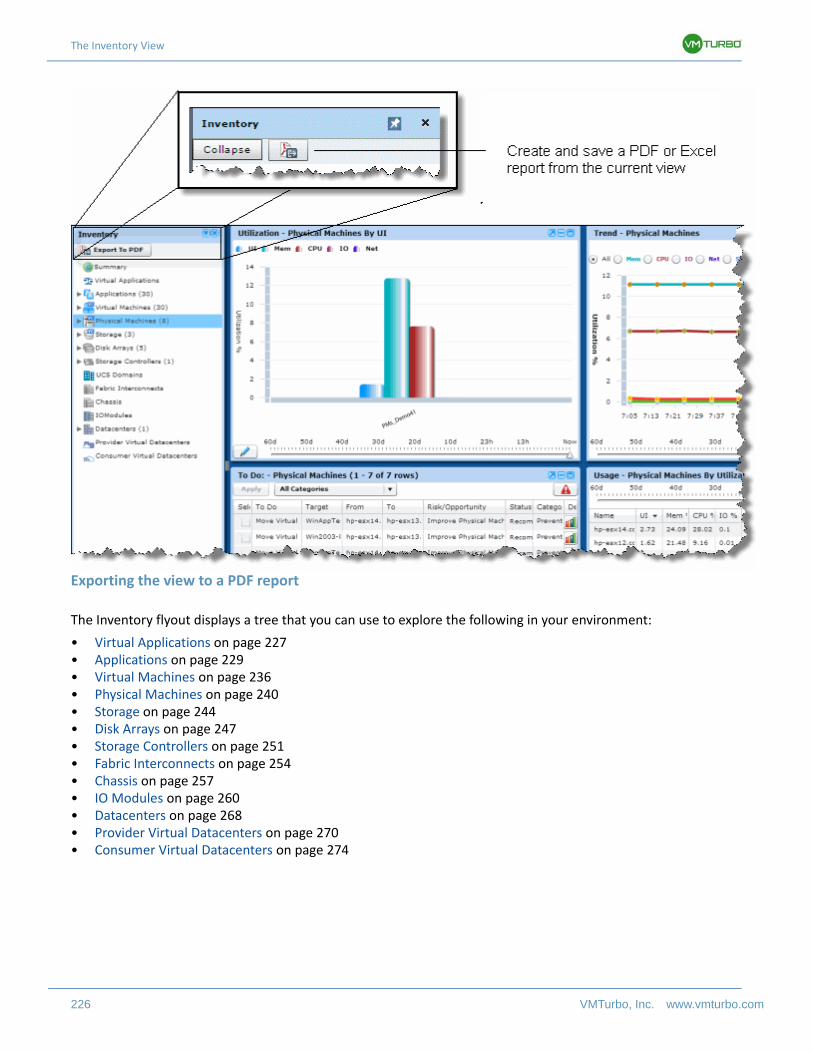
The Inventory View
226 VMTurbo, Inc. www.vmturbo.com
Exporting the view to a PDF report
The Inventory flyout displays a tree that you can use to explore the following in your environment:
• Virtual Applications on page 227• Applications on page 229• Virtual Machines on page 236• Physical Machines on page 240• Storage on page 244• Disk Arrays on page 247• Storage Controllers on page 251• Fabric Interconnects on page 254• Chassis on page 257• IO Modules on page 260• Datacenters on page 268• Provider Virtual Datacenters on page 270• Consumer Virtual Datacenters on page 274
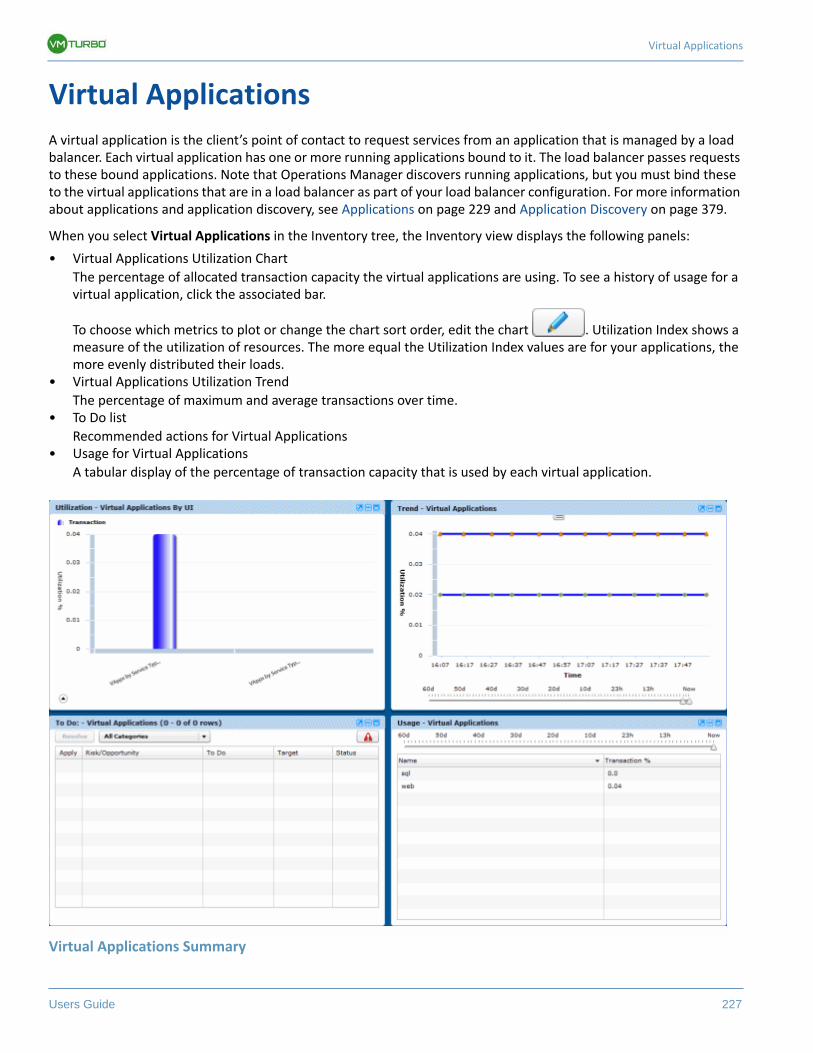
Virtual Applications
Users Guide 227
Virtual Applications
A virtual application is the client’s point of contact to request services from an application that is managed by a load balancer. Each virtual application has one or more running applications bound to it. The load balancer passes requests to these bound applications. Note that Operations Manager discovers running applications, but you must bind these to the virtual applications that are in a load balancer as part of your load balancer configuration. For more information about applications and application discovery, see Applications on page 229 and Application Discovery on page 379.
When you select Virtual Applications in the Inventory tree, the Inventory view displays the following panels:
• Virtual Applications Utilization Chart
The percentage of allocated transaction capacity the virtual applications are using. To see a history of usage for a virtual application, click the associated bar.
To choose which metrics to plot or change the chart sort order, edit the chart . Utilization Index shows a measure of the utilization of resources. The more equal the Utilization Index values are for your applications, the more evenly distributed their loads.
• Virtual Applications Utilization Trend
The percentage of maximum and average transactions over time.• To Do list
Recommended actions for Virtual Applications• Usage for Virtual Applications
A tabular display of the percentage of transaction capacity that is used by each virtual application.
Virtual Applications Summary
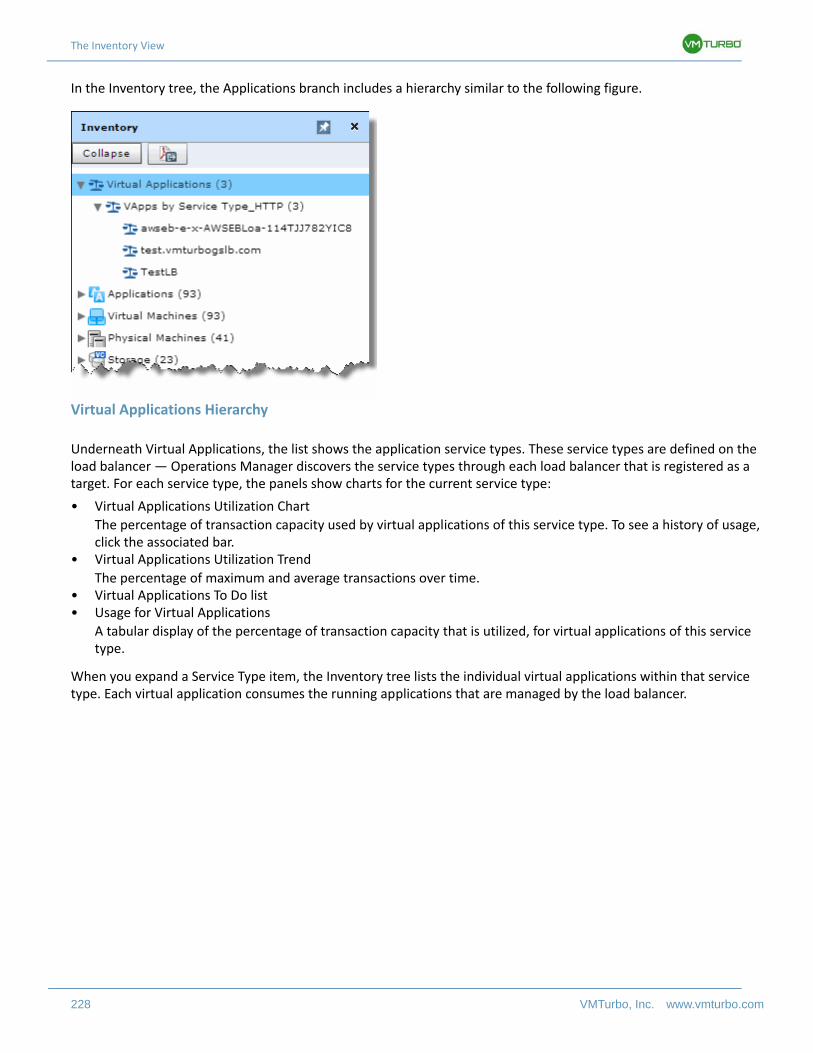
The Inventory View
228 VMTurbo, Inc. www.vmturbo.com
In the Inventory tree, the Applications branch includes a hierarchy similar to the following figure.
Virtual Applications Hierarchy
Underneath Virtual Applications, the list shows the application service types. These service types are defined on the load balancer — Operations Manager discovers the service types through each load balancer that is registered as a target. For each service type, the panels show charts for the current service type:
• Virtual Applications Utilization Chart
The percentage of transaction capacity used by virtual applications of this service type. To see a history of usage, click the associated bar.
• Virtual Applications Utilization Trend
The percentage of maximum and average transactions over time.• Virtual Applications To Do list• Usage for Virtual Applications
A tabular display of the percentage of transaction capacity that is utilized, for virtual applications of this service type.
When you expand a Service Type item, the Inventory tree lists the individual virtual applications within that service type. Each virtual application consumes the running applications that are managed by the load balancer.
Applications
Users Guide 229
Applications
Operations Manager discovers and monitors applications running on VMs in your environment. By default, Operations Manager discovers the following applications:
In addition, your installation of Operations Manager might be configured to discover other applications running in your environment. For more information, see Application Discovery on page 379.
Application Name Description
LSASS Microsoft Active Directory services
IIS Microsoft Internet Information Services
XenDesktop Citrix XenDesktop
VMView VMware View
MSSQL Microsoft SQL Server
SharePoint Microsoft Sharepoint Server
Guest Load The resources that Operations Manager has not assigned to any specific application (for more information, see Guest Load on page 232)
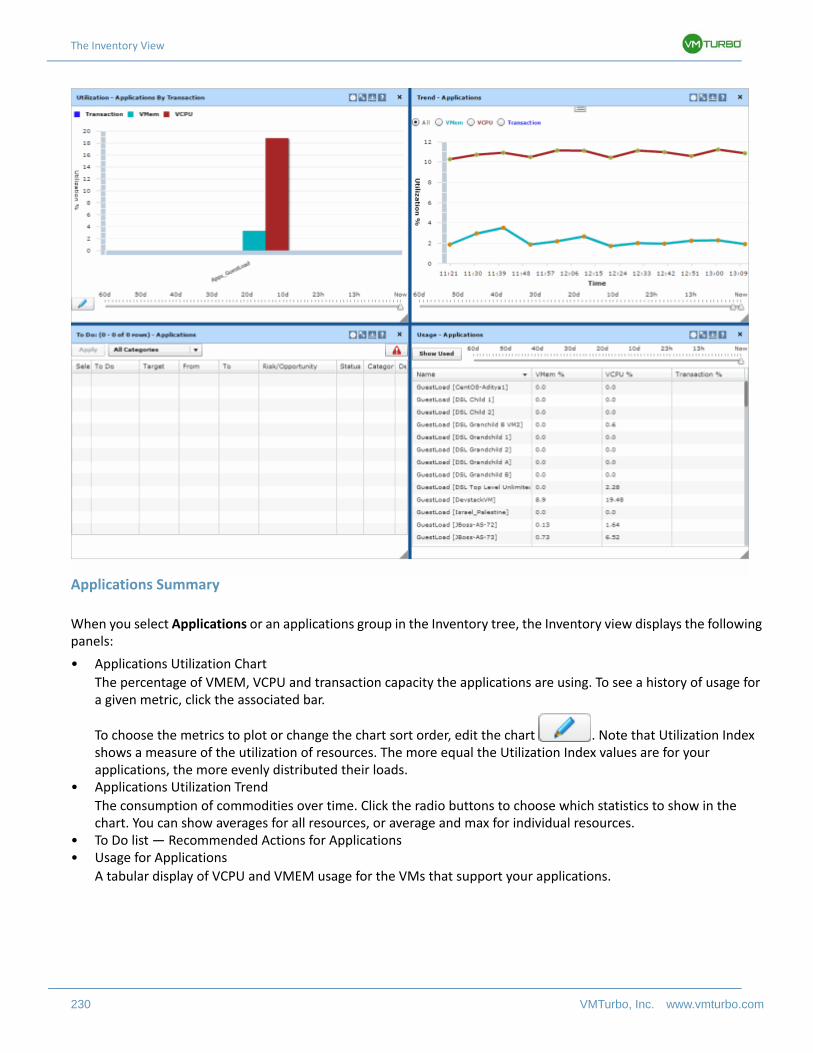
The Inventory View
230 VMTurbo, Inc. www.vmturbo.com
Applications Summary
When you select Applications or an applications group in the Inventory tree, the Inventory view displays the following panels:
• Applications Utilization Chart
The percentage of VMEM, VCPU and transaction capacity the applications are using. To see a history of usage for a given metric, click the associated bar.
To choose the metrics to plot or change the chart sort order, edit the chart . Note that Utilization Index shows a measure of the utilization of resources. The more equal the Utilization Index values are for your applications, the more evenly distributed their loads.
• Applications Utilization Trend
The consumption of commodities over time. Click the radio buttons to choose which statistics to show in the chart. You can show averages for all resources, or average and max for individual resources.
• To Do list — Recommended Actions for Applications• Usage for Applications
A tabular display of VCPU and VMEM usage for the VMs that support your applications.
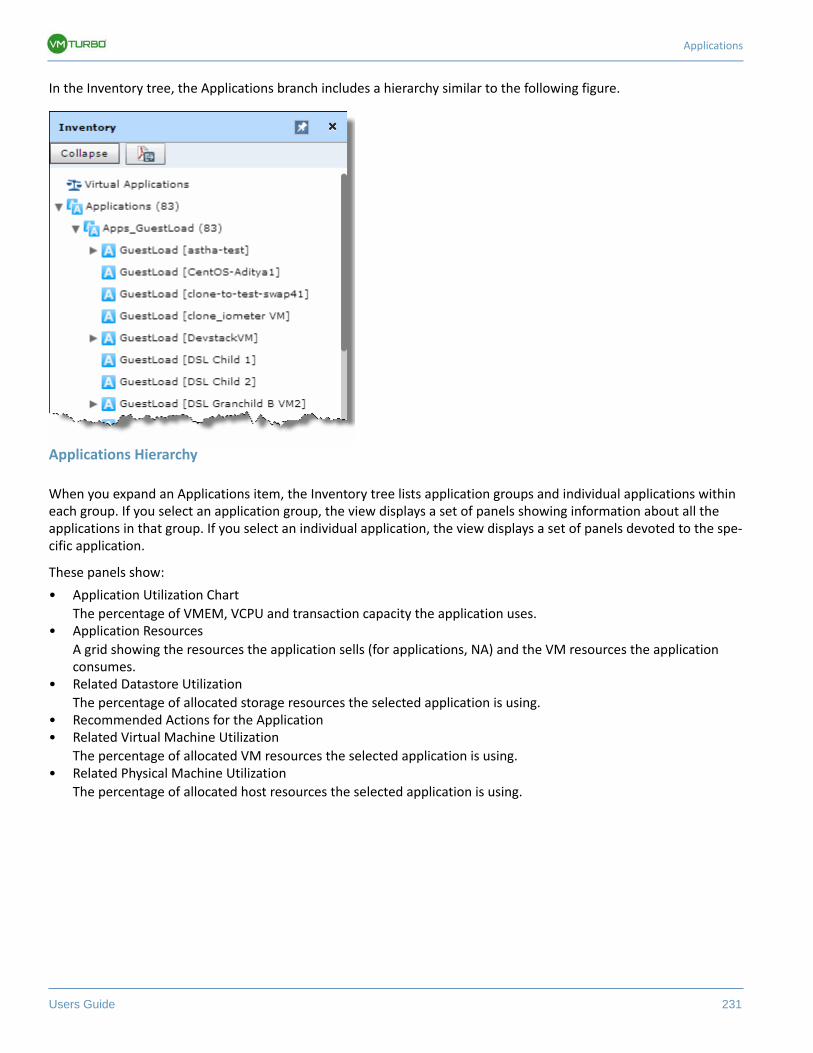
Applications
Users Guide 231
In the Inventory tree, the Applications branch includes a hierarchy similar to the following figure.
Applications Hierarchy
When you expand an Applications item, the Inventory tree lists application groups and individual applications within each group. If you select an application group, the view displays a set of panels showing information about all the applications in that group. If you select an individual application, the view displays a set of panels devoted to the spe-cific application.
These panels show:
• Application Utilization Chart
The percentage of VMEM, VCPU and transaction capacity the application uses.• Application Resources
A grid showing the resources the application sells (for applications, NA) and the VM resources the application consumes.
• Related Datastore Utilization
The percentage of allocated storage resources the selected application is using.• Recommended Actions for the Application• Related Virtual Machine Utilization
The percentage of allocated VM resources the selected application is using.• Related Physical Machine Utilization
The percentage of allocated host resources the selected application is using.
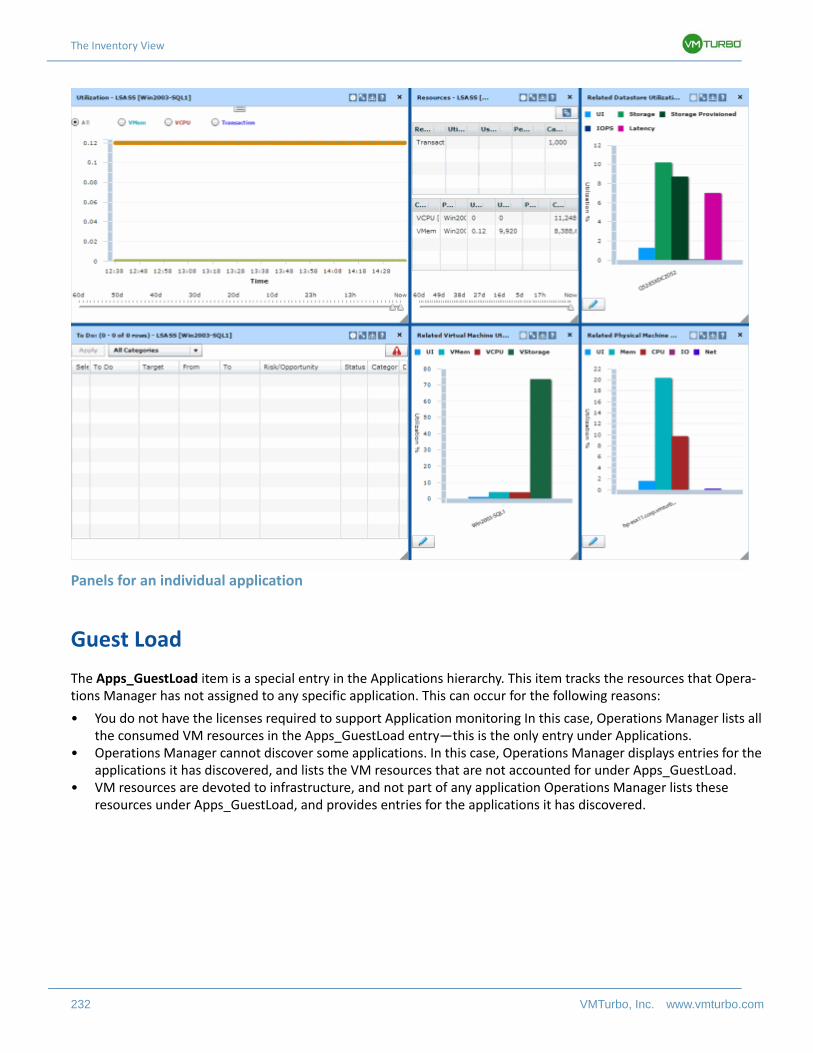
The Inventory View
232 VMTurbo, Inc. www.vmturbo.com
Panels for an individual application
Guest Load
The Apps_GuestLoad item is a special entry in the Applications hierarchy. This item tracks the resources that Opera-tions Manager has not assigned to any specific application. This can occur for the following reasons:
• You do not have the licenses required to support Application monitoring In this case, Operations Manager lists all the consumed VM resources in the Apps_GuestLoad entry—this is the only entry under Applications.
• Operations Manager cannot discover some applications. In this case, Operations Manager displays entries for the applications it has discovered, and lists the VM resources that are not accounted for under Apps_GuestLoad.
• VM resources are devoted to infrastructure, and not part of any application Operations Manager lists these resources under Apps_GuestLoad, and provides entries for the applications it has discovered.
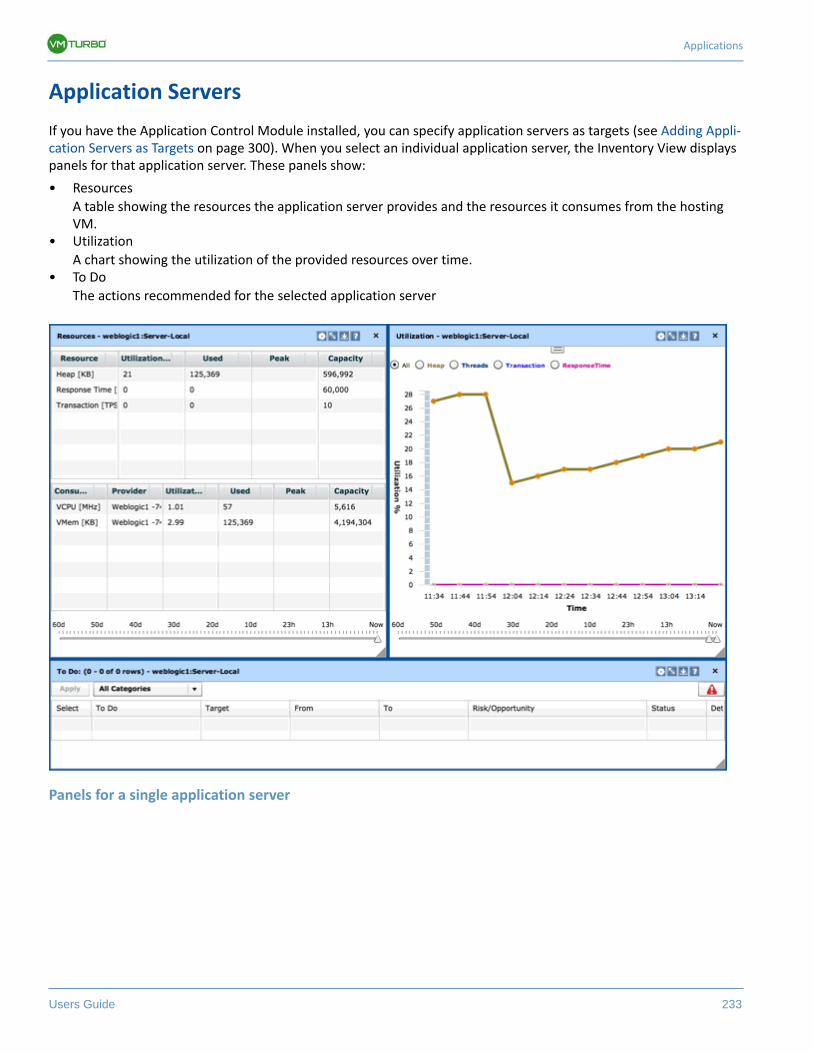
Applications
Users Guide 233
Application Servers
If you have the Application Control Module installed, you can specify application servers as targets (see Adding Appli-cation Servers as Targets on page 300). When you select an individual application server, the Inventory View displays panels for that application server. These panels show:
• Resources
A table showing the resources the application server provides and the resources it consumes from the hosting VM.
• Utilization
A chart showing the utilization of the provided resources over time.• To Do
The actions recommended for the selected application server
Panels for a single application server
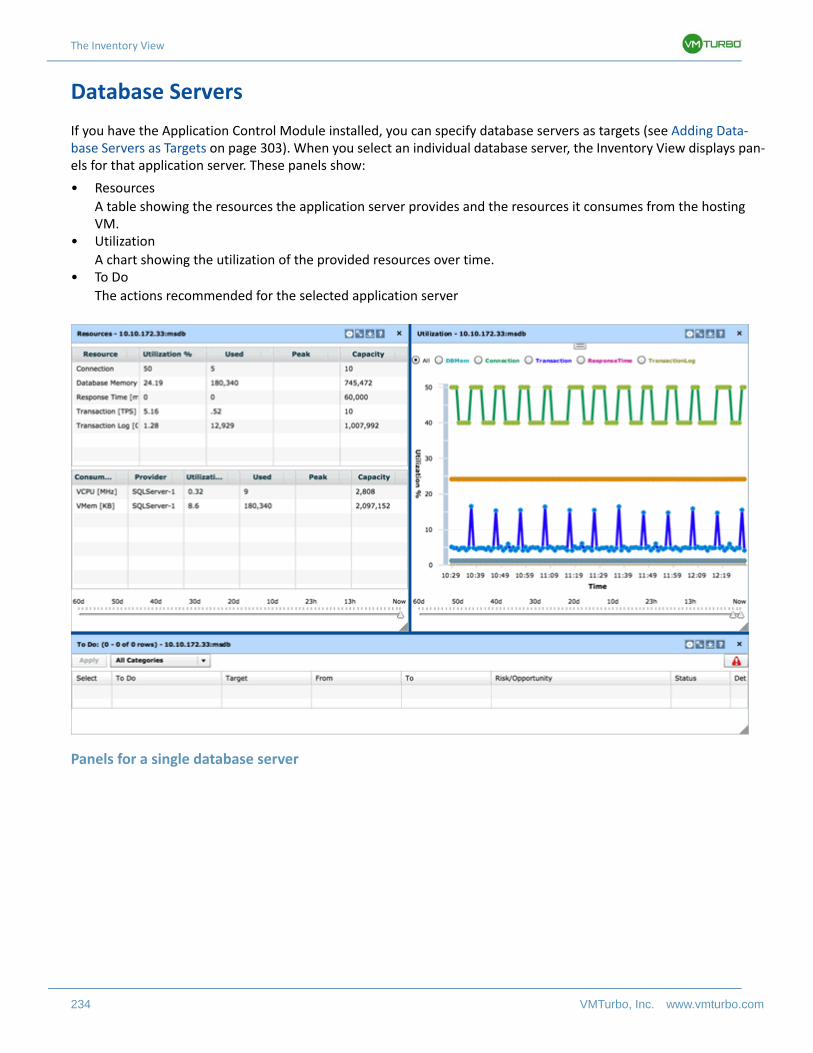
The Inventory View
234 VMTurbo, Inc. www.vmturbo.com
Database Servers
If you have the Application Control Module installed, you can specify database servers as targets (see Adding Data-base Servers as Targets on page 303). When you select an individual database server, the Inventory View displays pan-els for that application server. These panels show:
• Resources
A table showing the resources the application server provides and the resources it consumes from the hosting VM.
• Utilization
A chart showing the utilization of the provided resources over time.• To Do
The actions recommended for the selected application server
Panels for a single database server
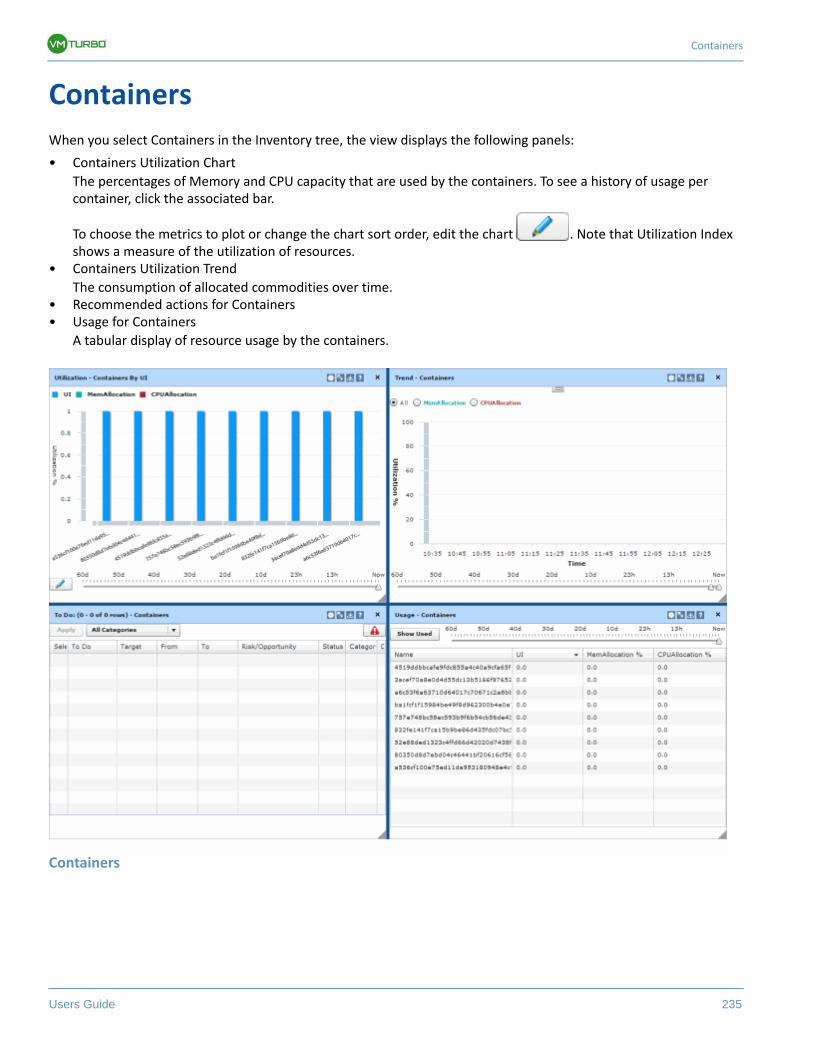
Containers
Users Guide 235
Containers
When you select Containers in the Inventory tree, the view displays the following panels:
• Containers Utilization Chart
The percentages of Memory and CPU capacity that are used by the containers. To see a history of usage per container, click the associated bar.
To choose the metrics to plot or change the chart sort order, edit the chart . Note that Utilization Index shows a measure of the utilization of resources.
• Containers Utilization Trend
The consumption of allocated commodities over time.• Recommended actions for Containers• Usage for Containers
A tabular display of resource usage by the containers.
Containers
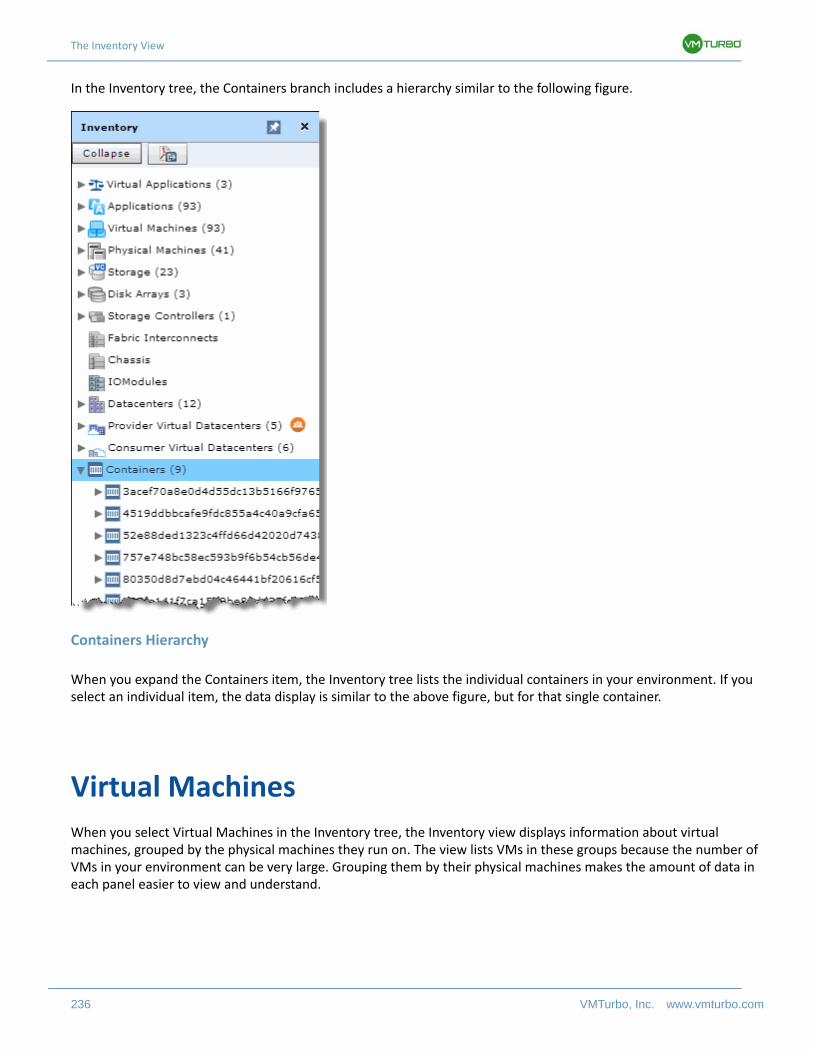
The Inventory View
236 VMTurbo, Inc. www.vmturbo.com
In the Inventory tree, the Containers branch includes a hierarchy similar to the following figure.
Containers Hierarchy
When you expand the Containers item, the Inventory tree lists the individual containers in your environment. If you select an individual item, the data display is similar to the above figure, but for that single container.
Virtual Machines
When you select Virtual Machines in the Inventory tree, the Inventory view displays information about virtual machines, grouped by the physical machines they run on. The view lists VMs in these groups because the number of VMs in your environment can be very large. Grouping them by their physical machines makes the amount of data in each panel easier to view and understand.
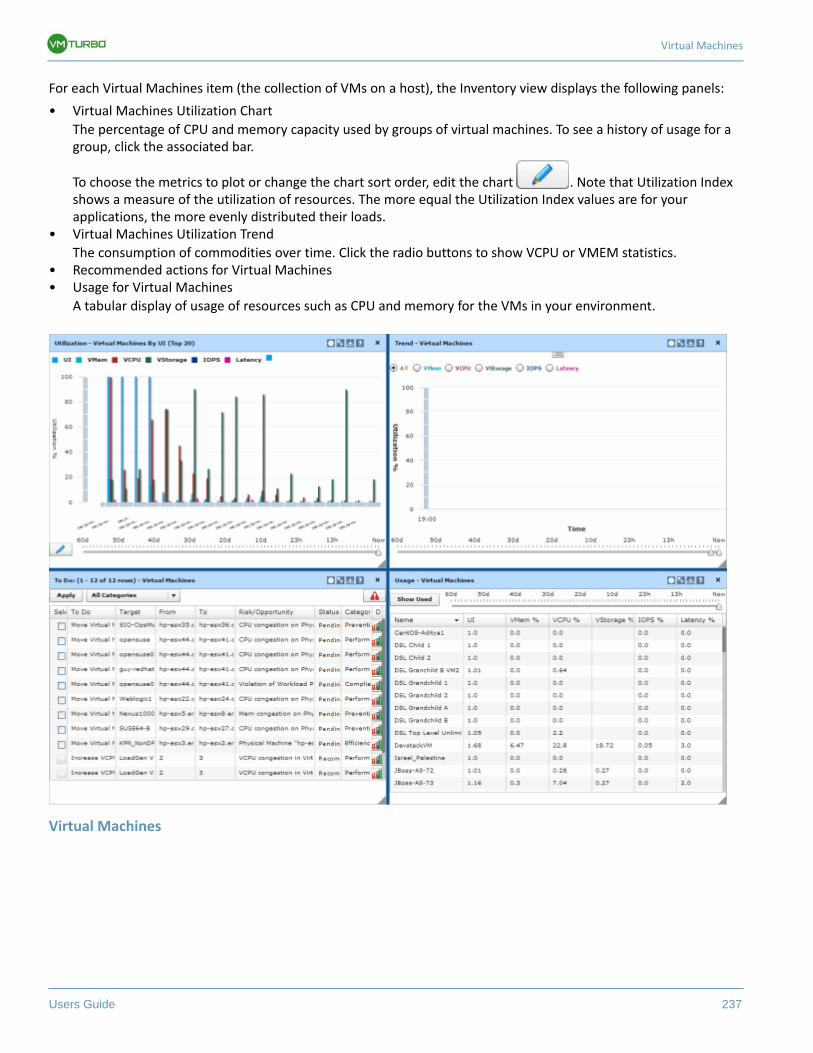
Virtual Machines
Users Guide 237
For each Virtual Machines item (the collection of VMs on a host), the Inventory view displays the following panels:
• Virtual Machines Utilization Chart
The percentage of CPU and memory capacity used by groups of virtual machines. To see a history of usage for a group, click the associated bar.
To choose the metrics to plot or change the chart sort order, edit the chart . Note that Utilization Index shows a measure of the utilization of resources. The more equal the Utilization Index values are for your applications, the more evenly distributed their loads.
• Virtual Machines Utilization Trend
The consumption of commodities over time. Click the radio buttons to show VCPU or VMEM statistics.• Recommended actions for Virtual Machines• Usage for Virtual Machines
A tabular display of usage of resources such as CPU and memory for the VMs in your environment.
Virtual Machines
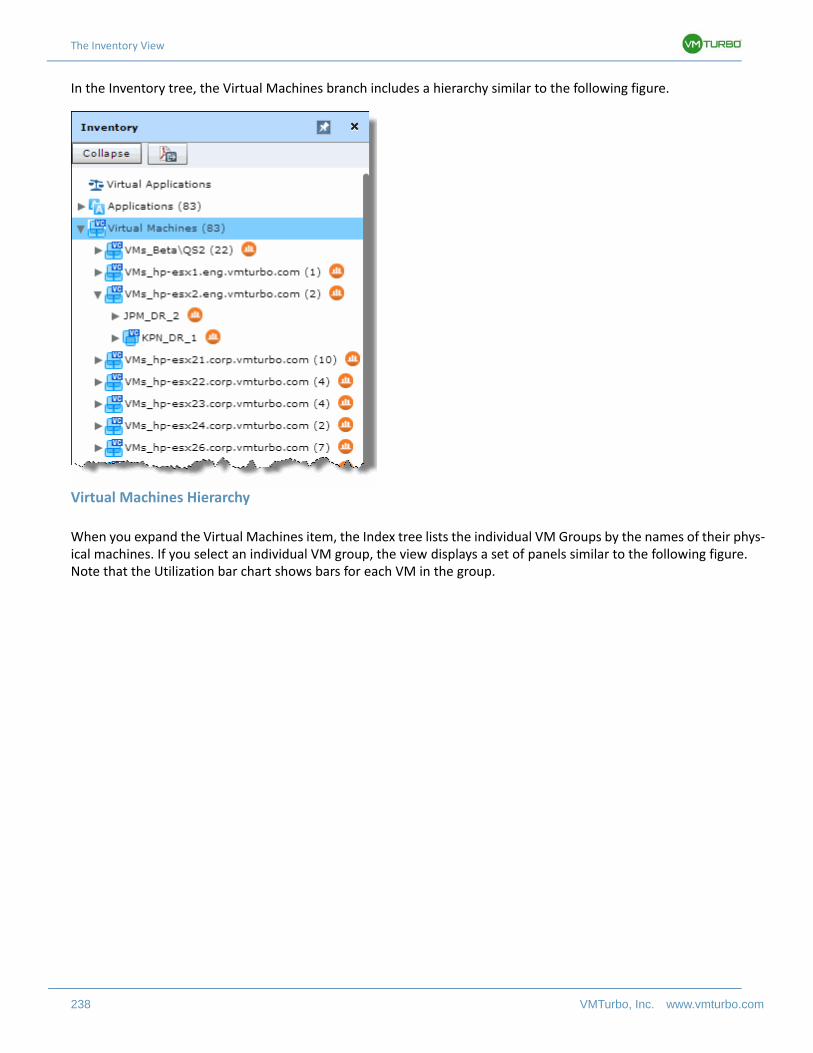
The Inventory View
238 VMTurbo, Inc. www.vmturbo.com
In the Inventory tree, the Virtual Machines branch includes a hierarchy similar to the following figure.
Virtual Machines Hierarchy
When you expand the Virtual Machines item, the Index tree lists the individual VM Groups by the names of their phys-ical machines. If you select an individual VM group, the view displays a set of panels similar to the following figure. Note that the Utilization bar chart shows bars for each VM in the group.
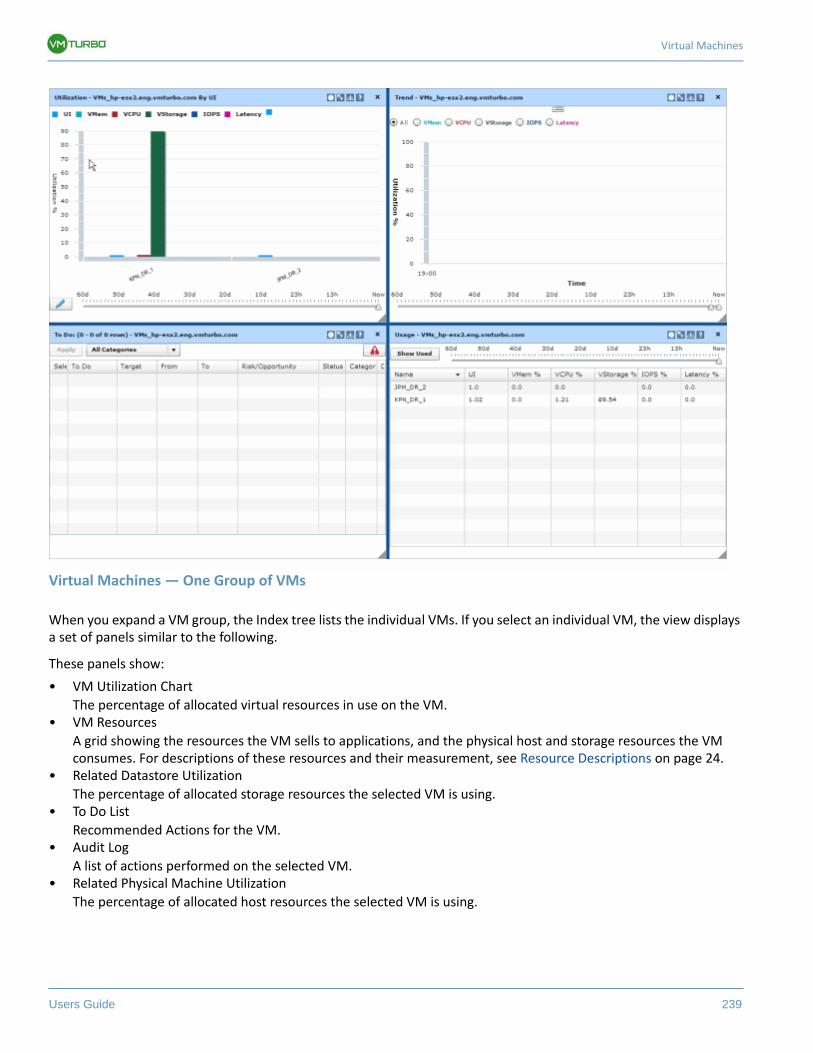
Virtual Machines
Users Guide 239
Virtual Machines — One Group of VMs
When you expand a VM group, the Index tree lists the individual VMs. If you select an individual VM, the view displays a set of panels similar to the following.
These panels show:
• VM Utilization Chart
The percentage of allocated virtual resources in use on the VM.• VM Resources
A grid showing the resources the VM sells to applications, and the physical host and storage resources the VM consumes. For descriptions of these resources and their measurement, see Resource Descriptions on page 24.
• Related Datastore Utilization
The percentage of allocated storage resources the selected VM is using.• To Do List
Recommended Actions for the VM.• Audit Log
A list of actions performed on the selected VM.• Related Physical Machine Utilization
The percentage of allocated host resources the selected VM is using.
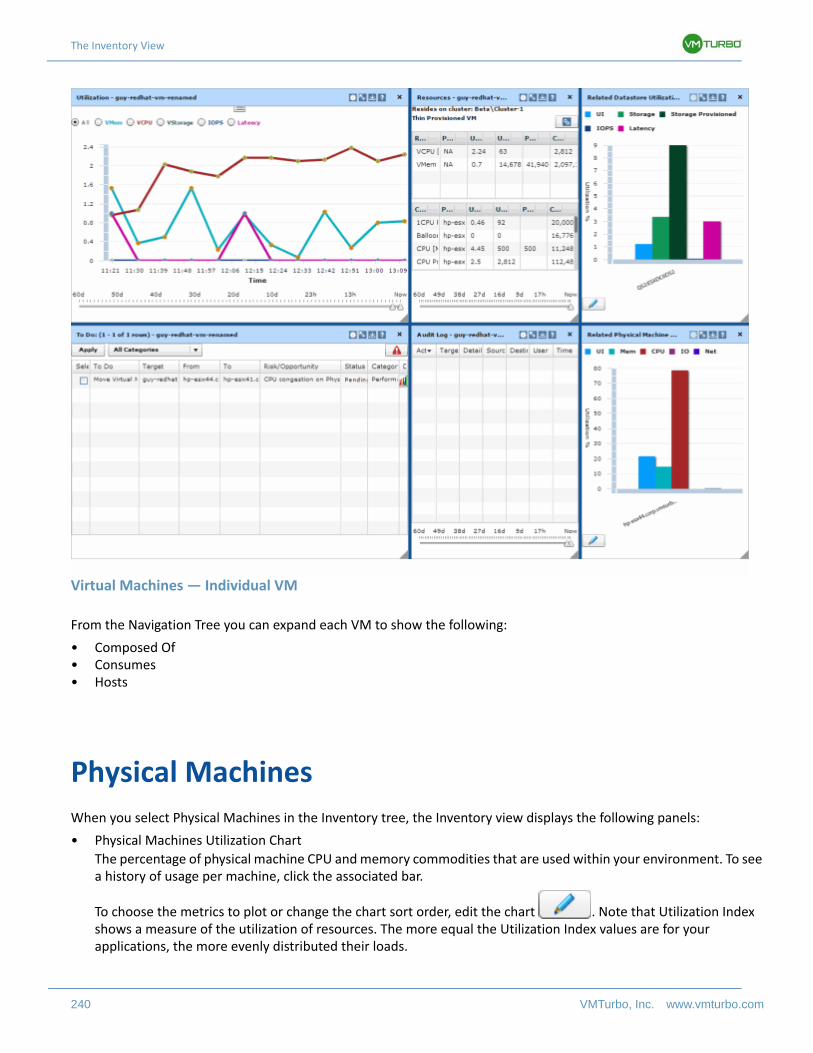
The Inventory View
240 VMTurbo, Inc. www.vmturbo.com
Virtual Machines — Individual VM
From the Navigation Tree you can expand each VM to show the following:
• Composed Of• Consumes• Hosts
Physical Machines
When you select Physical Machines in the Inventory tree, the Inventory view displays the following panels:
• Physical Machines Utilization Chart
The percentage of physical machine CPU and memory commodities that are used within your environment. To see a history of usage per machine, click the associated bar.
To choose the metrics to plot or change the chart sort order, edit the chart . Note that Utilization Index shows a measure of the utilization of resources. The more equal the Utilization Index values are for your applications, the more evenly distributed their loads.
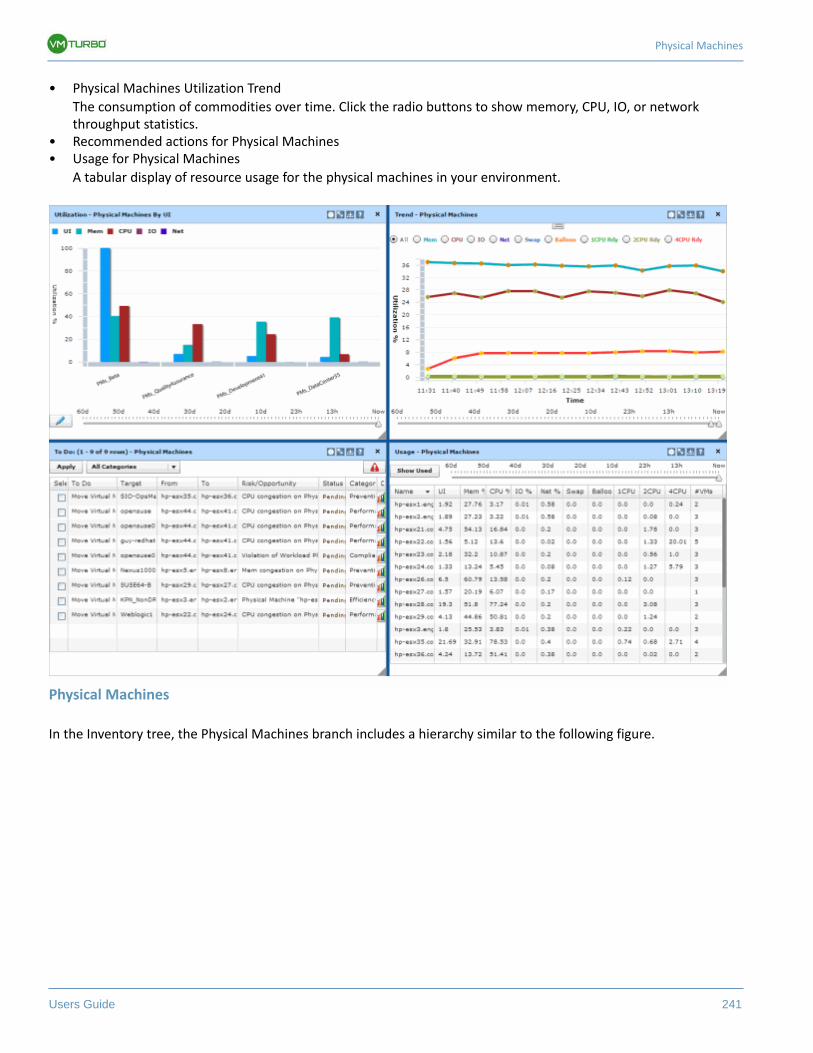
Physical Machines
Users Guide 241
• Physical Machines Utilization Trend
The consumption of commodities over time. Click the radio buttons to show memory, CPU, IO, or network throughput statistics.
• Recommended actions for Physical Machines• Usage for Physical Machines
A tabular display of resource usage for the physical machines in your environment.
Physical Machines
In the Inventory tree, the Physical Machines branch includes a hierarchy similar to the following figure.
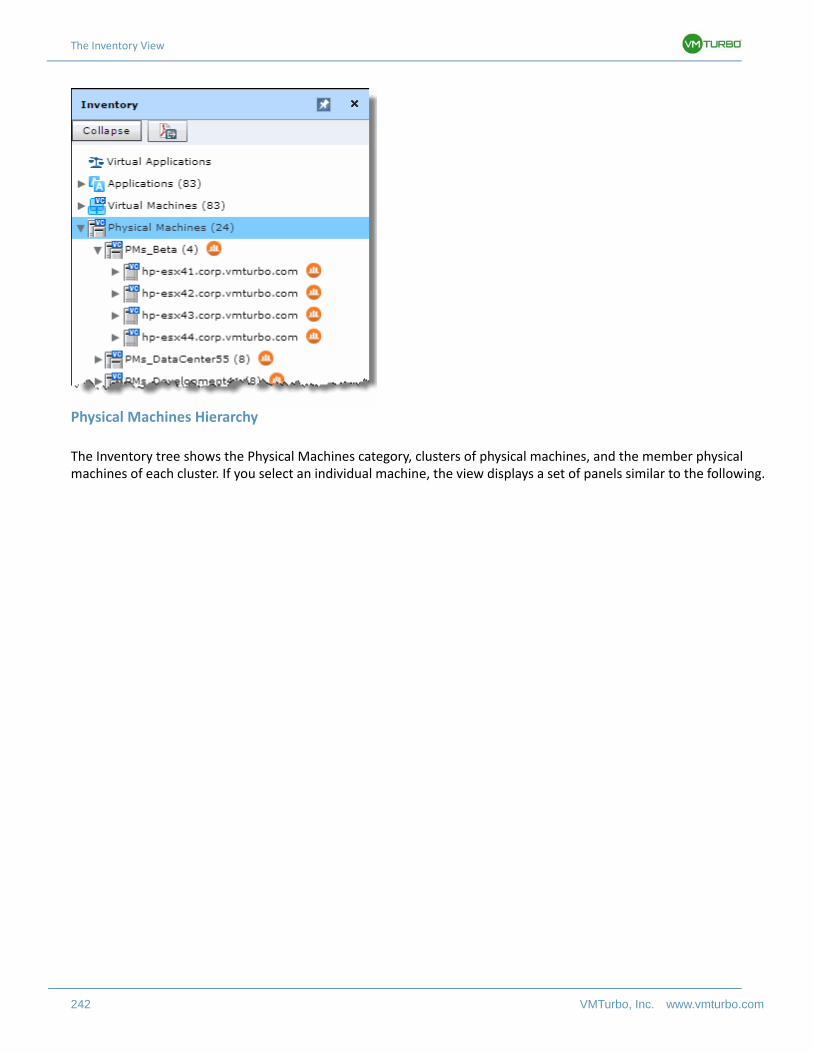
The Inventory View
242 VMTurbo, Inc. www.vmturbo.com
Physical Machines Hierarchy
The Inventory tree shows the Physical Machines category, clusters of physical machines, and the member physical machines of each cluster. If you select an individual machine, the view displays a set of panels similar to the following.
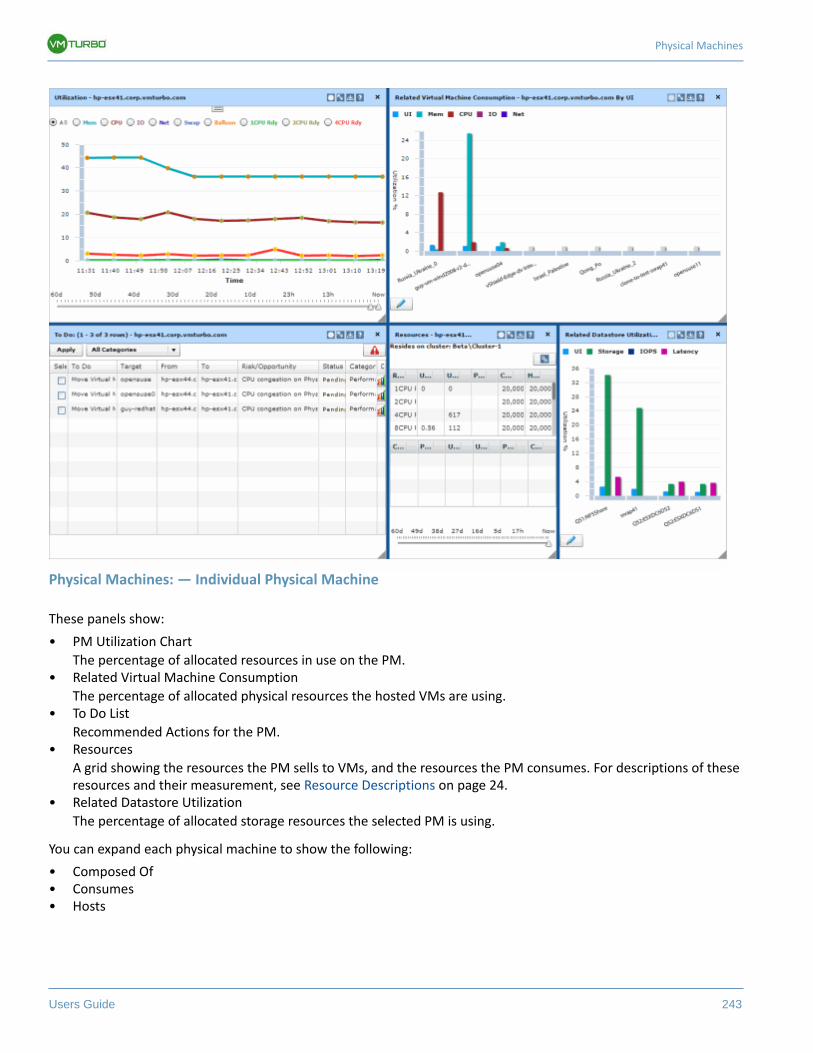
Physical Machines
Users Guide 243
Physical Machines: — Individual Physical Machine
These panels show:
• PM Utilization Chart
The percentage of allocated resources in use on the PM.• Related Virtual Machine Consumption
The percentage of allocated physical resources the hosted VMs are using.• To Do List
Recommended Actions for the PM.• Resources
A grid showing the resources the PM sells to VMs, and the resources the PM consumes. For descriptions of these resources and their measurement, see Resource Descriptions on page 24.
• Related Datastore Utilization
The percentage of allocated storage resources the selected PM is using.
You can expand each physical machine to show the following:
• Composed Of• Consumes• Hosts
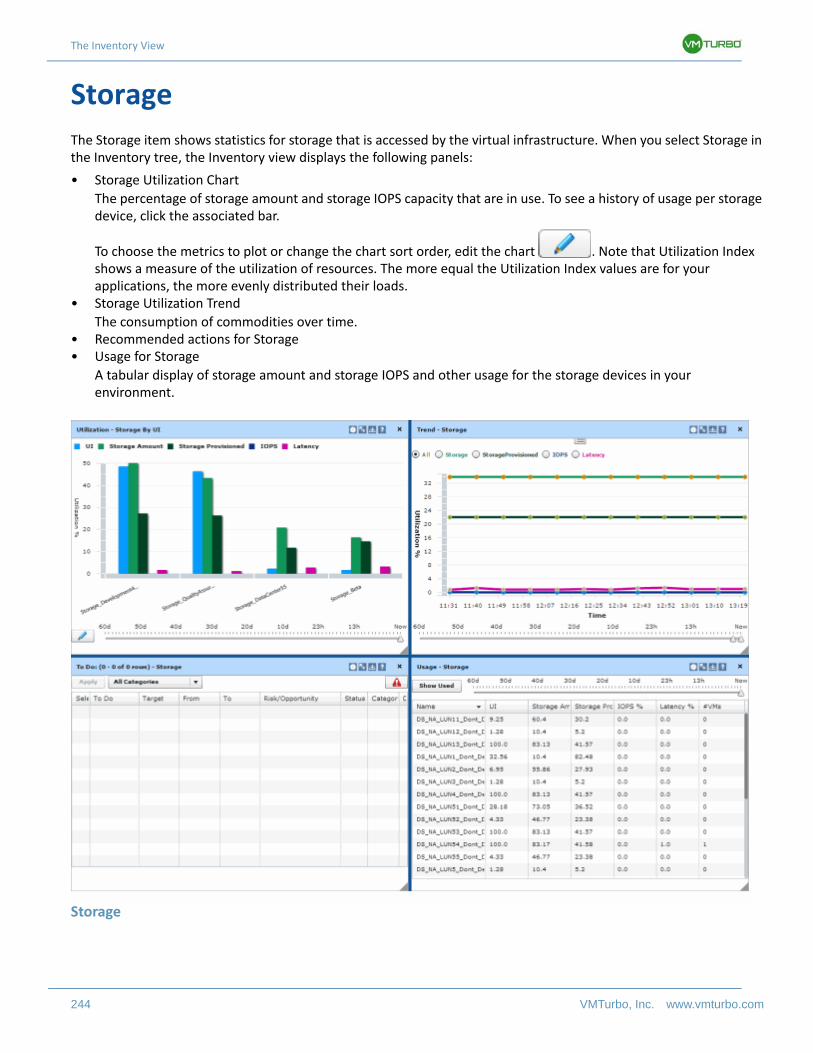
The Inventory View
244 VMTurbo, Inc. www.vmturbo.com
Storage
The Storage item shows statistics for storage that is accessed by the virtual infrastructure. When you select Storage in the Inventory tree, the Inventory view displays the following panels:
• Storage Utilization Chart
The percentage of storage amount and storage IOPS capacity that are in use. To see a history of usage per storage device, click the associated bar.
To choose the metrics to plot or change the chart sort order, edit the chart . Note that Utilization Index shows a measure of the utilization of resources. The more equal the Utilization Index values are for your applications, the more evenly distributed their loads.
• Storage Utilization Trend
The consumption of commodities over time.• Recommended actions for Storage• Usage for Storage
A tabular display of storage amount and storage IOPS and other usage for the storage devices in your environment.
Storage
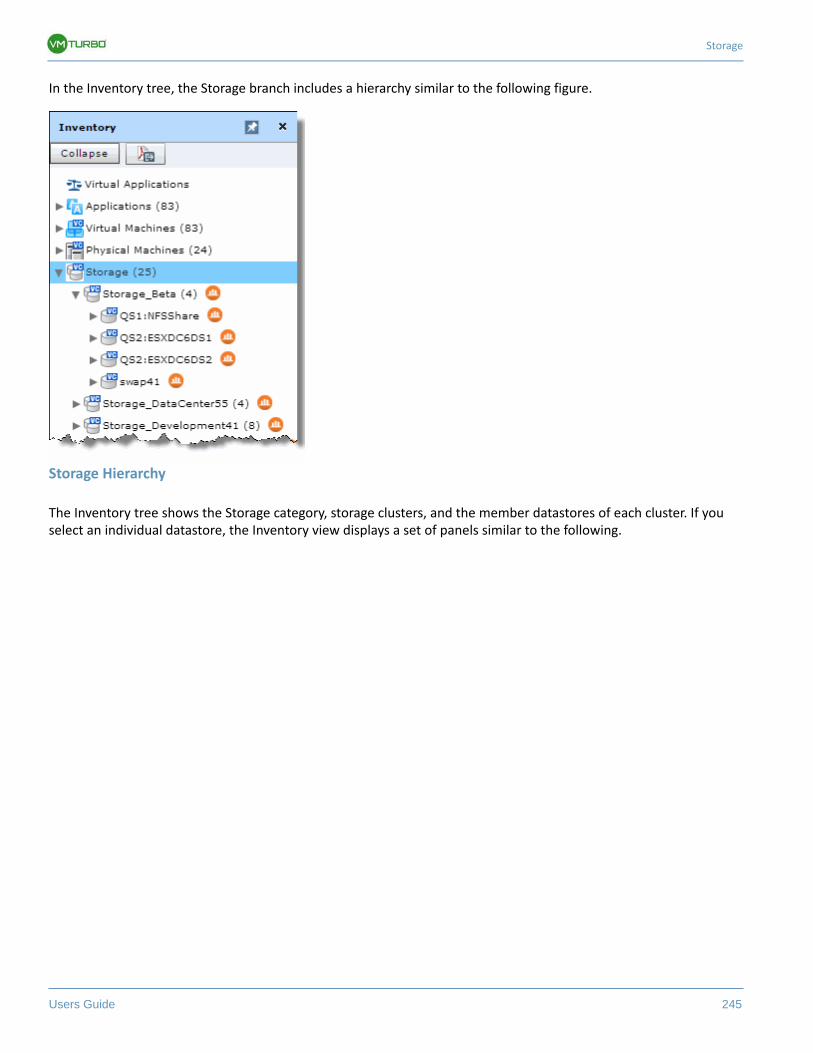
Storage
Users Guide 245
In the Inventory tree, the Storage branch includes a hierarchy similar to the following figure.
Storage Hierarchy
The Inventory tree shows the Storage category, storage clusters, and the member datastores of each cluster. If you select an individual datastore, the Inventory view displays a set of panels similar to the following.
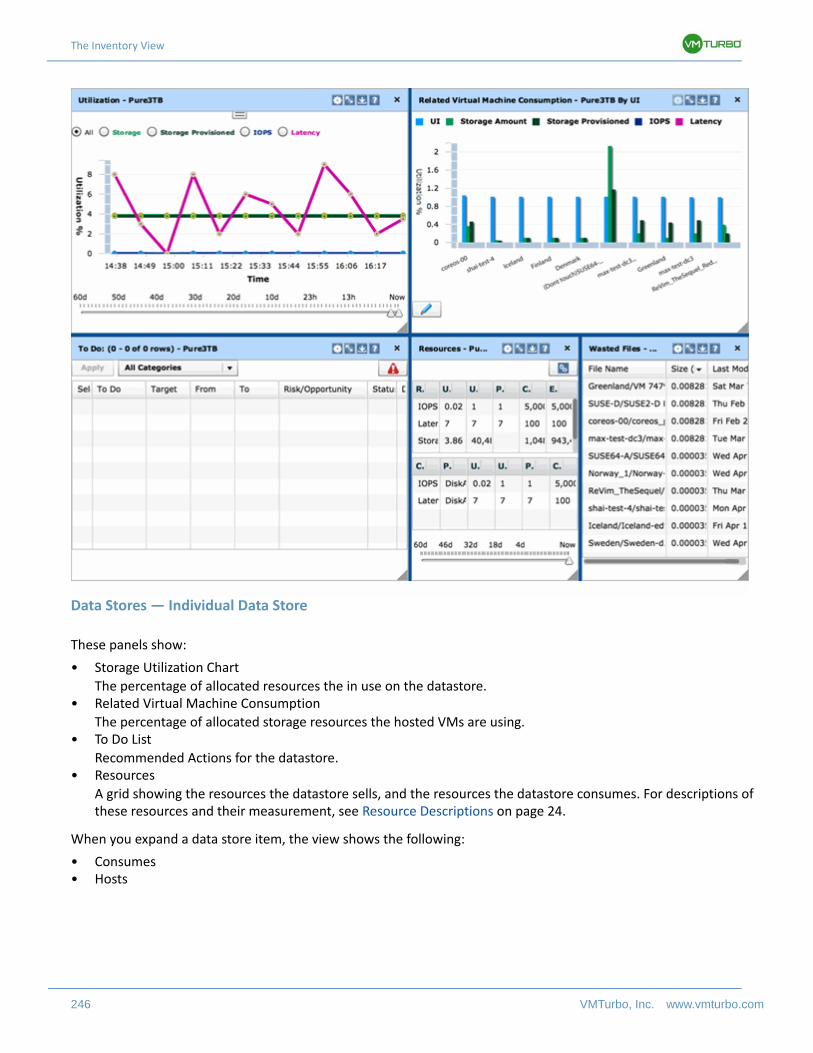
The Inventory View
246 VMTurbo, Inc. www.vmturbo.com
Data Stores — Individual Data Store
These panels show:
• Storage Utilization Chart
The percentage of allocated resources the in use on the datastore.• Related Virtual Machine Consumption
The percentage of allocated storage resources the hosted VMs are using.• To Do List
Recommended Actions for the datastore.• Resources
A grid showing the resources the datastore sells, and the resources the datastore consumes. For descriptions of these resources and their measurement, see Resource Descriptions on page 24.
When you expand a data store item, the view shows the following:
• Consumes• Hosts
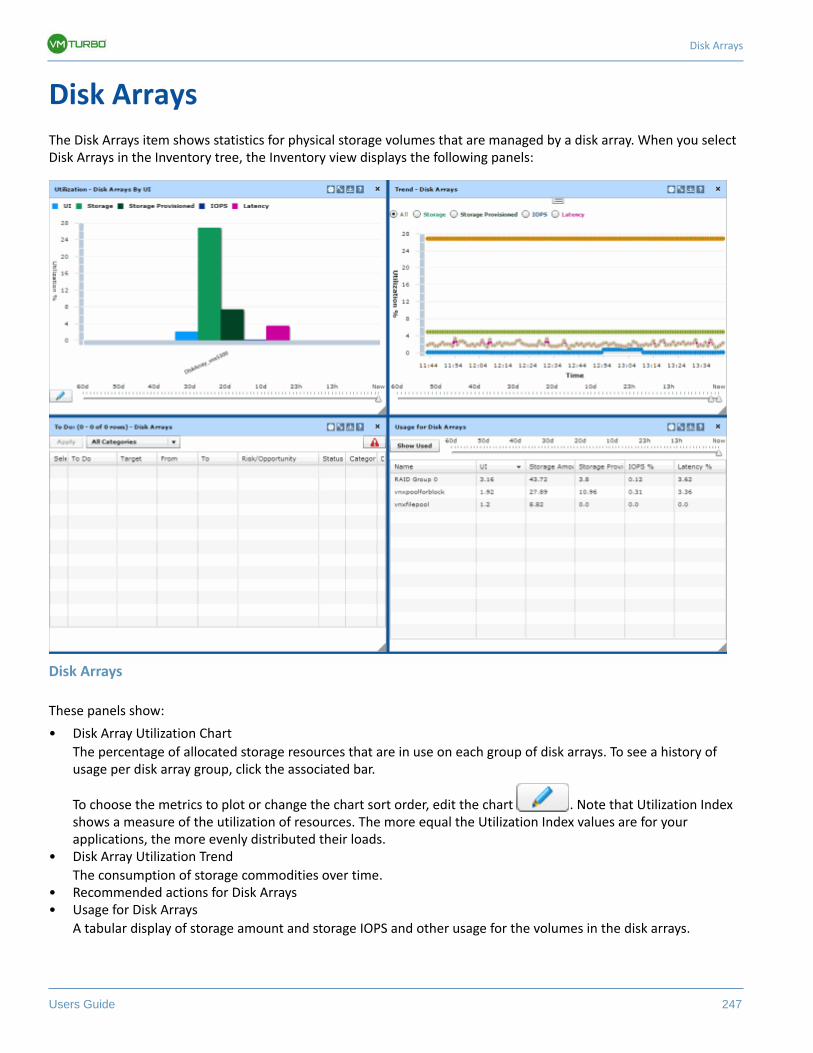
Disk Arrays
Users Guide 247
Disk Arrays
The Disk Arrays item shows statistics for physical storage volumes that are managed by a disk array. When you select Disk Arrays in the Inventory tree, the Inventory view displays the following panels:
Disk Arrays
These panels show:
• Disk Array Utilization Chart
The percentage of allocated storage resources that are in use on each group of disk arrays. To see a history of usage per disk array group, click the associated bar.
To choose the metrics to plot or change the chart sort order, edit the chart . Note that Utilization Index shows a measure of the utilization of resources. The more equal the Utilization Index values are for your applications, the more evenly distributed their loads.
• Disk Array Utilization Trend
The consumption of storage commodities over time.• Recommended actions for Disk Arrays• Usage for Disk Arrays
A tabular display of storage amount and storage IOPS and other usage for the volumes in the disk arrays.
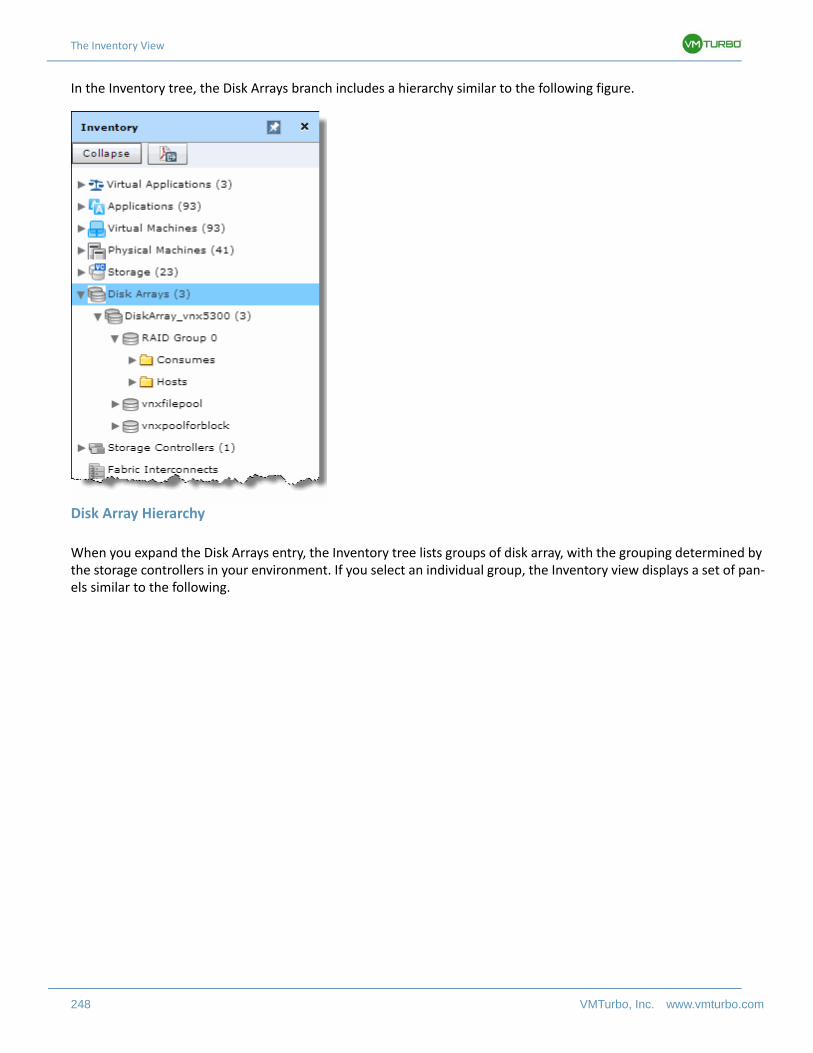
The Inventory View
248 VMTurbo, Inc. www.vmturbo.com
In the Inventory tree, the Disk Arrays branch includes a hierarchy similar to the following figure.
Disk Array Hierarchy
When you expand the Disk Arrays entry, the Inventory tree lists groups of disk array, with the grouping determined by the storage controllers in your environment. If you select an individual group, the Inventory view displays a set of pan-els similar to the following.
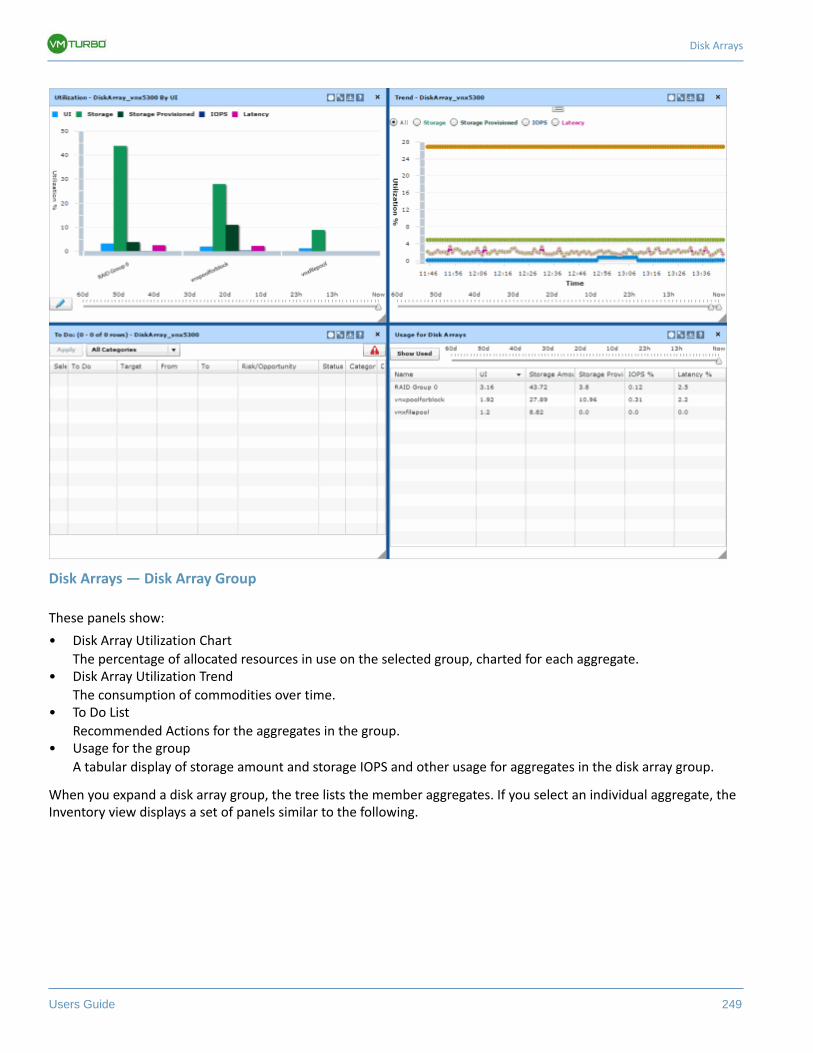
Disk Arrays
Users Guide 249
Disk Arrays — Disk Array Group
These panels show:
• Disk Array Utilization Chart
The percentage of allocated resources in use on the selected group, charted for each aggregate.• Disk Array Utilization Trend
The consumption of commodities over time.• To Do List
Recommended Actions for the aggregates in the group.• Usage for the group
A tabular display of storage amount and storage IOPS and other usage for aggregates in the disk array group.
When you expand a disk array group, the tree lists the member aggregates. If you select an individual aggregate, the Inventory view displays a set of panels similar to the following.
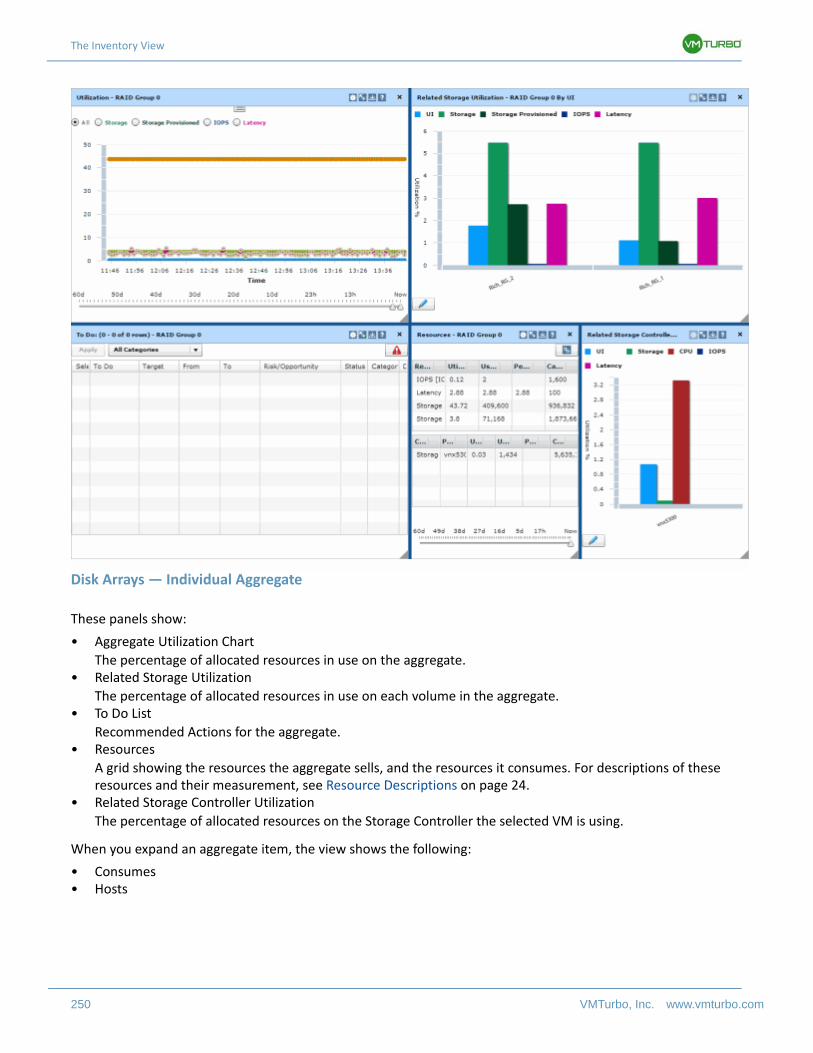
The Inventory View
250 VMTurbo, Inc. www.vmturbo.com
Disk Arrays — Individual Aggregate
These panels show:
• Aggregate Utilization Chart
The percentage of allocated resources in use on the aggregate.• Related Storage Utilization
The percentage of allocated resources in use on each volume in the aggregate.• To Do List
Recommended Actions for the aggregate.• Resources
A grid showing the resources the aggregate sells, and the resources it consumes. For descriptions of these resources and their measurement, see Resource Descriptions on page 24.
• Related Storage Controller Utilization
The percentage of allocated resources on the Storage Controller the selected VM is using.
When you expand an aggregate item, the view shows the following:
• Consumes• Hosts
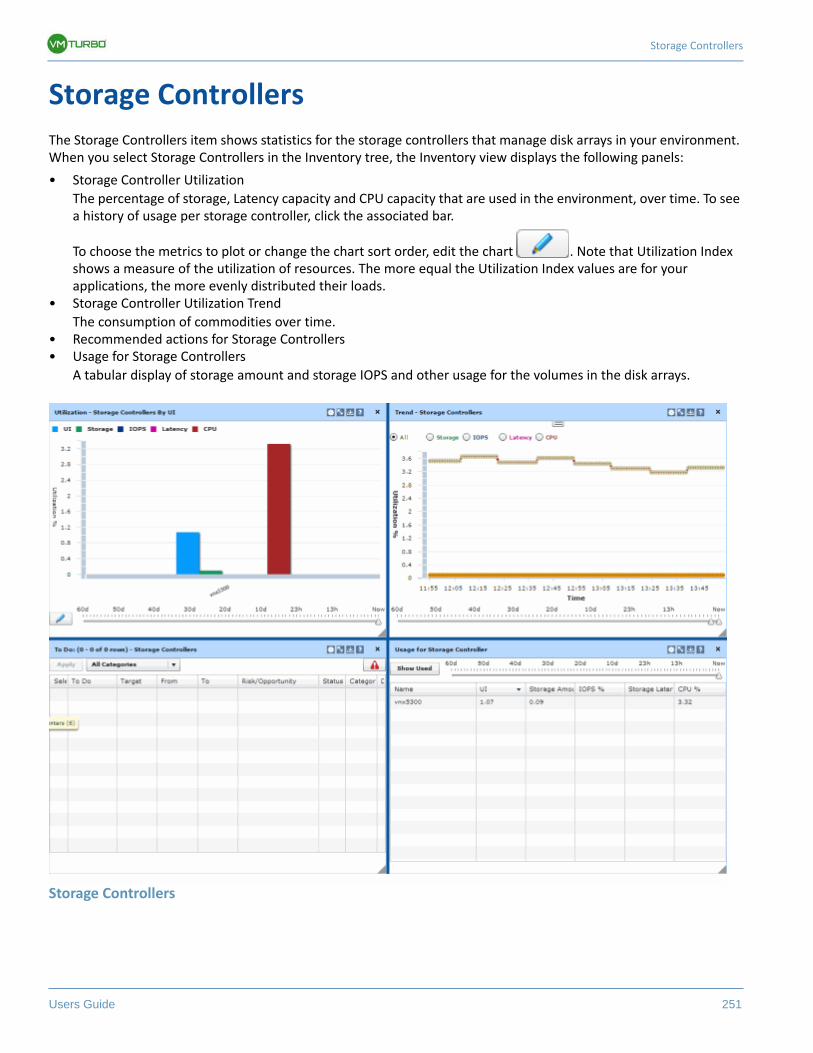
Storage Controllers
Users Guide 251
Storage Controllers
The Storage Controllers item shows statistics for the storage controllers that manage disk arrays in your environment. When you select Storage Controllers in the Inventory tree, the Inventory view displays the following panels:
• Storage Controller Utilization
The percentage of storage, Latency capacity and CPU capacity that are used in the environment, over time. To see a history of usage per storage controller, click the associated bar.
To choose the metrics to plot or change the chart sort order, edit the chart . Note that Utilization Index shows a measure of the utilization of resources. The more equal the Utilization Index values are for your applications, the more evenly distributed their loads.
• Storage Controller Utilization Trend
The consumption of commodities over time.• Recommended actions for Storage Controllers• Usage for Storage Controllers
A tabular display of storage amount and storage IOPS and other usage for the volumes in the disk arrays.
Storage Controllers
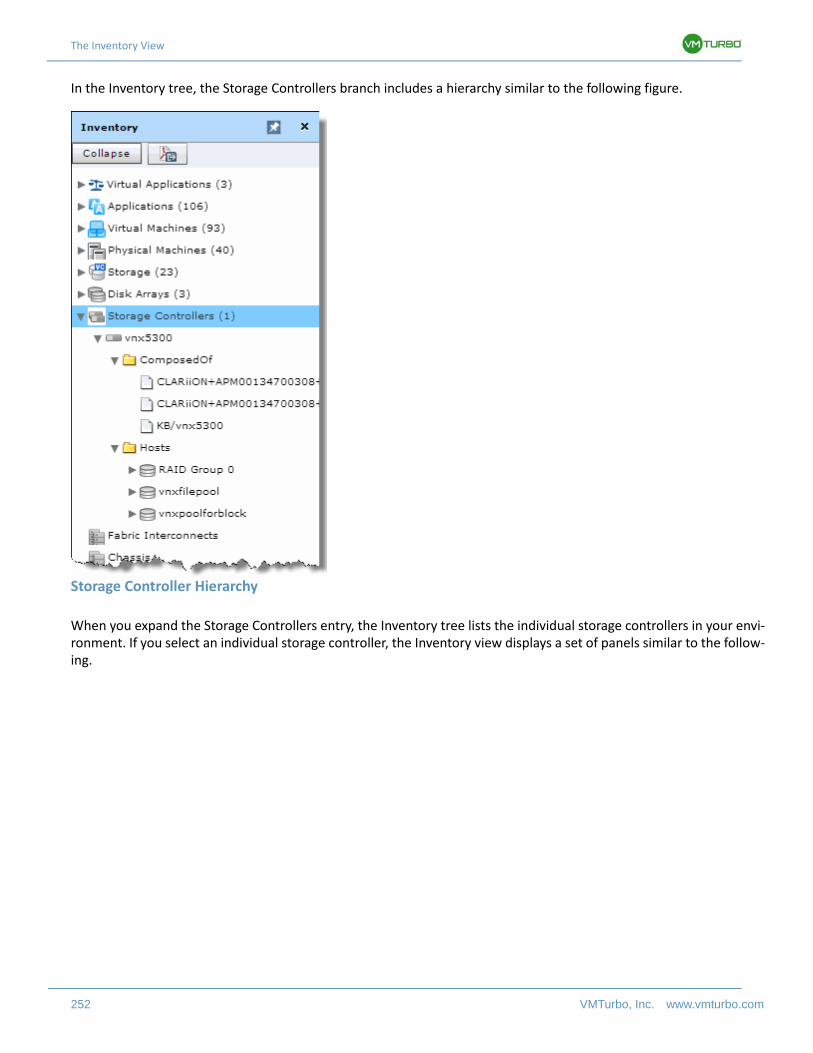
The Inventory View
252 VMTurbo, Inc. www.vmturbo.com
In the Inventory tree, the Storage Controllers branch includes a hierarchy similar to the following figure.
Storage Controller Hierarchy
When you expand the Storage Controllers entry, the Inventory tree lists the individual storage controllers in your envi-ronment. If you select an individual storage controller, the Inventory view displays a set of panels similar to the follow-ing.
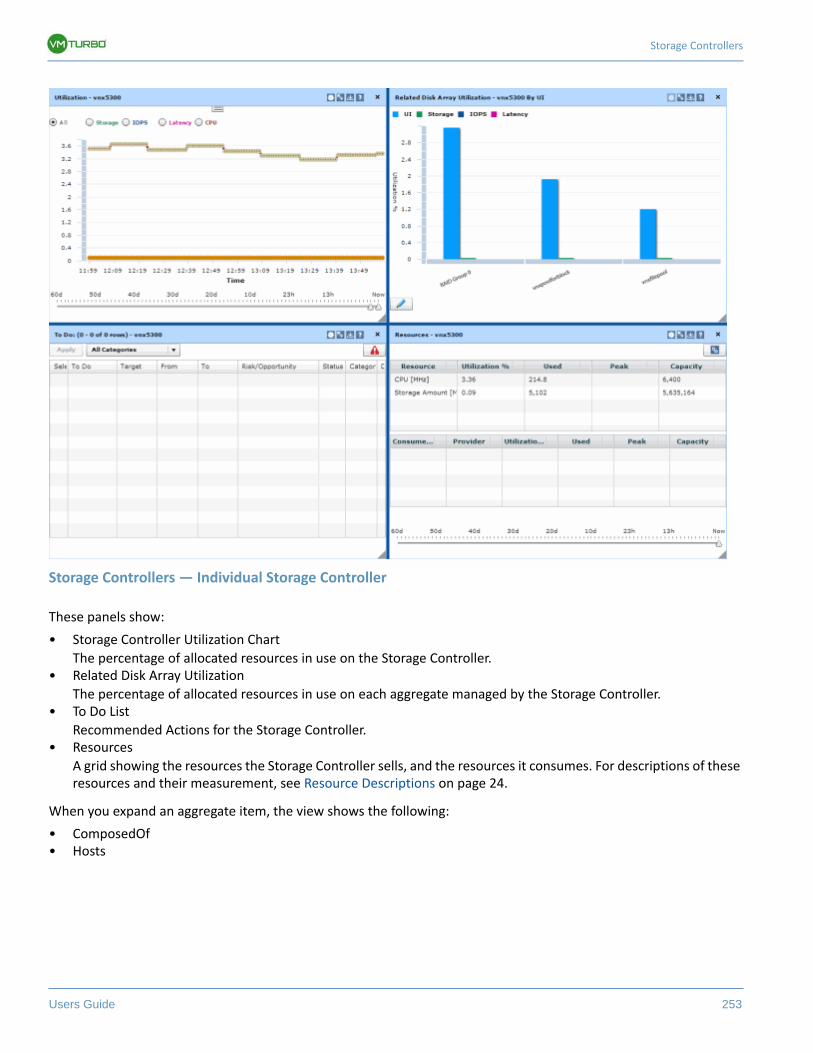
Storage Controllers
Users Guide 253
Storage Controllers — Individual Storage Controller
These panels show:
• Storage Controller Utilization Chart
The percentage of allocated resources in use on the Storage Controller.• Related Disk Array Utilization
The percentage of allocated resources in use on each aggregate managed by the Storage Controller.• To Do List
Recommended Actions for the Storage Controller.• Resources
A grid showing the resources the Storage Controller sells, and the resources it consumes. For descriptions of these resources and their measurement, see Resource Descriptions on page 24.
When you expand an aggregate item, the view shows the following:
• ComposedOf• Hosts
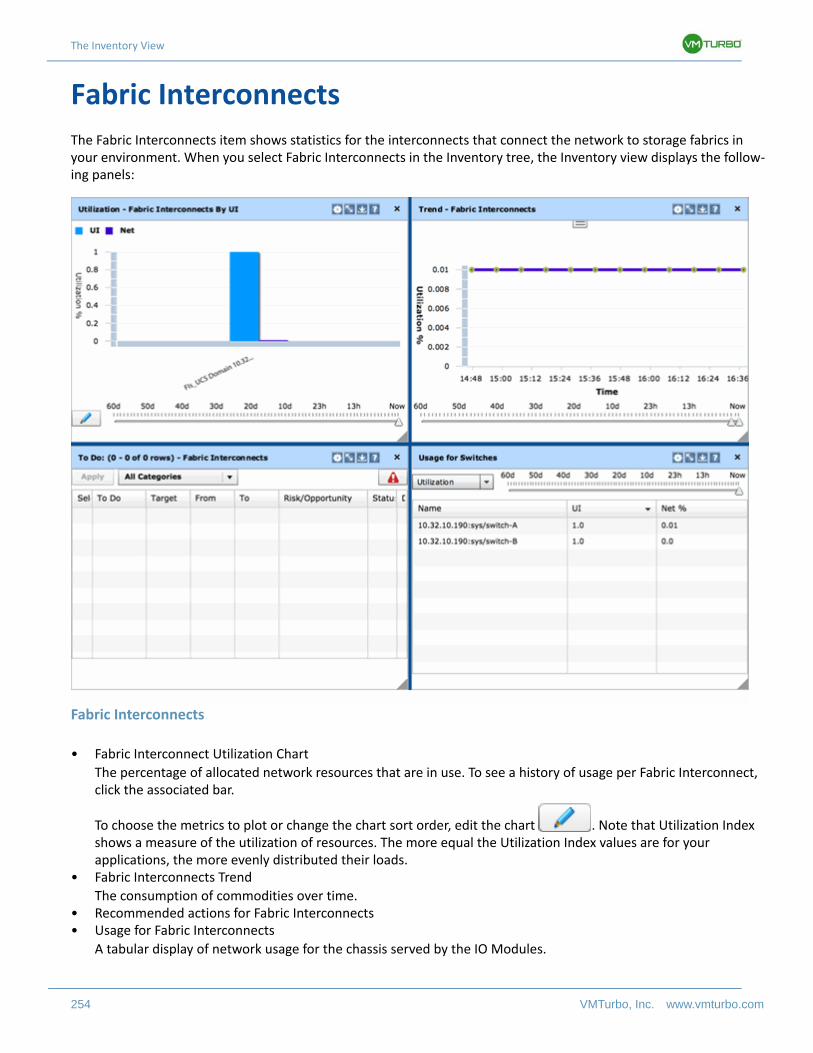
The Inventory View
254 VMTurbo, Inc. www.vmturbo.com
Fabric Interconnects
The Fabric Interconnects item shows statistics for the interconnects that connect the network to storage fabrics in your environment. When you select Fabric Interconnects in the Inventory tree, the Inventory view displays the follow-ing panels:
Fabric Interconnects
• Fabric Interconnect Utilization Chart
The percentage of allocated network resources that are in use. To see a history of usage per Fabric Interconnect, click the associated bar.
To choose the metrics to plot or change the chart sort order, edit the chart . Note that Utilization Index shows a measure of the utilization of resources. The more equal the Utilization Index values are for your applications, the more evenly distributed their loads.
• Fabric Interconnects Trend
The consumption of commodities over time.• Recommended actions for Fabric Interconnects• Usage for Fabric Interconnects
A tabular display of network usage for the chassis served by the IO Modules.
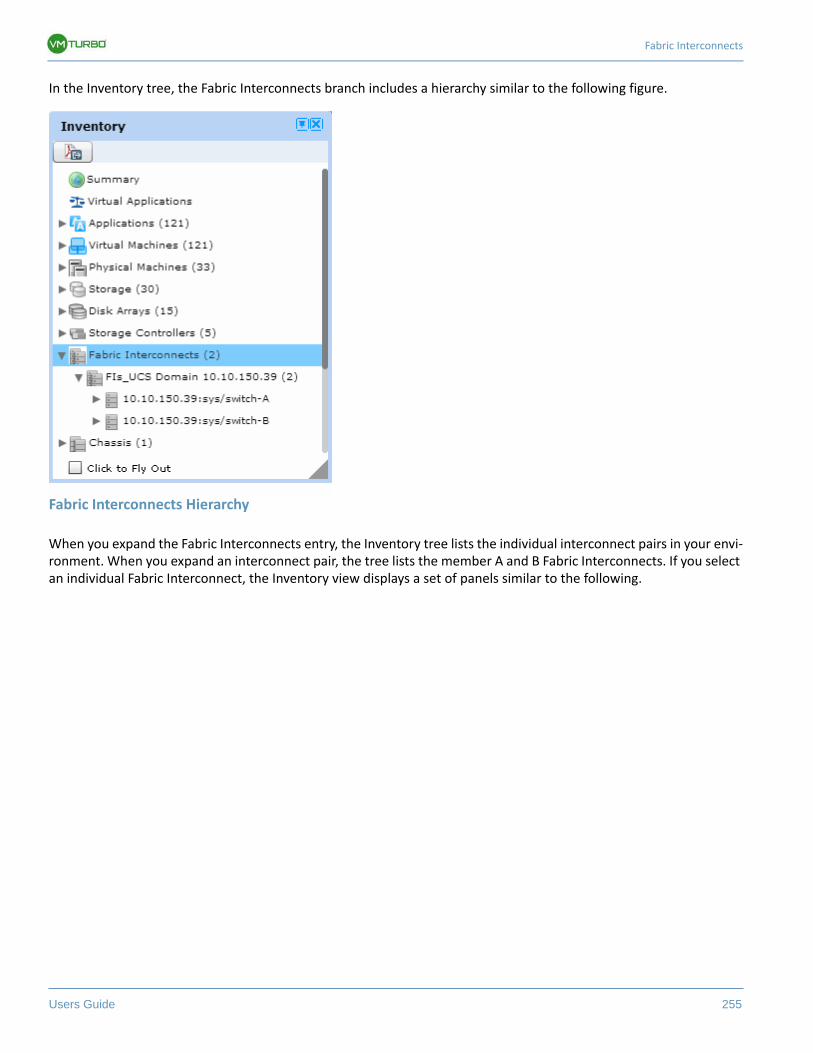
Fabric Interconnects
Users Guide 255
In the Inventory tree, the Fabric Interconnects branch includes a hierarchy similar to the following figure.
Fabric Interconnects Hierarchy
When you expand the Fabric Interconnects entry, the Inventory tree lists the individual interconnect pairs in your envi-ronment. When you expand an interconnect pair, the tree lists the member A and B Fabric Interconnects. If you select an individual Fabric Interconnect, the Inventory view displays a set of panels similar to the following.
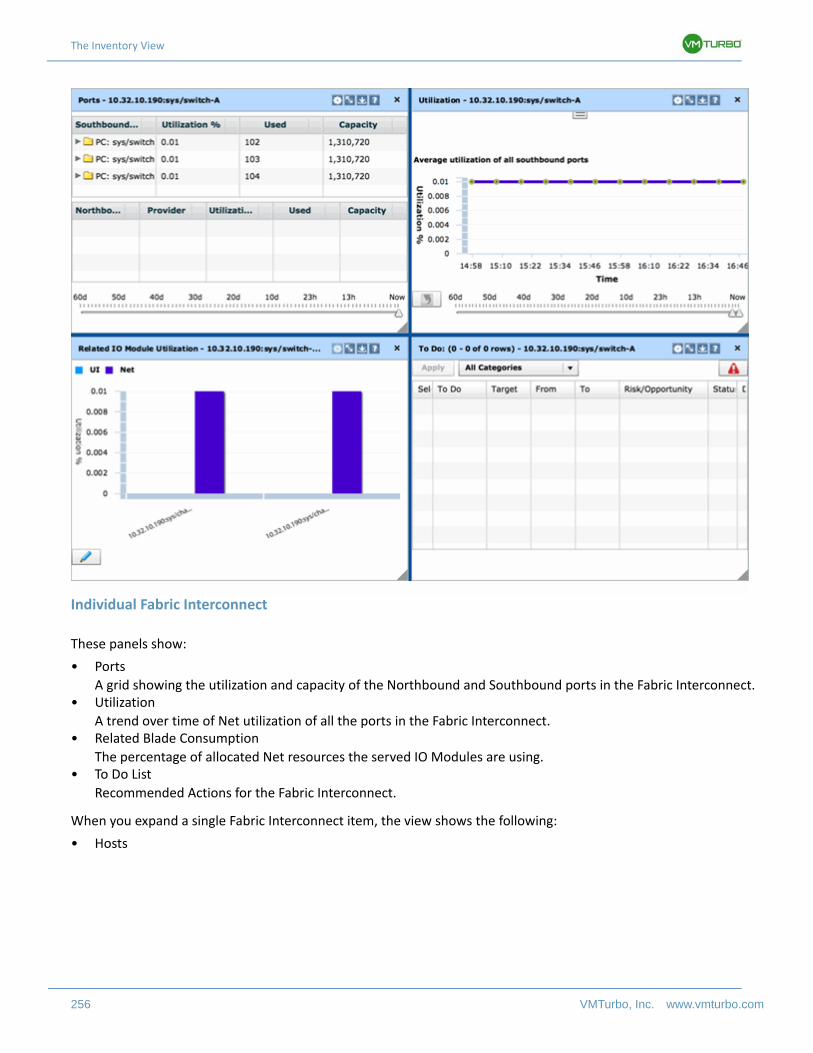
The Inventory View
256 VMTurbo, Inc. www.vmturbo.com
Individual Fabric Interconnect
These panels show:
• Ports
A grid showing the utilization and capacity of the Northbound and Southbound ports in the Fabric Interconnect.• Utilization
A trend over time of Net utilization of all the ports in the Fabric Interconnect.• Related Blade Consumption
The percentage of allocated Net resources the served IO Modules are using.• To Do List
Recommended Actions for the Fabric Interconnect.
When you expand a single Fabric Interconnect item, the view shows the following:
• Hosts
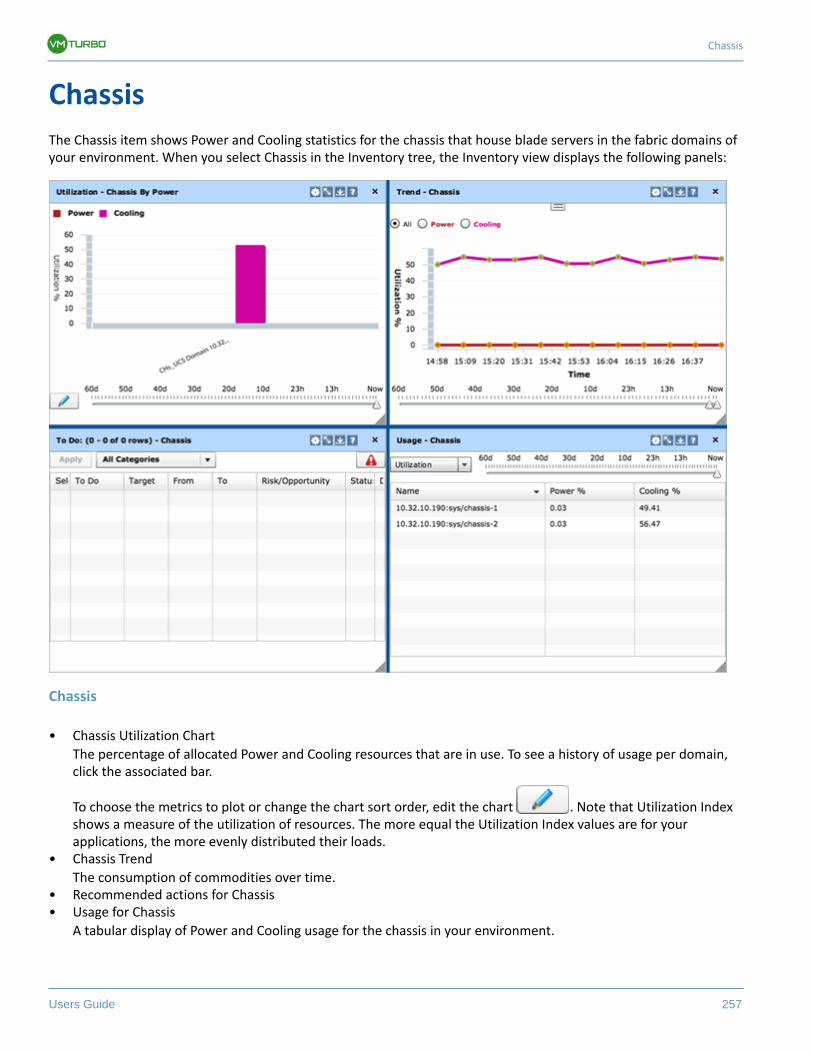
Chassis
Users Guide 257
Chassis
The Chassis item shows Power and Cooling statistics for the chassis that house blade servers in the fabric domains of your environment. When you select Chassis in the Inventory tree, the Inventory view displays the following panels:
Chassis
• Chassis Utilization Chart
The percentage of allocated Power and Cooling resources that are in use. To see a history of usage per domain, click the associated bar.
To choose the metrics to plot or change the chart sort order, edit the chart . Note that Utilization Index shows a measure of the utilization of resources. The more equal the Utilization Index values are for your applications, the more evenly distributed their loads.
• Chassis Trend
The consumption of commodities over time.• Recommended actions for Chassis• Usage for Chassis
A tabular display of Power and Cooling usage for the chassis in your environment.
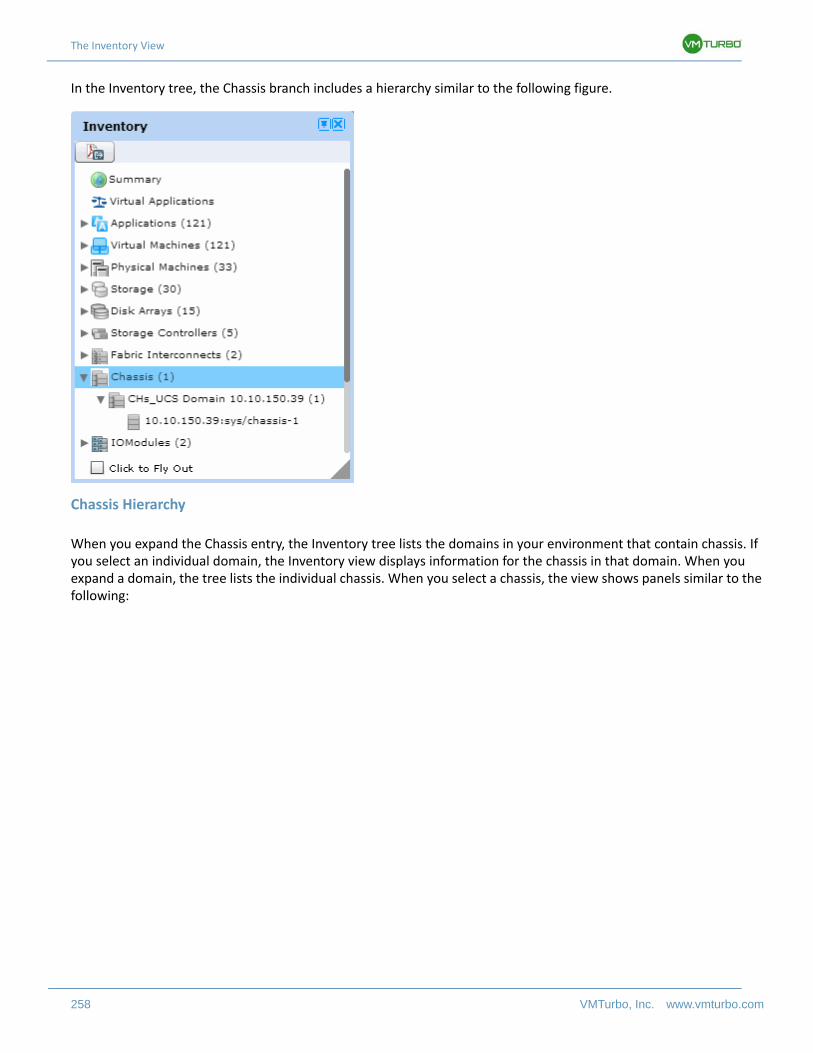
The Inventory View
258 VMTurbo, Inc. www.vmturbo.com
In the Inventory tree, the Chassis branch includes a hierarchy similar to the following figure.
Chassis Hierarchy
When you expand the Chassis entry, the Inventory tree lists the domains in your environment that contain chassis. If you select an individual domain, the Inventory view displays information for the chassis in that domain. When you expand a domain, the tree lists the individual chassis. When you select a chassis, the view shows panels similar to the following:
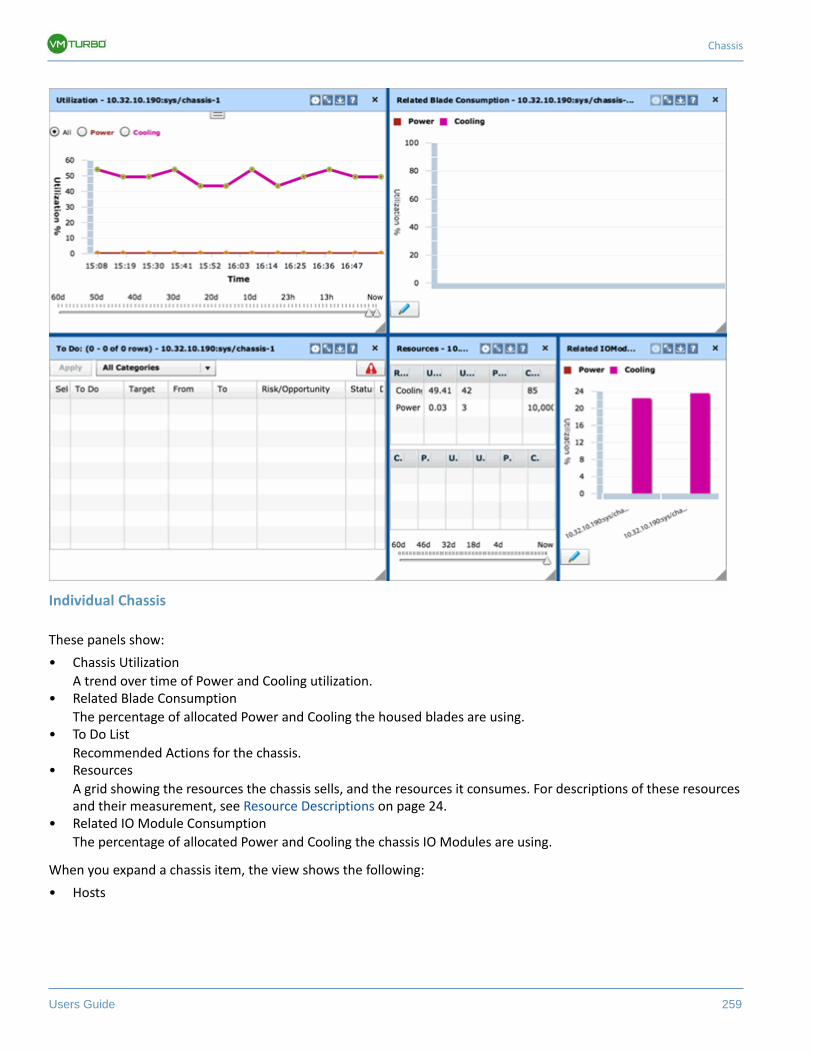
Chassis
Users Guide 259
Individual Chassis
These panels show:
• Chassis Utilization
A trend over time of Power and Cooling utilization.• Related Blade Consumption
The percentage of allocated Power and Cooling the housed blades are using.• To Do List
Recommended Actions for the chassis.• Resources
A grid showing the resources the chassis sells, and the resources it consumes. For descriptions of these resources and their measurement, see Resource Descriptions on page 24.
• Related IO Module Consumption
The percentage of allocated Power and Cooling the chassis IO Modules are using.
When you expand a chassis item, the view shows the following:
• Hosts
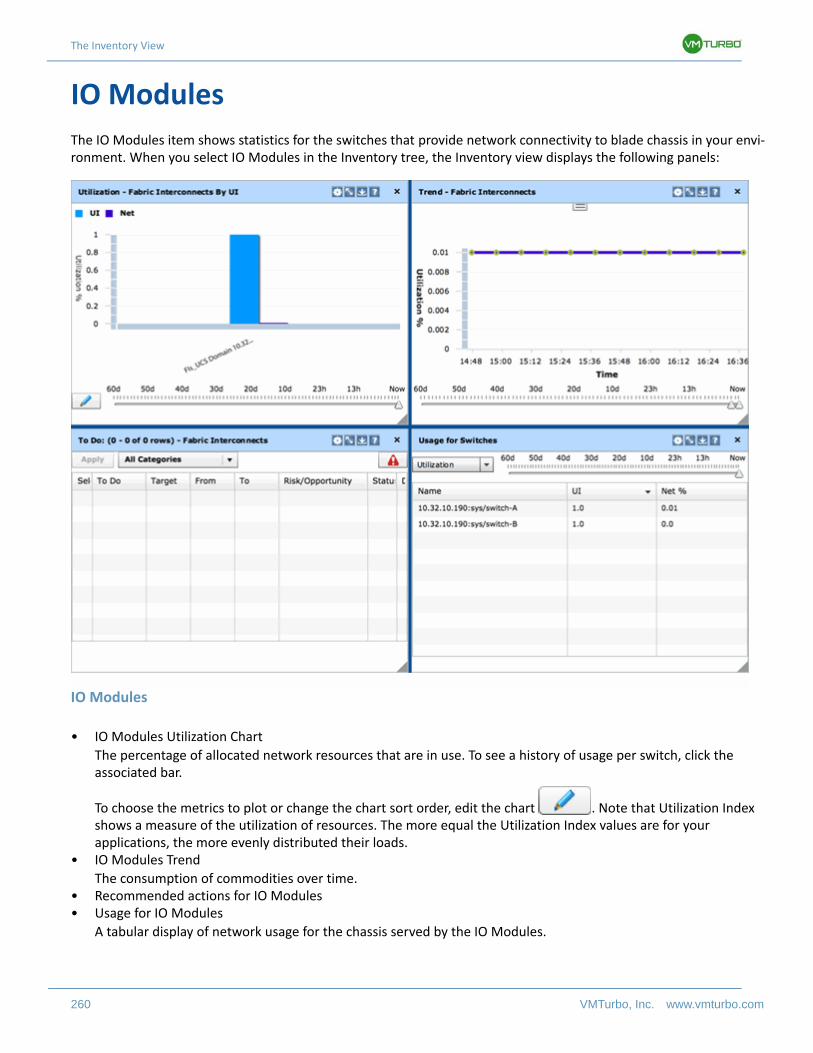
The Inventory View
260 VMTurbo, Inc. www.vmturbo.com
IO Modules
The IO Modules item shows statistics for the switches that provide network connectivity to blade chassis in your envi-ronment. When you select IO Modules in the Inventory tree, the Inventory view displays the following panels:
IO Modules
• IO Modules Utilization Chart
The percentage of allocated network resources that are in use. To see a history of usage per switch, click the associated bar.
To choose the metrics to plot or change the chart sort order, edit the chart . Note that Utilization Index shows a measure of the utilization of resources. The more equal the Utilization Index values are for your applications, the more evenly distributed their loads.
• IO Modules Trend
The consumption of commodities over time.• Recommended actions for IO Modules• Usage for IO Modules
A tabular display of network usage for the chassis served by the IO Modules.
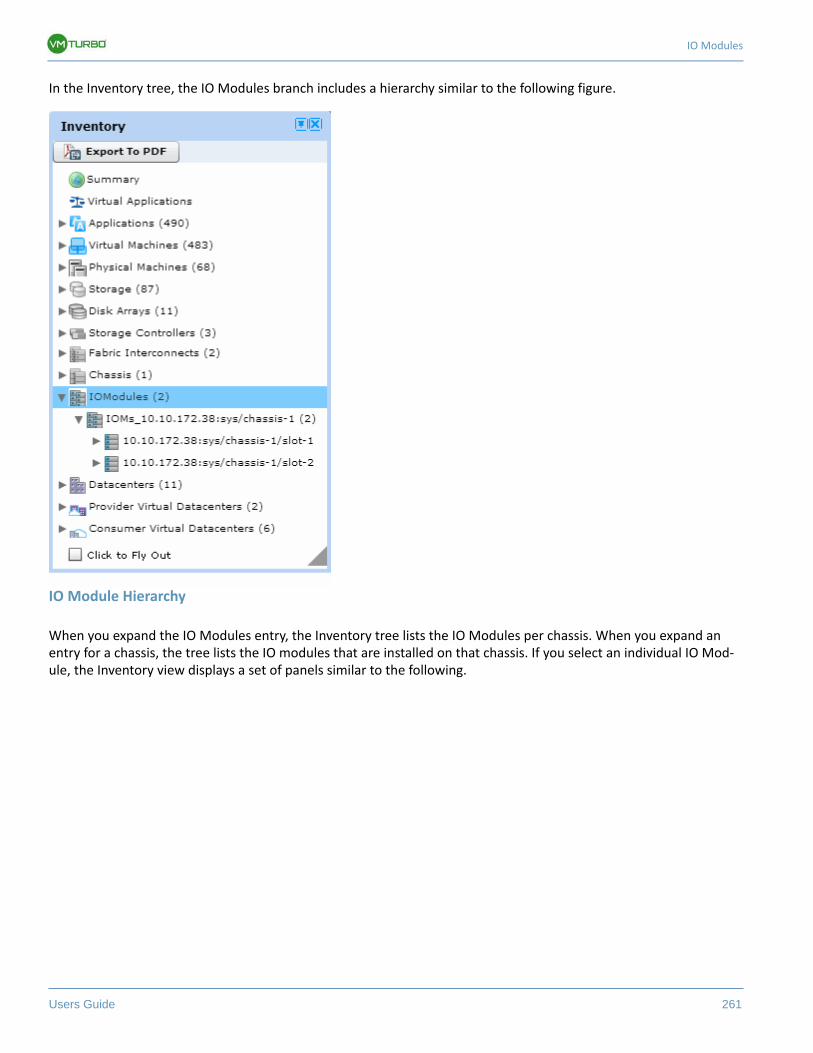
IO Modules
Users Guide 261
In the Inventory tree, the IO Modules branch includes a hierarchy similar to the following figure.
IO Module Hierarchy
When you expand the IO Modules entry, the Inventory tree lists the IO Modules per chassis. When you expand an entry for a chassis, the tree lists the IO modules that are installed on that chassis. If you select an individual IO Mod-ule, the Inventory view displays a set of panels similar to the following.
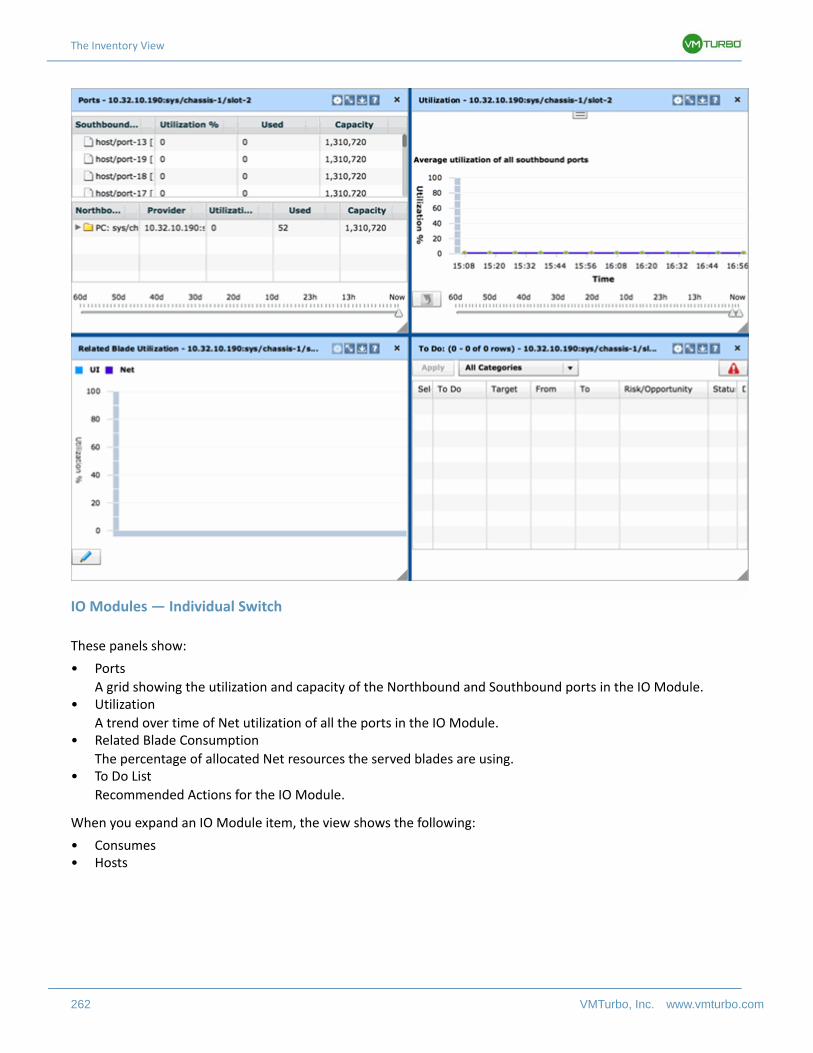
The Inventory View
262 VMTurbo, Inc. www.vmturbo.com
IO Modules — Individual Switch
These panels show:
• Ports
A grid showing the utilization and capacity of the Northbound and Southbound ports in the IO Module.• Utilization
A trend over time of Net utilization of all the ports in the IO Module.• Related Blade Consumption
The percentage of allocated Net resources the served blades are using.• To Do List
Recommended Actions for the IO Module.
When you expand an IO Module item, the view shows the following:
• Consumes• Hosts
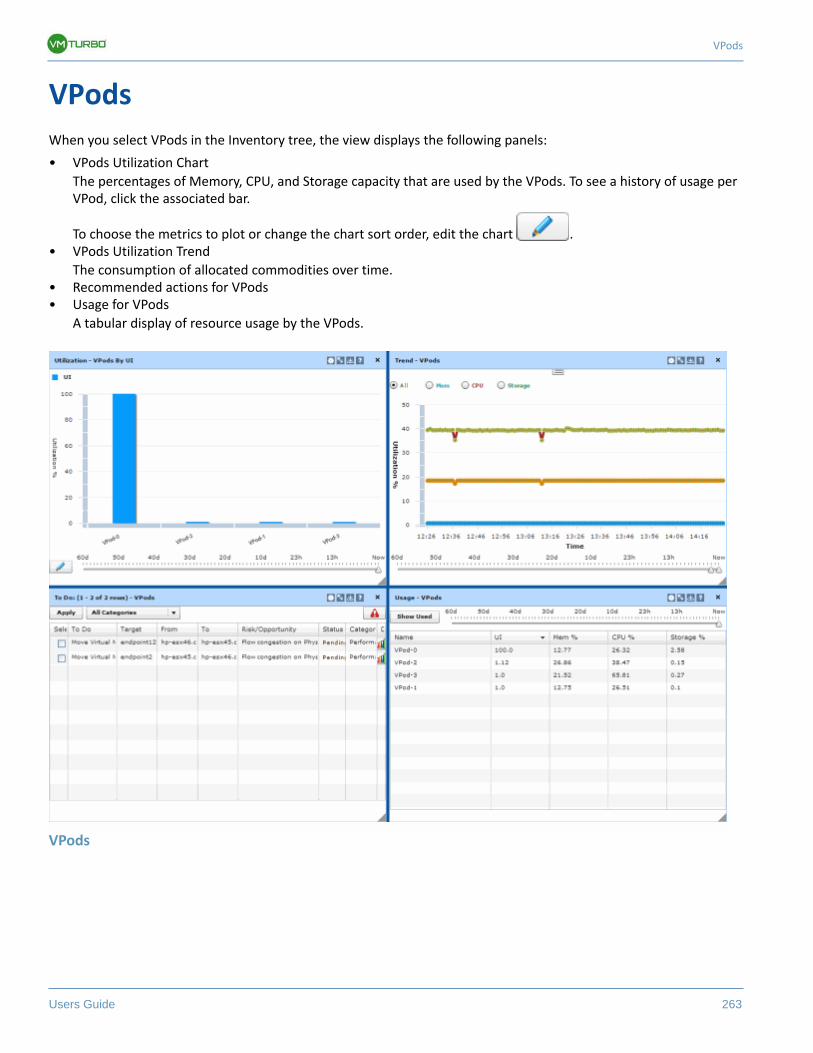
VPods
Users Guide 263
VPods
When you select VPods in the Inventory tree, the view displays the following panels:
• VPods Utilization Chart
The percentages of Memory, CPU, and Storage capacity that are used by the VPods. To see a history of usage per VPod, click the associated bar.
To choose the metrics to plot or change the chart sort order, edit the chart .• VPods Utilization Trend
The consumption of allocated commodities over time.• Recommended actions for VPods• Usage for VPods
A tabular display of resource usage by the VPods.
VPods
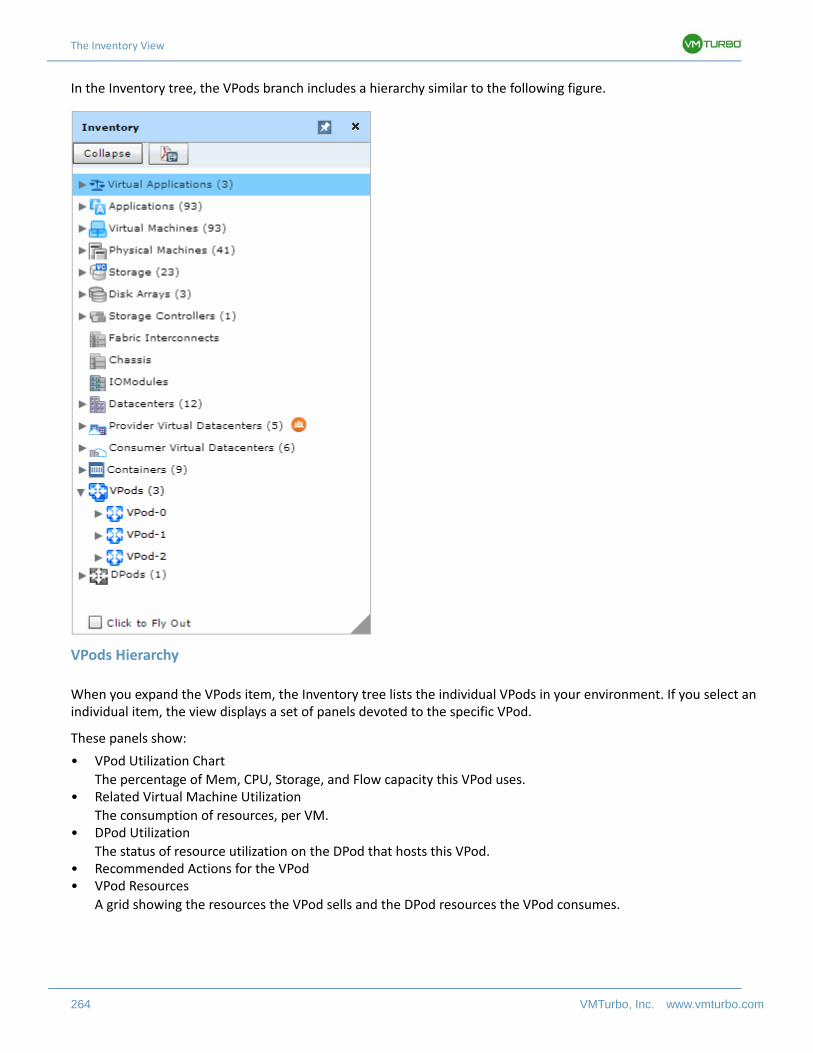
The Inventory View
264 VMTurbo, Inc. www.vmturbo.com
In the Inventory tree, the VPods branch includes a hierarchy similar to the following figure.
VPods Hierarchy
When you expand the VPods item, the Inventory tree lists the individual VPods in your environment. If you select an individual item, the view displays a set of panels devoted to the specific VPod.
These panels show:
• VPod Utilization Chart
The percentage of Mem, CPU, Storage, and Flow capacity this VPod uses.• Related Virtual Machine Utilization
The consumption of resources, per VM.• DPod Utilization
The status of resource utilization on the DPod that hosts this VPod.• Recommended Actions for the VPod• VPod Resources
A grid showing the resources the VPod sells and the DPod resources the VPod consumes.
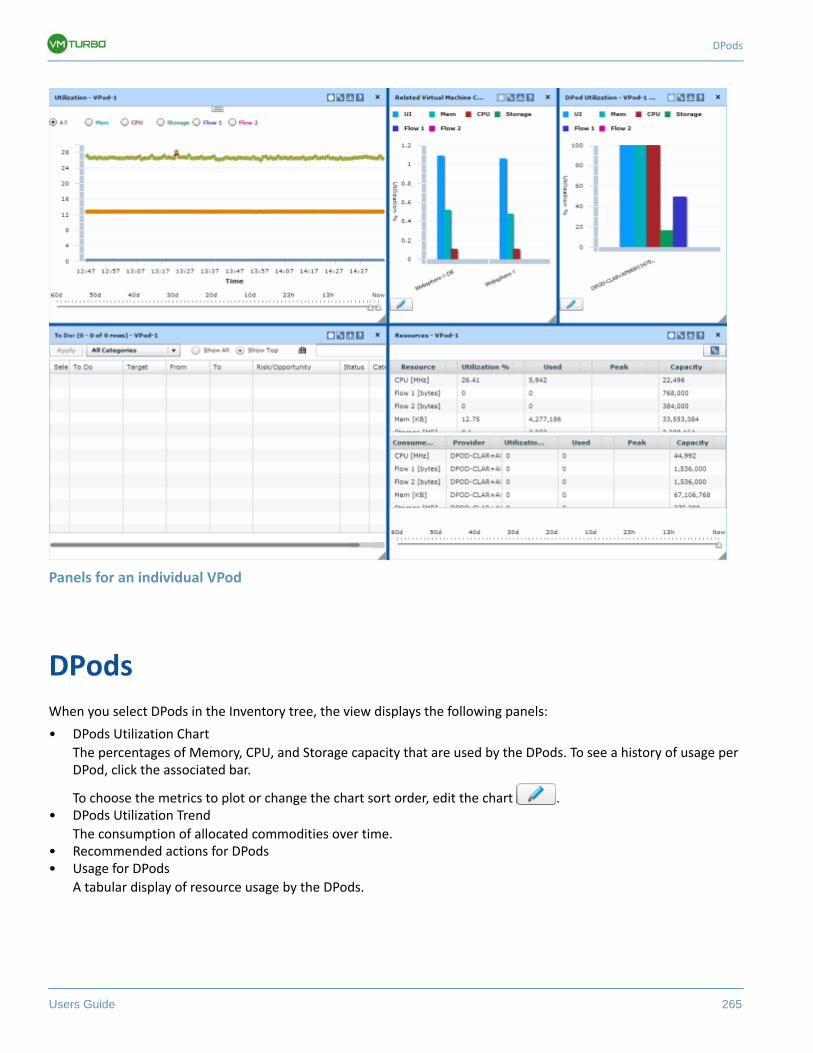
DPods
Users Guide 265
Panels for an individual VPod
DPods
When you select DPods in the Inventory tree, the view displays the following panels:
• DPods Utilization Chart
The percentages of Memory, CPU, and Storage capacity that are used by the DPods. To see a history of usage per DPod, click the associated bar.
To choose the metrics to plot or change the chart sort order, edit the chart .• DPods Utilization Trend
The consumption of allocated commodities over time.• Recommended actions for DPods• Usage for DPods
A tabular display of resource usage by the DPods.
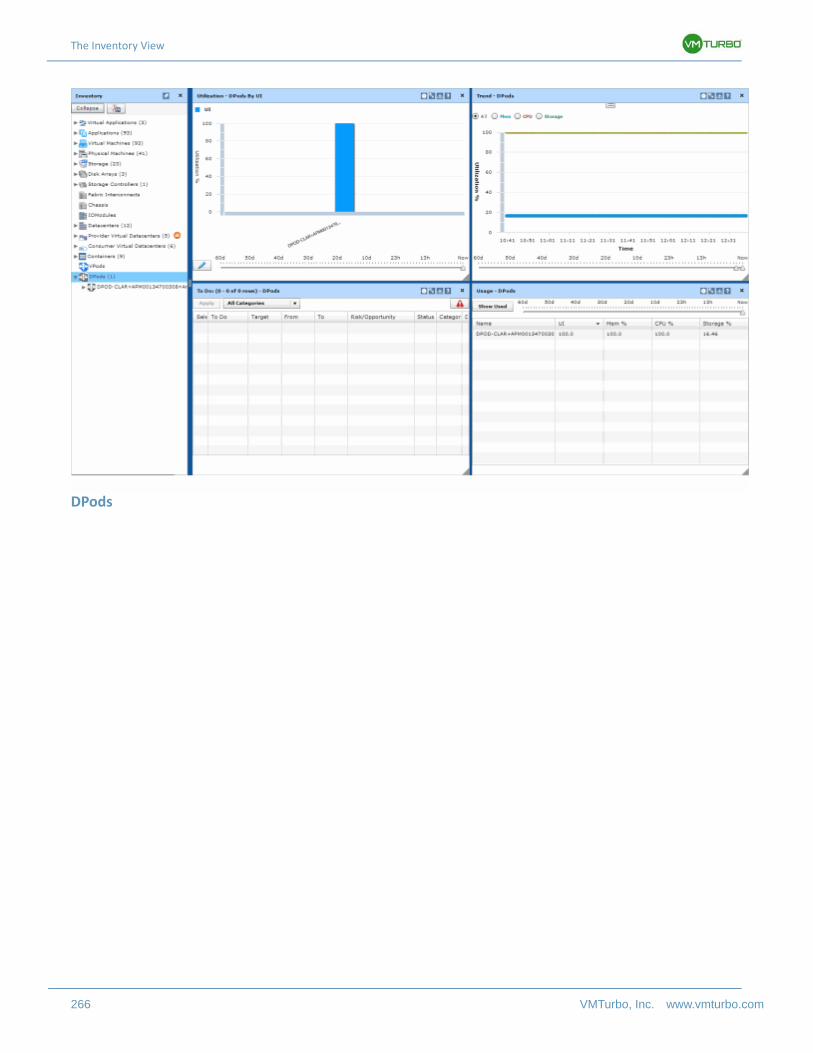
The Inventory View
266 VMTurbo, Inc. www.vmturbo.com
DPods
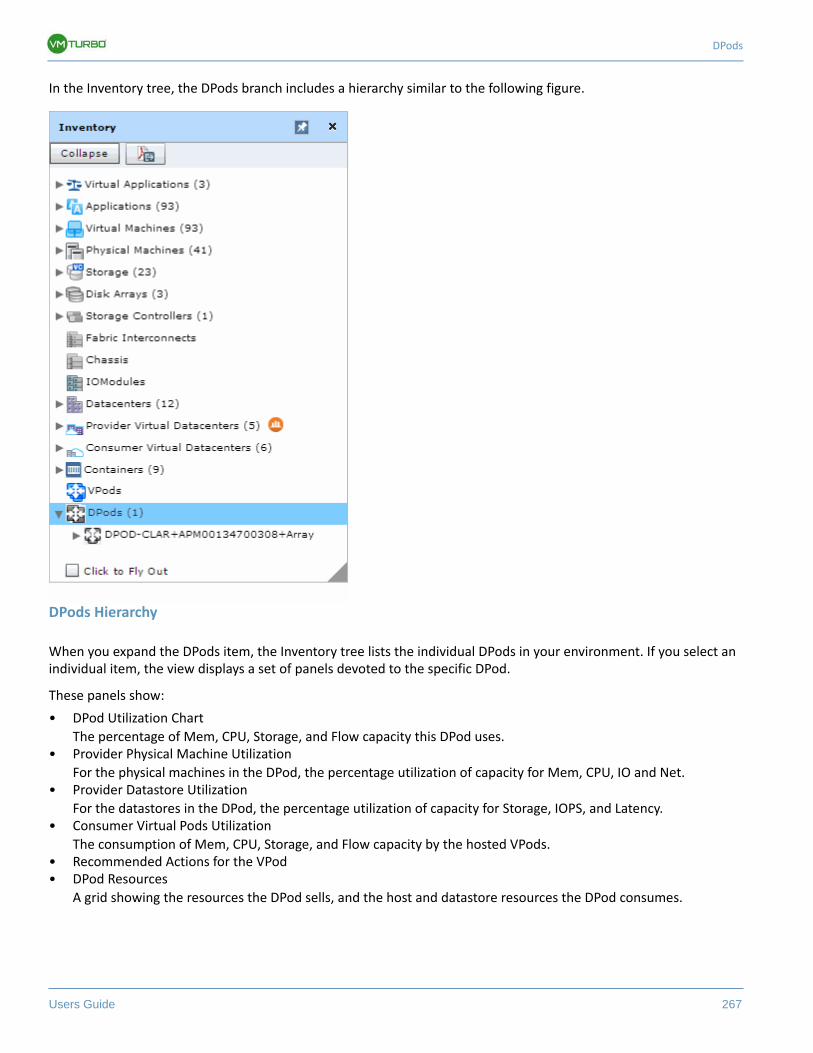
DPods
Users Guide 267
In the Inventory tree, the DPods branch includes a hierarchy similar to the following figure.
DPods Hierarchy
When you expand the DPods item, the Inventory tree lists the individual DPods in your environment. If you select an individual item, the view displays a set of panels devoted to the specific DPod.
These panels show:
• DPod Utilization Chart
The percentage of Mem, CPU, Storage, and Flow capacity this DPod uses.• Provider Physical Machine Utilization
For the physical machines in the DPod, the percentage utilization of capacity for Mem, CPU, IO and Net.• Provider Datastore Utilization
For the datastores in the DPod, the percentage utilization of capacity for Storage, IOPS, and Latency.• Consumer Virtual Pods Utilization
The consumption of Mem, CPU, Storage, and Flow capacity by the hosted VPods.• Recommended Actions for the VPod• DPod Resources
A grid showing the resources the DPod sells, and the host and datastore resources the DPod consumes.
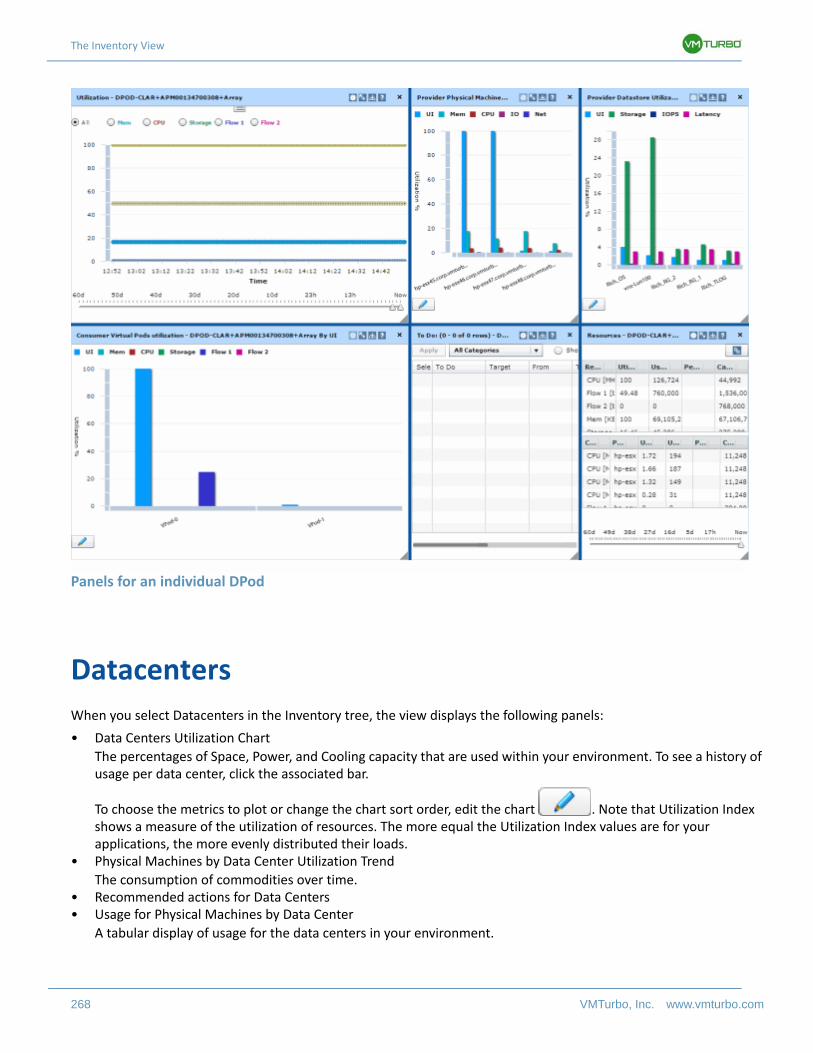
The Inventory View
268 VMTurbo, Inc. www.vmturbo.com
Panels for an individual DPod
Datacenters
When you select Datacenters in the Inventory tree, the view displays the following panels:
• Data Centers Utilization Chart
The percentages of Space, Power, and Cooling capacity that are used within your environment. To see a history of usage per data center, click the associated bar.
To choose the metrics to plot or change the chart sort order, edit the chart . Note that Utilization Index shows a measure of the utilization of resources. The more equal the Utilization Index values are for your applications, the more evenly distributed their loads.
• Physical Machines by Data Center Utilization Trend
The consumption of commodities over time.• Recommended actions for Data Centers• Usage for Physical Machines by Data Center
A tabular display of usage for the data centers in your environment.
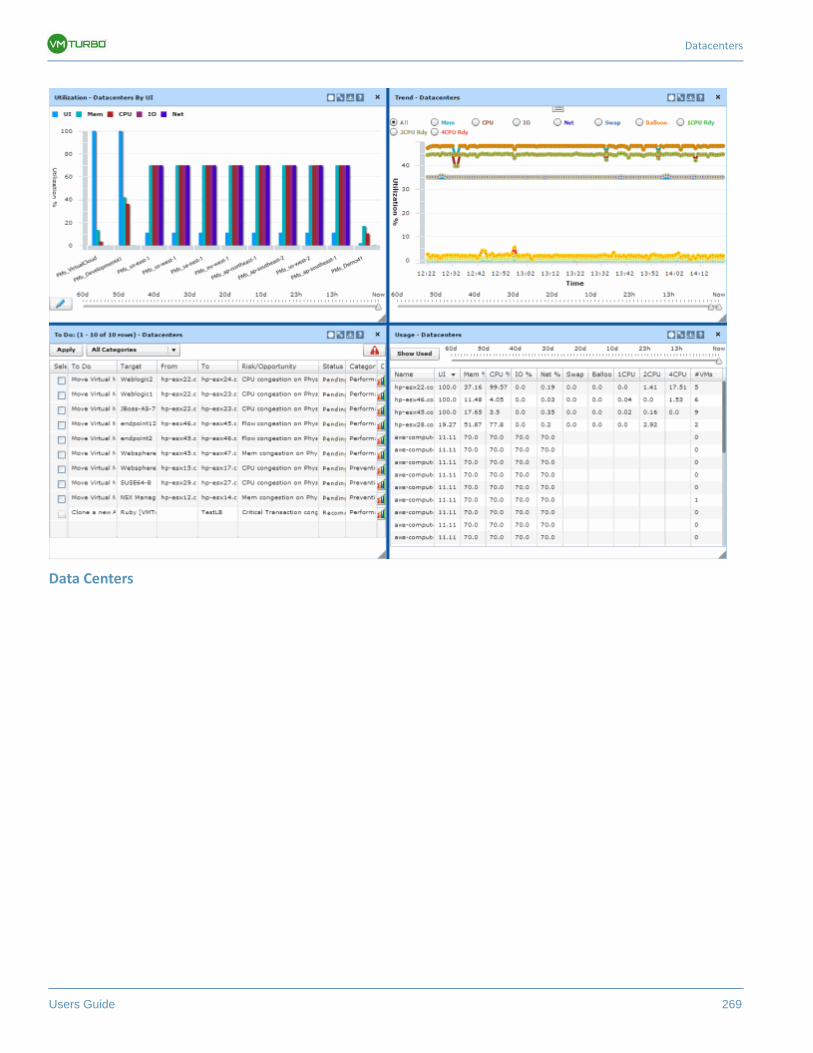
Datacenters
Users Guide 269
Data Centers
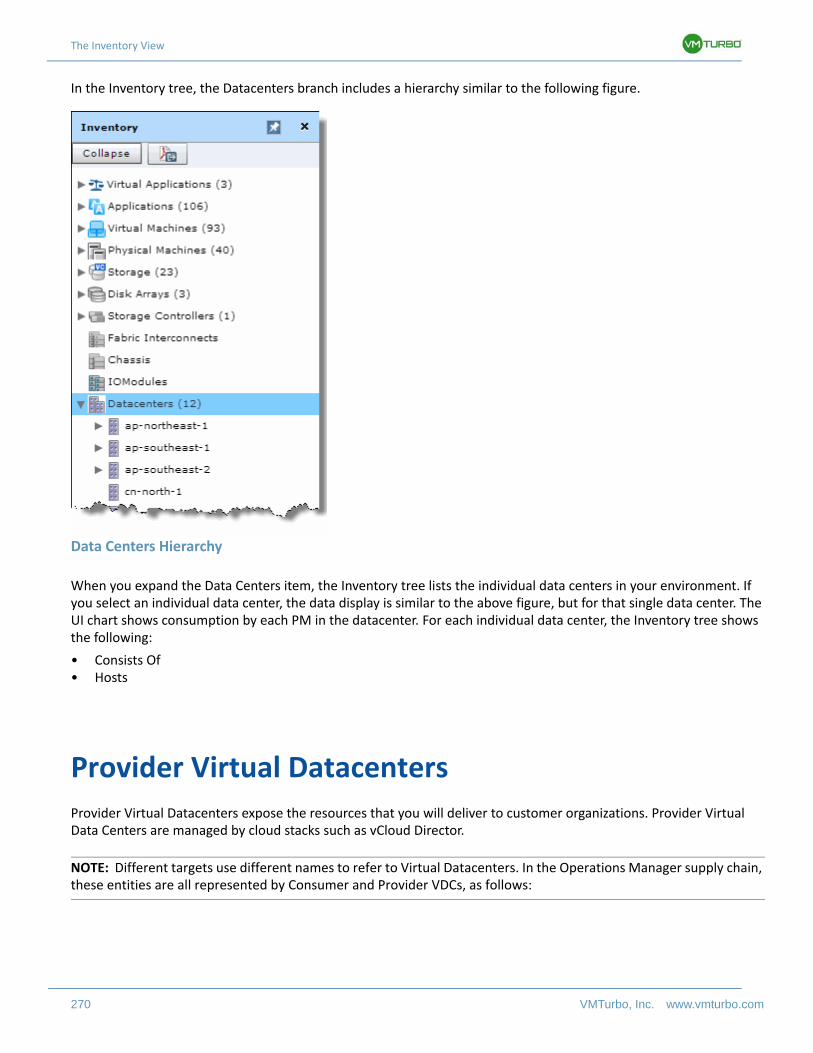
The Inventory View
270 VMTurbo, Inc. www.vmturbo.com
In the Inventory tree, the Datacenters branch includes a hierarchy similar to the following figure.
Data Centers Hierarchy
When you expand the Data Centers item, the Inventory tree lists the individual data centers in your environment. If you select an individual data center, the data display is similar to the above figure, but for that single data center. The UI chart shows consumption by each PM in the datacenter. For each individual data center, the Inventory tree shows the following:
• Consists Of• Hosts
Provider Virtual Datacenters
Provider Virtual Datacenters expose the resources that you will deliver to customer organizations. Provider Virtual Data Centers are managed by cloud stacks such as vCloud Director.
NOTE: Different targets use different names to refer to Virtual Datacenters. In the Operations Manager supply chain, these entities are all represented by Consumer and Provider VDCs, as follows:
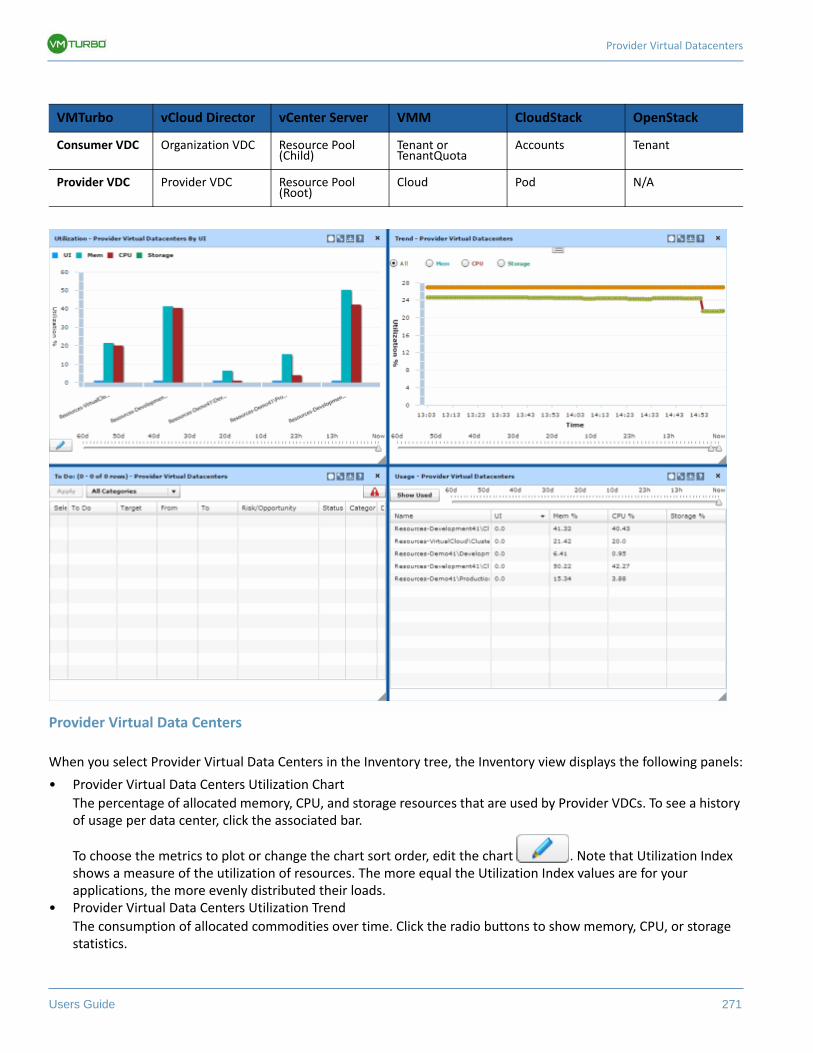
Provider Virtual Datacenters
Users Guide 271
Provider Virtual Data Centers
When you select Provider Virtual Data Centers in the Inventory tree, the Inventory view displays the following panels:
• Provider Virtual Data Centers Utilization Chart
The percentage of allocated memory, CPU, and storage resources that are used by Provider VDCs. To see a history of usage per data center, click the associated bar.
To choose the metrics to plot or change the chart sort order, edit the chart . Note that Utilization Index shows a measure of the utilization of resources. The more equal the Utilization Index values are for your applications, the more evenly distributed their loads.
• Provider Virtual Data Centers Utilization Trend
The consumption of allocated commodities over time. Click the radio buttons to show memory, CPU, or storage statistics.
VMTurbo vCloud Director vCenter Server VMM CloudStack OpenStack
Consumer VDC Organization VDC Resource Pool (Child)
Tenant or TenantQuota
Accounts Tenant
Provider VDC Provider VDC Resource Pool (Root)
Cloud Pod N/A
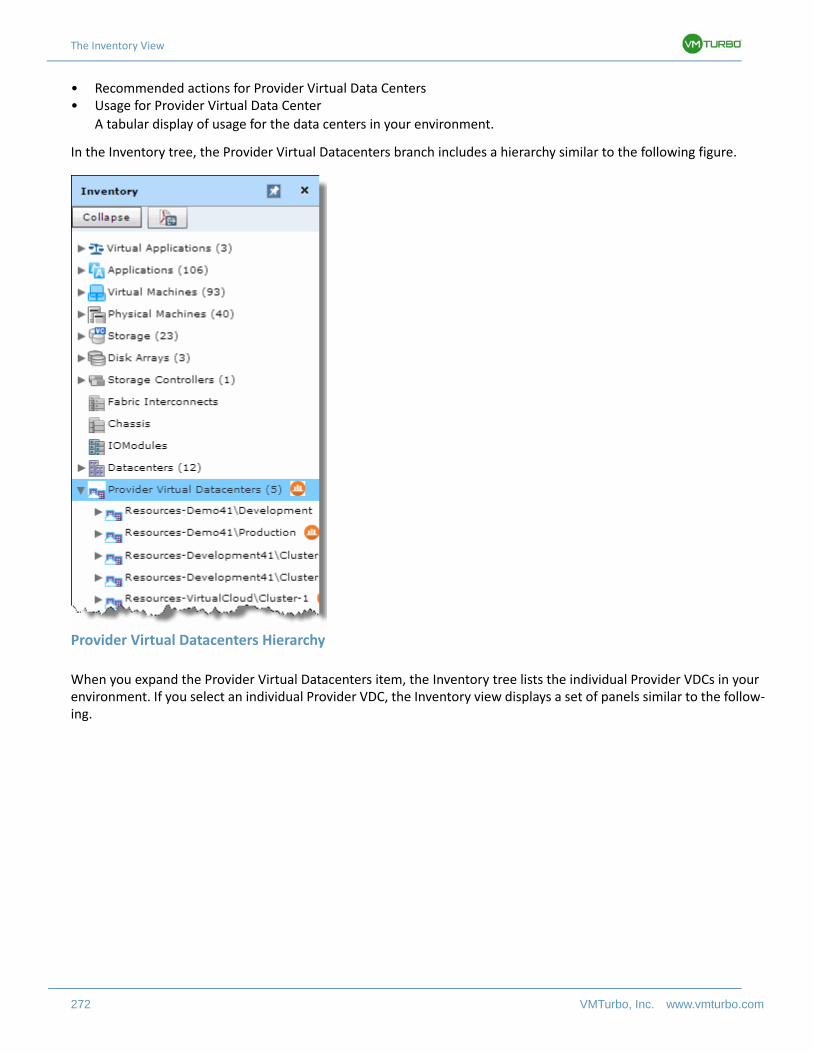
The Inventory View
272 VMTurbo, Inc. www.vmturbo.com
• Recommended actions for Provider Virtual Data Centers• Usage for Provider Virtual Data Center
A tabular display of usage for the data centers in your environment.
In the Inventory tree, the Provider Virtual Datacenters branch includes a hierarchy similar to the following figure.
Provider Virtual Datacenters Hierarchy
When you expand the Provider Virtual Datacenters item, the Inventory tree lists the individual Provider VDCs in your environment. If you select an individual Provider VDC, the Inventory view displays a set of panels similar to the follow-ing.
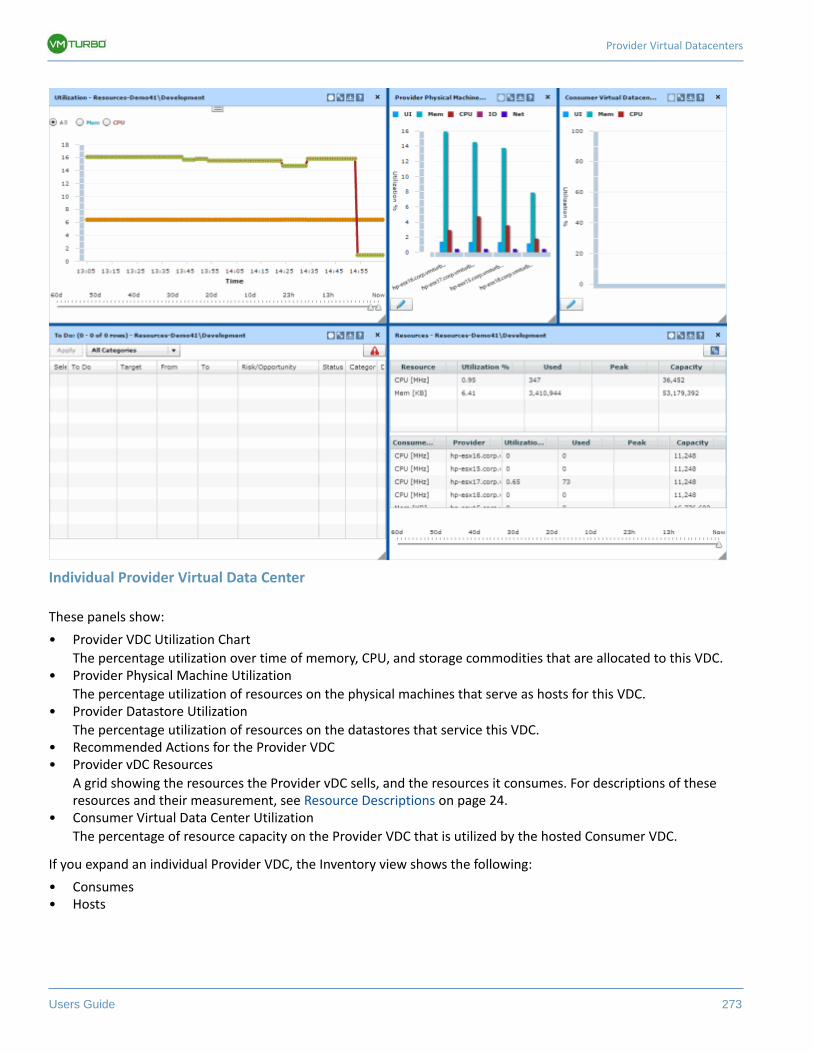
Provider Virtual Datacenters
Users Guide 273
Individual Provider Virtual Data Center
These panels show:
• Provider VDC Utilization Chart
The percentage utilization over time of memory, CPU, and storage commodities that are allocated to this VDC.• Provider Physical Machine Utilization
The percentage utilization of resources on the physical machines that serve as hosts for this VDC.• Provider Datastore Utilization
The percentage utilization of resources on the datastores that service this VDC.• Recommended Actions for the Provider VDC• Provider vDC Resources
A grid showing the resources the Provider vDC sells, and the resources it consumes. For descriptions of these resources and their measurement, see Resource Descriptions on page 24.
• Consumer Virtual Data Center Utilization
The percentage of resource capacity on the Provider VDC that is utilized by the hosted Consumer VDC.
If you expand an individual Provider VDC, the Inventory view shows the following:
• Consumes• Hosts
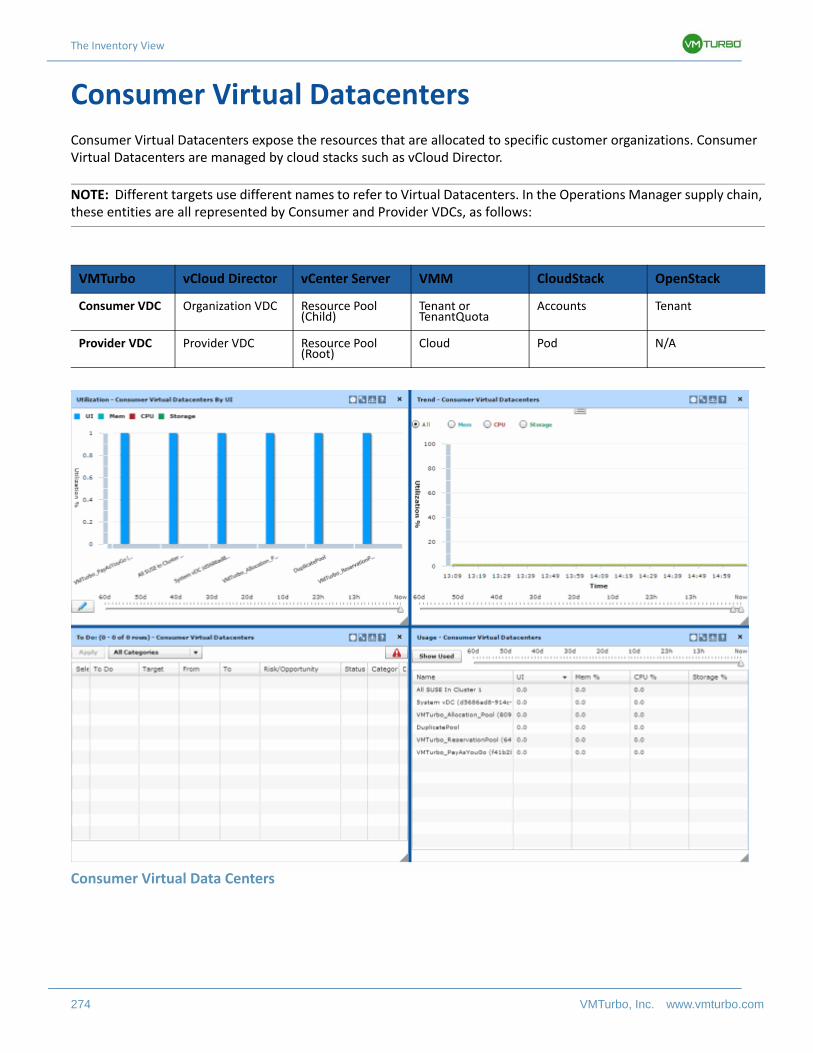
The Inventory View
274 VMTurbo, Inc. www.vmturbo.com
Consumer Virtual Datacenters
Consumer Virtual Datacenters expose the resources that are allocated to specific customer organizations. Consumer Virtual Datacenters are managed by cloud stacks such as vCloud Director.
NOTE: Different targets use different names to refer to Virtual Datacenters. In the Operations Manager supply chain, these entities are all represented by Consumer and Provider VDCs, as follows:
Consumer Virtual Data Centers
VMTurbo vCloud Director vCenter Server VMM CloudStack OpenStack
Consumer VDC Organization VDC Resource Pool (Child)
Tenant or TenantQuota
Accounts Tenant
Provider VDC Provider VDC Resource Pool (Root)
Cloud Pod N/A
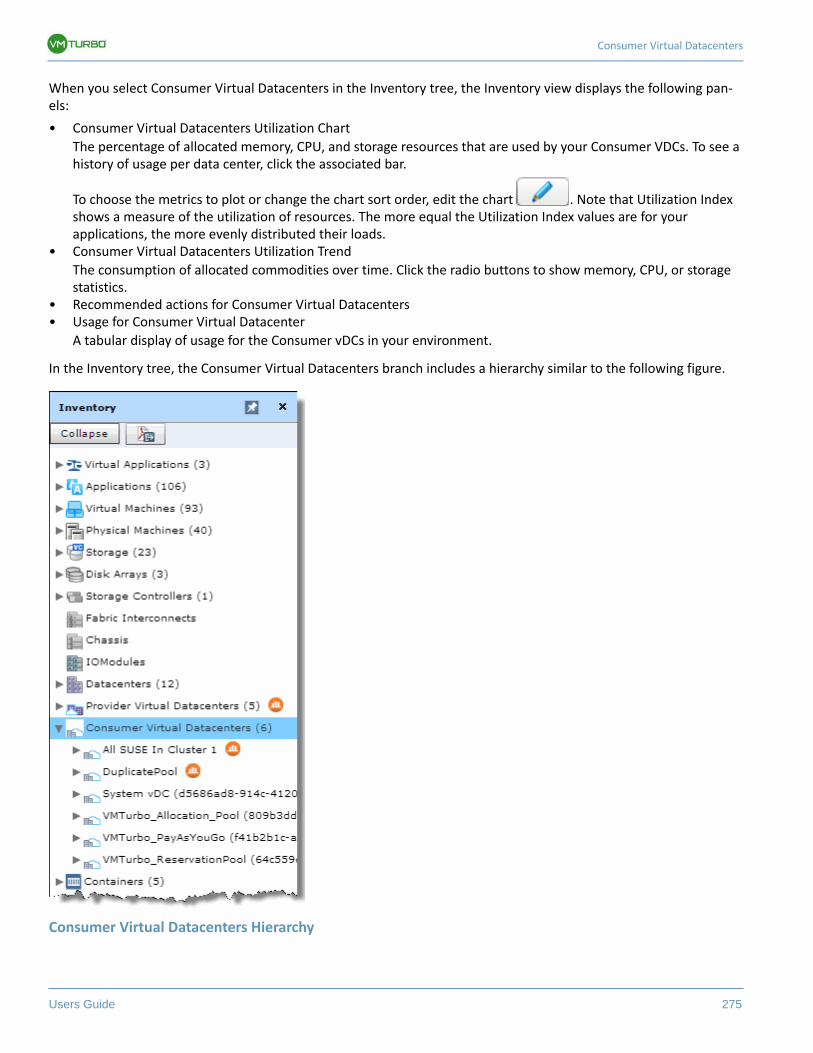
Consumer Virtual Datacenters
Users Guide 275
When you select Consumer Virtual Datacenters in the Inventory tree, the Inventory view displays the following pan-els:
• Consumer Virtual Datacenters Utilization Chart
The percentage of allocated memory, CPU, and storage resources that are used by your Consumer VDCs. To see a history of usage per data center, click the associated bar.
To choose the metrics to plot or change the chart sort order, edit the chart . Note that Utilization Index shows a measure of the utilization of resources. The more equal the Utilization Index values are for your applications, the more evenly distributed their loads.
• Consumer Virtual Datacenters Utilization Trend
The consumption of allocated commodities over time. Click the radio buttons to show memory, CPU, or storage statistics.
• Recommended actions for Consumer Virtual Datacenters• Usage for Consumer Virtual Datacenter
A tabular display of usage for the Consumer vDCs in your environment.
In the Inventory tree, the Consumer Virtual Datacenters branch includes a hierarchy similar to the following figure.
Consumer Virtual Datacenters Hierarchy
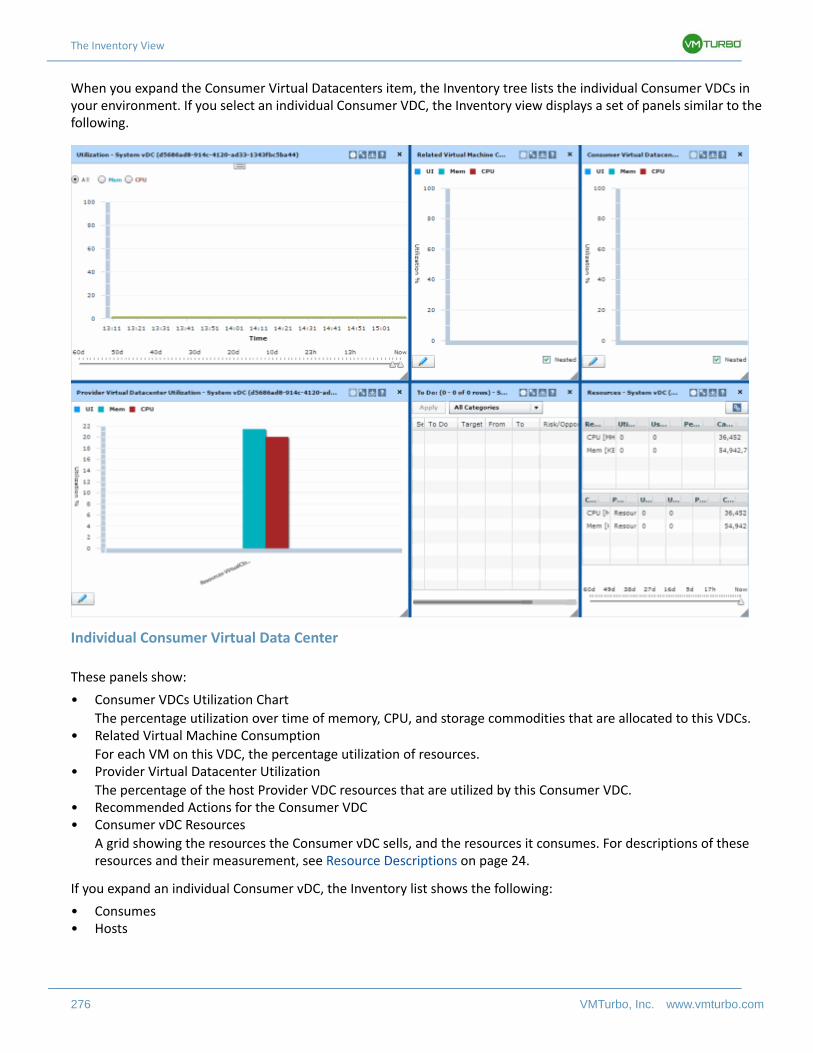
The Inventory View
276 VMTurbo, Inc. www.vmturbo.com
When you expand the Consumer Virtual Datacenters item, the Inventory tree lists the individual Consumer VDCs in your environment. If you select an individual Consumer VDC, the Inventory view displays a set of panels similar to the following.
Individual Consumer Virtual Data Center
These panels show:
• Consumer VDCs Utilization Chart
The percentage utilization over time of memory, CPU, and storage commodities that are allocated to this VDCs.• Related Virtual Machine Consumption
For each VM on this VDC, the percentage utilization of resources.• Provider Virtual Datacenter Utilization
The percentage of the host Provider VDC resources that are utilized by this Consumer VDC.• Recommended Actions for the Consumer VDC• Consumer vDC Resources
A grid showing the resources the Consumer vDC sells, and the resources it consumes. For descriptions of these resources and their measurement, see Resource Descriptions on page 24.
If you expand an individual Consumer vDC, the Inventory list shows the following:
• Consumes• Hosts
Users Guide 277
The Admin View
The Admin view provides settings to manage Operations Manager sessions and perform other administrative tasks. In this view you assign the target servers Operations Manager will connect to as it manages your environment. You can also use the Admin view to manage user accounts on Operations Manager, manage how Operations Manager retains system metrics and other data, manage custom groups, and perform maintenance tasks such as managing configura-tion files or refresh intervals.
The Configuration panel of the Admin view includes the following accordion buttons for specific administrative tasks:
• User Authentication Configuration on page 277
Create and manage user accounts for the Operations Manager.• Target Configuration on page 285
Use these tools to specify the list of servers Operations Manager will connect to as it monitors your environment.• License Configuration on page 314
Apply license keys to activate VMTurbo Operations Manager features.• Maintenance on page 315
Perform general tasks such as managing configuration files or refresh intervals.
User Authentication Configuration
As an administrator, you specify accounts that grant users specific access to Operations Manager. The following topics describe how to work with user accounts:
• Creating User and Group Accounts on page 278 — Accounts can be for individual users, or members of Active Directory groups
• User Authentication on page 280 — Accounts can use Active Directory or locally stored credentials• Account Privileges on page 282 — Accounts include type and role to specify access to Operations Manager
features• Account Scope on page 284 — Limits which devices in the environment the user can access
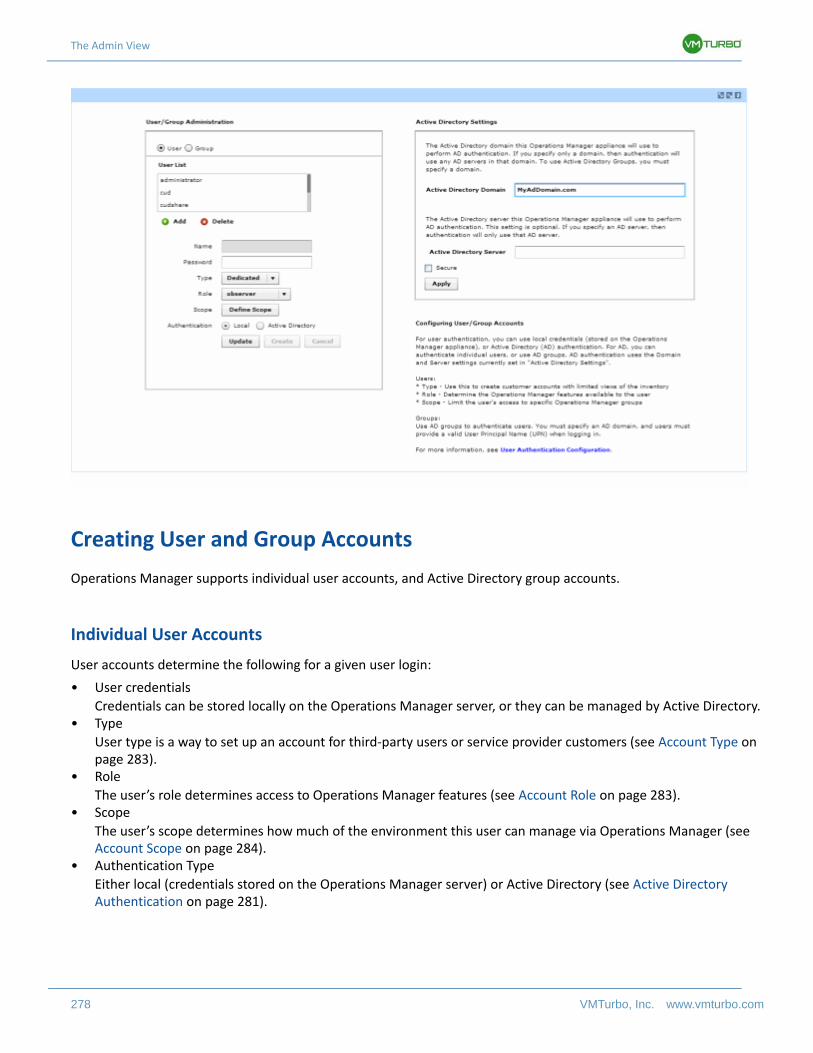
The Admin View
278 VMTurbo, Inc. www.vmturbo.com
Creating User and Group Accounts
Operations Manager supports individual user accounts, and Active Directory group accounts.
Individual User Accounts
User accounts determine the following for a given user login:
• User credentials
Credentials can be stored locally on the Operations Manager server, or they can be managed by Active Directory.• Type
User type is a way to set up an account for third-party users or service provider customers (see Account Type on page 283).
• Role
The user’s role determines access to Operations Manager features (see Account Role on page 283).• Scope
The user’s scope determines how much of the environment this user can manage via Operations Manager (see Account Scope on page 284).
• Authentication Type
Either local (credentials stored on the Operations Manager server) or Active Directory (see Active Directory Authentication on page 281).
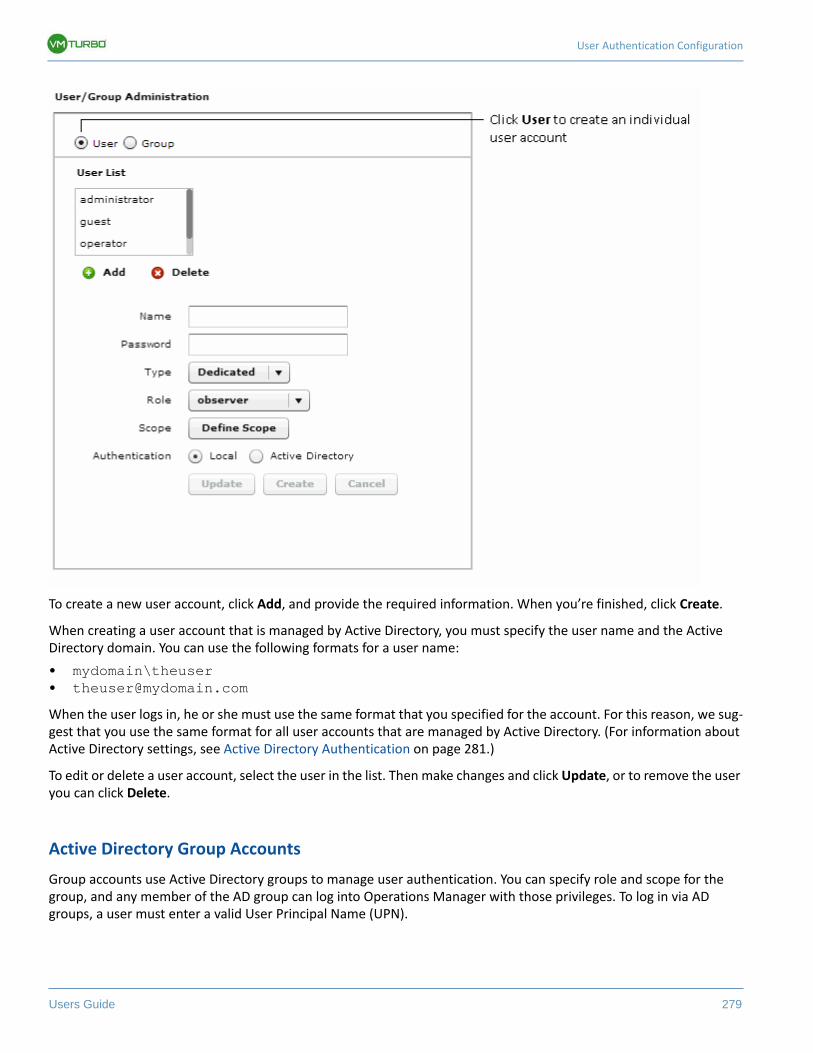
User Authentication Configuration
Users Guide 279
To create a new user account, click Add, and provide the required information. When you’re finished, click Create.
When creating a user account that is managed by Active Directory, you must specify the user name and the Active Directory domain. You can use the following formats for a user name:
• mydomain\theuser• [email protected]
When the user logs in, he or she must use the same format that you specified for the account. For this reason, we sug-gest that you use the same format for all user accounts that are managed by Active Directory. (For information about Active Directory settings, see Active Directory Authentication on page 281.)
To edit or delete a user account, select the user in the list. Then make changes and click Update, or to remove the user you can click Delete.
Active Directory Group Accounts
Group accounts use Active Directory groups to manage user authentication. You can specify role and scope for the group, and any member of the AD group can log into Operations Manager with those privileges. To log in via AD groups, a user must enter a valid User Principal Name (UPN).
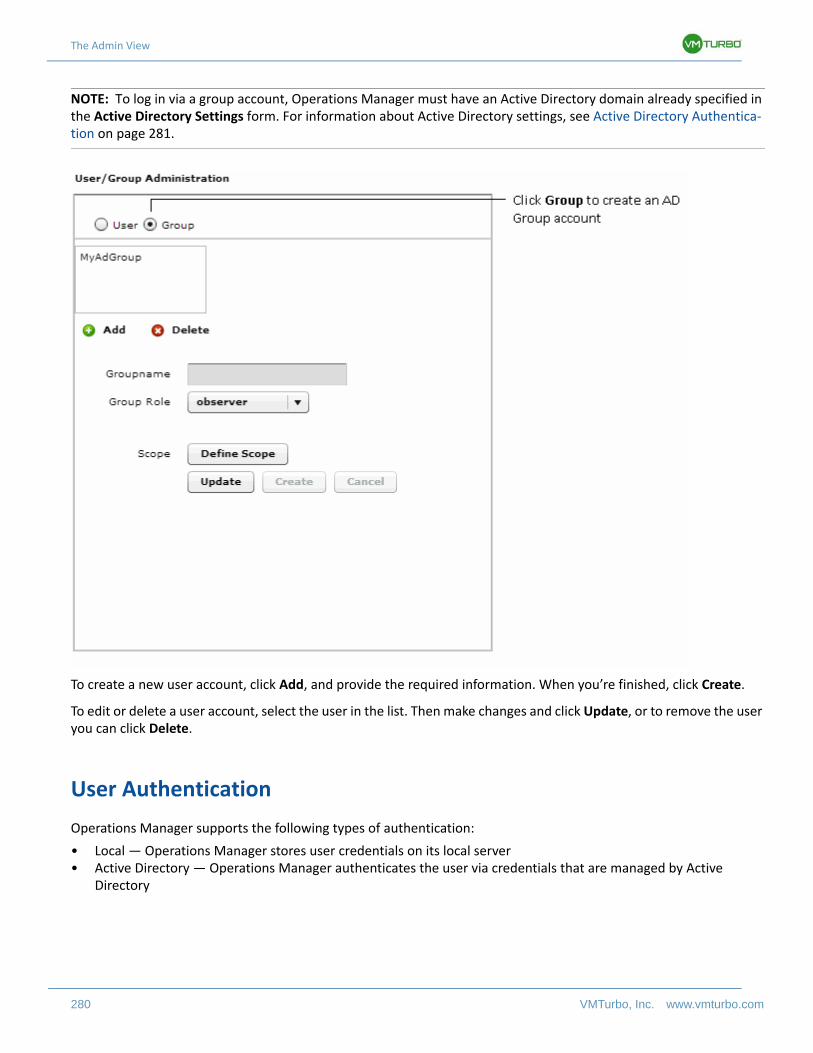
The Admin View
280 VMTurbo, Inc. www.vmturbo.com
NOTE: To log in via a group account, Operations Manager must have an Active Directory domain already specified in the Active Directory Settings form. For information about Active Directory settings, see Active Directory Authentica-tion on page 281.
To create a new user account, click Add, and provide the required information. When you’re finished, click Create.
To edit or delete a user account, select the user in the list. Then make changes and click Update, or to remove the user you can click Delete.
User Authentication
Operations Manager supports the following types of authentication:
• Local — Operations Manager stores user credentials on its local server• Active Directory — Operations Manager authenticates the user via credentials that are managed by Active
Directory
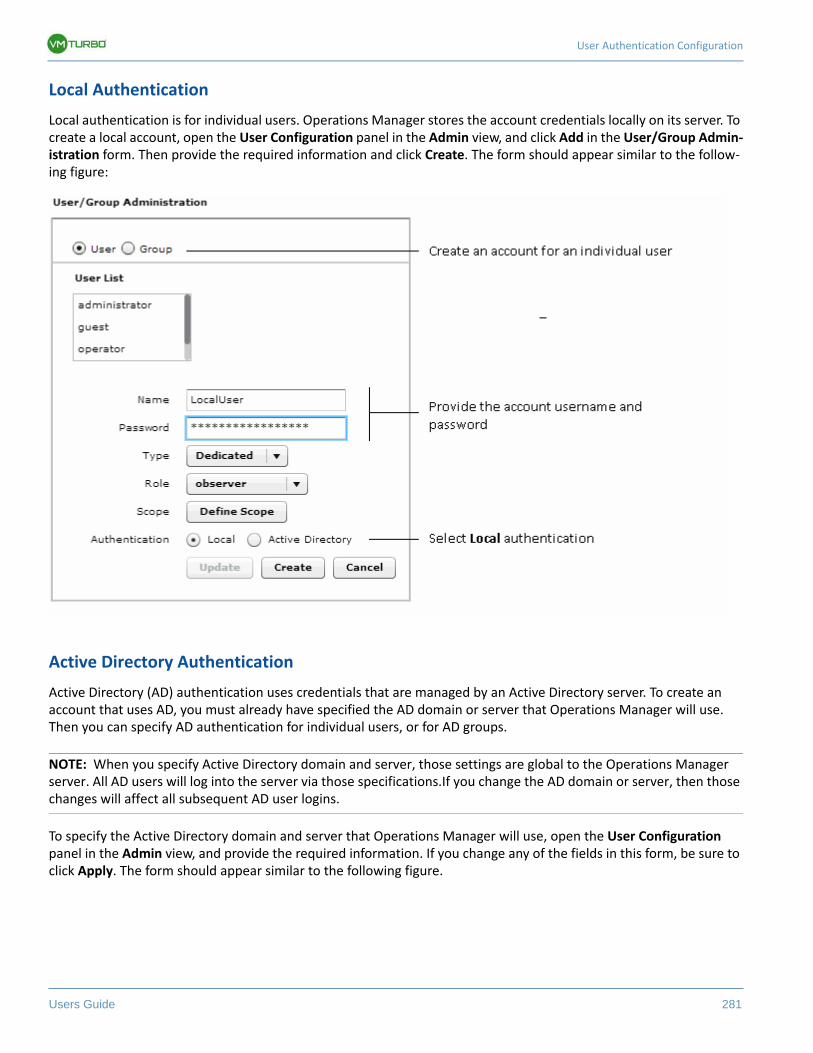
User Authentication Configuration
Users Guide 281
Local Authentication
Local authentication is for individual users. Operations Manager stores the account credentials locally on its server. To create a local account, open the User Configuration panel in the Admin view, and click Add in the User/Group Admin-istration form. Then provide the required information and click Create. The form should appear similar to the follow-ing figure:
Active Directory Authentication
Active Directory (AD) authentication uses credentials that are managed by an Active Directory server. To create an account that uses AD, you must already have specified the AD domain or server that Operations Manager will use. Then you can specify AD authentication for individual users, or for AD groups.
NOTE: When you specify Active Directory domain and server, those settings are global to the Operations Manager server. All AD users will log into the server via those specifications.If you change the AD domain or server, then those changes will affect all subsequent AD user logins.
To specify the Active Directory domain and server that Operations Manager will use, open the User Configuration panel in the Admin view, and provide the required information. If you change any of the fields in this form, be sure to click Apply. The form should appear similar to the following figure.
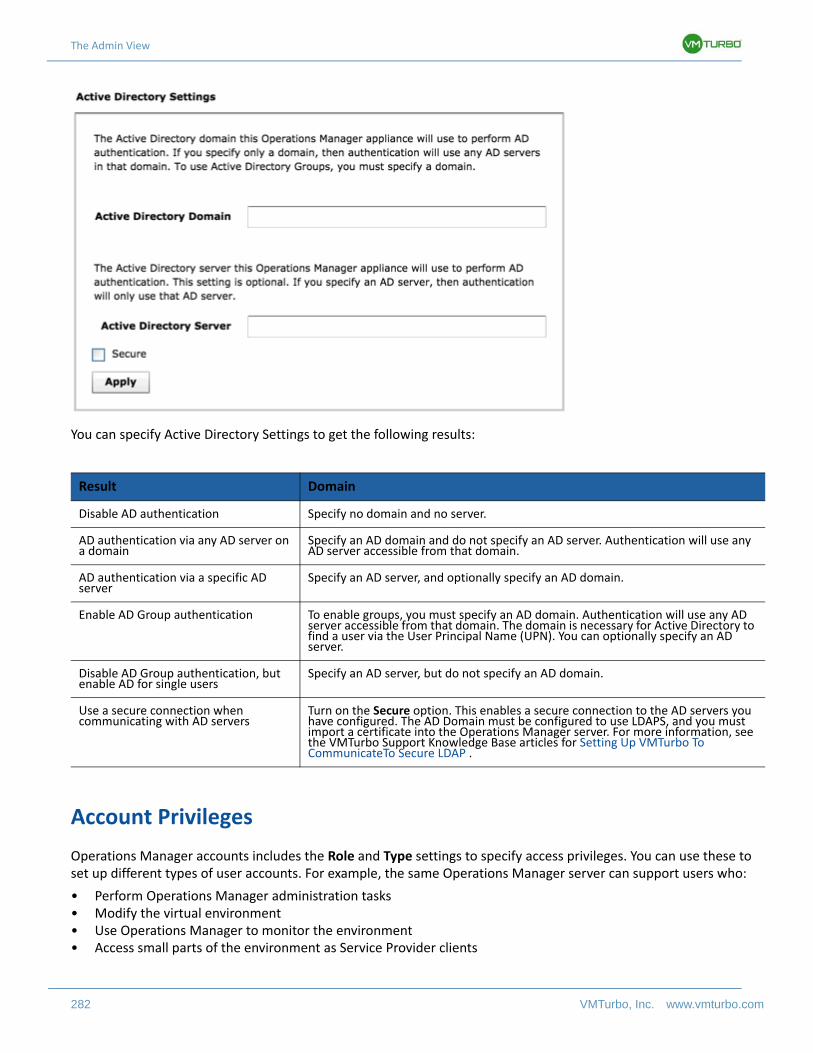
The Admin View
282 VMTurbo, Inc. www.vmturbo.com
You can specify Active Directory Settings to get the following results:
Account Privileges
Operations Manager accounts includes the Role and Type settings to specify access privileges. You can use these to set up different types of user accounts. For example, the same Operations Manager server can support users who:
• Perform Operations Manager administration tasks• Modify the virtual environment• Use Operations Manager to monitor the environment• Access small parts of the environment as Service Provider clients
Result Domain
Disable AD authentication Specify no domain and no server.
AD authentication via any AD server on a domain
Specify an AD domain and do not specify an AD server. Authentication will use any AD server accessible from that domain.
AD authentication via a specific AD server
Specify an AD server, and optionally specify an AD domain.
Enable AD Group authentication To enable groups, you must specify an AD domain. Authentication will use any AD server accessible from that domain. The domain is necessary for Active Directory to find a user via the User Principal Name (UPN). You can optionally specify an AD server.
Disable AD Group authentication, but enable AD for single users
Specify an AD server, but do not specify an AD domain.
Use a secure connection when communicating with AD servers
Turn on the Secure option. This enables a secure connection to the AD servers you have configured. The AD Domain must be configured to use LDAPS, and you must import a certificate into the Operations Manager server. For more information, see the VMTurbo Support Knowledge Base articles for Setting Up VMTurbo To CommunicateTo Secure LDAP .
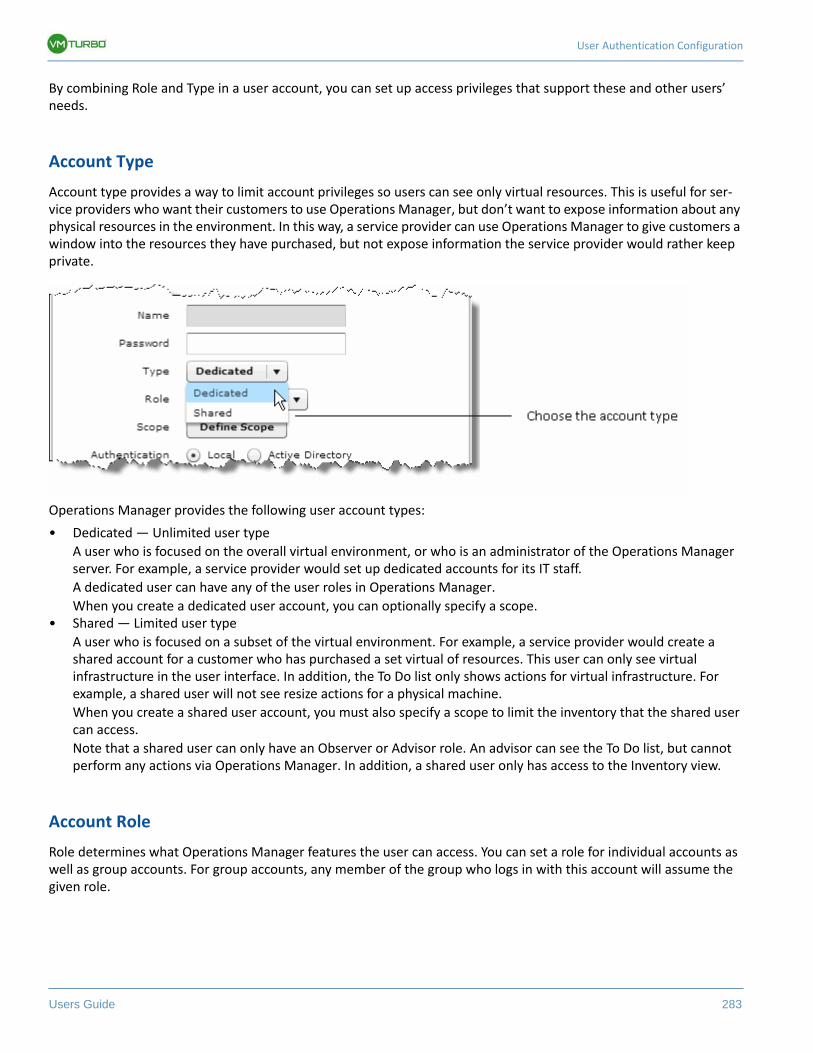
User Authentication Configuration
Users Guide 283
By combining Role and Type in a user account, you can set up access privileges that support these and other users’ needs.
Account Type
Account type provides a way to limit account privileges so users can see only virtual resources. This is useful for ser-vice providers who want their customers to use Operations Manager, but don’t want to expose information about any physical resources in the environment. In this way, a service provider can use Operations Manager to give customers a window into the resources they have purchased, but not expose information the service provider would rather keep private.
Operations Manager provides the following user account types:
• Dedicated — Unlimited user type
A user who is focused on the overall virtual environment, or who is an administrator of the Operations Manager server. For example, a service provider would set up dedicated accounts for its IT staff.
A dedicated user can have any of the user roles in Operations Manager.
When you create a dedicated user account, you can optionally specify a scope.• Shared — Limited user type
A user who is focused on a subset of the virtual environment. For example, a service provider would create a shared account for a customer who has purchased a set virtual of resources. This user can only see virtual infrastructure in the user interface. In addition, the To Do list only shows actions for virtual infrastructure. For example, a shared user will not see resize actions for a physical machine.
When you create a shared user account, you must also specify a scope to limit the inventory that the shared user can access.
Note that a shared user can only have an Observer or Advisor role. An advisor can see the To Do list, but cannot perform any actions via Operations Manager. In addition, a shared user only has access to the Inventory view.
Account Role
Role determines what Operations Manager features the user can access. You can set a role for individual accounts as well as group accounts. For group accounts, any member of the group who logs in with this account will assume the given role.
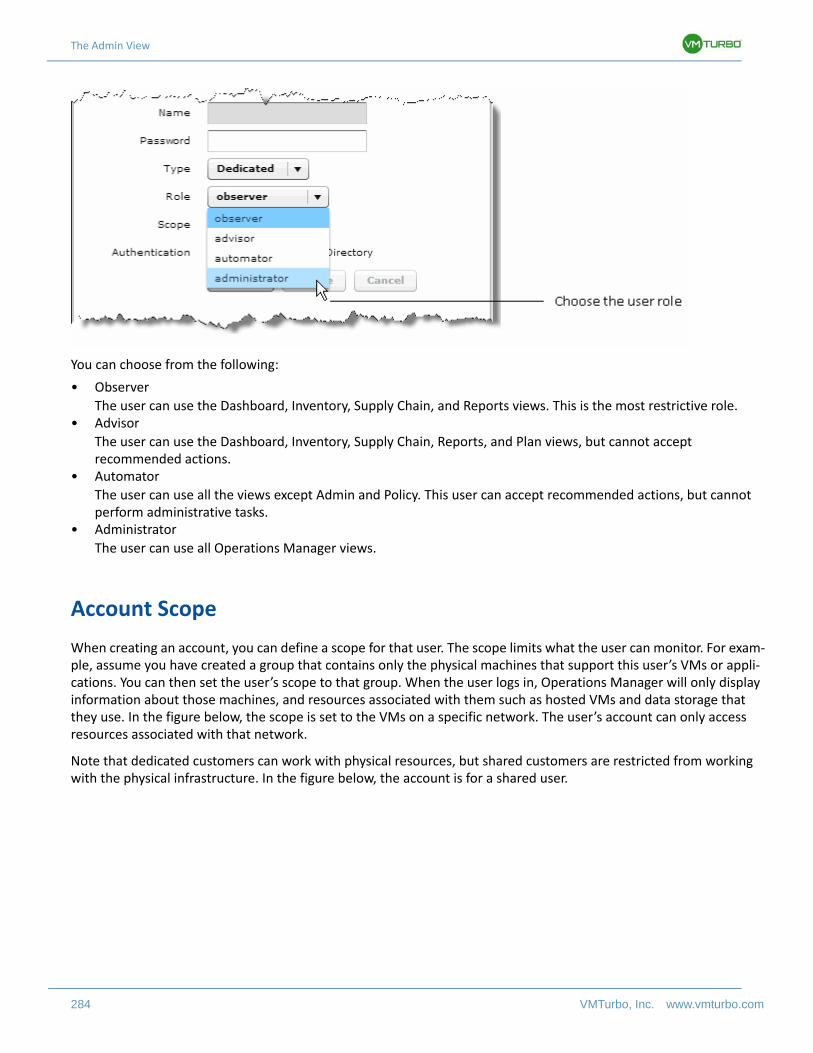
The Admin View
284 VMTurbo, Inc. www.vmturbo.com
You can choose from the following:
• Observer
The user can use the Dashboard, Inventory, Supply Chain, and Reports views. This is the most restrictive role.• Advisor
The user can use the Dashboard, Inventory, Supply Chain, Reports, and Plan views, but cannot accept recommended actions.
• Automator
The user can use all the views except Admin and Policy. This user can accept recommended actions, but cannot perform administrative tasks.
• Administrator
The user can use all Operations Manager views.
Account Scope
When creating an account, you can define a scope for that user. The scope limits what the user can monitor. For exam-ple, assume you have created a group that contains only the physical machines that support this user’s VMs or appli-cations. You can then set the user’s scope to that group. When the user logs in, Operations Manager will only display information about those machines, and resources associated with them such as hosted VMs and data storage that they use. In the figure below, the scope is set to the VMs on a specific network. The user’s account can only access resources associated with that network.
Note that dedicated customers can work with physical resources, but shared customers are restricted from working with the physical infrastructure. In the figure below, the account is for a shared user.
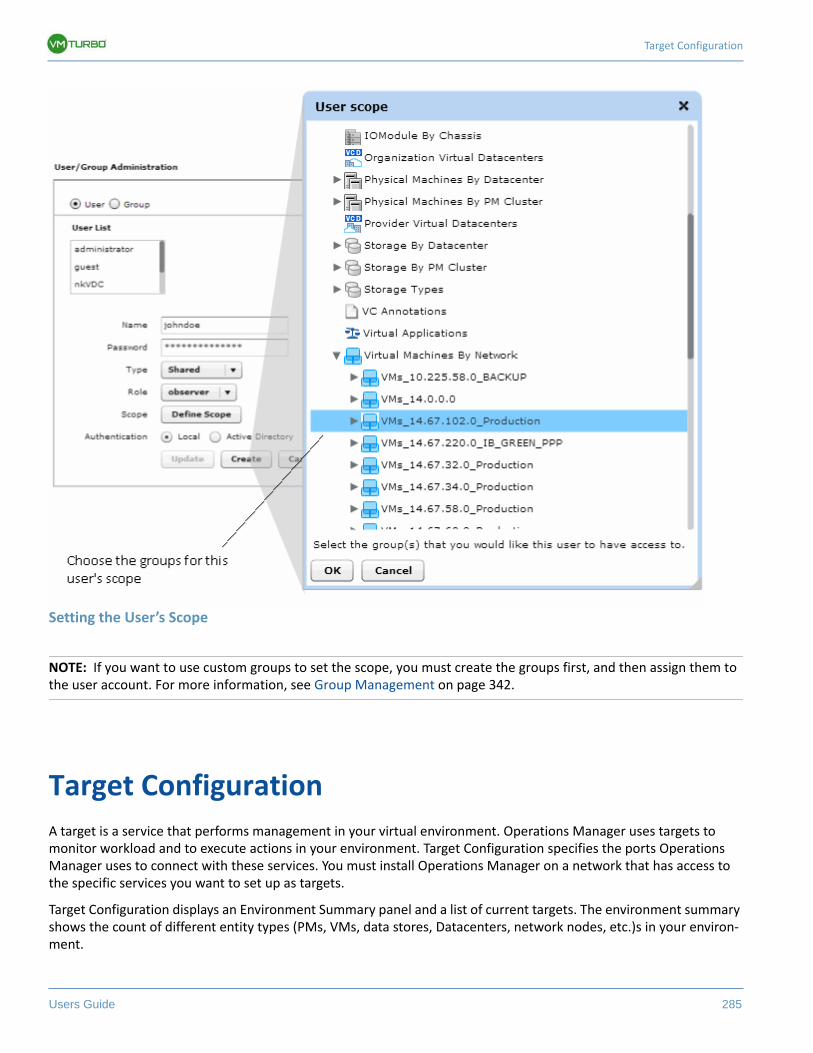
Target Configuration
Users Guide 285
Setting the User’s Scope
NOTE: If you want to use custom groups to set the scope, you must create the groups first, and then assign them to the user account. For more information, see Group Management on page 342.
Target Configuration
A target is a service that performs management in your virtual environment. Operations Manager uses targets to monitor workload and to execute actions in your environment. Target Configuration specifies the ports Operations Manager uses to connect with these services. You must install Operations Manager on a network that has access to the specific services you want to set up as targets.
Target Configuration displays an Environment Summary panel and a list of current targets. The environment summary shows the count of different entity types (PMs, VMs, data stores, Datacenters, network nodes, etc.)s in your environ-ment.
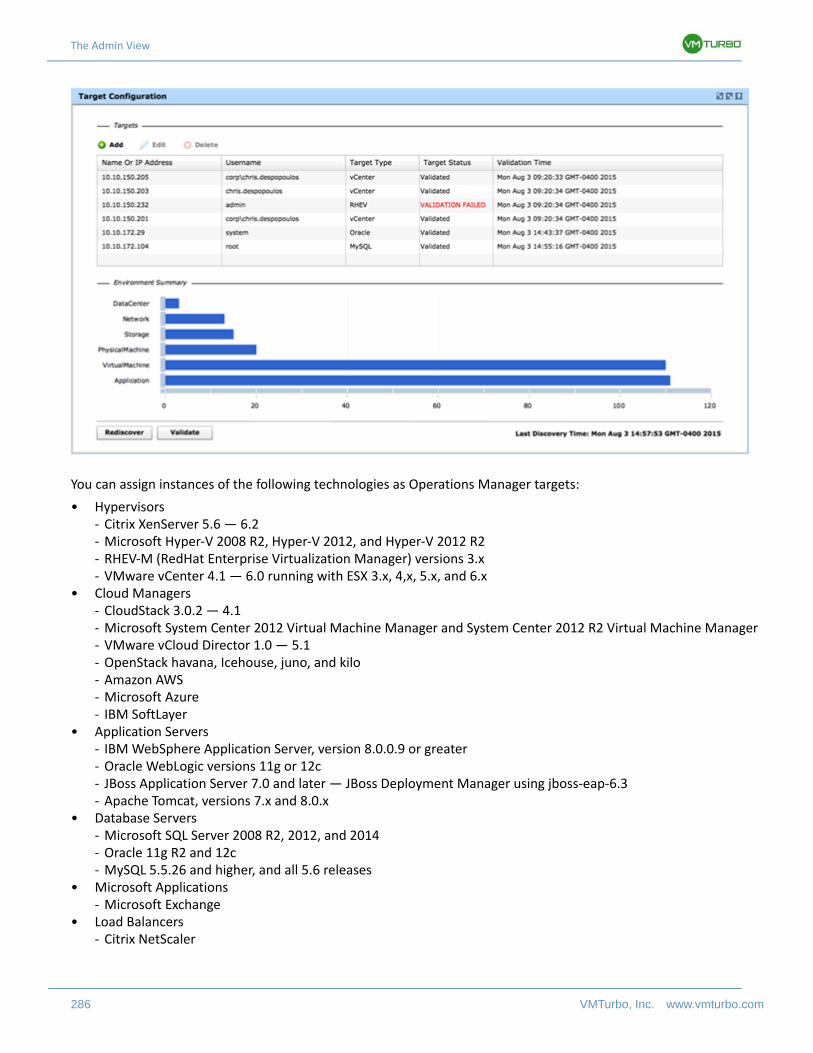
The Admin View
286 VMTurbo, Inc. www.vmturbo.com
You can assign instances of the following technologies as Operations Manager targets:
• Hypervisors- Citrix XenServer 5.6 — 6.2- Microsoft Hyper-V 2008 R2, Hyper-V 2012, and Hyper-V 2012 R2- RHEV-M (RedHat Enterprise Virtualization Manager) versions 3.x- VMware vCenter 4.1 — 6.0 running with ESX 3.x, 4,x, 5.x, and 6.x
• Cloud Managers- CloudStack 3.0.2 — 4.1- Microsoft System Center 2012 Virtual Machine Manager and System Center 2012 R2 Virtual Machine Manager- VMware vCloud Director 1.0 — 5.1- OpenStack havana, Icehouse, juno, and kilo- Amazon AWS- Microsoft Azure- IBM SoftLayer
• Application Servers- IBM WebSphere Application Server, version 8.0.0.9 or greater- Oracle WebLogic versions 11g or 12c- JBoss Application Server 7.0 and later — JBoss Deployment Manager using jboss-eap-6.3- Apache Tomcat, versions 7.x and 8.0.x
• Database Servers- Microsoft SQL Server 2008 R2, 2012, and 2014- Oracle 11g R2 and 12c- MySQL 5.5.26 and higher, and all 5.6 releases
• Microsoft Applications- Microsoft Exchange
• Load Balancers- Citrix NetScaler
Target Configuration
Users Guide 287
• Storage Managers- NetApp Storage Systems running Data ONTAP version 8 or later- EMC VNX Series Storage Systems (for version details, see the EMC VNX Support KB article)- Pure Storage FlashArray- HP 3PAR StoreServ- Nutanix- Dell Compellent
• Fabric Managers- Cisco UCS 2.0 and higher
• Network Flow Collectors- NetFlow/sFlow: NFDUMP — VMTurbo provides an OVA download with NFDUMP preconfigured for NetFlow and
sFlow collection- Arista EOS+
• Operations Manager Targets
To configure an aggregated deployment of Operations Manager, you can assign Operations Manager servers as targets (see Aggregated Operations Manager Installations on page 402). The versions of target instances must match the version of the aggregating instance.
This section includes the following topics. Unless there is a specific entry in this list for the target you intend to add, you can use the general instructions, Adding and Removing Target Virtual Management Servers on page 287. You should review the general instructions in any case, for information about target credentials, removing, and editing tar-gets:
• Adding and Removing Target Virtual Management Servers on page 287• Hyper-V Targets on page 291• Adding Cloud Management Targets on page 293• Adding Load Balancers as Targets on page 306
Adding and Removing Target Virtual Management Servers
The target services your Operations Manager installation will manage appear in the Target Configuration list. You can add, remove, and edit entries in this list. Note that the target service’s account must be configured with privileges that support the Operations Manager activities you want to perform. For example, the following list shows how vCenter privileges correspond to activities Operations Manager can perform:
• Read Only — Enables Operations Manager monitoring and simulation (what-if scenarios) only• VCenter Administrator — Enables Operations Manager monitoring, simulation (what-if scenarios), and
automation functions• Enable Datastore Browse — Enabling this property for the account gives Operations Manager the privileges it
needs to enable its storage management functionality
Adding Targets
To add a target service, click the Add button ( ), provide the requested information, then add the target to the list of pending targets. When you have configured the pending targets you want, click Apply to validate those targets, set them to Operations Manager, and start a new run of discovery.
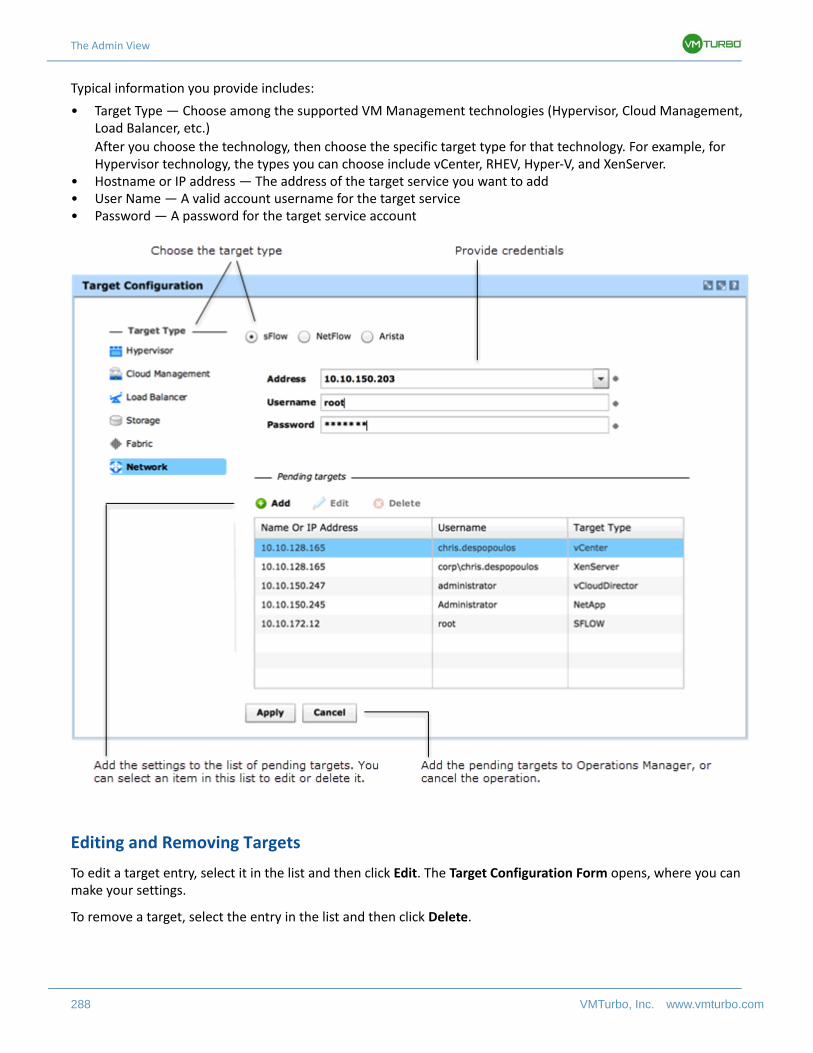
The Admin View
288 VMTurbo, Inc. www.vmturbo.com
Typical information you provide includes:
• Target Type — Choose among the supported VM Management technologies (Hypervisor, Cloud Management, Load Balancer, etc.)
After you choose the technology, then choose the specific target type for that technology. For example, for Hypervisor technology, the types you can choose include vCenter, RHEV, Hyper-V, and XenServer.
• Hostname or IP address — The address of the target service you want to add• User Name — A valid account username for the target service• Password — A password for the target service account
Editing and Removing Targets
To edit a target entry, select it in the list and then click Edit. The Target Configuration Form opens, where you can make your settings.
To remove a target, select the entry in the list and then click Delete.
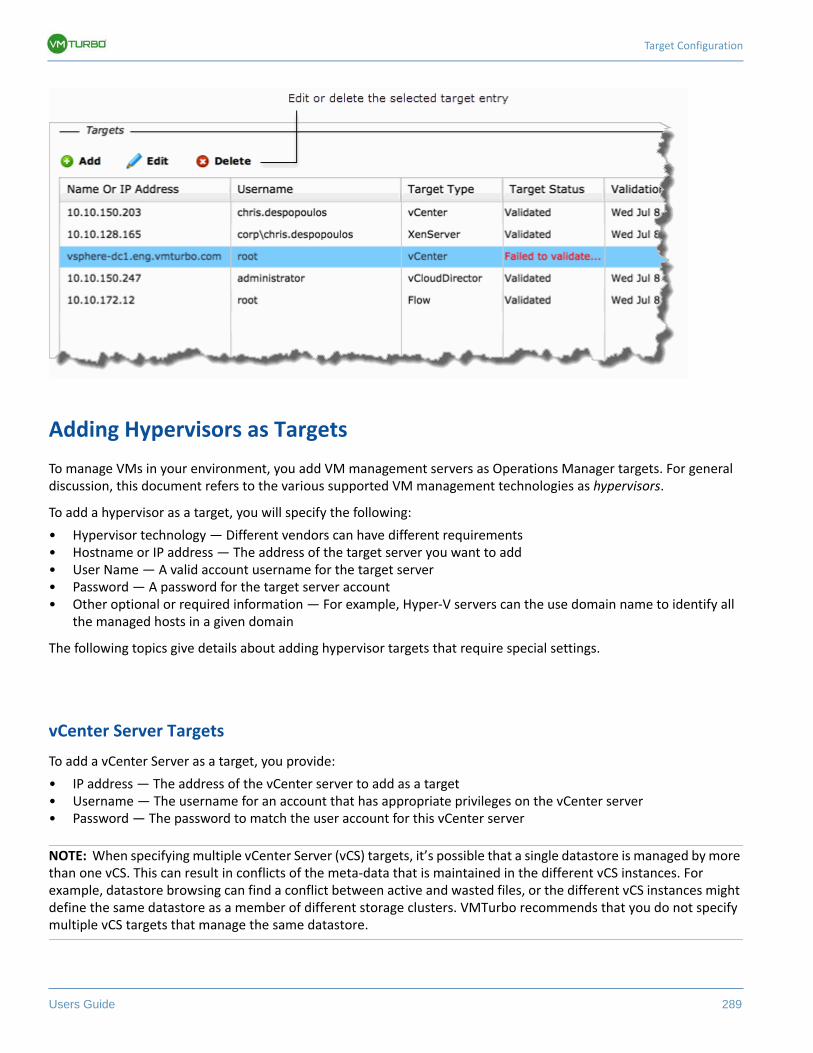
Target Configuration
Users Guide 289
Adding Hypervisors as Targets
To manage VMs in your environment, you add VM management servers as Operations Manager targets. For general discussion, this document refers to the various supported VM management technologies as hypervisors.
To add a hypervisor as a target, you will specify the following:
• Hypervisor technology — Different vendors can have different requirements• Hostname or IP address — The address of the target server you want to add• User Name — A valid account username for the target server• Password — A password for the target server account• Other optional or required information — For example, Hyper-V servers can the use domain name to identify all
the managed hosts in a given domain
The following topics give details about adding hypervisor targets that require special settings.
vCenter Server Targets
To add a vCenter Server as a target, you provide:
• IP address — The address of the vCenter server to add as a target• Username — The username for an account that has appropriate privileges on the vCenter server• Password — The password to match the user account for this vCenter server
NOTE: When specifying multiple vCenter Server (vCS) targets, it’s possible that a single datastore is managed by more than one vCS. This can result in conflicts of the meta-data that is maintained in the different vCS instances. For example, datastore browsing can find a conflict between active and wasted files, or the different vCS instances might define the same datastore as a member of different storage clusters. VMTurbo recommends that you do not specify multiple vCS targets that manage the same datastore.
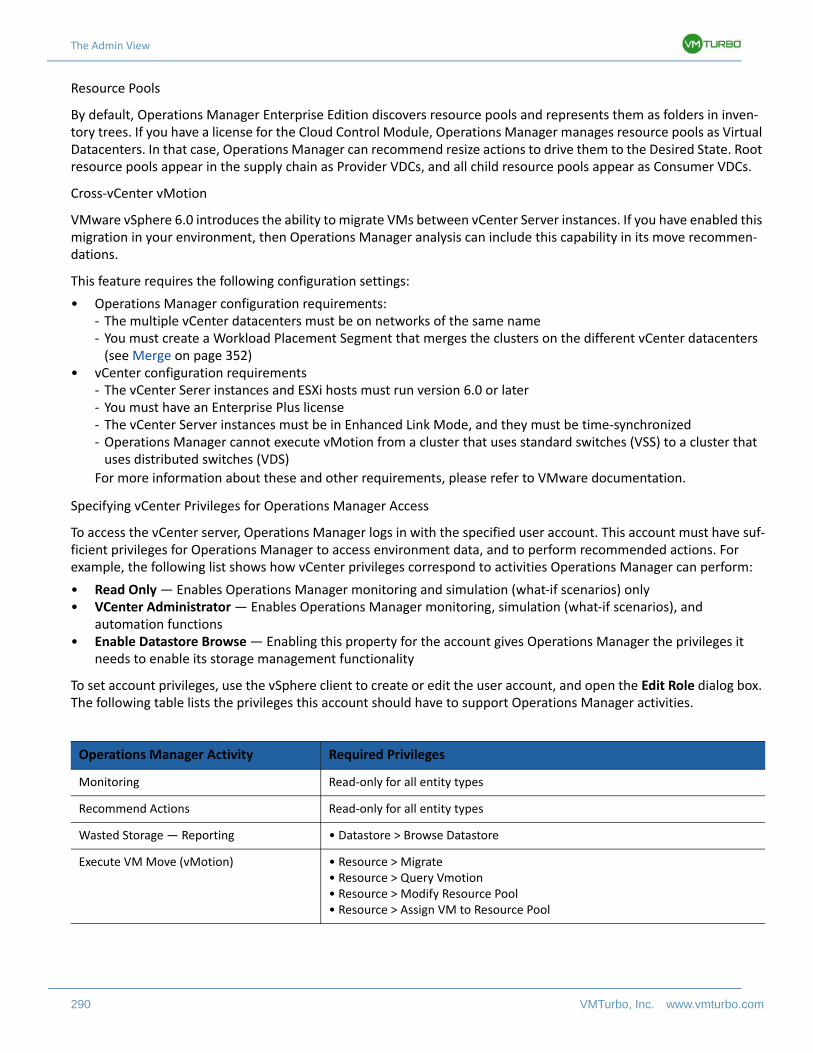
The Admin View
290 VMTurbo, Inc. www.vmturbo.com
Resource Pools
By default, Operations Manager Enterprise Edition discovers resource pools and represents them as folders in inven-tory trees. If you have a license for the Cloud Control Module, Operations Manager manages resource pools as Virtual Datacenters. In that case, Operations Manager can recommend resize actions to drive them to the Desired State. Root resource pools appear in the supply chain as Provider VDCs, and all child resource pools appear as Consumer VDCs.
Cross-vCenter vMotion
VMware vSphere 6.0 introduces the ability to migrate VMs between vCenter Server instances. If you have enabled this migration in your environment, then Operations Manager analysis can include this capability in its move recommen-dations.
This feature requires the following configuration settings:
• Operations Manager configuration requirements:- The multiple vCenter datacenters must be on networks of the same name- You must create a Workload Placement Segment that merges the clusters on the different vCenter datacenters
(see Merge on page 352)• vCenter configuration requirements
- The vCenter Serer instances and ESXi hosts must run version 6.0 or later- You must have an Enterprise Plus license- The vCenter Server instances must be in Enhanced Link Mode, and they must be time-synchronized- Operations Manager cannot execute vMotion from a cluster that uses standard switches (VSS) to a cluster that
uses distributed switches (VDS)
For more information about these and other requirements, please refer to VMware documentation.
Specifying vCenter Privileges for Operations Manager Access
To access the vCenter server, Operations Manager logs in with the specified user account. This account must have suf-ficient privileges for Operations Manager to access environment data, and to perform recommended actions. For example, the following list shows how vCenter privileges correspond to activities Operations Manager can perform:
• Read Only — Enables Operations Manager monitoring and simulation (what-if scenarios) only• VCenter Administrator — Enables Operations Manager monitoring, simulation (what-if scenarios), and
automation functions• Enable Datastore Browse — Enabling this property for the account gives Operations Manager the privileges it
needs to enable its storage management functionality
To set account privileges, use the vSphere client to create or edit the user account, and open the Edit Role dialog box. The following table lists the privileges this account should have to support Operations Manager activities.
Operations Manager Activity Required Privileges
Monitoring Read-only for all entity types
Recommend Actions Read-only for all entity types
Wasted Storage — Reporting • Datastore > Browse Datastore
Execute VM Move (vMotion) • Resource > Migrate• Resource > Query Vmotion• Resource > Modify Resource Pool• Resource > Assign VM to Resource Pool
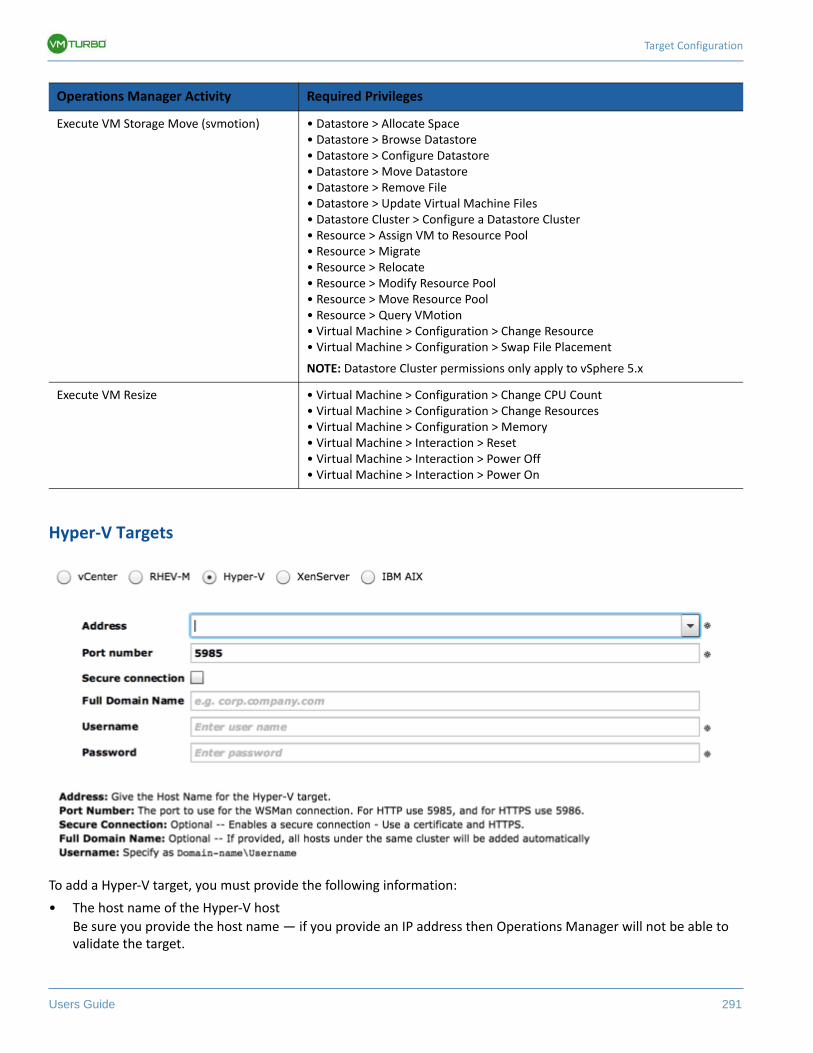
Target Configuration
Users Guide 291
Hyper-V Targets
To add a Hyper-V target, you must provide the following information:
• The host name of the Hyper-V host
Be sure you provide the host name — if you provide an IP address then Operations Manager will not be able to validate the target.
Execute VM Storage Move (svmotion) • Datastore > Allocate Space• Datastore > Browse Datastore• Datastore > Configure Datastore• Datastore > Move Datastore• Datastore > Remove File• Datastore > Update Virtual Machine Files• Datastore Cluster > Configure a Datastore Cluster• Resource > Assign VM to Resource Pool• Resource > Migrate• Resource > Relocate• Resource > Modify Resource Pool• Resource > Move Resource Pool• Resource > Query VMotion• Virtual Machine > Configuration > Change Resource• Virtual Machine > Configuration > Swap File Placement
NOTE: Datastore Cluster permissions only apply to vSphere 5.x
Execute VM Resize • Virtual Machine > Configuration > Change CPU Count• Virtual Machine > Configuration > Change Resources• Virtual Machine > Configuration > Memory• Virtual Machine > Interaction > Reset• Virtual Machine > Interaction > Power Off• Virtual Machine > Interaction > Power On
Operations Manager Activity Required Privileges
The Admin View
292 VMTurbo, Inc. www.vmturbo.com
• The number of the port to enable a WSMan connection
For a standard connection (HTTP) use 5985. For a secure connection (HTTPS) use 5986.• Enable or disable a secure connection
If you use a secure connection, then you must configure a certificate, and must configure Operations Manager to communicate over HTTPS.
• Optional — Full domain name for the Hyper-V cluster
If you provide the domain name, then Operations Manager will discover all Hyper-V hosts that are in that specified cluster, and add them as targets. In addition, Operations Manager monitors your environment and automatically adds new targets whenever it discovers a new Hyper-V server in that cluster.
• Username and Password
The login credentials for the Hyper-V target. You must provide domain\username in the User Name field. If you specified a Full Domain Name, then you must provide credentials that are valid for all the Hyper-V hosts in the cluster.
In addition, the user that you specify must be one of the Hyper-V server’s WBEM Scripting Locater owners.
Each Hyper-V server must be configured to allow access via the Windows Remote Management (WinRM) protocol. To set this access:
1. Set up Windows Remote Management (WinRM) service to run on startup.
NOTE: For you to execute these commands successfully, Windows Firewall must be running. For more informa-tion, see the Microsoft Knowledge Base article #2004640 (http://support.microsoft.com/kb/2004640).
Log into a command window as Administrator on the host machine. Then execute the following commands:
winrm quickconfigy
2. Set permissions on the host machine.
Execute the following commands in the command window:
winrm set winrm/config/service/Auth @{Basic="true"}winrm set winrm/config/service @{AllowUnencrypted="true"}winrm set winrm/config/winrs @{MaxMemoryPerShellMB="1024"}
3. Set up an SPN for the host machine.
The machine must have an SPN of the form, protocol/host_address. For example, WSMAN/10.99.9.2.
To get a list of SPNs for the machine, execute the following in the command window:
setspn -l <vmm-server-name>If there is no valid SPN in the list, create one by running the command:
setspn -A protocol/host-address:port where port is optional
For example, setspn -A WSMAN/10.99.9.2:VMM-02
4. For information about alternative ways to set up WinRM, see the following Green Circle articles:• How To Configure Microsoft Virtual Machine Manager (VMM) server for use with VMTurbo Operations
Manager .• WSMan service configuration using domain GPO .
Once you have done this you can specify the Hyper-V server as an Operations Manager target, using credentials for an owner that has Full Control privileges.
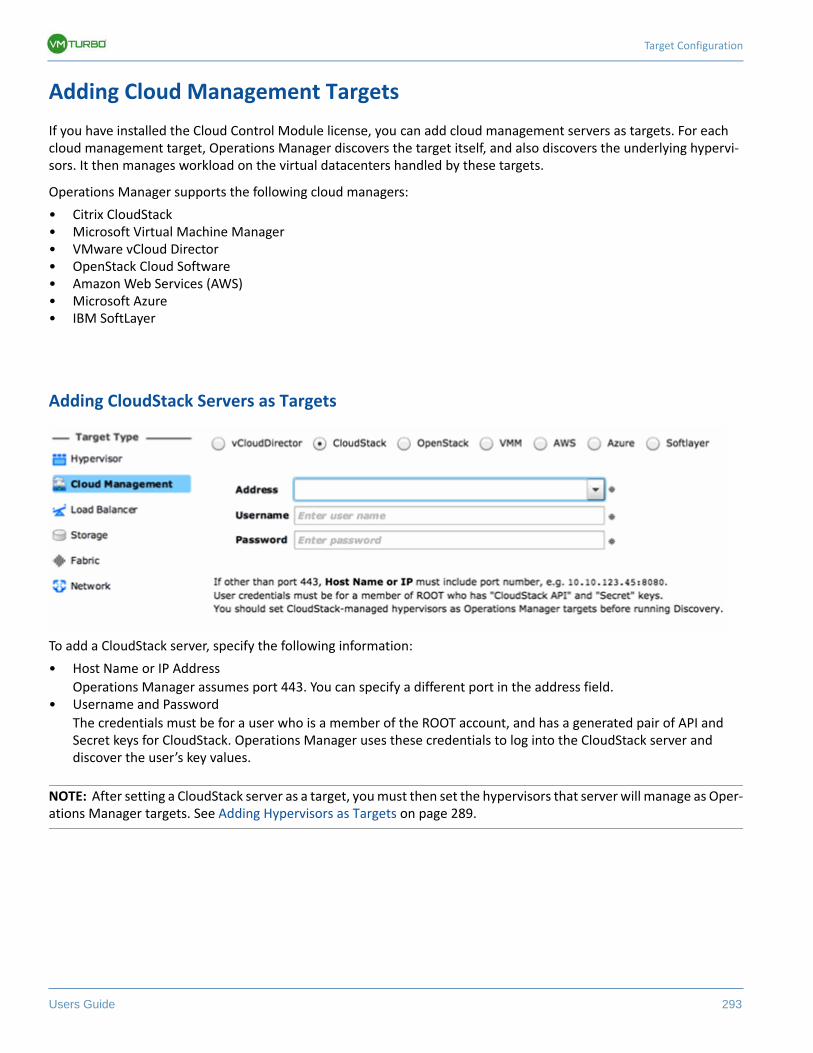
Target Configuration
Users Guide 293
Adding Cloud Management Targets
If you have installed the Cloud Control Module license, you can add cloud management servers as targets. For each cloud management target, Operations Manager discovers the target itself, and also discovers the underlying hypervi-sors. It then manages workload on the virtual datacenters handled by these targets.
Operations Manager supports the following cloud managers:
• Citrix CloudStack• Microsoft Virtual Machine Manager• VMware vCloud Director• OpenStack Cloud Software• Amazon Web Services (AWS)• Microsoft Azure• IBM SoftLayer
Adding CloudStack Servers as Targets
To add a CloudStack server, specify the following information:
• Host Name or IP Address
Operations Manager assumes port 443. You can specify a different port in the address field.• Username and Password
The credentials must be for a user who is a member of the ROOT account, and has a generated pair of API and Secret keys for CloudStack. Operations Manager uses these credentials to log into the CloudStack server and discover the user’s key values.
NOTE: After setting a CloudStack server as a target, you must then set the hypervisors that server will manage as Oper-ations Manager targets. See Adding Hypervisors as Targets on page 289.
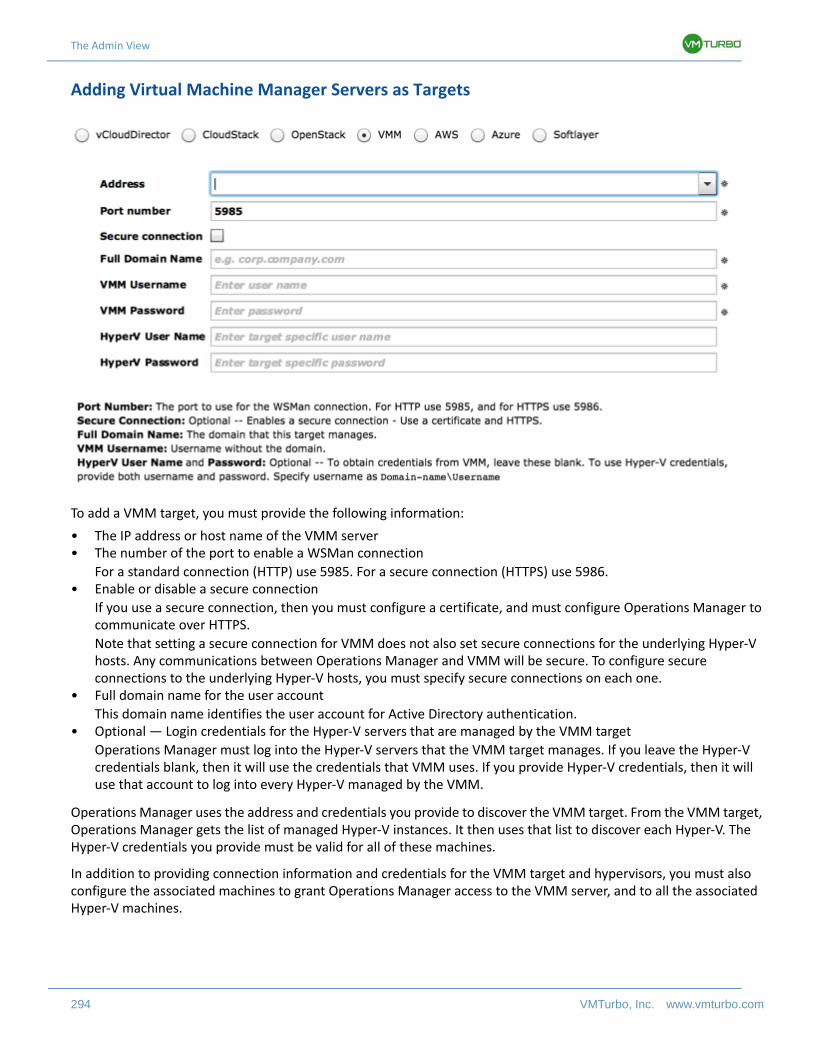
The Admin View
294 VMTurbo, Inc. www.vmturbo.com
Adding Virtual Machine Manager Servers as Targets
To add a VMM target, you must provide the following information:
• The IP address or host name of the VMM server• The number of the port to enable a WSMan connection
For a standard connection (HTTP) use 5985. For a secure connection (HTTPS) use 5986.• Enable or disable a secure connection
If you use a secure connection, then you must configure a certificate, and must configure Operations Manager to communicate over HTTPS.
Note that setting a secure connection for VMM does not also set secure connections for the underlying Hyper-V hosts. Any communications between Operations Manager and VMM will be secure. To configure secure connections to the underlying Hyper-V hosts, you must specify secure connections on each one.
• Full domain name for the user account
This domain name identifies the user account for Active Directory authentication.• Optional — Login credentials for the Hyper-V servers that are managed by the VMM target
Operations Manager must log into the Hyper-V servers that the VMM target manages. If you leave the Hyper-V credentials blank, then it will use the credentials that VMM uses. If you provide Hyper-V credentials, then it will use that account to log into every Hyper-V managed by the VMM.
Operations Manager uses the address and credentials you provide to discover the VMM target. From the VMM target, Operations Manager gets the list of managed Hyper-V instances. It then uses that list to discover each Hyper-V. The Hyper-V credentials you provide must be valid for all of these machines.
In addition to providing connection information and credentials for the VMM target and hypervisors, you must also configure the associated machines to grant Operations Manager access to the VMM server, and to all the associated Hyper-V machines.
Target Configuration
Users Guide 295
Configuring Access to the VMM Server
The VMM server must be configured to allow access via the Windows Remote Management (WinRM) protocol.
NOTE: If you are running VMM Server on a Windows Server version earlier than Windows Server 2012 R2, you must apply the hotfix referenced in the Microsoft Knowledge Base article #2842230 (http://support.microsoft.com/kb/2842230).
To set this access:
1. Set up Windows Remote Management (WinRM) service to run on startup.
NOTE: For you to execute these commands successfully, Windows Firewall must be running. For more informa-tion, see the Microsoft Knowledge Base article #2004640 (http://support.microsoft.com/kb/2004640).
Log into a command window as Administrator on the host machine. Then execute the following commands:
winrm quickconfigy
2. Set permissions on the host machine.
Execute the following commands in the command window:
winrm set winrm/config/service/Auth @{Basic="true"}winrm set winrm/config/service @{AllowUnencrypted="true"}winrm set winrm/config/winrs @{MaxMemoryPerShellMB="1024"}
3. Set up an SPN for the host machine.
The machine must have an SPN of the form, protocol/host_address. For example, WSMAN/10.99.9.2.
To get a list of SPNs for the machine, execute the following in the command window:
setspn -l <vmm-server-name>If there is no valid SPN in the list, create one by running the command:
setspn -A protocol/host-address:port where port is optional
For example, setspn -A WSMAN/10.99.9.2:VMM-02
4. For information about alternative ways to set up WinRM, see the following Green Circle articles:• HowTo Configure Microsoft Virtual Machine Manager (VMM) server for use with VMTurbo Operations
Manager .• WSMan service configuration using domain GPO.
Microsoft VMM and Hyper-V VLANs
Windows Server Hyper-V provides support for VLANs on host and VM partitions. If your Hyper-V environment makes use of this VLAN support, then your VM moves must be sensitive to which hosts provide networking access to your defined VM networks. If a VM is a member of a given VM network, then any move of that VM must be to a host that has access to the same network.
For Hyper-V targets in a VMM environment, the Cloud Control Module is aware of the VM networks, and ensures that a move is to a host that provides connectivity over the given VM network.
Configuring SMB 3.0 File Shares for Operations Manager Discovery
With VMM, Operations Manager can discover SMB 3.0 shares as datastores, assuming these shares have been prop-erly added to your VMM service center. When you add shares to your VMM environment, be sure to:
• Use the Fully Qualified Domain Name of the file server
As you the associated file server to your VMM environment (via the Add Storage Devices Wizard), be sure to
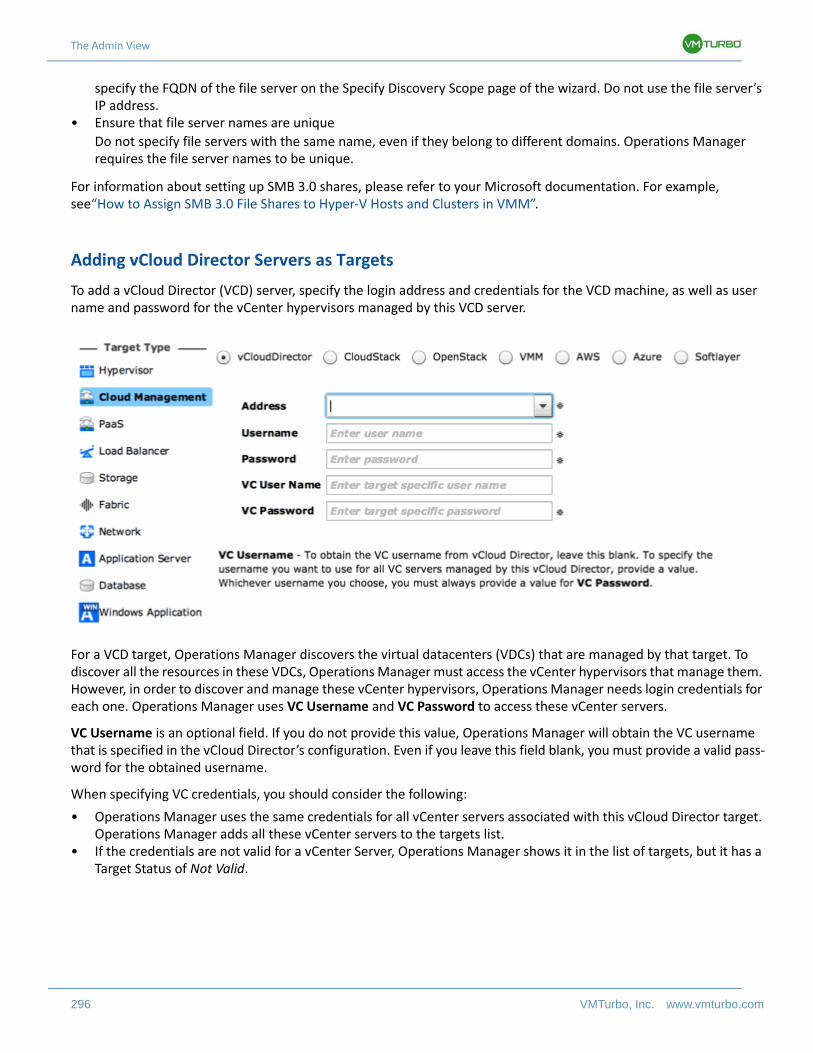
The Admin View
296 VMTurbo, Inc. www.vmturbo.com
specify the FQDN of the file server on the Specify Discovery Scope page of the wizard. Do not use the file server’s IP address.
• Ensure that file server names are unique
Do not specify file servers with the same name, even if they belong to different domains. Operations Manager requires the file server names to be unique.
For information about setting up SMB 3.0 shares, please refer to your Microsoft documentation. For example, see“How to Assign SMB 3.0 File Shares to Hyper-V Hosts and Clusters in VMM”.
Adding vCloud Director Servers as Targets
To add a vCloud Director (VCD) server, specify the login address and credentials for the VCD machine, as well as user name and password for the vCenter hypervisors managed by this VCD server.
For a VCD target, Operations Manager discovers the virtual datacenters (VDCs) that are managed by that target. To discover all the resources in these VDCs, Operations Manager must access the vCenter hypervisors that manage them. However, in order to discover and manage these vCenter hypervisors, Operations Manager needs login credentials for each one. Operations Manager uses VC Username and VC Password to access these vCenter servers.
VC Username is an optional field. If you do not provide this value, Operations Manager will obtain the VC username that is specified in the vCloud Director’s configuration. Even if you leave this field blank, you must provide a valid pass-word for the obtained username.
When specifying VC credentials, you should consider the following:
• Operations Manager uses the same credentials for all vCenter servers associated with this vCloud Director target. Operations Manager adds all these vCenter servers to the targets list.
• If the credentials are not valid for a vCenter Server, Operations Manager shows it in the list of targets, but it has a Target Status of Not Valid.
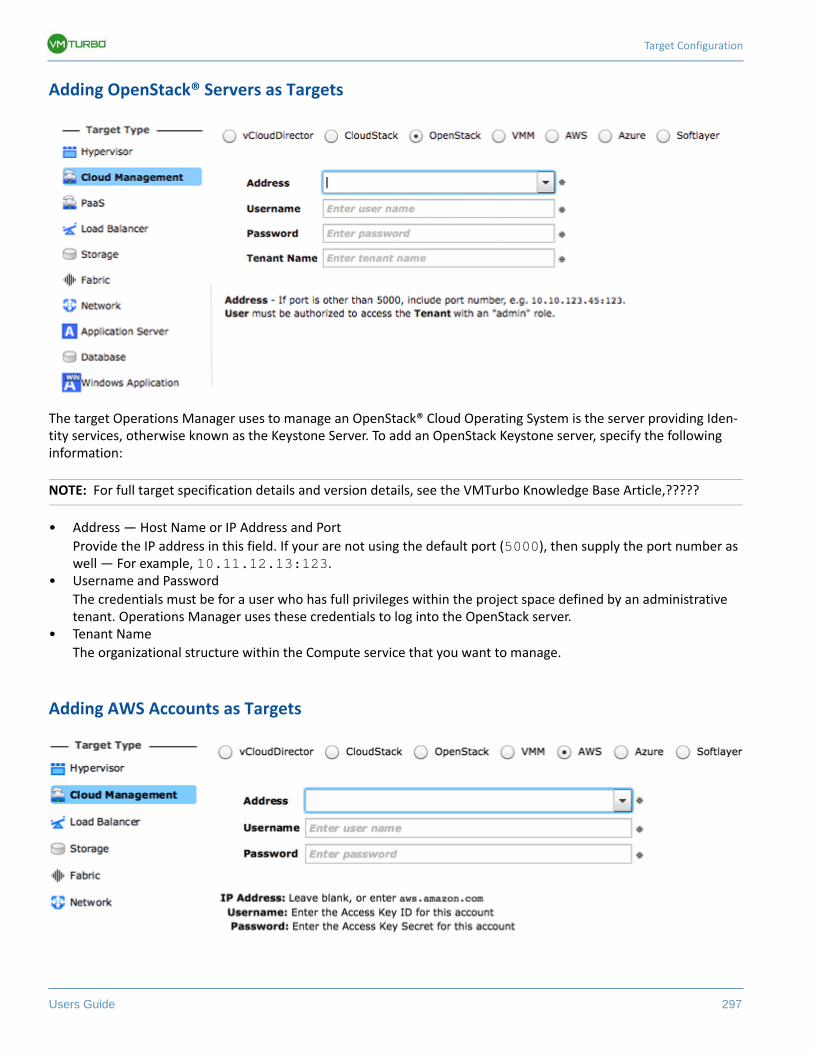
Target Configuration
Users Guide 297
Adding OpenStack® Servers as Targets
The target Operations Manager uses to manage an OpenStack® Cloud Operating System is the server providing Iden-tity services, otherwise known as the Keystone Server. To add an OpenStack Keystone server, specify the following information:
NOTE: For full target specification details and version details, see the VMTurbo Knowledge Base Article,?????
• Address — Host Name or IP Address and Port
Provide the IP address in this field. If your are not using the default port (5000), then supply the port number as well — For example, 10.11.12.13:123.
• Username and Password
The credentials must be for a user who has full privileges within the project space defined by an administrative tenant. Operations Manager uses these credentials to log into the OpenStack server.
• Tenant Name
The organizational structure within the Compute service that you want to manage.
Adding AWS Accounts as Targets
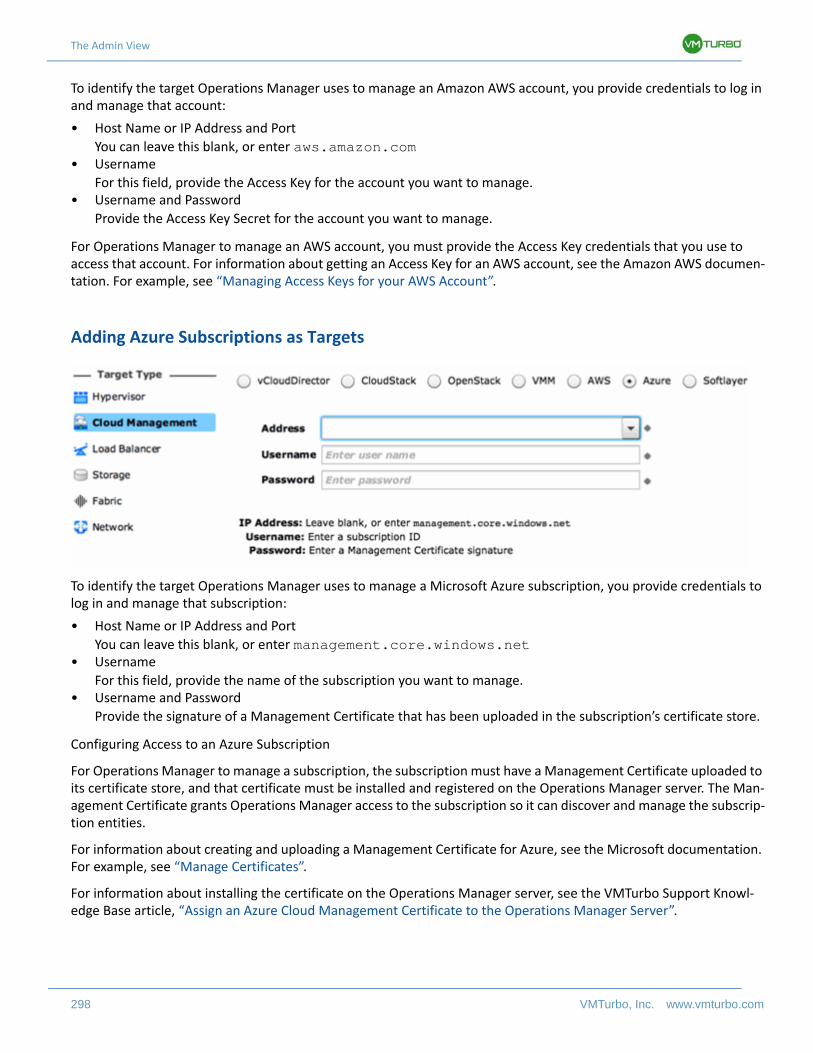
The Admin View
298 VMTurbo, Inc. www.vmturbo.com
To identify the target Operations Manager uses to manage an Amazon AWS account, you provide credentials to log in and manage that account:
• Host Name or IP Address and Port
You can leave this blank, or enter aws.amazon.com• Username
For this field, provide the Access Key for the account you want to manage.• Username and Password
Provide the Access Key Secret for the account you want to manage.
For Operations Manager to manage an AWS account, you must provide the Access Key credentials that you use to access that account. For information about getting an Access Key for an AWS account, see the Amazon AWS documen-tation. For example, see “Managing Access Keys for your AWS Account”.
Adding Azure Subscriptions as Targets
To identify the target Operations Manager uses to manage a Microsoft Azure subscription, you provide credentials to log in and manage that subscription:
• Host Name or IP Address and Port
You can leave this blank, or enter management.core.windows.net• Username
For this field, provide the name of the subscription you want to manage.• Username and Password
Provide the signature of a Management Certificate that has been uploaded in the subscription’s certificate store.
Configuring Access to an Azure Subscription
For Operations Manager to manage a subscription, the subscription must have a Management Certificate uploaded to its certificate store, and that certificate must be installed and registered on the Operations Manager server. The Man-agement Certificate grants Operations Manager access to the subscription so it can discover and manage the subscrip-tion entities.
For information about creating and uploading a Management Certificate for Azure, see the Microsoft documentation. For example, see “Manage Certificates”.
For information about installing the certificate on the Operations Manager server, see the VMTurbo Support Knowl-edge Base article, “Assign an Azure Cloud Management Certificate to the Operations Manager Server”.
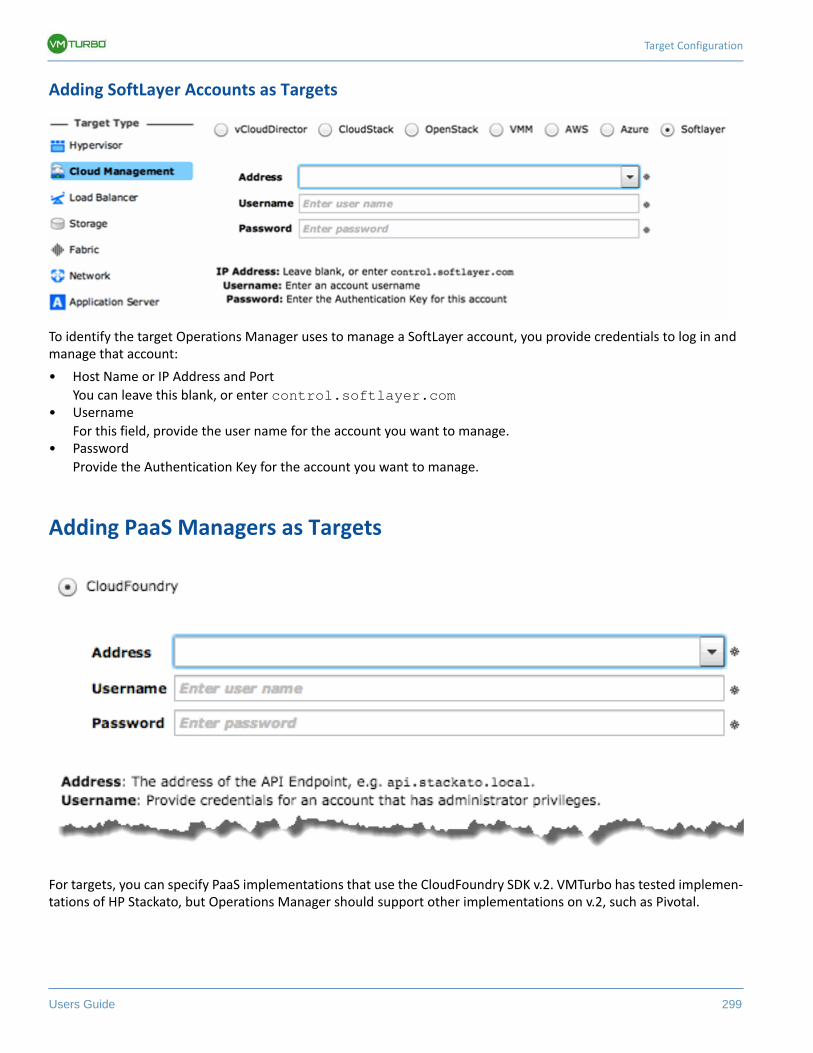
Target Configuration
Users Guide 299
Adding SoftLayer Accounts as Targets
To identify the target Operations Manager uses to manage a SoftLayer account, you provide credentials to log in and manage that account:
• Host Name or IP Address and Port
You can leave this blank, or enter control.softlayer.com• Username
For this field, provide the user name for the account you want to manage.• Password
Provide the Authentication Key for the account you want to manage.
Adding PaaS Managers as Targets
For targets, you can specify PaaS implementations that use the CloudFoundry SDK v.2. VMTurbo has tested implemen-tations of HP Stackato, but Operations Manager should support other implementations on v.2, such as Pivotal.
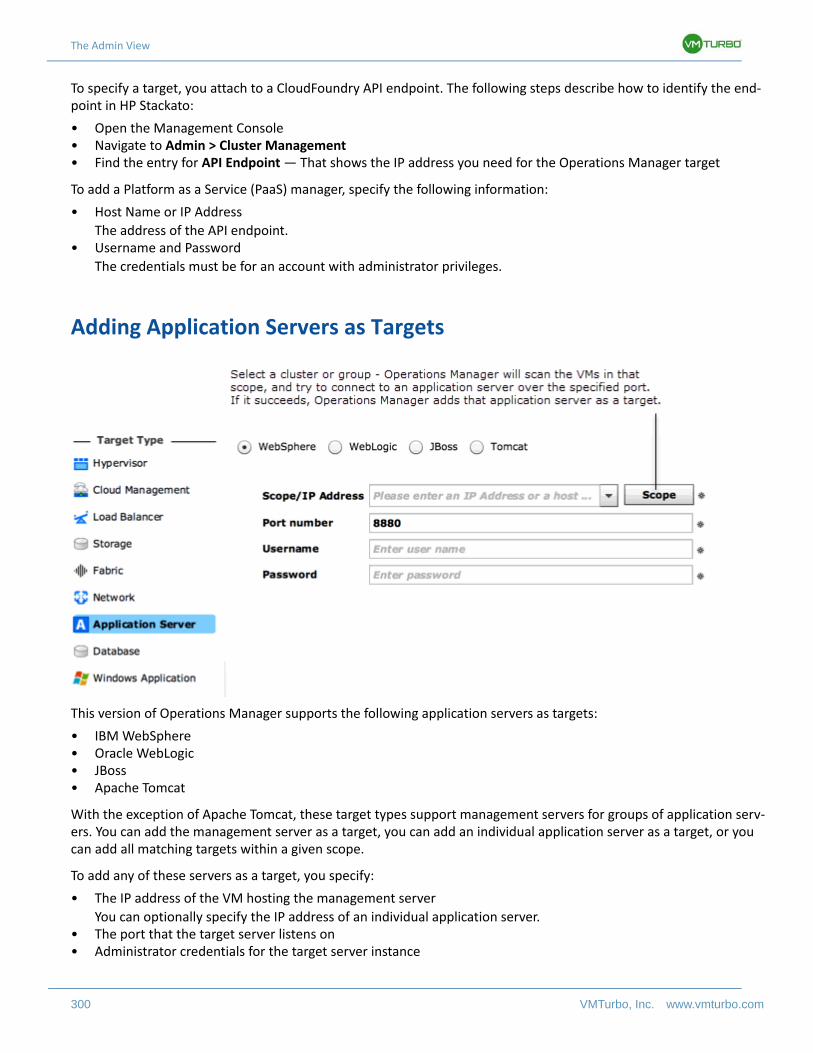
The Admin View
300 VMTurbo, Inc. www.vmturbo.com
To specify a target, you attach to a CloudFoundry API endpoint. The following steps describe how to identify the end-point in HP Stackato:
• Open the Management Console• Navigate to Admin > Cluster Management• Find the entry for API Endpoint — That shows the IP address you need for the Operations Manager target
To add a Platform as a Service (PaaS) manager, specify the following information:
• Host Name or IP Address
The address of the API endpoint.• Username and Password
The credentials must be for an account with administrator privileges.
Adding Application Servers as Targets
This version of Operations Manager supports the following application servers as targets:
• IBM WebSphere• Oracle WebLogic• JBoss• Apache Tomcat
With the exception of Apache Tomcat, these target types support management servers for groups of application serv-ers. You can add the management server as a target, you can add an individual application server as a target, or you can add all matching targets within a given scope.
To add any of these servers as a target, you specify:
• The IP address of the VM hosting the management server
You can optionally specify the IP address of an individual application server.• The port that the target server listens on• Administrator credentials for the target server instance
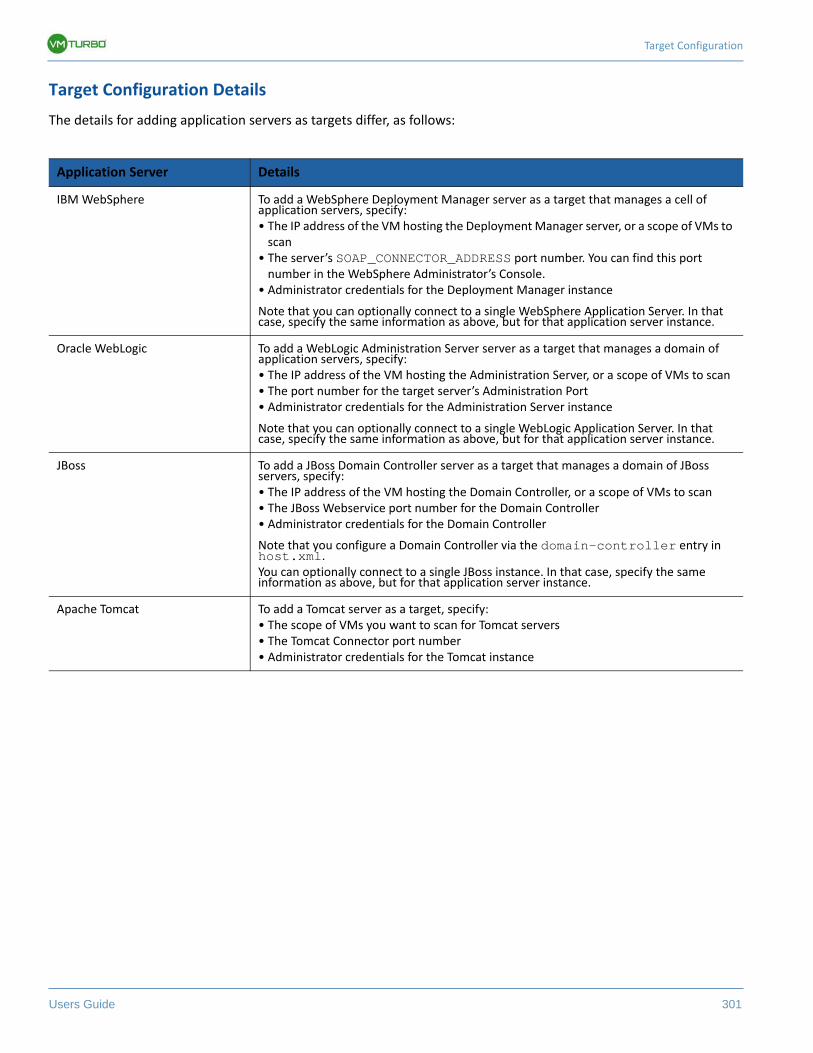
Target Configuration
Users Guide 301
Target Configuration Details
The details for adding application servers as targets differ, as follows:
Application Server Details
IBM WebSphere To add a WebSphere Deployment Manager server as a target that manages a cell of application servers, specify:• The IP address of the VM hosting the Deployment Manager server, or a scope of VMs to
scan• The server’s SOAP_CONNECTOR_ADDRESS port number. You can find this port
number in the WebSphere Administrator’s Console.• Administrator credentials for the Deployment Manager instance
Note that you can optionally connect to a single WebSphere Application Server. In that case, specify the same information as above, but for that application server instance.
Oracle WebLogic To add a WebLogic Administration Server server as a target that manages a domain of application servers, specify:• The IP address of the VM hosting the Administration Server, or a scope of VMs to scan• The port number for the target server’s Administration Port• Administrator credentials for the Administration Server instance
Note that you can optionally connect to a single WebLogic Application Server. In that case, specify the same information as above, but for that application server instance.
JBoss To add a JBoss Domain Controller server as a target that manages a domain of JBoss servers, specify:• The IP address of the VM hosting the Domain Controller, or a scope of VMs to scan• The JBoss Webservice port number for the Domain Controller• Administrator credentials for the Domain Controller
Note that you configure a Domain Controller via the domain-controller entry in host.xml.You can optionally connect to a single JBoss instance. In that case, specify the same information as above, but for that application server instance.
Apache Tomcat To add a Tomcat server as a target, specify:• The scope of VMs you want to scan for Tomcat servers• The Tomcat Connector port number• Administrator credentials for the Tomcat instance
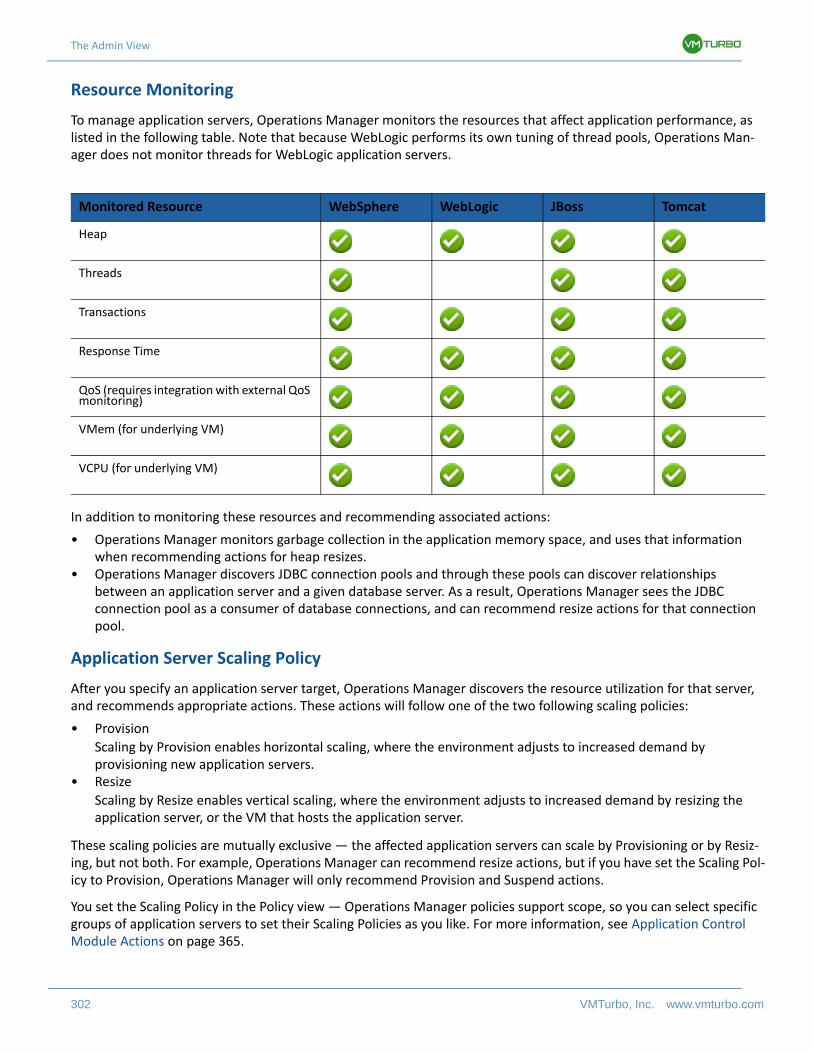
The Admin View
302 VMTurbo, Inc. www.vmturbo.com
Resource Monitoring
To manage application servers, Operations Manager monitors the resources that affect application performance, as listed in the following table. Note that because WebLogic performs its own tuning of thread pools, Operations Man-ager does not monitor threads for WebLogic application servers.
In addition to monitoring these resources and recommending associated actions:
• Operations Manager monitors garbage collection in the application memory space, and uses that information when recommending actions for heap resizes.
• Operations Manager discovers JDBC connection pools and through these pools can discover relationships between an application server and a given database server. As a result, Operations Manager sees the JDBC connection pool as a consumer of database connections, and can recommend resize actions for that connection pool.
Application Server Scaling Policy
After you specify an application server target, Operations Manager discovers the resource utilization for that server, and recommends appropriate actions. These actions will follow one of the two following scaling policies:
• Provision
Scaling by Provision enables horizontal scaling, where the environment adjusts to increased demand by provisioning new application servers.
• Resize
Scaling by Resize enables vertical scaling, where the environment adjusts to increased demand by resizing the application server, or the VM that hosts the application server.
These scaling policies are mutually exclusive — the affected application servers can scale by Provisioning or by Resiz-ing, but not both. For example, Operations Manager can recommend resize actions, but if you have set the Scaling Pol-icy to Provision, Operations Manager will only recommend Provision and Suspend actions.
You set the Scaling Policy in the Policy view — Operations Manager policies support scope, so you can select specific groups of application servers to set their Scaling Policies as you like. For more information, see Application Control Module Actions on page 365.
Monitored Resource WebSphere WebLogic JBoss Tomcat
Heap
Threads
Transactions
Response Time
QoS (requires integration with external QoS monitoring)
VMem (for underlying VM)
VCPU (for underlying VM)
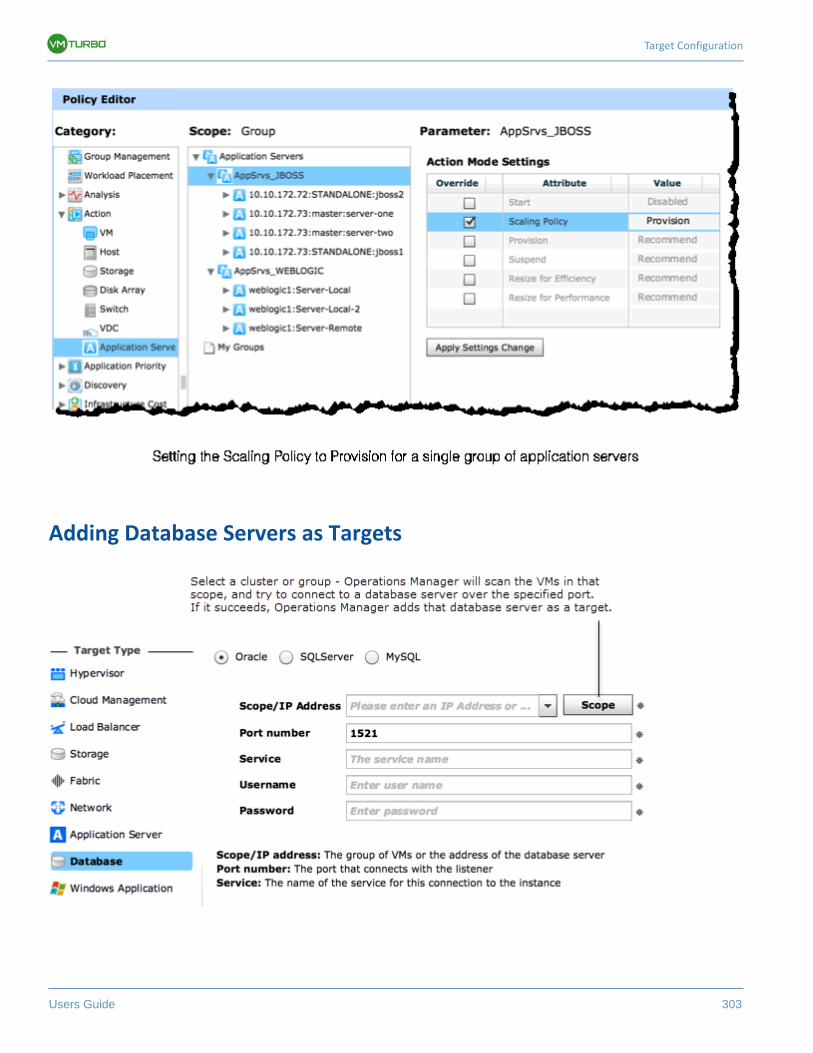
Target Configuration
Users Guide 303
Adding Database Servers as Targets
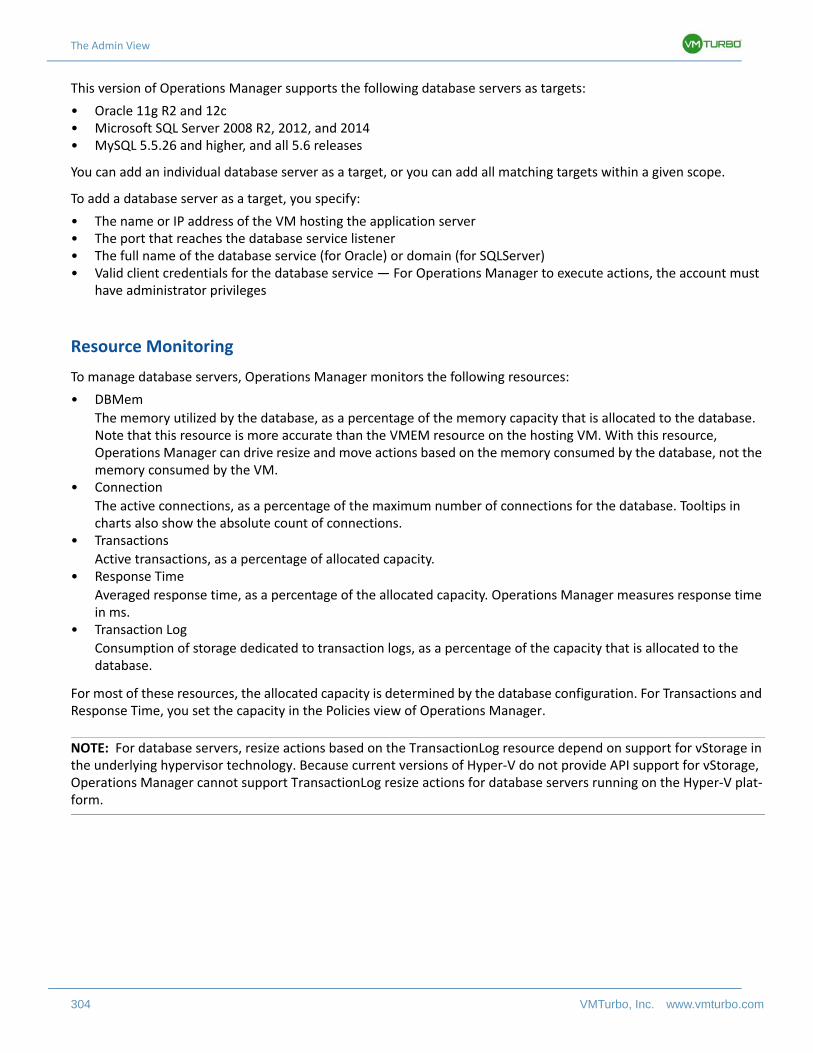
The Admin View
304 VMTurbo, Inc. www.vmturbo.com
This version of Operations Manager supports the following database servers as targets:
• Oracle 11g R2 and 12c• Microsoft SQL Server 2008 R2, 2012, and 2014• MySQL 5.5.26 and higher, and all 5.6 releases
You can add an individual database server as a target, or you can add all matching targets within a given scope.
To add a database server as a target, you specify:
• The name or IP address of the VM hosting the application server• The port that reaches the database service listener• The full name of the database service (for Oracle) or domain (for SQLServer)• Valid client credentials for the database service — For Operations Manager to execute actions, the account must
have administrator privileges
Resource Monitoring
To manage database servers, Operations Manager monitors the following resources:
• DBMem
The memory utilized by the database, as a percentage of the memory capacity that is allocated to the database. Note that this resource is more accurate than the VMEM resource on the hosting VM. With this resource, Operations Manager can drive resize and move actions based on the memory consumed by the database, not the memory consumed by the VM.
• Connection
The active connections, as a percentage of the maximum number of connections for the database. Tooltips in charts also show the absolute count of connections.
• Transactions
Active transactions, as a percentage of allocated capacity.• Response Time
Averaged response time, as a percentage of the allocated capacity. Operations Manager measures response time in ms.
• Transaction Log
Consumption of storage dedicated to transaction logs, as a percentage of the capacity that is allocated to the database.
For most of these resources, the allocated capacity is determined by the database configuration. For Transactions and Response Time, you set the capacity in the Policies view of Operations Manager.
NOTE: For database servers, resize actions based on the TransactionLog resource depend on support for vStorage in the underlying hypervisor technology. Because current versions of Hyper-V do not provide API support for vStorage, Operations Manager cannot support TransactionLog resize actions for database servers running on the Hyper-V plat-form.
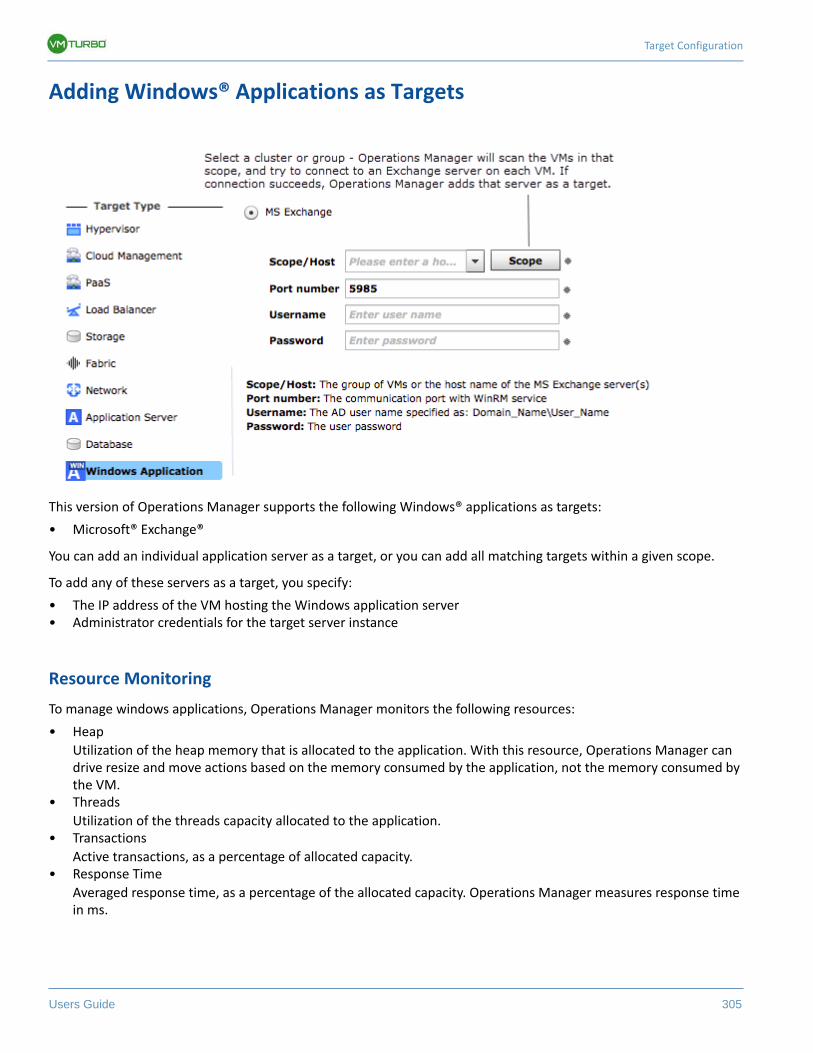
Target Configuration
Users Guide 305
Adding Windows® Applications as Targets
This version of Operations Manager supports the following Windows® applications as targets:
• Microsoft® Exchange®
You can add an individual application server as a target, or you can add all matching targets within a given scope.
To add any of these servers as a target, you specify:
• The IP address of the VM hosting the Windows application server• Administrator credentials for the target server instance
Resource Monitoring
To manage windows applications, Operations Manager monitors the following resources:
• Heap
Utilization of the heap memory that is allocated to the application. With this resource, Operations Manager can drive resize and move actions based on the memory consumed by the application, not the memory consumed by the VM.
• Threads
Utilization of the threads capacity allocated to the application.• Transactions
Active transactions, as a percentage of allocated capacity.• Response Time
Averaged response time, as a percentage of the allocated capacity. Operations Manager measures response time in ms.
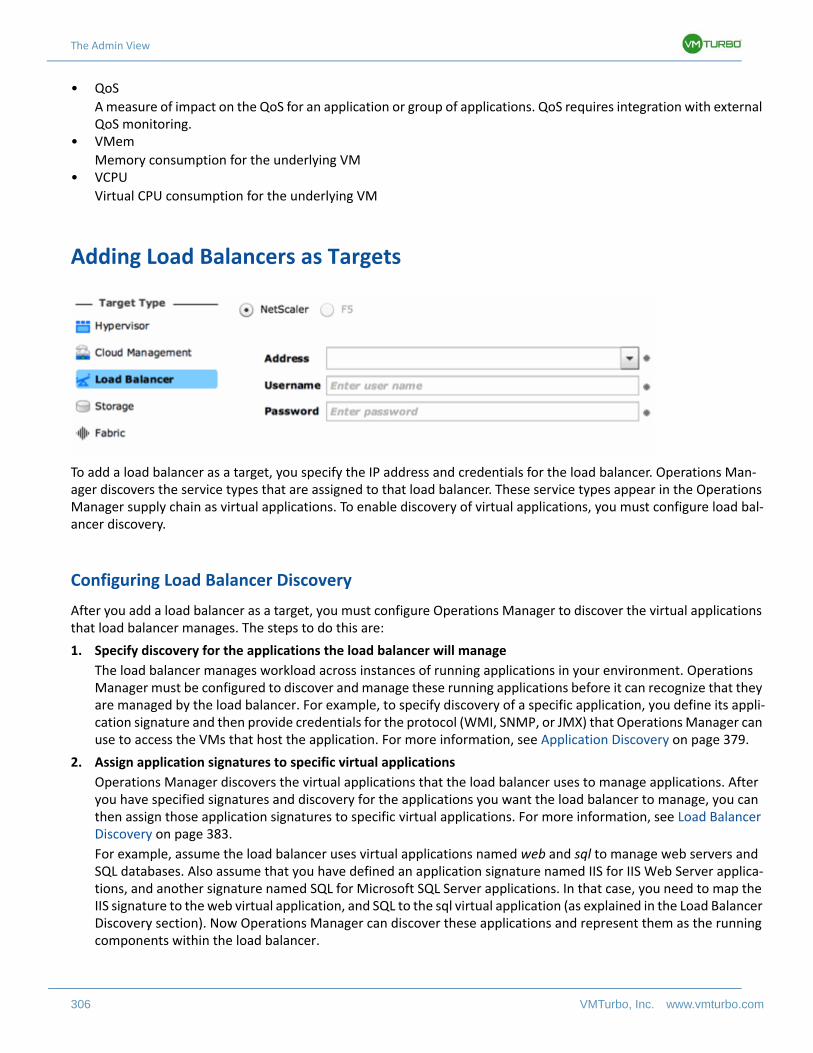
The Admin View
306 VMTurbo, Inc. www.vmturbo.com
• QoS
A measure of impact on the QoS for an application or group of applications. QoS requires integration with external QoS monitoring.
• VMem
Memory consumption for the underlying VM• VCPU
Virtual CPU consumption for the underlying VM
Adding Load Balancers as Targets
To add a load balancer as a target, you specify the IP address and credentials for the load balancer. Operations Man-ager discovers the service types that are assigned to that load balancer. These service types appear in the Operations Manager supply chain as virtual applications. To enable discovery of virtual applications, you must configure load bal-ancer discovery.
Configuring Load Balancer Discovery
After you add a load balancer as a target, you must configure Operations Manager to discover the virtual applications that load balancer manages. The steps to do this are:
1. Specify discovery for the applications the load balancer will manage
The load balancer manages workload across instances of running applications in your environment. Operations Manager must be configured to discover and manage these running applications before it can recognize that they are managed by the load balancer. For example, to specify discovery of a specific application, you define its appli-cation signature and then provide credentials for the protocol (WMI, SNMP, or JMX) that Operations Manager can use to access the VMs that host the application. For more information, see Application Discovery on page 379.
2. Assign application signatures to specific virtual applications
Operations Manager discovers the virtual applications that the load balancer uses to manage applications. After you have specified signatures and discovery for the applications you want the load balancer to manage, you can then assign those application signatures to specific virtual applications. For more information, see Load Balancer Discovery on page 383.
For example, assume the load balancer uses virtual applications named web and sql to manage web servers and SQL databases. Also assume that you have defined an application signature named IIS for IIS Web Server applica-tions, and another signature named SQL for Microsoft SQL Server applications. In that case, you need to map the IIS signature to the web virtual application, and SQL to the sql virtual application (as explained in the Load Balancer Discovery section). Now Operations Manager can discover these applications and represent them as the running components within the load balancer.
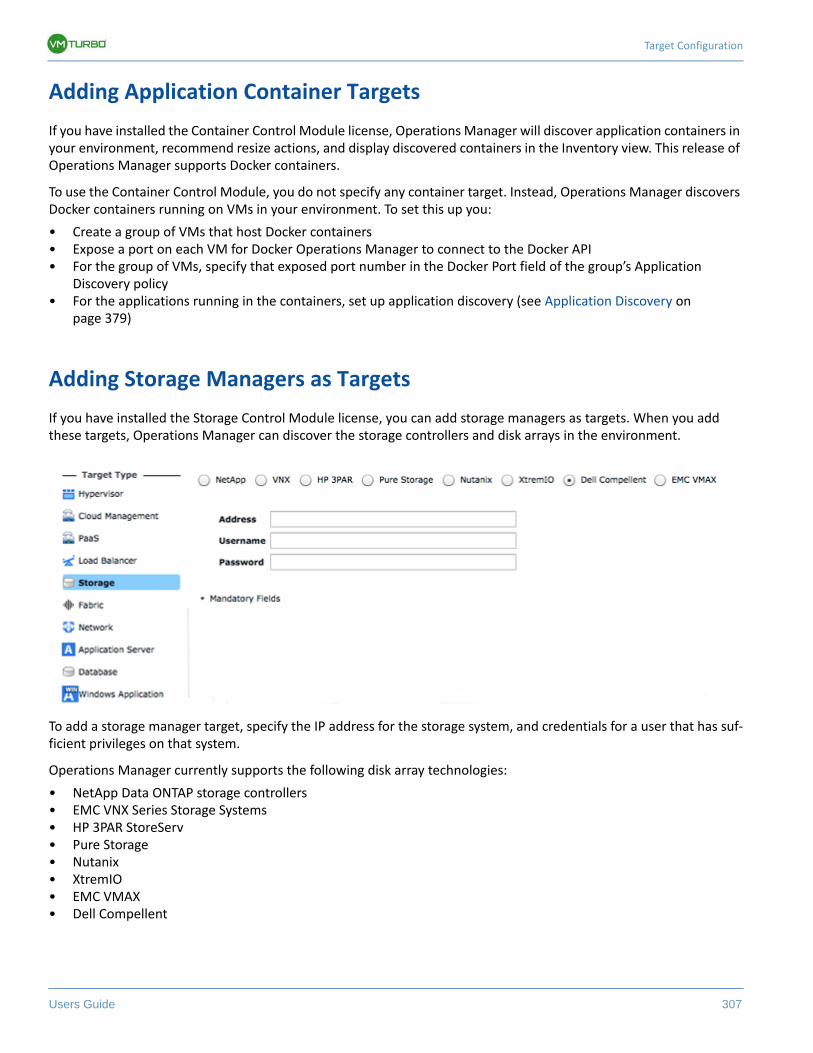
Target Configuration
Users Guide 307
Adding Application Container Targets
If you have installed the Container Control Module license, Operations Manager will discover application containers in your environment, recommend resize actions, and display discovered containers in the Inventory view. This release of Operations Manager supports Docker containers.
To use the Container Control Module, you do not specify any container target. Instead, Operations Manager discovers Docker containers running on VMs in your environment. To set this up you:
• Create a group of VMs that host Docker containers• Expose a port on each VM for Docker Operations Manager to connect to the Docker API• For the group of VMs, specify that exposed port number in the Docker Port field of the group’s Application
Discovery policy• For the applications running in the containers, set up application discovery (see Application Discovery on
page 379)
Adding Storage Managers as Targets
If you have installed the Storage Control Module license, you can add storage managers as targets. When you add these targets, Operations Manager can discover the storage controllers and disk arrays in the environment.
To add a storage manager target, specify the IP address for the storage system, and credentials for a user that has suf-ficient privileges on that system.
Operations Manager currently supports the following disk array technologies:
• NetApp Data ONTAP storage controllers• EMC VNX Series Storage Systems• HP 3PAR StoreServ• Pure Storage• Nutanix• XtremIO• EMC VMAX• Dell Compellent
The Admin View
308 VMTurbo, Inc. www.vmturbo.com
Specifying Access to NetApp Targets
NetApp filers run on the Data ONTAP operating system. To specify a NetApp target:
• For OnTap 7-Mode, provide the Storage System IP address• For OnTap C-Mode, provide the Cluster Management IP address
To discover and fully manage NetApp disk arrays, Operations Manager must have a role and user account that grants privileges to execute certain commands via the filer’s API. In most cases, you can provide a user account with Admin-istrator privileges and password authentication. This account grants read and write access to the Operations Manager server so it can discover storage resources and execute actions.
When you add the NetApp target, you enter credentials for a user that has the necessary role. Then Operations Man-ager can log into the filer to perform discovery, analysis, and perform actions.
NOTE: In some circumstances you might want to provide minimal privileges to the Operations Manager user account. For example, you might want to use an account that has read-only privileges. For instructions to provide a role with minimal privileges, see the VMTurbo Support Knowledge Base articles for Configuring NetApp 7-Mode Targets and Configuring NetApp C-Mode Targets.
Specifying Access to EMC VNX Targets
Operations Manager supports management of EMC VNX File storage systems and Block storage systems.
NOTE: For full target specification details and version details, see the VMTurbo Knowledge Base Article, EMC VNX Support .
The requirements for specifying VNX targets differ depending on the type of storage system you want to manage.
• File-level storage
Provide the name or IP address of the VNX Control Station. Operations Manager discovers all the storage volumes on that control station.
• Block-level storage
Access to these systems is made available via an EMC SMI-S provider that has the disk arrays added to it. A single SMI-S provider can communicate with one or more disk arrays. When you specify an SMI-S provider as a target, Operations Manager discovers all the added disk arrays.
You should be able to download the EMC SMI-S provider from the EMC support site. If you have not already installed an EMC SMI-S provider to monitor your disk arrays, you can download and install the provider, and add your disk arrays to it. You should be able to download the EMC SMI-S provider from the EMC support site.
Note that when calculating available storage, Operations Manager excludes the disks devoted to the VNX operating system.
Specifying Access to Pure Storage FlashArray
Operations Manager supports management of Pure Storage FlashArray systems. To add an array as a target, enter the array’s IP address and login credentials for an account with administration privileges. Operations Manager uses that account to connect with the target array, discover volumes, and execute actions.
Target Configuration
Users Guide 309
Note that one Pure Storage target manages a single Pure Storage FlashArray instance. The storage devices in the array are all flash storage — the IOPS capacity uses the setting made for SSD Disks in the Policy vies (see Storage Settings on page 362).
Specifying Access to Nutanix Targets
Nutanix products provide hyperconverged platforms that include (among other things) VM hosting and a distributed storage fabric. Operations Manager supports management of Nutanix fabrics, where the supply chain treats a Nutanix Storage Pool as a disk array.
To add a Nutanix node as a target and manage its storage resources, provide the cluster’s External IP address (if one is configured), or the IP address of the cluster’s Controller VM (CVM).
You can also add the specific hypervisor on the Nutanix node as a target. This adds the entities on the hypervisor to the managed supply chain, including the discovered host, VMs, and storage. If your environment uses hypervisor tar-gets that Operations Manager supports, then you should also specify those targets. This gives you the full benefit of Operations Manager control across the full supply chain, including the entities in the Nutanix node and the entities in the hypervisor. In addition, the analysis takes Nutanix hot storage utilization into account.
Operations Manager considers utilization of HotStorage (server-attached flash) to calculate VM placement that uses server flash efficiently and with assured performance. In addition, Operations Manager can recommend actions to scale flash capacity up or down by adding more hosts to the cluster, or more flash drives to the hosts.
Specifying Access to EMC XtremeIO Targets
EMC® XtremIO® is a flash-based (SSD) storage solution, designed to push data to applications at higher speeds. The system building blocks are SAN appliances called X-Bricks. A deployment is organized into clusters of X-Bricks, and the clusters are managed by the XtremIO Management Server (XMS).
To add an XTremeIO system to Operations Manager, provide the IP address of the XMS server. Operations Manager discovers all the XtremeIO clusters managed by that XMS.
Specifying Access to EMC VMAX Targets
Operations Manager supports management of EMC VMAX storage arrays. The VMAX series is a family of enterprise storage arrays designed for SAN environments.
Access to these systems is available via an EMC SMI-S provider that has the disk arrays added to it. A single SMI-S pro-vider can communicate with one or more disk arrays. When you specify an SMI-S provider as a target, Operations Manager discovers all the added disk arrays.
You should be able to download the EMC SMI-S provider from the EMC support site. If you have not already installed an EMC SMI-S provider to monitor your disk arrays, you can download and install the provider, and add your disk arrays to it. You should be able to download the EMC SMI-S provider from the EMC support site.
By default, the provider uses UDP port 427 and TCP ports 5988 for HTTP or 5989 for HTTPS. The port that your SMI-S provider uses must pass through host’s firewall. Follow your OS system procedure for adding these ports to the fire-wall exception list.
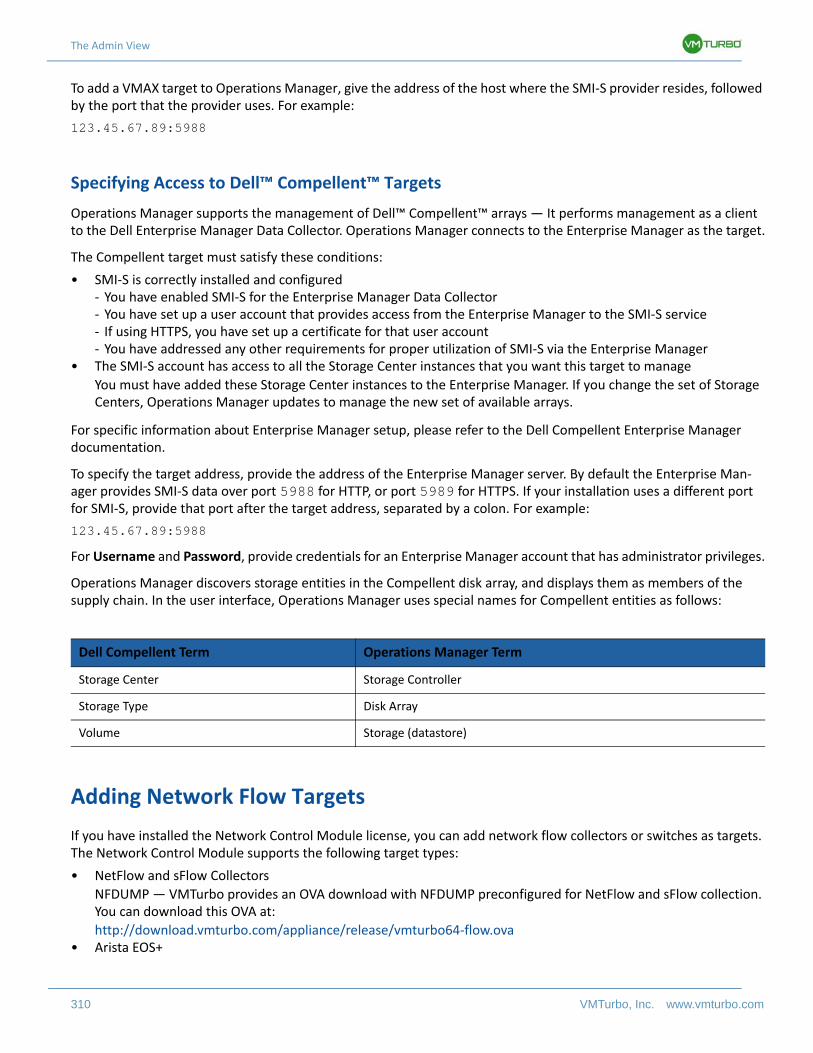
The Admin View
310 VMTurbo, Inc. www.vmturbo.com
To add a VMAX target to Operations Manager, give the address of the host where the SMI-S provider resides, followed by the port that the provider uses. For example:
123.45.67.89:5988
Specifying Access to Dell™ Compellent™ Targets
Operations Manager supports the management of Dell™ Compellent™ arrays — It performs management as a client to the Dell Enterprise Manager Data Collector. Operations Manager connects to the Enterprise Manager as the target.
The Compellent target must satisfy these conditions:
• SMI-S is correctly installed and configured- You have enabled SMI-S for the Enterprise Manager Data Collector- You have set up a user account that provides access from the Enterprise Manager to the SMI-S service- If using HTTPS, you have set up a certificate for that user account- You have addressed any other requirements for proper utilization of SMI-S via the Enterprise Manager
• The SMI-S account has access to all the Storage Center instances that you want this target to manage
You must have added these Storage Center instances to the Enterprise Manager. If you change the set of Storage Centers, Operations Manager updates to manage the new set of available arrays.
For specific information about Enterprise Manager setup, please refer to the Dell Compellent Enterprise Manager documentation.
To specify the target address, provide the address of the Enterprise Manager server. By default the Enterprise Man-ager provides SMI-S data over port 5988 for HTTP, or port 5989 for HTTPS. If your installation uses a different port for SMI-S, provide that port after the target address, separated by a colon. For example:
123.45.67.89:5988
For Username and Password, provide credentials for an Enterprise Manager account that has administrator privileges.
Operations Manager discovers storage entities in the Compellent disk array, and displays them as members of the supply chain. In the user interface, Operations Manager uses special names for Compellent entities as follows:
Adding Network Flow Targets
If you have installed the Network Control Module license, you can add network flow collectors or switches as targets. The Network Control Module supports the following target types:
• NetFlow and sFlow Collectors
NFDUMP — VMTurbo provides an OVA download with NFDUMP preconfigured for NetFlow and sFlow collection. You can download this OVA at:
http://download.vmturbo.com/appliance/release/vmturbo64-flow.ova • Arista EOS+
Dell Compellent Term Operations Manager Term
Storage Center Storage Controller
Storage Type Disk Array
Volume Storage (datastore)
Target Configuration
Users Guide 311
When you assign a network flow target, Operations Manager discovers:
• Network flow
The NetFlow or sFlow data that is being collected by flow collectors, or the network data that is exposed by the Arista eAPI.
• VPods
Sets of VMs or other consumers that communicate frequently with each other over the network.• DPods
Sets of associated resource providers — For example, a DPod is a storage controller, its datastores, and the hosts that consume the storage resources. A UCS chassis can also make up a DPod.
To monitor an Arista network, you add a single Top-Of-Rack switch from the network you want to monitor. Operations Manager can discover the rest of the network through that single switch. The result is one DPod per switch. To use a switch as a target, it must have the Arista Command eAPI must be enabled for HTTPS communication. For information about configuring Arista switches, refer to the Arista documentation.
To use a flow collector with the Network Control Module, you must first have installed that flow collector to gather data from the individual switches it will monitor.
To add an installed flow collector as a target, specify the IP address for the flow collector, and credentials for an admin-istrator user account on that system.
NOTE: When you configure sFlow and NetFlow collectors as targets, you must also have a license for the Storage Control Module. With these collectors, Operations Manager discovers DPods through storage controllers, and you need the Storage Control Module to discover storage controllers. Keep in mind that DPods are an important feature of the Network Control Module. The most efficient network traffic results when each VPod can be restricted to a single host. However, such an environment is unlikely. Operations Manager does have a likely chance of restricting most VPods to single DPods. This can give much better network performance than placing VMs arbitrarily across the data-center.
Adding Fabric Managers as Targets
If you have installed the Fabric Control Module license, you can add fabric managers as targets. When you add these targets, Operations Manager can discover the associate fabric components.
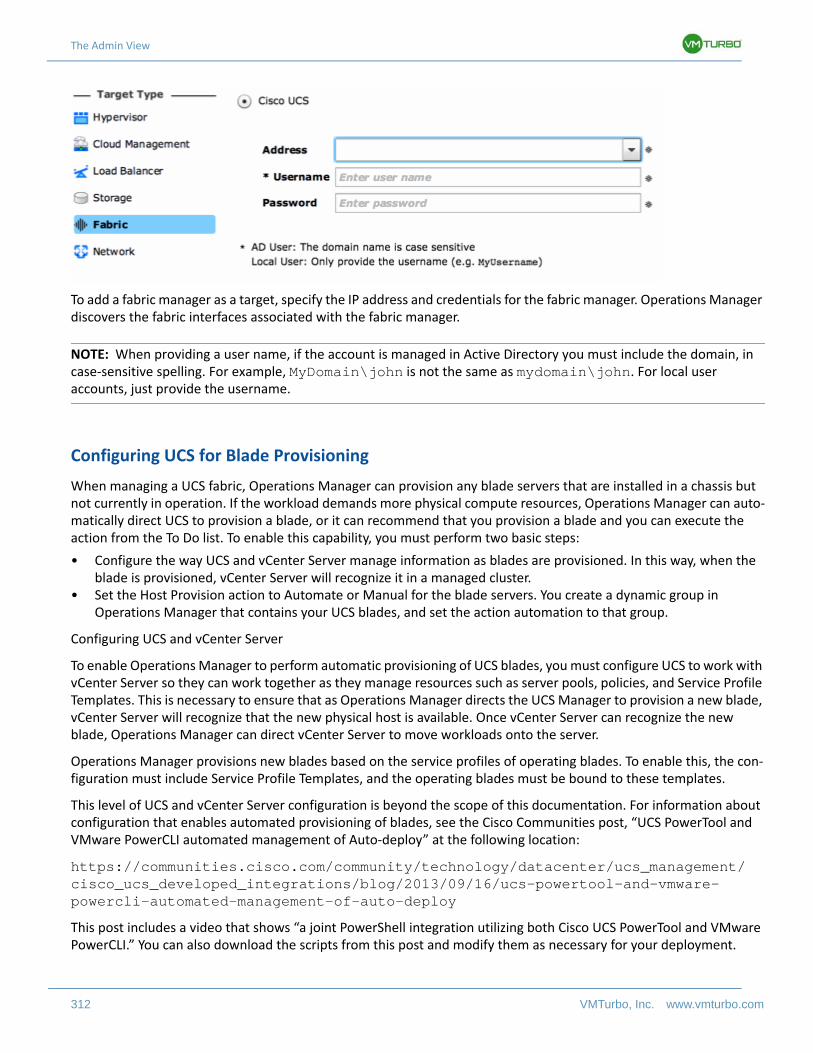
The Admin View
312 VMTurbo, Inc. www.vmturbo.com
To add a fabric manager as a target, specify the IP address and credentials for the fabric manager. Operations Manager discovers the fabric interfaces associated with the fabric manager.
NOTE: When providing a user name, if the account is managed in Active Directory you must include the domain, in case-sensitive spelling. For example, MyDomain\john is not the same as mydomain\john. For local user accounts, just provide the username.
Configuring UCS for Blade Provisioning
When managing a UCS fabric, Operations Manager can provision any blade servers that are installed in a chassis but not currently in operation. If the workload demands more physical compute resources, Operations Manager can auto-matically direct UCS to provision a blade, or it can recommend that you provision a blade and you can execute the action from the To Do list. To enable this capability, you must perform two basic steps:
• Configure the way UCS and vCenter Server manage information as blades are provisioned. In this way, when the blade is provisioned, vCenter Server will recognize it in a managed cluster.
• Set the Host Provision action to Automate or Manual for the blade servers. You create a dynamic group in Operations Manager that contains your UCS blades, and set the action automation to that group.
Configuring UCS and vCenter Server
To enable Operations Manager to perform automatic provisioning of UCS blades, you must configure UCS to work with vCenter Server so they can work together as they manage resources such as server pools, policies, and Service Profile Templates. This is necessary to ensure that as Operations Manager directs the UCS Manager to provision a new blade, vCenter Server will recognize that the new physical host is available. Once vCenter Server can recognize the new blade, Operations Manager can direct vCenter Server to move workloads onto the server.
Operations Manager provisions new blades based on the service profiles of operating blades. To enable this, the con-figuration must include Service Profile Templates, and the operating blades must be bound to these templates.
This level of UCS and vCenter Server configuration is beyond the scope of this documentation. For information about configuration that enables automated provisioning of blades, see the Cisco Communities post, “UCS PowerTool and VMware PowerCLI automated management of Auto-deploy” at the following location:
https://communities.cisco.com/community/technology/datacenter/ucs_management/cisco_ucs_developed_integrations/blog/2013/09/16/ucs-powertool-and-vmware-powercli-automated-management-of-auto-deploy
This post includes a video that shows “a joint PowerShell integration utilizing both Cisco UCS PowerTool and VMware PowerCLI.” You can also download the scripts from this post and modify them as necessary for your deployment.
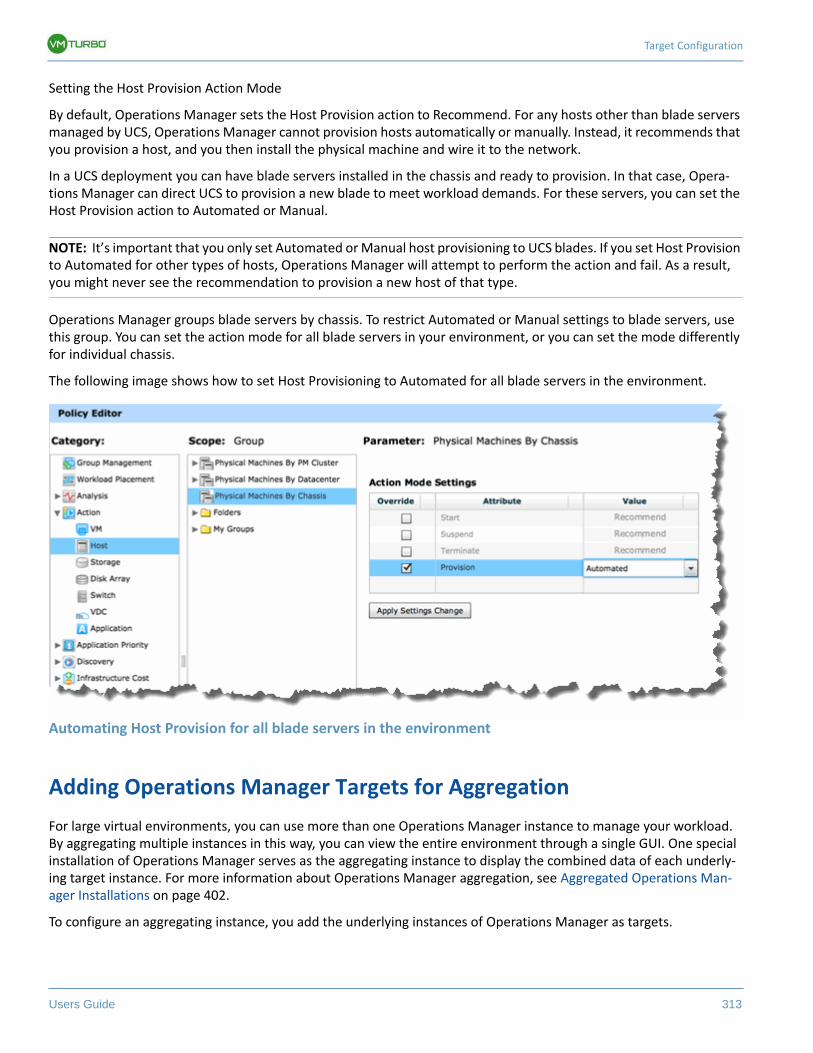
Target Configuration
Users Guide 313
Setting the Host Provision Action Mode
By default, Operations Manager sets the Host Provision action to Recommend. For any hosts other than blade servers managed by UCS, Operations Manager cannot provision hosts automatically or manually. Instead, it recommends that you provision a host, and you then install the physical machine and wire it to the network.
In a UCS deployment you can have blade servers installed in the chassis and ready to provision. In that case, Opera-tions Manager can direct UCS to provision a new blade to meet workload demands. For these servers, you can set the Host Provision action to Automated or Manual.
NOTE: It’s important that you only set Automated or Manual host provisioning to UCS blades. If you set Host Provision to Automated for other types of hosts, Operations Manager will attempt to perform the action and fail. As a result, you might never see the recommendation to provision a new host of that type.
Operations Manager groups blade servers by chassis. To restrict Automated or Manual settings to blade servers, use this group. You can set the action mode for all blade servers in your environment, or you can set the mode differently for individual chassis.
The following image shows how to set Host Provisioning to Automated for all blade servers in the environment.
Automating Host Provision for all blade servers in the environment
Adding Operations Manager Targets for Aggregation
For large virtual environments, you can use more than one Operations Manager instance to manage your workload. By aggregating multiple instances in this way, you can view the entire environment through a single GUI. One special installation of Operations Manager serves as the aggregating instance to display the combined data of each underly-ing target instance. For more information about Operations Manager aggregation, see Aggregated Operations Man-ager Installations on page 402.
To configure an aggregating instance, you add the underlying instances of Operations Manager as targets.
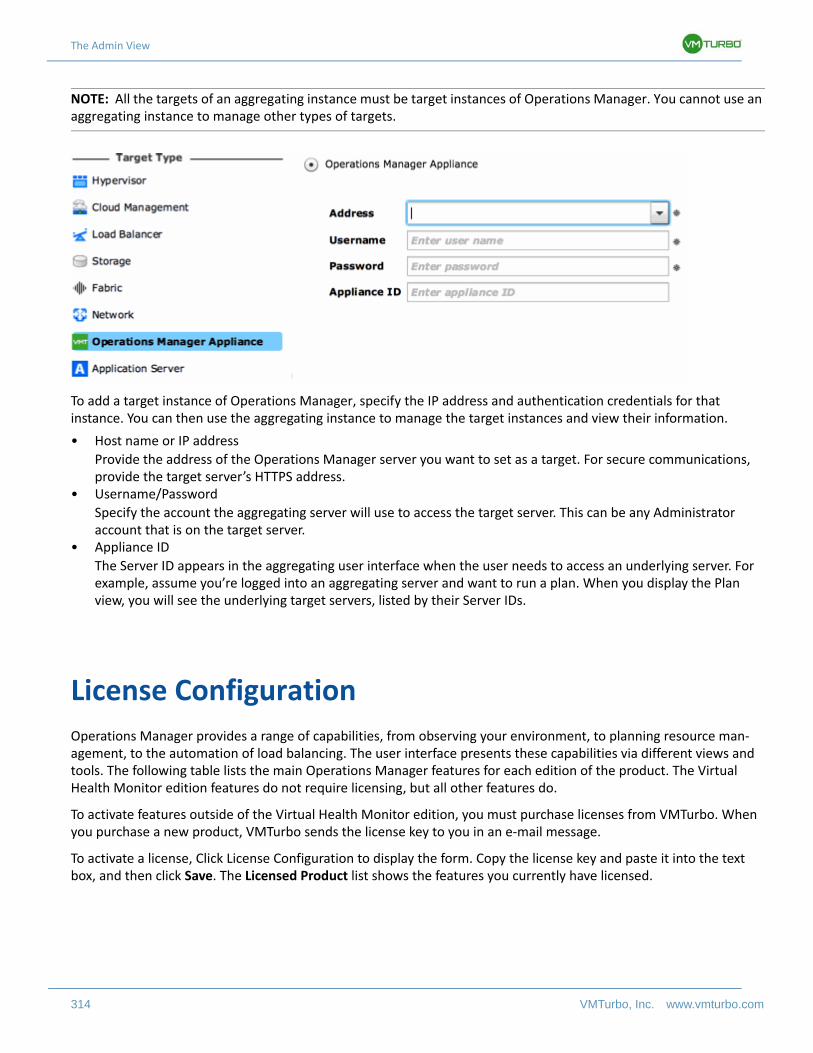
The Admin View
314 VMTurbo, Inc. www.vmturbo.com
NOTE: All the targets of an aggregating instance must be target instances of Operations Manager. You cannot use an aggregating instance to manage other types of targets.
To add a target instance of Operations Manager, specify the IP address and authentication credentials for that instance. You can then use the aggregating instance to manage the target instances and view their information.
• Host name or IP address
Provide the address of the Operations Manager server you want to set as a target. For secure communications, provide the target server’s HTTPS address.
• Username/Password
Specify the account the aggregating server will use to access the target server. This can be any Administrator account that is on the target server.
• Appliance ID
The Server ID appears in the aggregating user interface when the user needs to access an underlying server. For example, assume you’re logged into an aggregating server and want to run a plan. When you display the Plan view, you will see the underlying target servers, listed by their Server IDs.
License Configuration
Operations Manager provides a range of capabilities, from observing your environment, to planning resource man-agement, to the automation of load balancing. The user interface presents these capabilities via different views and tools. The following table lists the main Operations Manager features for each edition of the product. The Virtual Health Monitor edition features do not require licensing, but all other features do.
To activate features outside of the Virtual Health Monitor edition, you must purchase licenses from VMTurbo. When you purchase a new product, VMTurbo sends the license key to you in an e-mail message.
To activate a license, Click License Configuration to display the form. Copy the license key and paste it into the text box, and then click Save. The Licensed Product list shows the features you currently have licensed.
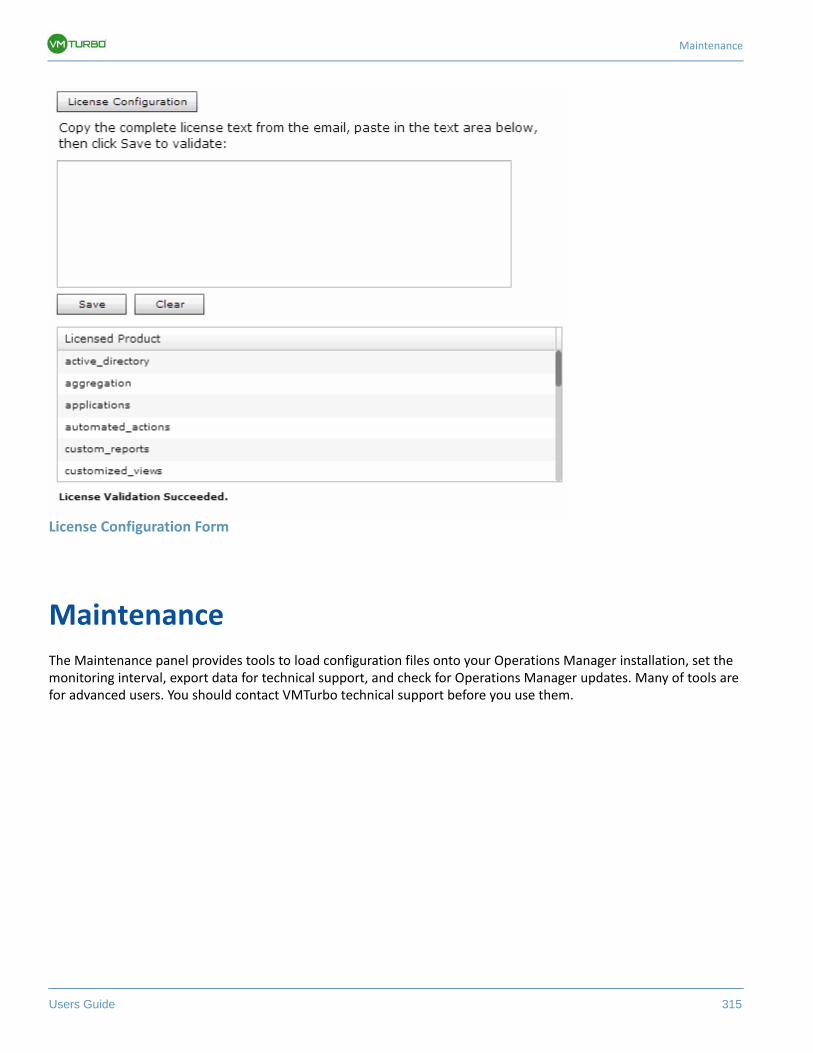
Maintenance
Users Guide 315
License Configuration Form
Maintenance
The Maintenance panel provides tools to load configuration files onto your Operations Manager installation, set the monitoring interval, export data for technical support, and check for Operations Manager updates. Many of tools are for advanced users. You should contact VMTurbo technical support before you use them.
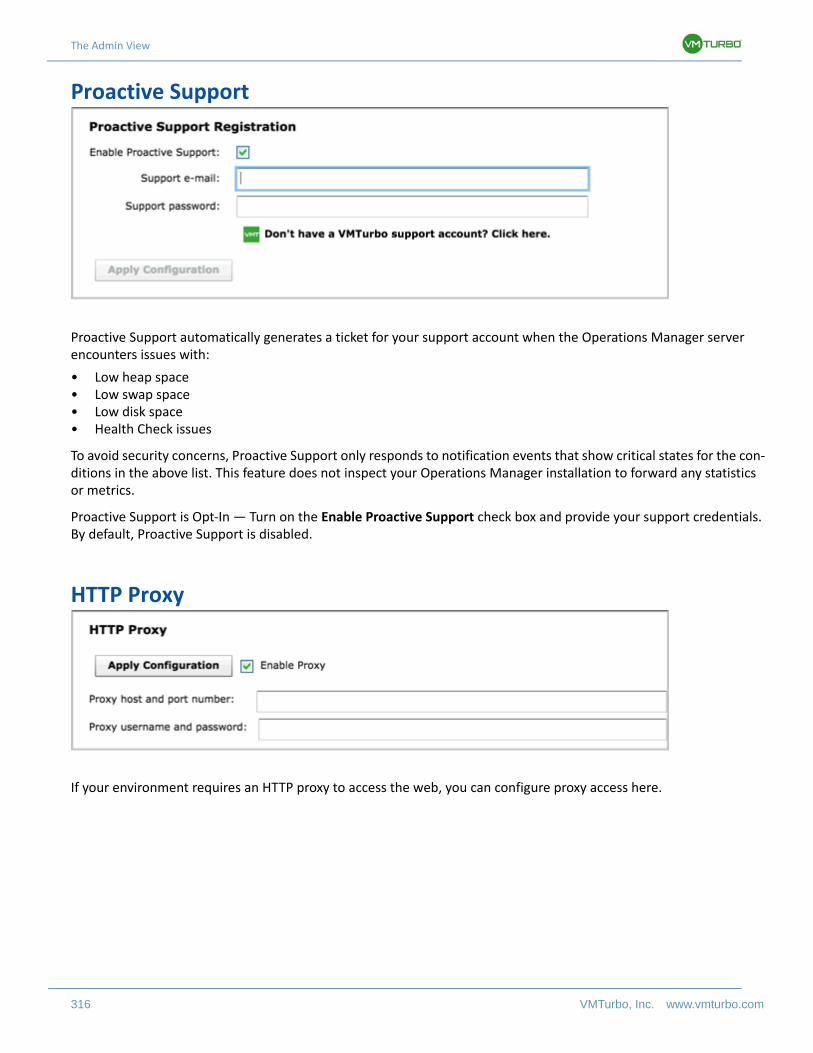
The Admin View
316 VMTurbo, Inc. www.vmturbo.com
Proactive Support
Proactive Support automatically generates a ticket for your support account when the Operations Manager server encounters issues with:
• Low heap space• Low swap space• Low disk space• Health Check issues
To avoid security concerns, Proactive Support only responds to notification events that show critical states for the con-ditions in the above list. This feature does not inspect your Operations Manager installation to forward any statistics or metrics.
Proactive Support is Opt-In — Turn on the Enable Proactive Support check box and provide your support credentials. By default, Proactive Support is disabled.
HTTP Proxy
If your environment requires an HTTP proxy to access the web, you can configure proxy access here.
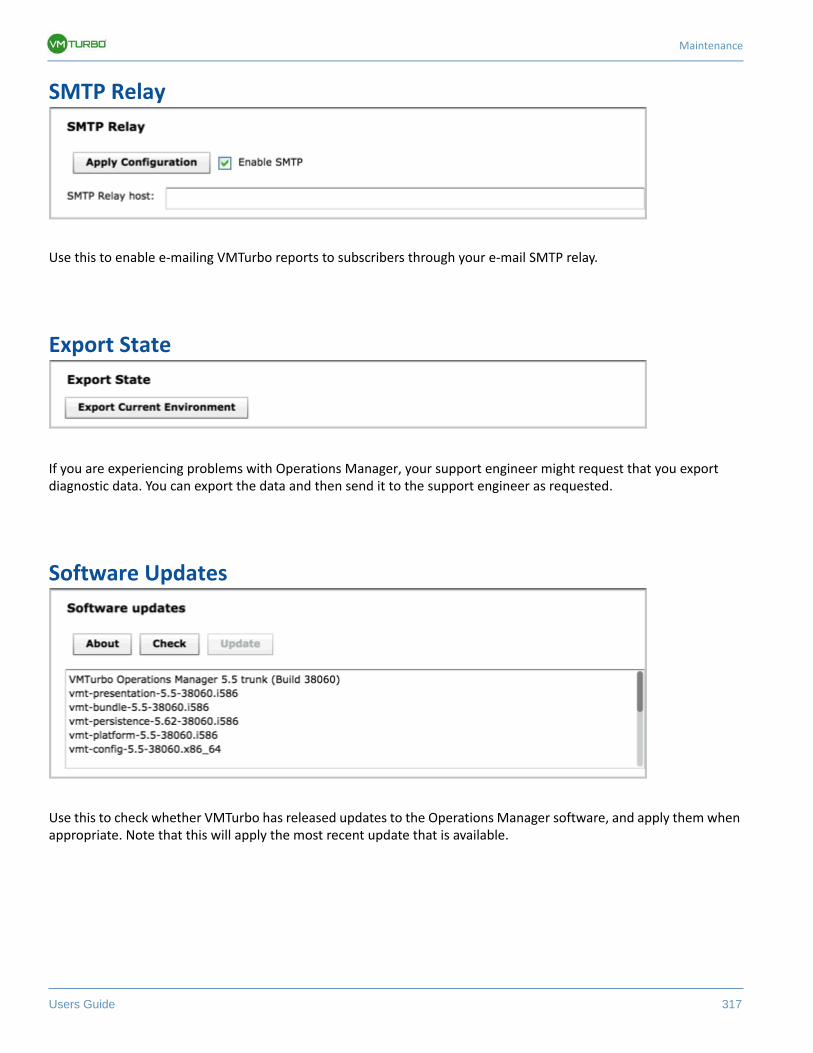
Maintenance
Users Guide 317
SMTP Relay
Use this to enable e-mailing VMTurbo reports to subscribers through your e-mail SMTP relay.
Export State
If you are experiencing problems with Operations Manager, your support engineer might request that you export diagnostic data. You can export the data and then send it to the support engineer as requested.
Software Updates
Use this to check whether VMTurbo has released updates to the Operations Manager software, and apply them when appropriate. Note that this will apply the most recent update that is available.
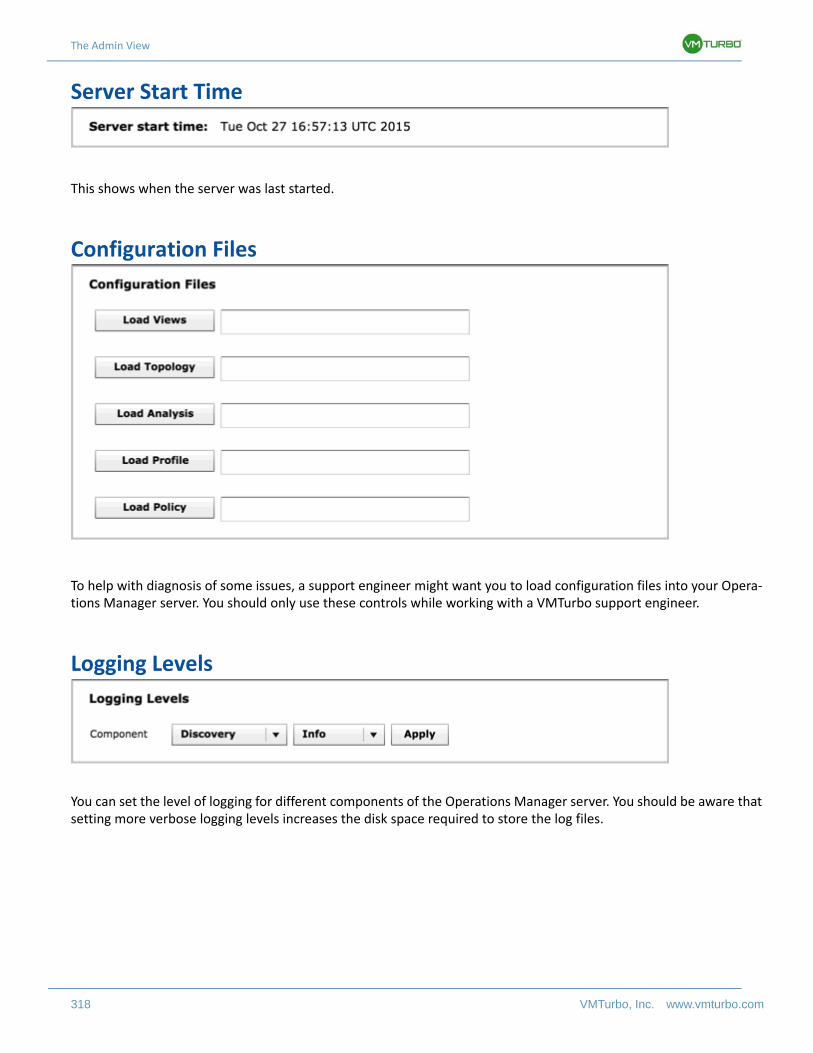
The Admin View
318 VMTurbo, Inc. www.vmturbo.com
Server Start Time
This shows when the server was last started.
Configuration Files
To help with diagnosis of some issues, a support engineer might want you to load configuration files into your Opera-tions Manager server. You should only use these controls while working with a VMTurbo support engineer.
Logging Levels
You can set the level of logging for different components of the Operations Manager server. You should be aware that setting more verbose logging levels increases the disk space required to store the log files.
Extra Configuration Tasks
Users Guide 319
Extra Configuration Tasks
The following configuration tasks might be useful in your virtual environment:
• Operations Manager Backup Procedures on page 319• Configuring Management Continuity on page 323• P2V - Planning Migration from Physical to Virtual on page 329• Custom Branding of Operations Manager on page 332
Operations Manager Backup Procedures
Operations Manager anticipates trouble-free use of Operations Manager, but in most environments a regular backup schedule is recommended. You should be able to incorporate Operations Manager backups in your schedule with min-imal impact on your regular backup procedures.
Operations Manager is a real-time management and control application that performs the bulk of its analysis on in-memory data. Unlike many other products, Operations Manager does not store operations-critical data about your environment on the file system or in a database. As a result, backups do not require the space necessary to store a complete listing of all the resources in your environment. The following describes the data that must be included in a backup:
• Operations Manager historical database
Operations Manager uses data stored in a database data to chart past values, perform projections, provide baselines for plans, and display historical data in reports. This information is useful but not necessary for operation. Operations Manager performs workload management as soon as it discovers your topology, and does not rely on this information for operation.
• Retained reports
Operations Manager retains reports for a specified period of time — one year by default.• Configuration files
Configuration files define user accounts, policies, groups, target configurations, licensing, and other data that describes your installation.
Operations Manager includes a script that you can execute to run a backup. You can also can create a backup by saving a snapshot of the Operations Manager virtual machine, or by including Operations Manager in scheduled runs of a VM backup agent.
Backup and Restore Via the Operations Manager Backup Script
The supplied backup and restore scripts perform backups of the critical Operations Manager data — the historical database, retained reports, and configuration files.
NOTE: You can execute backups with no interruption to Operations Manager processing. However, restore operations require the server to restart. The restore command restarts the Operations Manager server as part of its execution.
Backing Up Operations Manager
To perform a backup, open the advanced update page and choose the type of backup to perform.
• Navigate to HTTP://<appliance_IP>/update.html
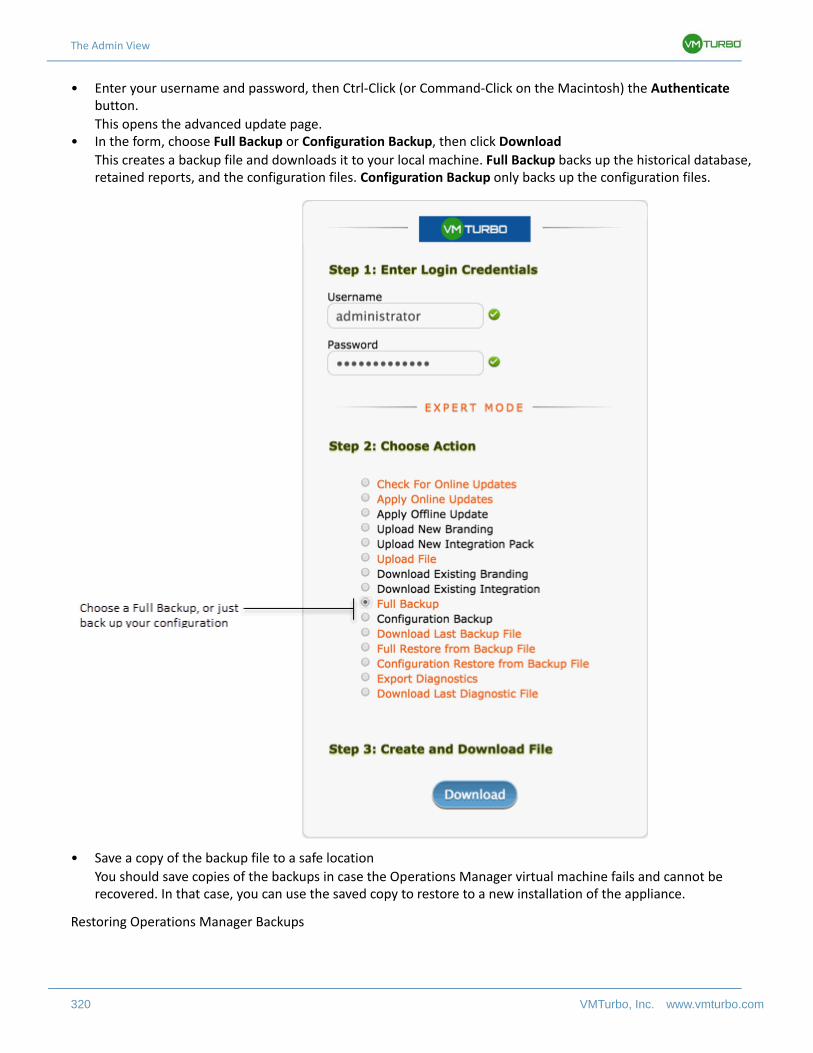
The Admin View
320 VMTurbo, Inc. www.vmturbo.com
• Enter your username and password, then Ctrl-Click (or Command-Click on the Macintosh) the Authenticate button.
This opens the advanced update page.• In the form, choose Full Backup or Configuration Backup, then click Download
This creates a backup file and downloads it to your local machine. Full Backup backs up the historical database, retained reports, and the configuration files. Configuration Backup only backs up the configuration files.
• Save a copy of the backup file to a safe location
You should save copies of the backups in case the Operations Manager virtual machine fails and cannot be recovered. In that case, you can use the saved copy to restore to a new installation of the appliance.
Restoring Operations Manager Backups
Extra Configuration Tasks
Users Guide 321
NOTE: The version of Operations Manager to which you restore the backup must be the same as the version that generated the backup file.
To restore a backup to an Operations Manager installation:
• Navigate to HTTP://<appliance_IP>/update.html• Enter your username and password, then Ctrl-Click (or Command-Click on the Macintosh) the Authenticate
button.
This opens the advanced update page.• In the form, choose a Full Restore from Backup, then click Choose File
This opens a file chooser dialog where you can choose the backup file you created in the steps above. When you choose this file, the current Operations Manager server restores the backed up data — the newly installed Operations Manager will now have your configuration and database data.
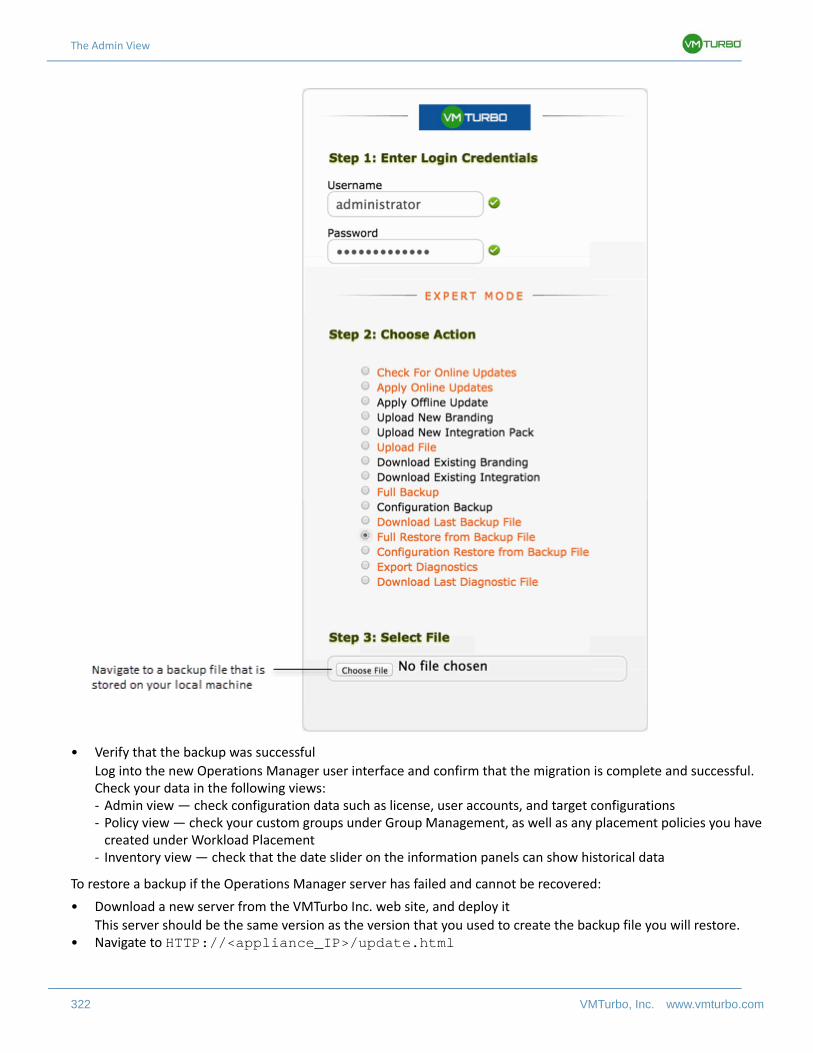
The Admin View
322 VMTurbo, Inc. www.vmturbo.com
• Verify that the backup was successful
Log into the new Operations Manager user interface and confirm that the migration is complete and successful. Check your data in the following views:- Admin view — check configuration data such as license, user accounts, and target configurations- Policy view — check your custom groups under Group Management, as well as any placement policies you have
created under Workload Placement- Inventory view — check that the date slider on the information panels can show historical data
To restore a backup if the Operations Manager server has failed and cannot be recovered:
• Download a new server from the VMTurbo Inc. web site, and deploy it
This server should be the same version as the version that you used to create the backup file you will restore.• Navigate to HTTP://<appliance_IP>/update.html
Extra Configuration Tasks
Users Guide 323
• Enter your username and password, then Ctrl-Click (or Command-Click on the Macintosh) the Authenticate button.
This opens the advanced update page.• In the form, choose a Full Restore from Backup, then click Choose File
This opens a file chooser dialog where you can choose the backup file you created in the steps above. When you choose this file, the current Operations Manager server restores the backed up data — the newly installed Operations Manager will now have your configuration and database data.
• Choose your most recent backup file to upload
Backups Via Virtual Machine Snapshots
It’s common to back up critical virtual machines by creating regular snapshots. If this is the method you prefer, you can include Operations Manager servers in your snapshot schedule. These backups will include all the information that is necessary to restore Operations Manager to its original state.
Using VM Backup Agents
If you use VM backup agents to back up your environment, you can include the Operations Manager server in that backup schedule. We have not tested specific backup agents, but we are not aware of any reported issues with their use.
Configuring Management Continuity
Operations Manager runs as a VM server on the major VM platforms that are on the market today. These platforms include High Availability (HA) utilities you can use for many situations. In addition, you can use network monitoring utilities to check on the status of the Operations Manager server, and respond in the event of server failure. These techniques cover different faults, and offer different approaches to recovery.
This section describes recommended techniques for maintaining continuous workload management with Operations Manager for the following situations:
• Host Failure• Storage Failure• Operations Manager Server Failure• Site Failure (Disaster Recovery)
Recovering from Host Failure
You can install Operations Manager on the following VM platforms:
• VMware vCenter 4.1 — 5.x• RHEV-M (RedHat Enterprise Virtualization Manager) versions 3.x• Microsoft Hyper-V 2008 and 2012• Citrix XenServer 5.6 — 6.1
The Admin View
324 VMTurbo, Inc. www.vmturbo.com
These platforms support HA that responds to host failure and VM failure. In either case, if you install Operations Man-ager in a cluster that meets the requirements for the platform’s HA, then you can expect HA in the event of these types of failure. For example, if the host that is running the Operations Manager virtual machine fails, the platform HA will move the VM to a different host in the same cluster. After the move, the VM can start up (if necessary) and run with no impact to stored data or configuration.
Recovering from Storage Failure
Operations Manager is a real-time management and control application that performs the bulk of its analysis on in-memory data. It stores historical data, configuration data, and saved reports on disk. Loss of this data can affect some processing; for example, Operations Manager uses historical data to generate projections.
To guard against possible storage failure, you can use an installed storage replication technology to maintain a mirror of the Operations Manager server files on another datastore. If the datastore for the Operations Manager VM fails, use the recovery services that are provided by the storage replication technology.
Recovering from Operations Manager Server Failure
For the unlikely event that the Operations Manager server itself fails, you must implement your own HA procedure to capture that failure, and then execute a response. The following sections describe different ways to achieve this.
NOTE: Do not allow two Operations Manager servers to perform automation on the same targets at the same time. You should disable Automatic Restart for your Operations Manager VM to ensure this situation never occurs.
Manual Restart
The simplest response to Operations Manager failure is to manually restart the server. You should correct the problem that caused failure as soon as possible. For example, you might need to allocate more memory to the hosting VM, or change the database retention policies. If you cannot resolve the problem, contact VMTurbo technical support for assistance.
VM HA from the VM Platform
Some VM platforms offer VM-level HA. If the platform detects guest OS failure it resets the VM to recover normal operation. You should be aware that this level of HA responds to the guest OS, but not necessarily to the application running on the OS. It’s possible that the Operations Manager VM can fail without triggering VM HA.
Active/Passive Redundancy
To automate your response to an Operations Manager server failure, VMTurbo recommends the following deploy-ment:
• Deploy a network utility that tracks connectivity of the Operations Manager server, and can post a notification if the server goes down
• Deploy a primary/secondary pair of Operations Manager servers
Deploy each Operations Manager VM on a different host. You should use workload placement policies to ensure these VMs never run on the same host.
The hosts should be in the same cluster and have access to the same shared datastores. Also, the two installations of Operations Manager must be for the same version, and they should be installed on the same virtual platform. For example, if the primary installation is on VMware Systems, then the secondary installation should also run on VMware Systems.
Extra Configuration Tasks
Users Guide 325
• Run the pair in active/passive modes
Set up the primary Operations Manager installation to manage your environment, including automatic execution of recommended actions. Set up the second installation to manage the same targets as the primary, but do not automate execution of any actions. You can leave this secondary installation powered on and running in standby mode, or powered off.
• Execute regular backups of the primary, active Operations Manager VM
Operations Manager includes a script you can run regularly to backup the server’s database, configuration, and any saved reports. Save the backup data in a location that is visible to the secondary installation.
To ensure coverage, you should automate running the backup script at regular intervals. (The steps to perform backup and restore are included below.)
When you receive a notification that the primary Operations Manager VM has gone down, put the secondary VM in active service. To automate this, you should implement a script that can perform the necessary actions. You put the secondary VM in service as follows:
• Ensure the primary VM is actually shut down
It is important that you do not have both the primary and secondary Operations Manager servers performing automation on the same targets at the same time.
• Update the secondary Operations Manager server’s data
The secondary installation should match the latest primary server’s data as much as possible. Use the Operations Manager restore script to bring the backup data from the primary server into the secondary server. You can choose to update the full set of server data, or just the configuration data. (The steps to perform backup and restore are included below.)
The secondary Operations Manager server is now configured to perform workload management the same as the primary server did. This includes automation of recommended actions.
• Put the secondary installation in service
If the Operations Manager VM is in standby or is powered down, put it into full service.• Treat the now-running Operations Manager VM as primary (active), and the shut down VM as secondary (passive)
You must ensure that the now-secondary VM is configured so that it will not automate any recommended actions.
NOTE: Do not allow two Operations Manager servers to perform automation on the same targets at the same time. When switching to the secondary Operations Manager VM, you must be sure that the primary VM is powered off.
Disaster Recovery — Site Failure
In the case of failure of a production site, your recovery management system should move the affected VMs to a sep-arate DR site. Operations Manager is not a critical application in itself, but it is important to maintain your site with optimal workload distribution. This is true of a production site as well as a DR site. You can deploy Operations Man-ager on the DR site to take over management of recovered VMs as they are moved to the DR site. To do this:
• Install Operations Manager VMs on the DR site to match instances running on your production site• For the DR instances of Operations Manager, ensure that they do not automate any actions• On the DR site, configure the Operations Manager servers to monitor the targets on the DR site and the
production site
For example, assume the production site has a single vCenter Server as a target for a single Operations Manager server, and the DR site has a single vCenter Server to manage recovered VMs. The Operations Manager server on the DR site should have both vCenter Server instances (production and DR) as targets.
As the production site goes down, your DR system will migrate VMs to the DR site. As this occurs, the DR instances of Operations Manager will discover these VMs and manage workload distribution on the DR site.
The Admin View
326 VMTurbo, Inc. www.vmturbo.com
When you recognize that the production site has gone down, put the Operations Manager servers on the DR site into active service. To do this, change the actions configuration to automate whichever actions were automated on the production site.
NOTE: Before you bring the production site back up and move the recovered VMS back onto it, you should turn off automation for the Operations Manager servers running on the DR site. It is important that you never have two Oper-ations Manager servers automating actions for the same targets.
Operations Manager Backup Procedures
Operations Manager anticipates trouble-free use of Operations Manager, but in most environments a regular backup schedule is recommended. You should be able to incorporate Operations Manager backups in your schedule with min-imal impact on your regular backup procedures.
Operations Manager is a real-time management and control application that performs the bulk of its analysis on in-memory data. Unlike many other products, Operations Manager does not store operations-critical data about your environment on the file system or in a database. As a result, backups do not require the space necessary to store a complete listing of all the resources in your environment. The following describes the data that must be included in a backup:
• Operations Manager historical database
Operations Manager uses data stored in a database data to chart past values, perform projections, provide baselines for plans, and display historical data in reports. This information is useful but not necessary for operation. Operations Manager performs workload management as soon as it discovers your topology, and does not rely on this information for operation.
• Retained reports
Operations Manager retains reports for a specified period of time — one year by default.• Configuration files
Configuration files define user accounts, policies, groups, target configurations, licensing, and other data that describes your installation.
Operations Manager includes a script that you can execute to run a backup. You can also can create a backup by saving a snapshot of the Operations Manager virtual machine, or by including Operations Manager in scheduled runs of a VM backup agent.
Backup and Restore Via the Operations Manager Backup Script
The supplied backup and restore scripts perform backups of the critical Operations Manager data — the historical database, retained reports, and configuration files.
NOTE: You can execute backups with no interruption to Operations Manager processing. However, restore operations require the server to restart. The restore command restarts the Operations Manager server as part of its execution.
Backing Up Operations Manager
To perform a backup, open the advanced update page and choose the type of backup to perform.
• Navigate to HTTP://<appliance_IP>/update.html• Enter your username and password, then Ctrl-Click (or Command-Click on the Macintosh) the Authenticate
button.
This opens the advanced update page.• In the form, choose Full Backup or Configuration Backup, then click Download
This creates a backup file and downloads it to your local machine. Full Backup backs up the historical database, retained reports, and the configuration files. Configuration Backup only backs up the configuration files.
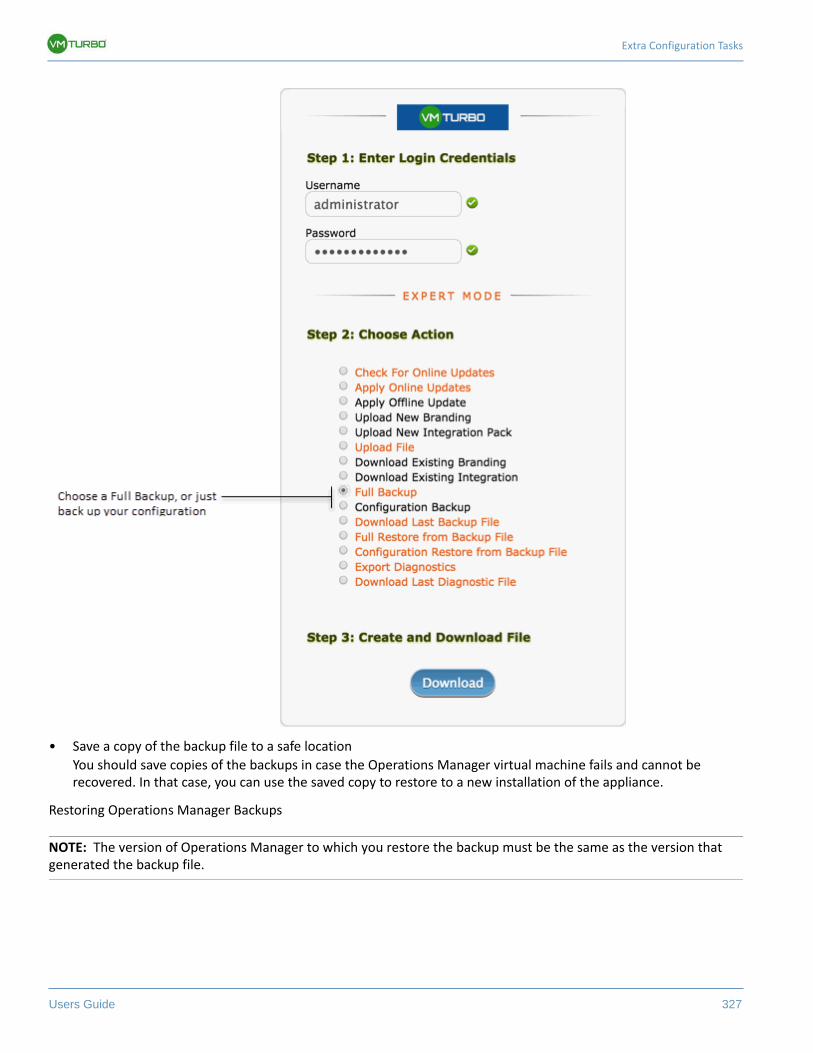
Extra Configuration Tasks
Users Guide 327
• Save a copy of the backup file to a safe location
You should save copies of the backups in case the Operations Manager virtual machine fails and cannot be recovered. In that case, you can use the saved copy to restore to a new installation of the appliance.
Restoring Operations Manager Backups
NOTE: The version of Operations Manager to which you restore the backup must be the same as the version that generated the backup file.
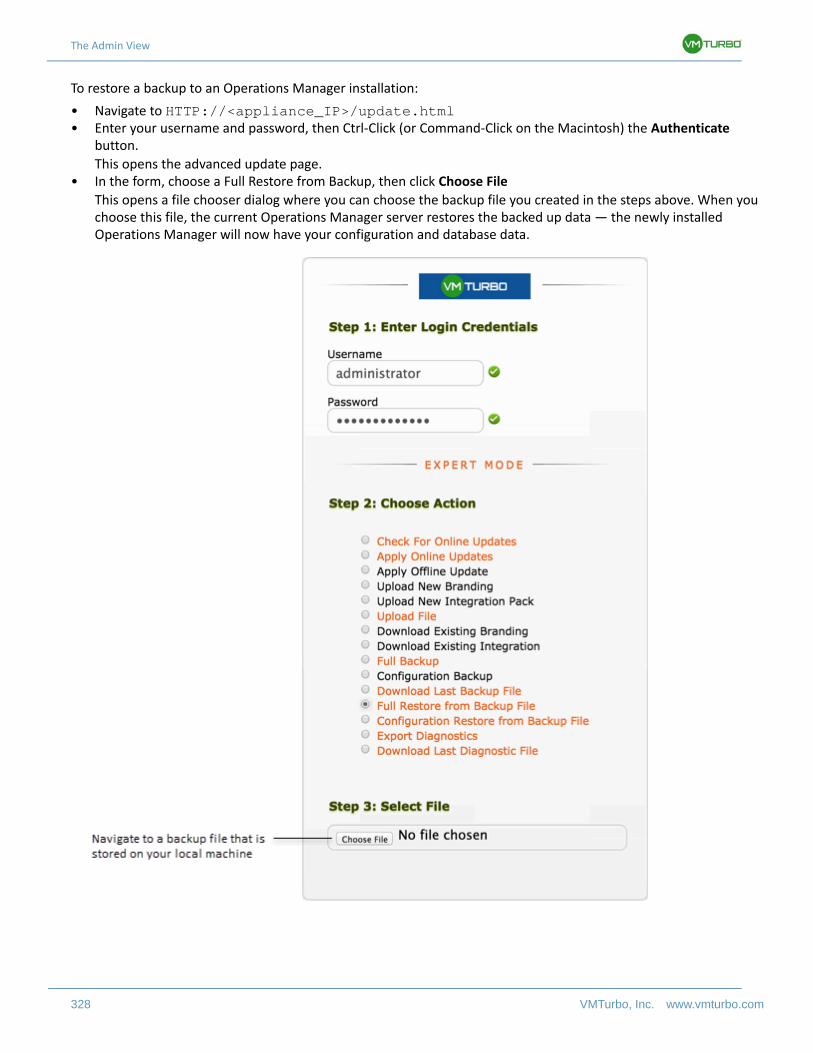
The Admin View
328 VMTurbo, Inc. www.vmturbo.com
To restore a backup to an Operations Manager installation:
• Navigate to HTTP://<appliance_IP>/update.html• Enter your username and password, then Ctrl-Click (or Command-Click on the Macintosh) the Authenticate
button.
This opens the advanced update page.• In the form, choose a Full Restore from Backup, then click Choose File
This opens a file chooser dialog where you can choose the backup file you created in the steps above. When you choose this file, the current Operations Manager server restores the backed up data — the newly installed Operations Manager will now have your configuration and database data.
Extra Configuration Tasks
Users Guide 329
• Verify that the backup was successful
Log into the new Operations Manager user interface and confirm that the migration is complete and successful. Check your data in the following views:- Admin view — check configuration data such as license, user accounts, and target configurations- Policy view — check your custom groups under Group Management, as well as any placement policies you have
created under Workload Placement- Inventory view — check that the date slider on the information panels can show historical data
To restore a backup if the Operations Manager server has failed and cannot be recovered:
• Download a new server from the VMTurbo Inc. web site, and deploy it
This server should be the same version as the version that you used to create the backup file you will restore.• Navigate to HTTP://<appliance_IP>/update.html• Enter your username and password, then Ctrl-Click (or Command-Click on the Macintosh) the Authenticate
button.
This opens the advanced update page.• In the form, choose a Full Restore from Backup, then click Choose File
This opens a file chooser dialog where you can choose the backup file you created in the steps above. When you choose this file, the current Operations Manager server restores the backed up data — the newly installed Operations Manager will now have your configuration and database data.
• Choose your most recent backup file to upload
Backups Via Virtual Machine Snapshots
It’s common to back up critical virtual machines by creating regular snapshots. If this is the method you prefer, you can include Operations Manager servers in your snapshot schedule. These backups will include all the information that is necessary to restore Operations Manager to its original state.
Using VM Backup Agents
If you use VM backup agents to back up your environment, you can include the Operations Manager server in that backup schedule. We have not tested specific backup agents, but we are not aware of any reported issues with their use.
P2V - Planning Migration from Physical to Virtual
You can use the Operations Manager to Plan View to simulate migration from a physical environment to a virtual envi-ronment. To set up the planning scenario, you first identify how many virtual machines to deploy, and what hardware you need to serve the virtual environment. You can perform your own analysis to build up such a listing, or you can use existing services and utilities to generate a listing.
Once you have a list of the devices you need in your environment, use Plan View to calculate the distribution of work-load and resources that will give you optimal performance. The simulation suggests deployments that assure QoS while making sure to utilize system resources as fully and efficiently as possible.
When you execute P2V, Operations Manager creates a planning scenario that contains only the devices in your listing. It then uses the Economic Scheduling Engine to calculate the best placement of VMs among the physical hosts and datastores. The Plan View generates a To Do list of recommended actions to achieve this target deployment. When it’s completed, you can view the results:
• As a plan in the Plan View of Operations Manager• As a PDF report• As an XML file listing recommended actions
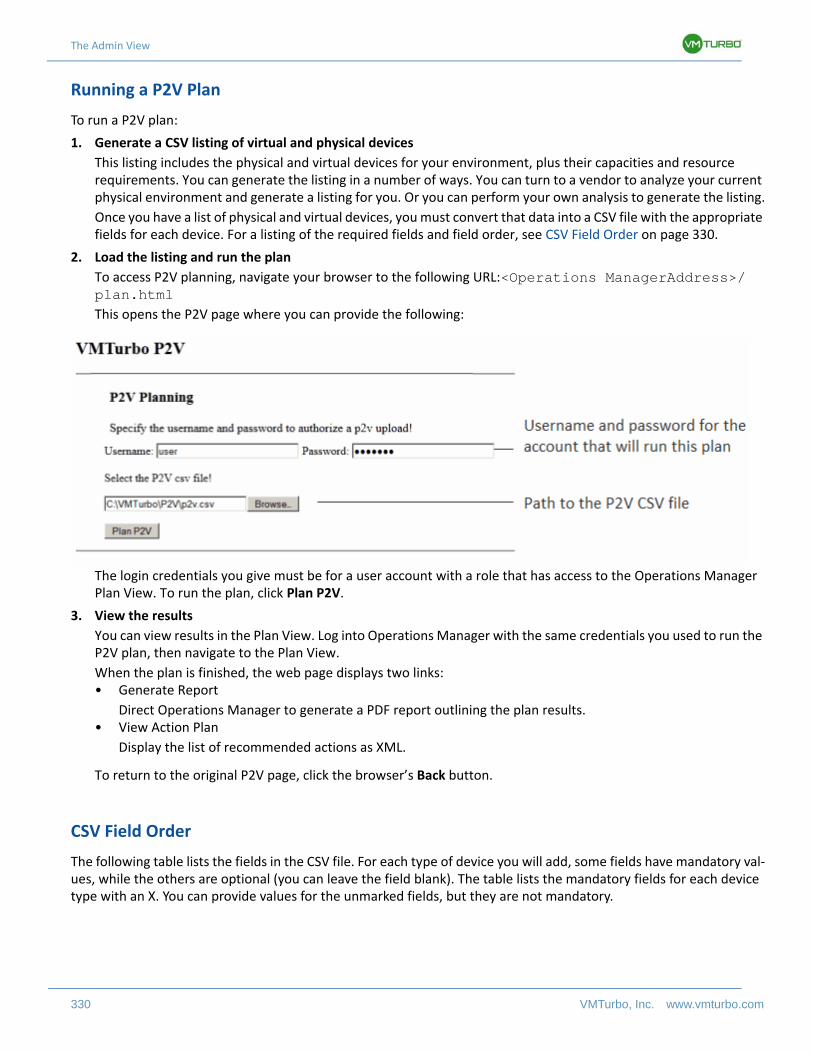
The Admin View
330 VMTurbo, Inc. www.vmturbo.com
Running a P2V Plan
To run a P2V plan:
1. Generate a CSV listing of virtual and physical devices
This listing includes the physical and virtual devices for your environment, plus their capacities and resource requirements. You can generate the listing in a number of ways. You can turn to a vendor to analyze your current physical environment and generate a listing for you. Or you can perform your own analysis to generate the listing.
Once you have a list of physical and virtual devices, you must convert that data into a CSV file with the appropriate fields for each device. For a listing of the required fields and field order, see CSV Field Order on page 330.
2. Load the listing and run the plan
To access P2V planning, navigate your browser to the following URL:<Operations ManagerAddress>/plan.htmlThis opens the P2V page where you can provide the following:
The login credentials you give must be for a user account with a role that has access to the Operations Manager Plan View. To run the plan, click Plan P2V.
3. View the results
You can view results in the Plan View. Log into Operations Manager with the same credentials you used to run the P2V plan, then navigate to the Plan View.
When the plan is finished, the web page displays two links:• Generate Report
Direct Operations Manager to generate a PDF report outlining the plan results.• View Action Plan
Display the list of recommended actions as XML.
To return to the original P2V page, click the browser’s Back button.
CSV Field Order
The following table lists the fields in the CSV file. For each type of device you will add, some fields have mandatory val-ues, while the others are optional (you can leave the field blank). The table lists the mandatory fields for each device type with an X. You can provide values for the unmarked fields, but they are not mandatory.
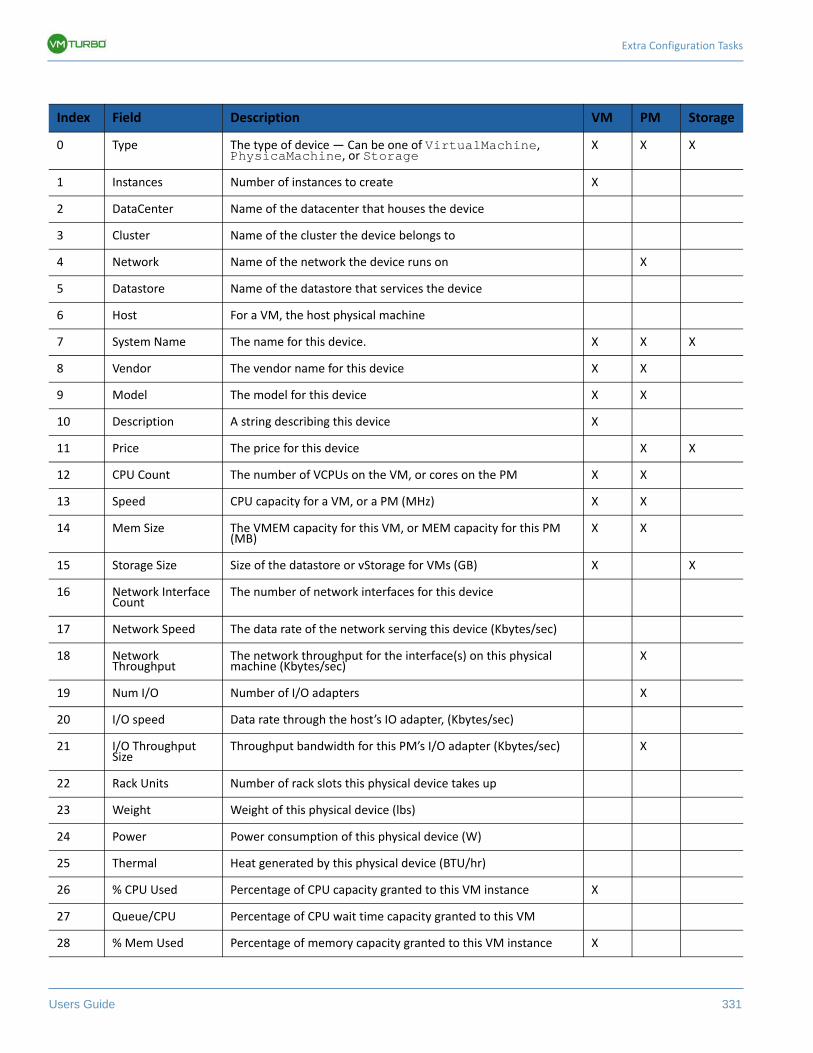
Extra Configuration Tasks
Users Guide 331
Index Field Description VM PM Storage
0 Type The type of device — Can be one of VirtualMachine, PhysicaMachine, or Storage
X X X
1 Instances Number of instances to create X
2 DataCenter Name of the datacenter that houses the device
3 Cluster Name of the cluster the device belongs to
4 Network Name of the network the device runs on X
5 Datastore Name of the datastore that services the device
6 Host For a VM, the host physical machine
7 System Name The name for this device. X X X
8 Vendor The vendor name for this device X X
9 Model The model for this device X X
10 Description A string describing this device X
11 Price The price for this device X X
12 CPU Count The number of VCPUs on the VM, or cores on the PM X X
13 Speed CPU capacity for a VM, or a PM (MHz) X X
14 Mem Size The VMEM capacity for this VM, or MEM capacity for this PM (MB)
X X
15 Storage Size Size of the datastore or vStorage for VMs (GB) X X
16 Network Interface Count
The number of network interfaces for this device
17 Network Speed The data rate of the network serving this device (Kbytes/sec)
18 Network Throughput
The network throughput for the interface(s) on this physical machine (Kbytes/sec)
X
19 Num I/O Number of I/O adapters X
20 I/O speed Data rate through the host’s IO adapter, (Kbytes/sec)
21 I/O Throughput Size
Throughput bandwidth for this PM’s I/O adapter (Kbytes/sec) X
22 Rack Units Number of rack slots this physical device takes up
23 Weight Weight of this physical device (lbs)
24 Power Power consumption of this physical device (W)
25 Thermal Heat generated by this physical device (BTU/hr)
26 % CPU Used Percentage of CPU capacity granted to this VM instance X
27 Queue/CPU Percentage of CPU wait time capacity granted to this VM
28 % Mem Used Percentage of memory capacity granted to this VM instance X
The Admin View
332 VMTurbo, Inc. www.vmturbo.com
Custom Branding of Operations Manager
Third-party distributors and service providers might want to customize the company brand name for Operations Man-ager. You can change the logos that appear in generated reports and in the GUI, so the product will present your brand’s logo.
When you re-brand Operations Manager:
• You create images for your custom logos• You create one or more custom Operations Manager startup pages to display custom logos• The product GUI displays your custom logo images• Generated reports display your logo, and your copyright statement
To re-brand the product, you will upload a ZIP archive that contains custom html files, and a set of logo image files. Operations Manager then copies the files into the proper locations. In addition, the Operations Manager installation stores a copy of your re-branding files so that your brand will remain even after executing a product update.
Re-Branding Operations Manager
To re-brand Operations Manager:
1. Create image files for your logos and copyright statement.
Create the following files:• logo-<Brand_Name>.jpg (where <BrandName> is a custom name you use to identify your brand) —
Used in the top-left of the main Operations Manager GUI. This image file must be 128 pixels wide by 46 pixels high. User interface display will have unpredictable results if you use a different sized image.
• logo_login<BrandName>.png (where <BrandName> is a custom name you use to identify your brand) — Used in the login screen. This image file must be 150 pixels wide by 35 pixels high. Display of the login screen will have unpredictable results if you use a different sized image.
• logo.png — Used in the headers of generated report pages. This image file must be no more than 150 pixels wide and 35 pixels high.
• copyright.jpg — Used to declare your copyright for generated reports. The recommended size for this image is by 250 pixels wide by 18 pixels high. The image appears at the bottom-right of report pages.
29 FileSys Cache File system cache space capacity for this device MB)
30 %Page File Percentage of paging capacity granted to this device
31 Paging (IOPS) Storage access operations per second X
32 IOPS Used Percentage of IOPS capacity granted to this VM instance X
33 I/O I/O speed for this VM instance (MB/sec)
34 % IO Percentage of I/O capacity granted to this VM instance X
35 % Storage Percentage of storage capacity granted to this VM instance X
36 Traffic Network speed for this VM instance (MB/sec)
37 % Network Percentage of network capacity granted to this VM instance X
Index Field Description VM PM Storage
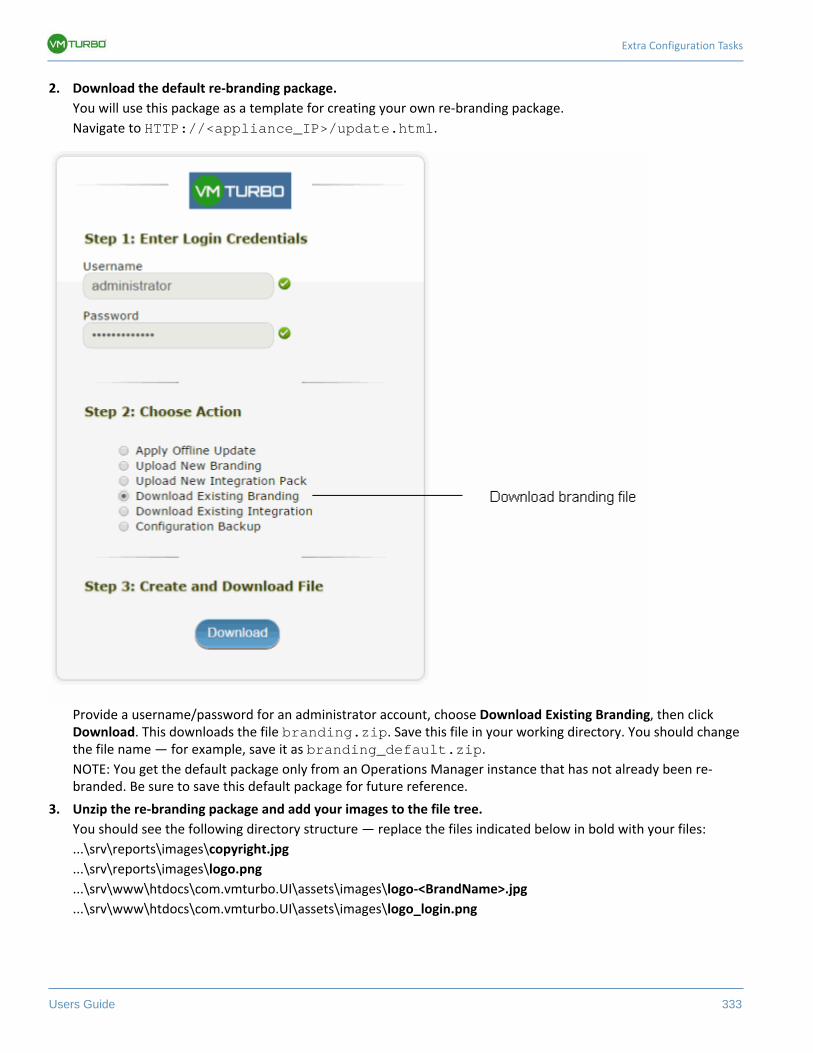
Extra Configuration Tasks
Users Guide 333
2. Download the default re-branding package.
You will use this package as a template for creating your own re-branding package.
Navigate to HTTP://<appliance_IP>/update.html.
Provide a username/password for an administrator account, choose Download Existing Branding, then click Download. This downloads the file branding.zip. Save this file in your working directory. You should change the file name — for example, save it as branding_default.zip.
NOTE: You get the default package only from an Operations Manager instance that has not already been re-branded. Be sure to save this default package for future reference.
3. Unzip the re-branding package and add your images to the file tree.
You should see the following directory structure — replace the files indicated below in bold with your files:
...\srv\reports\images\copyright.jpg
...\srv\reports\images\logo.png
...\srv\www\htdocs\com.vmturbo.UI\assets\images\logo-<BrandName>.jpg
...\srv\www\htdocs\com.vmturbo.UI\assets\images\logo_login.png
The Admin View
334 VMTurbo, Inc. www.vmturbo.com
4. Rename the UIMain.html file
...\srv\www\htdocs\com.vmturbo.UI\UIMain.html
This file presents the Operations Manager user interface, along with the branding logo. When your users launch your GUI, the URL they execute will terminate in this filename. For that reason, you should give a filename that represents your brand. For example, if you rename the file to UIMain_MyCompany.html, the URL customers execute will be HTTP://<Appliance_Address>/com.vmturbo.UI/UIMain_MyCompany.html.
Note that you can make several copies of this file, each with a different name, and each to use a different logo. In that case, you would:• Create a different version of logo-<BrandName>.jpg for each version of
UIMain_<MyCompany>_.html, and store each one in ...srv\www\htdocs\com.vmturbo.UI\assets\images\
• Give different customers the appropriate URLs, depending on which of these UIMain.html files you want them to open
5. Edit the UIMain.html title element
Edit this file to set the text that displays in the browser window’s title bar. Search for the <title> element, and make your changes. For example, change
<title>VMTurbo - Converge,Control, Prevent</title>to
<title>MyCompany - Converge,Control, Prevent </title>
6. Specify the main banner logo for this customized UIMain.html file
The logos are specified as a Flash variables. Search the file for the following statement:
var flashvars = {};Immediately after this line, add or edit flashvars.appImageFileName to specify the path to your custom logo as follows:
flashvars.appImageFileName = "assets/images/logo-<BrandName>.jpg";Assuming a logo file named logo-MyCompany.jpg, the resulting edit should appear as follows:
var flashvars = {};flashvars.appImageFileName = "assets/images/logo-MyCompany.jpg";
7. Specify the login logo for this customized UIMain.html file
Immediately after the line you just added, add or edit flashvars.appImageLoginFileName to specify the path to your custom logo as follows:
flashvars.appImageLoginFileName = "assets/images/logo_login<BrandName>.png";Assuming a login logo file named logo_loginMyCompany.png, the resulting set of Flash variables should appear as follows:
var flashvars = {};flashvars.appImageFileName = "assets/images/logo-MyCompany.jpg";flashvars.appImageLoginFileName = "assets/images/logo_loginMyCompany.png";
8. Save the file tree as a re-branding package
The re-branding file tree that you have modified begins at the srv directory. Save this directory and all of its contents as a ZIP file named branding.zip.
Be careful not to overwrite the original branding package that you downloaded from a default instance of Opera-tions Manager.
Extra Configuration Tasks
Users Guide 335
9. Upload your custom re-branding package• Navigate to HTTP://<appliance_IP>/update.html and choose Upload New Branding• Provide a username/password for an administrator account• Select the Upload New Branding option• Click Choose File and select the ZIP file you just created. Note: The file must be named branding.zip.• Click Upload
This uploads the package to the installation. Operations Manager deploys these files so it can use the logos and copyright image that you provided. In addition, it stores the package so your brand will persist after you update to later versions of Operations Manager.
10. Save your branding packages for later reference.
You should save the default branding package and your custom branding package, in case you need either of the sets of files at a later date.
Delivering the Re-Branded GUI
To deliver your branded GUI to your customers, have them execute the URL that calls your custom version of UIMain.html. For example, have your customers navigate to:
HTTP://<Appliance_Address>/com.vmturbo.UI/UIMain_MyCompany.html
Updating Operations Manager
When you update Operations Manager, the updated version will still use your custom branding.
In some cases, an update includes changes to the UIMain.html file. In this case, your customized file will not include these changes. For your custom brand to use the latest changes in UIMain.html, you must recreate your custom UIM-ain.html files, based on the new version.
Users Guide 336
The Policy View
The Policy view provides settings to control how the Operations Manager analyzes resource allocation, how it displays resource status, and how it recommends or performs actions. This view opens the Policy Editor that you can use to:
• Navigate to policy categories• Specify the scope of your settings You can make global settings, or make settings for groups of machines or
applications.• Enter setting values and apply your changes
Policy Scope
Users Guide 337
To set a policy, you first select a category, and then navigate the Scope tree to set the scope of the policy change. The editor then displays the settings you can change. To edit a field you click in it and enter a value. When you have made the changes you want, be sure to click Apply Setting Changes.
For example, you can direct Operations Manager to automatically resize all VMs on a specific datastore. To do this, you would make a selection similar to the following figure, set the Resize value, and apply the change.
Policy Scope Set to VMs on a Specific Datastore
Before you make policy settings, you should understand the scope of these settings, and how Operations Manager chooses among competing settings. For more information, see Policy Scope on page 337.
For information about policy categories, and the effects of their individual settings, see Policy Categories on page 341.
Policy Scope
Policy scope determines which resources will be affected by the settings you make. Scope can be either:
• Global Settings on page 337: Base settings for each category that apply by default to all resources• Group Overrides on page 338: Settings you apply to specific groups of resources
Global Settings
To make global settings, select a category, and if necessary select a resource type. The following image shows global settings for actions on Hosts.
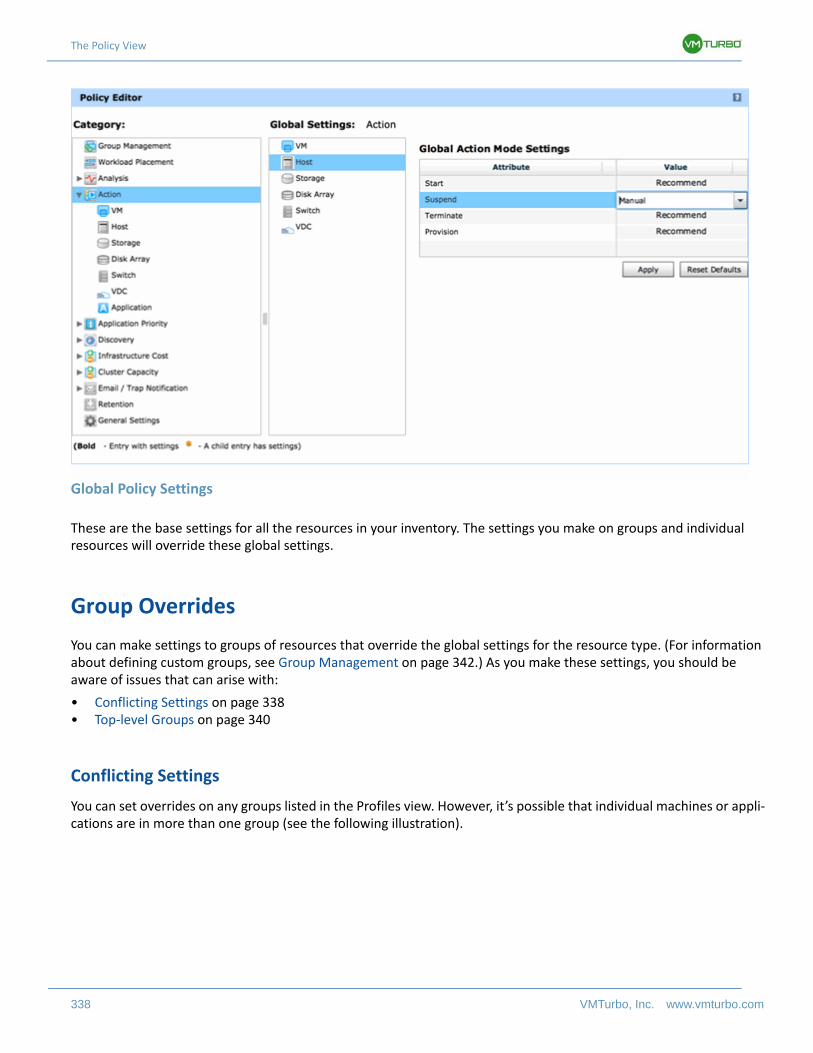
The Policy View
338 VMTurbo, Inc. www.vmturbo.com
Global Policy Settings
These are the base settings for all the resources in your inventory. The settings you make on groups and individual resources will override these global settings.
Group Overrides
You can make settings to groups of resources that override the global settings for the resource type. (For information about defining custom groups, see Group Management on page 342.) As you make these settings, you should be aware of issues that can arise with:
• Conflicting Settings on page 338• Top-level Groups on page 340
Conflicting Settings
You can set overrides on any groups listed in the Profiles view. However, it’s possible that individual machines or appli-cations are in more than one group (see the following illustration).
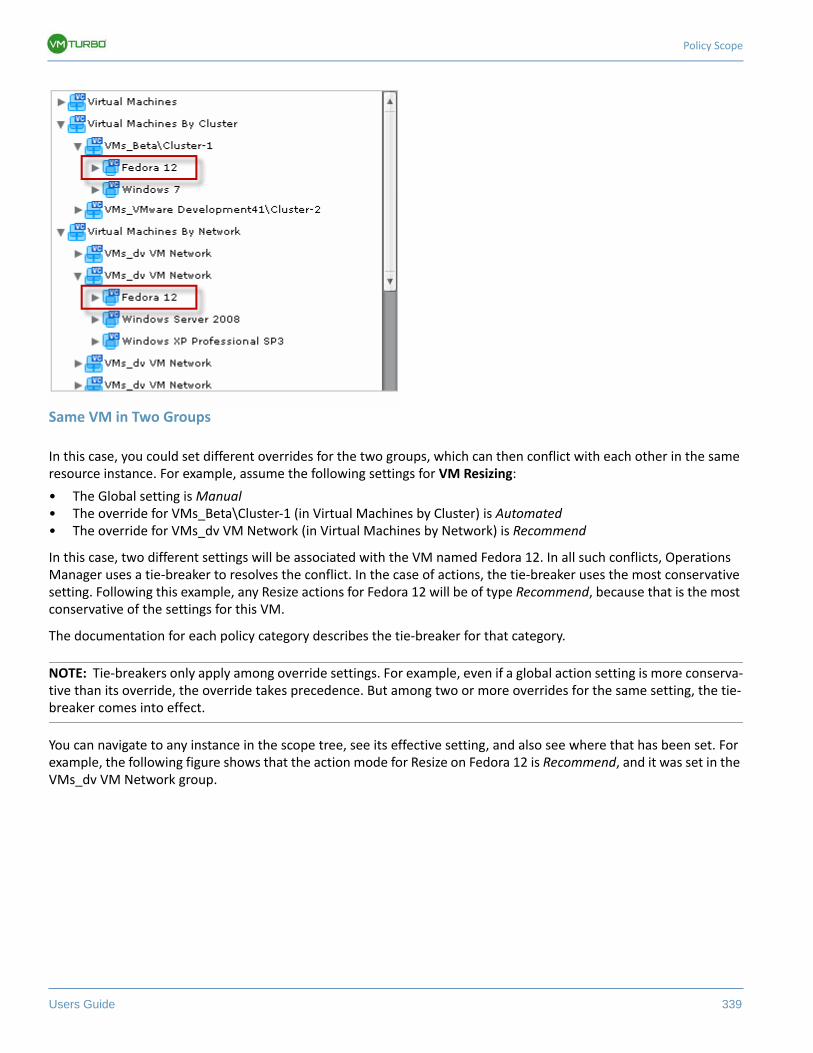
Policy Scope
Users Guide 339
Same VM in Two Groups
In this case, you could set different overrides for the two groups, which can then conflict with each other in the same resource instance. For example, assume the following settings for VM Resizing:
• The Global setting is Manual• The override for VMs_Beta\Cluster-1 (in Virtual Machines by Cluster) is Automated• The override for VMs_dv VM Network (in Virtual Machines by Network) is Recommend
In this case, two different settings will be associated with the VM named Fedora 12. In all such conflicts, Operations Manager uses a tie-breaker to resolves the conflict. In the case of actions, the tie-breaker uses the most conservative setting. Following this example, any Resize actions for Fedora 12 will be of type Recommend, because that is the most conservative of the settings for this VM.
The documentation for each policy category describes the tie-breaker for that category.
NOTE: Tie-breakers only apply among override settings. For example, even if a global action setting is more conserva-tive than its override, the override takes precedence. But among two or more overrides for the same setting, the tie-breaker comes into effect.
You can navigate to any instance in the scope tree, see its effective setting, and also see where that has been set. For example, the following figure shows that the action mode for Resize on Fedora 12 is Recommend, and it was set in the VMs_dv VM Network group.
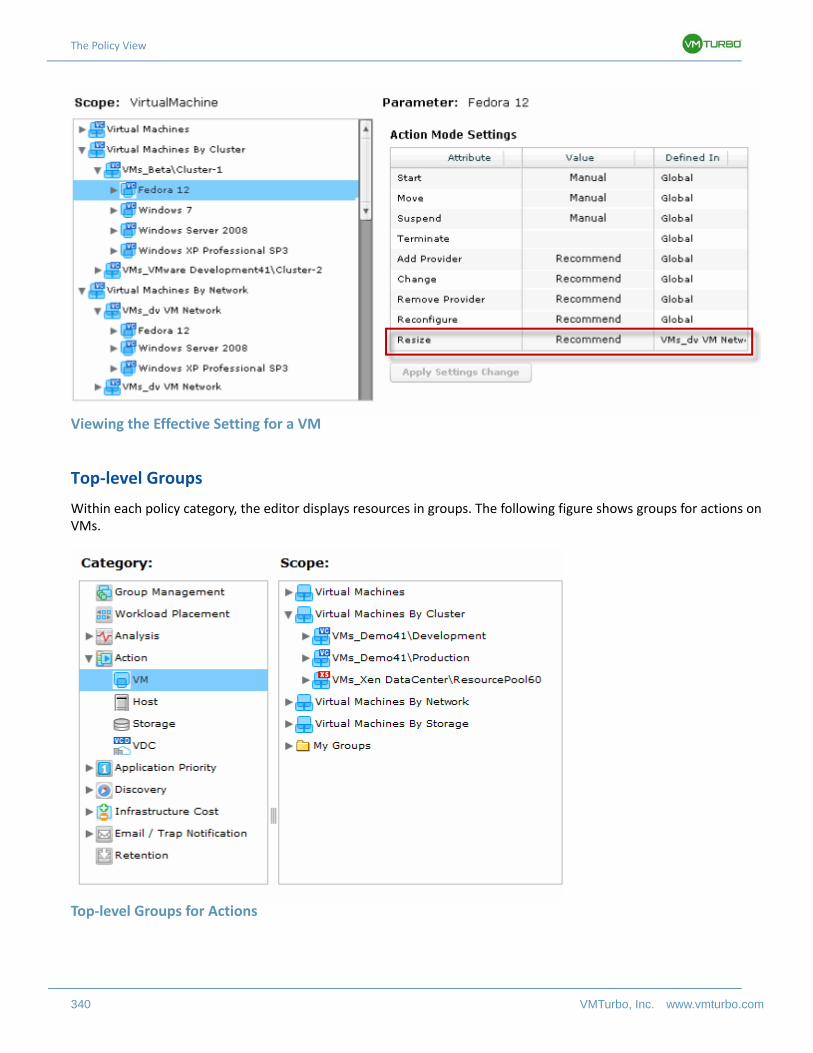
The Policy View
340 VMTurbo, Inc. www.vmturbo.com
Viewing the Effective Setting for a VM
Top-level Groups
Within each policy category, the editor displays resources in groups. The following figure shows groups for actions on VMs.
Top-level Groups for Actions
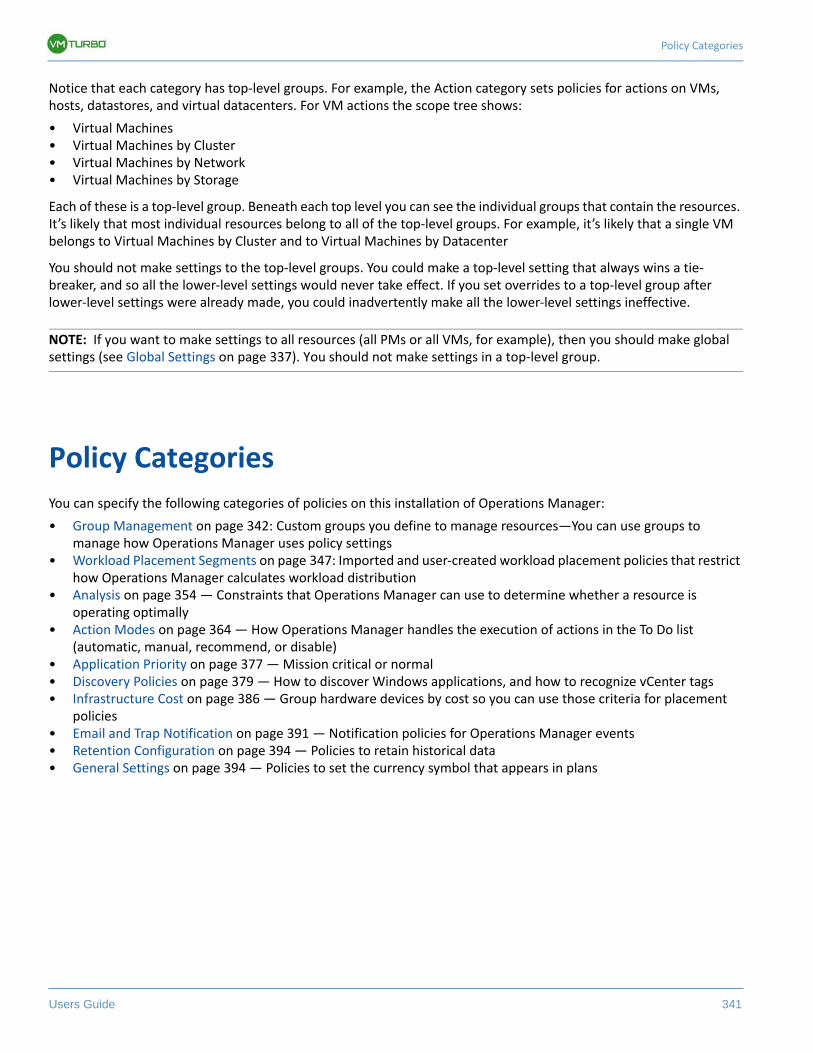
Policy Categories
Users Guide 341
Notice that each category has top-level groups. For example, the Action category sets policies for actions on VMs, hosts, datastores, and virtual datacenters. For VM actions the scope tree shows:
• Virtual Machines• Virtual Machines by Cluster• Virtual Machines by Network• Virtual Machines by Storage
Each of these is a top-level group. Beneath each top level you can see the individual groups that contain the resources. It’s likely that most individual resources belong to all of the top-level groups. For example, it’s likely that a single VM belongs to Virtual Machines by Cluster and to Virtual Machines by Datacenter
You should not make settings to the top-level groups. You could make a top-level setting that always wins a tie-breaker, and so all the lower-level settings would never take effect. If you set overrides to a top-level group after lower-level settings were already made, you could inadvertently make all the lower-level settings ineffective.
NOTE: If you want to make settings to all resources (all PMs or all VMs, for example), then you should make global settings (see Global Settings on page 337). You should not make settings in a top-level group.
Policy Categories
You can specify the following categories of policies on this installation of Operations Manager:
• Group Management on page 342: Custom groups you define to manage resources—You can use groups to manage how Operations Manager uses policy settings
• Workload Placement Segments on page 347: Imported and user-created workload placement policies that restrict how Operations Manager calculates workload distribution
• Analysis on page 354 — Constraints that Operations Manager can use to determine whether a resource is operating optimally
• Action Modes on page 364 — How Operations Manager handles the execution of actions in the To Do list (automatic, manual, recommend, or disable)
• Application Priority on page 377 — Mission critical or normal• Discovery Policies on page 379 — How to discover Windows applications, and how to recognize vCenter tags• Infrastructure Cost on page 386 — Group hardware devices by cost so you can use those criteria for placement
policies• Email and Trap Notification on page 391 — Notification policies for Operations Manager events• Retention Configuration on page 394 — Policies to retain historical data• General Settings on page 394 — Policies to set the currency symbol that appears in plans
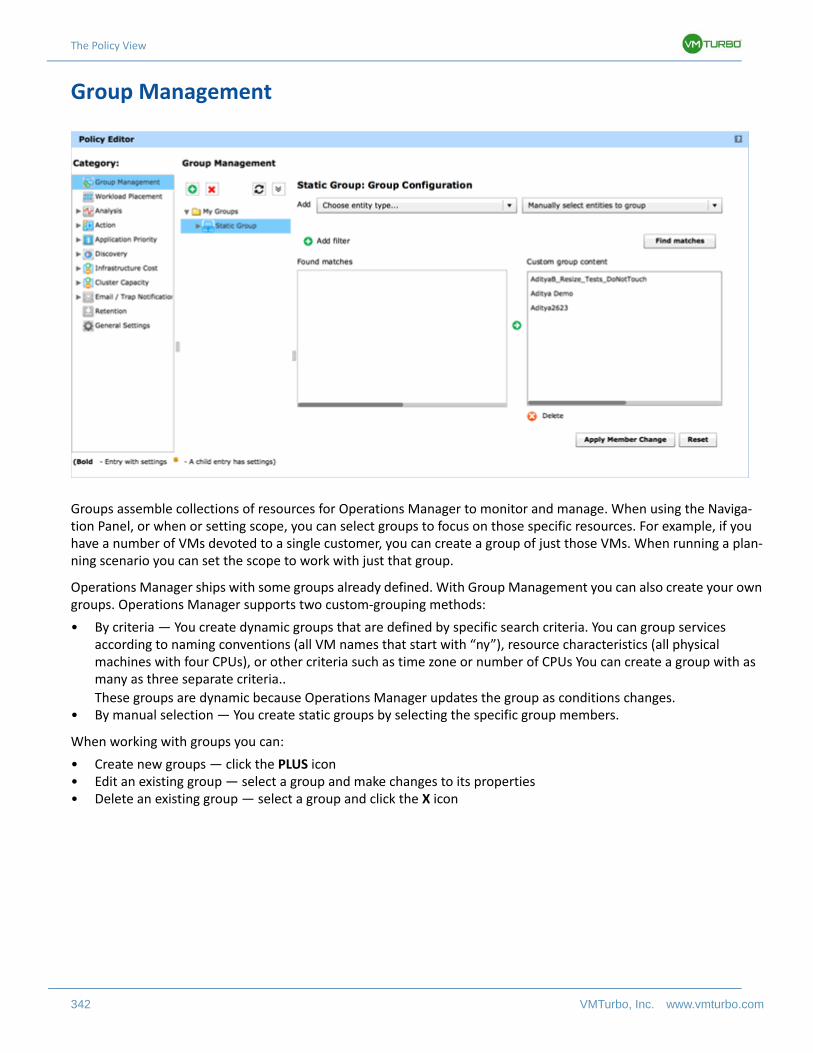
The Policy View
342 VMTurbo, Inc. www.vmturbo.com
Group Management
Groups assemble collections of resources for Operations Manager to monitor and manage. When using the Naviga-tion Panel, or when or setting scope, you can select groups to focus on those specific resources. For example, if you have a number of VMs devoted to a single customer, you can create a group of just those VMs. When running a plan-ning scenario you can set the scope to work with just that group.
Operations Manager ships with some groups already defined. With Group Management you can also create your own groups. Operations Manager supports two custom-grouping methods:
• By criteria — You create dynamic groups that are defined by specific search criteria. You can group services according to naming conventions (all VM names that start with “ny”), resource characteristics (all physical machines with four CPUs), or other criteria such as time zone or number of CPUs You can create a group with as many as three separate criteria..
These groups are dynamic because Operations Manager updates the group as conditions changes.• By manual selection — You create static groups by selecting the specific group members.
When working with groups you can:
• Create new groups — click the PLUS icon• Edit an existing group — select a group and make changes to its properties• Delete an existing group — select a group and click the X icon
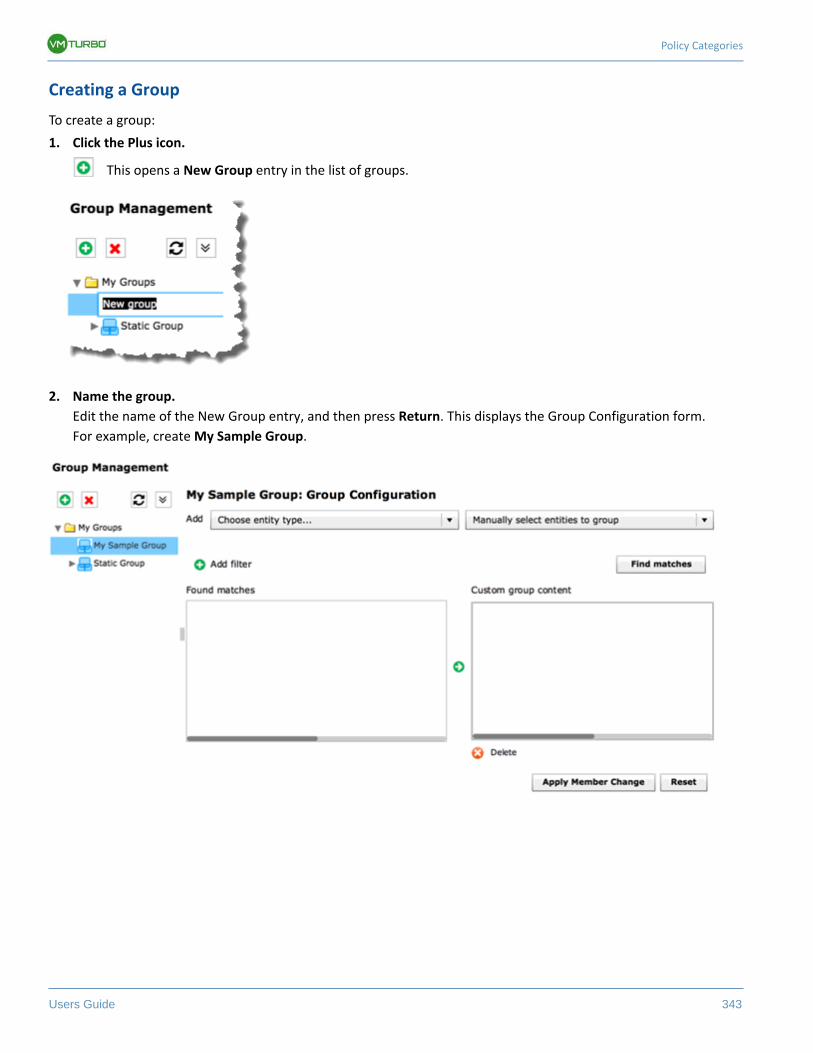
Policy Categories
Users Guide 343
Creating a Group
To create a group:
1. Click the Plus icon.
This opens a New Group entry in the list of groups.
2. Name the group.
Edit the name of the New Group entry, and then press Return. This displays the Group Configuration form.
For example, create My Sample Group.
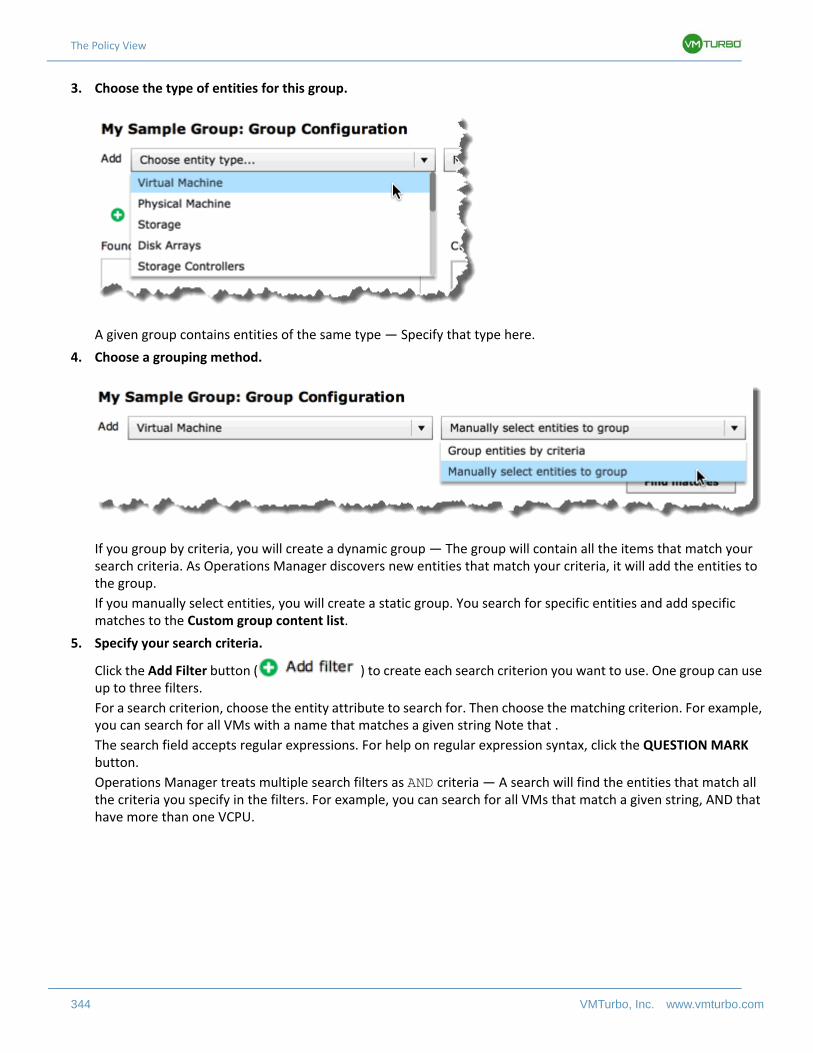
The Policy View
344 VMTurbo, Inc. www.vmturbo.com
3. Choose the type of entities for this group.
A given group contains entities of the same type — Specify that type here.
4. Choose a grouping method.
If you group by criteria, you will create a dynamic group — The group will contain all the items that match your search criteria. As Operations Manager discovers new entities that match your criteria, it will add the entities to the group.
If you manually select entities, you will create a static group. You search for specific entities and add specific matches to the Custom group content list.
5. Specify your search criteria.
Click the Add Filter button ( ) to create each search criterion you want to use. One group can use up to three filters.
For a search criterion, choose the entity attribute to search for. Then choose the matching criterion. For example, you can search for all VMs with a name that matches a given string Note that .
The search field accepts regular expressions. For help on regular expression syntax, click the QUESTION MARK button.
Operations Manager treats multiple search filters as AND criteria — A search will find the entities that match all the criteria you specify in the filters. For example, you can search for all VMs that match a given string, AND that have more than one VCPU.
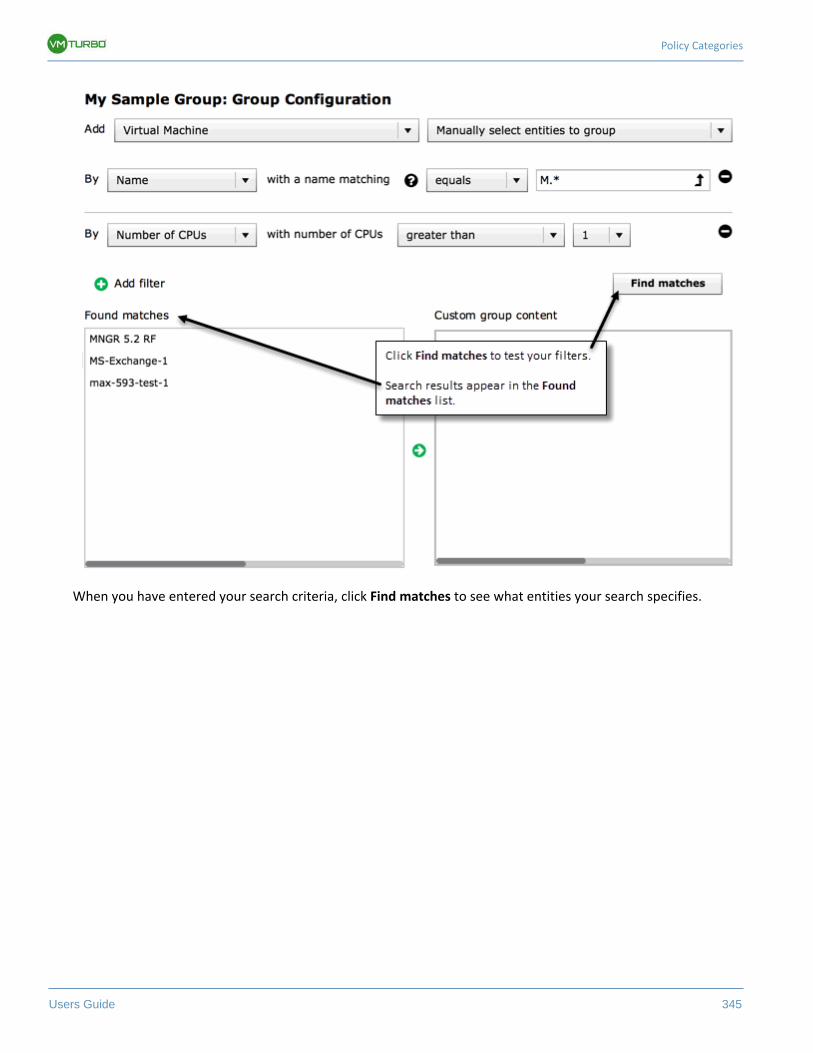
Policy Categories
Users Guide 345
When you have entered your search criteria, click Find matches to see what entities your search specifies.
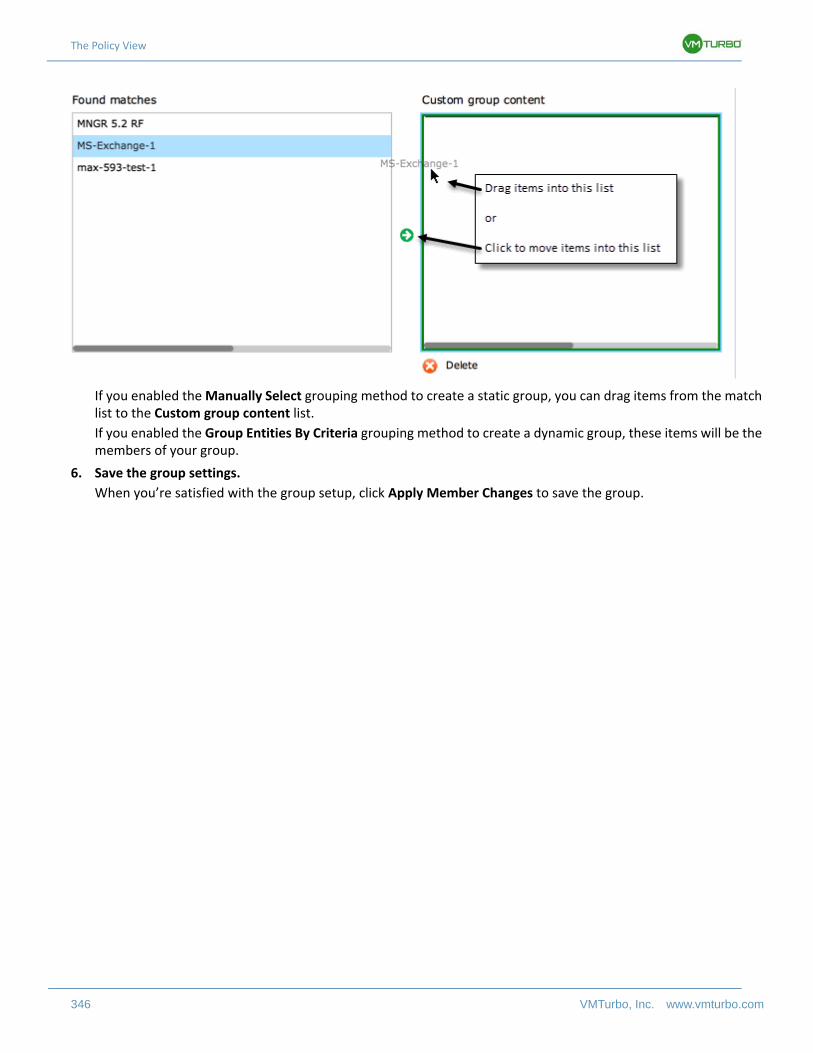
The Policy View
346 VMTurbo, Inc. www.vmturbo.com
If you enabled the Manually Select grouping method to create a static group, you can drag items from the match list to the Custom group content list.
If you enabled the Group Entities By Criteria grouping method to create a dynamic group, these items will be the members of your group.
6. Save the group settings.
When you’re satisfied with the group setup, click Apply Member Changes to save the group.
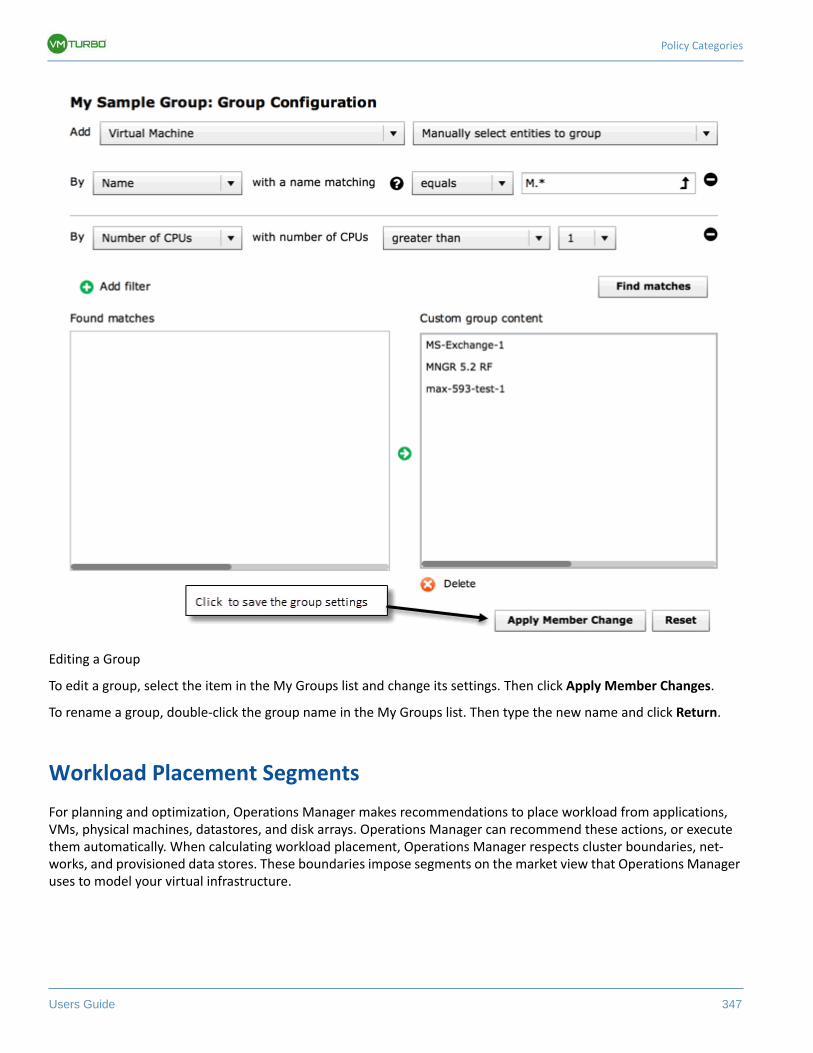
Policy Categories
Users Guide 347
Editing a Group
To edit a group, select the item in the My Groups list and change its settings. Then click Apply Member Changes.
To rename a group, double-click the group name in the My Groups list. Then type the new name and click Return.
Workload Placement Segments
For planning and optimization, Operations Manager makes recommendations to place workload from applications, VMs, physical machines, datastores, and disk arrays. Operations Manager can recommend these actions, or execute them automatically. When calculating workload placement, Operations Manager respects cluster boundaries, net-works, and provisioned data stores. These boundaries impose segments on the market view that Operations Manager uses to model your virtual infrastructure.
The Policy View
348 VMTurbo, Inc. www.vmturbo.com
In finance a market segment divides the market according to the criteria different groups of people use when they buy or sell goods and services. Likewise in the Operations Manager market, a workload placement segment uses criteria to focus the buying and selling of resources within specific groups of entities. It gives you finer control over how Opera-tions Manager calculates moves. When managing segments you can:
• Importing Workload Placement Policies on page 348 — Review the placement policies that Operations Manager has discovered. These are policies that have been defined in your environment, outside of Operations Manager.
• Creating Workload Placement Segments on page 349 — that restrict workload placement according to specific rules
NOTE: You can enable or disable any imported policy or created workload placement segment. You can view the constraints that affect any given entity in the Inventory view. For more information, see Viewing Entity Constraints on page 64.
Importing Workload Placement Policies
The hypervisors that you set as targets can include placement policies of their own. Operations Manager imports these placement policies, and you can choose to enable or disable them. By default, Operations Manager enables imported placement policies. (For information about target hypervisors, see Target Configuration on page 285.)
For example, VCenter servers can include Distributed Resource Scheduler (DRS) rules that determine placement of VMs among physical hosts. In Operations Manager, you can specify whether to enable or disable each DRS rule.
To see the list of imported placement policies for your environment, expand the Imported Placement Policies folder.
To enable or disable a policy, select it in the list and modify its settings.
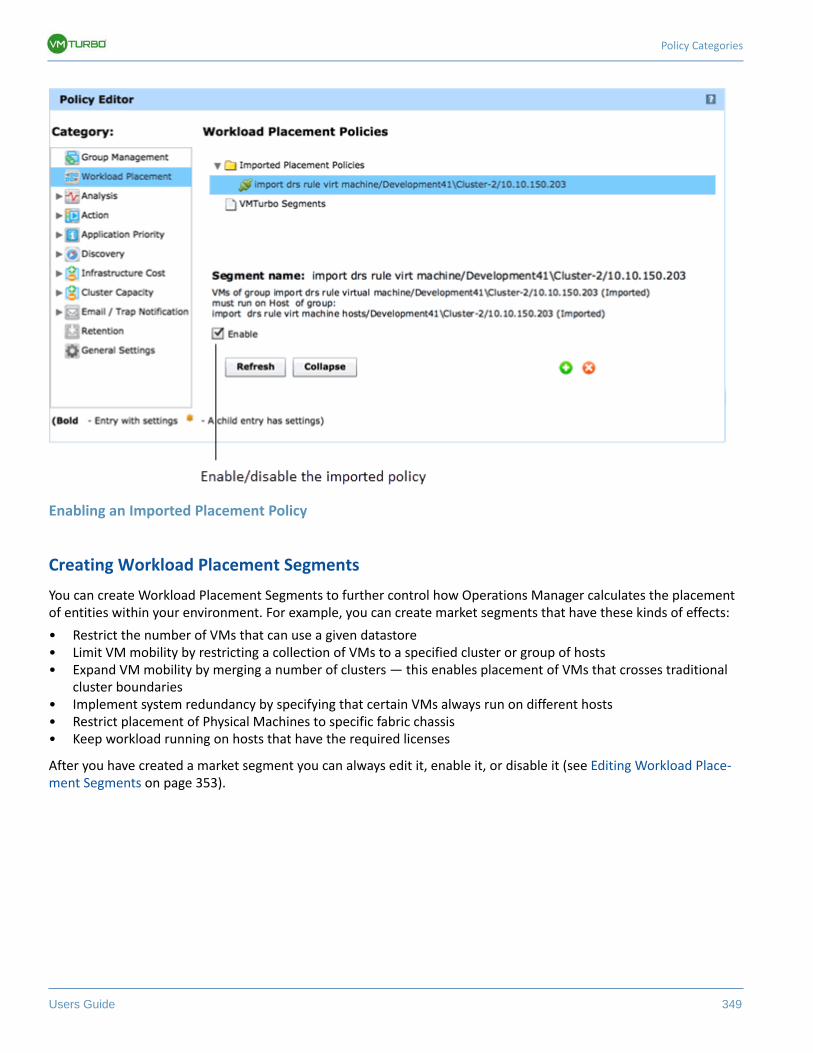
Policy Categories
Users Guide 349
Enabling an Imported Placement Policy
Creating Workload Placement Segments
You can create Workload Placement Segments to further control how Operations Manager calculates the placement of entities within your environment. For example, you can create market segments that have these kinds of effects:
• Restrict the number of VMs that can use a given datastore• Limit VM mobility by restricting a collection of VMs to a specified cluster or group of hosts• Expand VM mobility by merging a number of clusters — this enables placement of VMs that crosses traditional
cluster boundaries• Implement system redundancy by specifying that certain VMs always run on different hosts• Restrict placement of Physical Machines to specific fabric chassis• Keep workload running on hosts that have the required licenses
After you have created a market segment you can always edit it, enable it, or disable it (see Editing Workload Place-ment Segments on page 353).
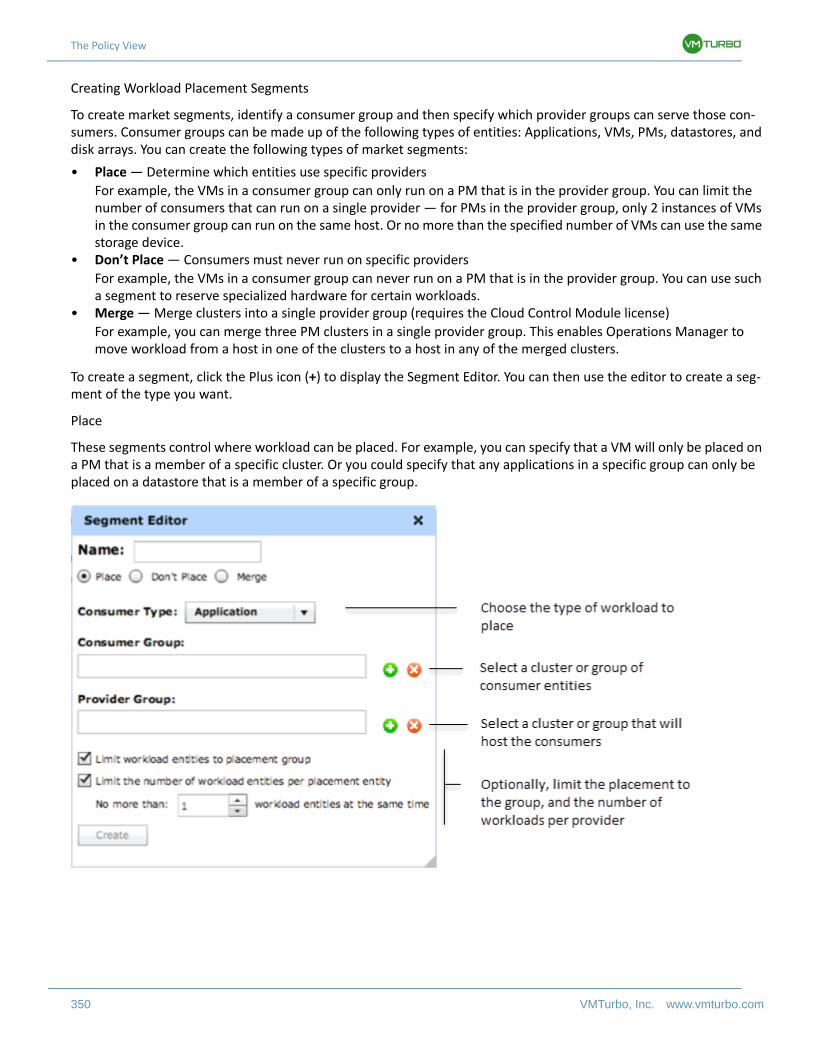
The Policy View
350 VMTurbo, Inc. www.vmturbo.com
Creating Workload Placement Segments
To create market segments, identify a consumer group and then specify which provider groups can serve those con-sumers. Consumer groups can be made up of the following types of entities: Applications, VMs, PMs, datastores, and disk arrays. You can create the following types of market segments:
• Place — Determine which entities use specific providers
For example, the VMs in a consumer group can only run on a PM that is in the provider group. You can limit the number of consumers that can run on a single provider — for PMs in the provider group, only 2 instances of VMs in the consumer group can run on the same host. Or no more than the specified number of VMs can use the same storage device.
• Don’t Place — Consumers must never run on specific providers
For example, the VMs in a consumer group can never run on a PM that is in the provider group. You can use such a segment to reserve specialized hardware for certain workloads.
• Merge — Merge clusters into a single provider group (requires the Cloud Control Module license)
For example, you can merge three PM clusters in a single provider group. This enables Operations Manager to move workload from a host in one of the clusters to a host in any of the merged clusters.
To create a segment, click the Plus icon (+) to display the Segment Editor. You can then use the editor to create a seg-ment of the type you want.
Place
These segments control where workload can be placed. For example, you can specify that a VM will only be placed on a PM that is a member of a specific cluster. Or you could specify that any applications in a specific group can only be placed on a datastore that is a member of a specific group.
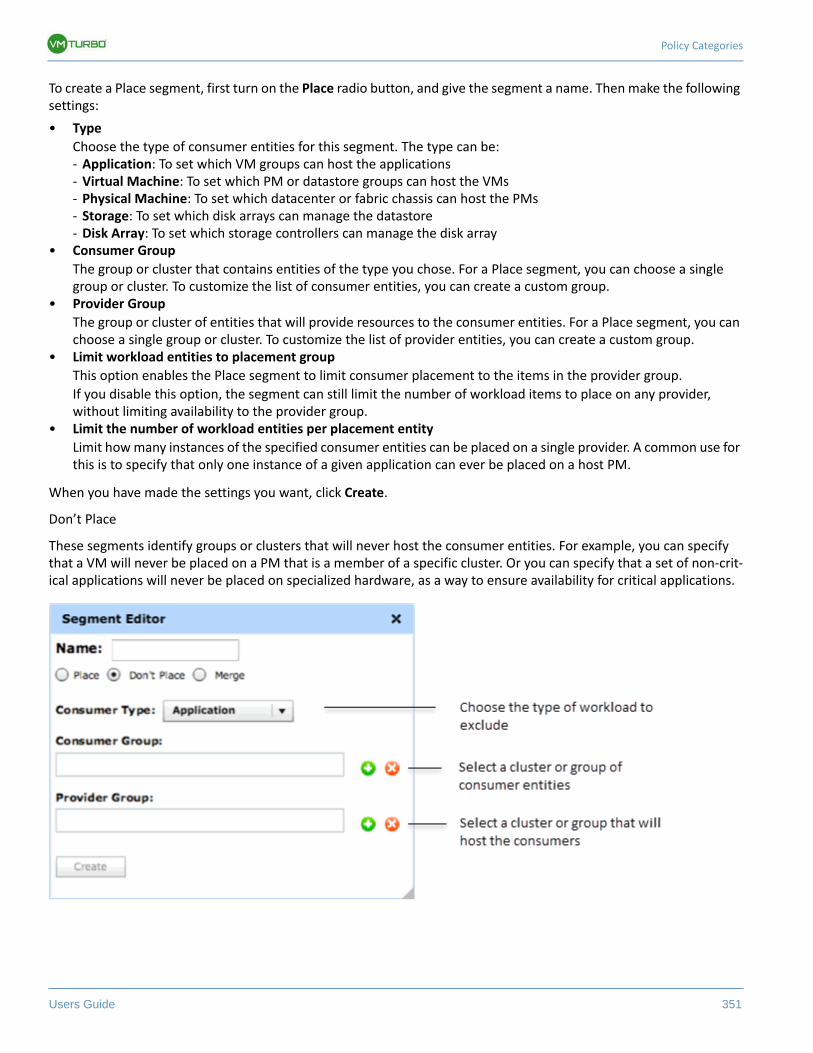
Policy Categories
Users Guide 351
To create a Place segment, first turn on the Place radio button, and give the segment a name. Then make the following settings:
• Type
Choose the type of consumer entities for this segment. The type can be:- Application: To set which VM groups can host the applications- Virtual Machine: To set which PM or datastore groups can host the VMs- Physical Machine: To set which datacenter or fabric chassis can host the PMs- Storage: To set which disk arrays can manage the datastore- Disk Array: To set which storage controllers can manage the disk array
• Consumer Group
The group or cluster that contains entities of the type you chose. For a Place segment, you can choose a single group or cluster. To customize the list of consumer entities, you can create a custom group.
• Provider Group
The group or cluster of entities that will provide resources to the consumer entities. For a Place segment, you can choose a single group or cluster. To customize the list of provider entities, you can create a custom group.
• Limit workload entities to placement group
This option enables the Place segment to limit consumer placement to the items in the provider group.
If you disable this option, the segment can still limit the number of workload items to place on any provider, without limiting availability to the provider group.
• Limit the number of workload entities per placement entity
Limit how many instances of the specified consumer entities can be placed on a single provider. A common use for this is to specify that only one instance of a given application can ever be placed on a host PM.
When you have made the settings you want, click Create.
Don’t Place
These segments identify groups or clusters that will never host the consumer entities. For example, you can specify that a VM will never be placed on a PM that is a member of a specific cluster. Or you can specify that a set of non-crit-ical applications will never be placed on specialized hardware, as a way to ensure availability for critical applications.
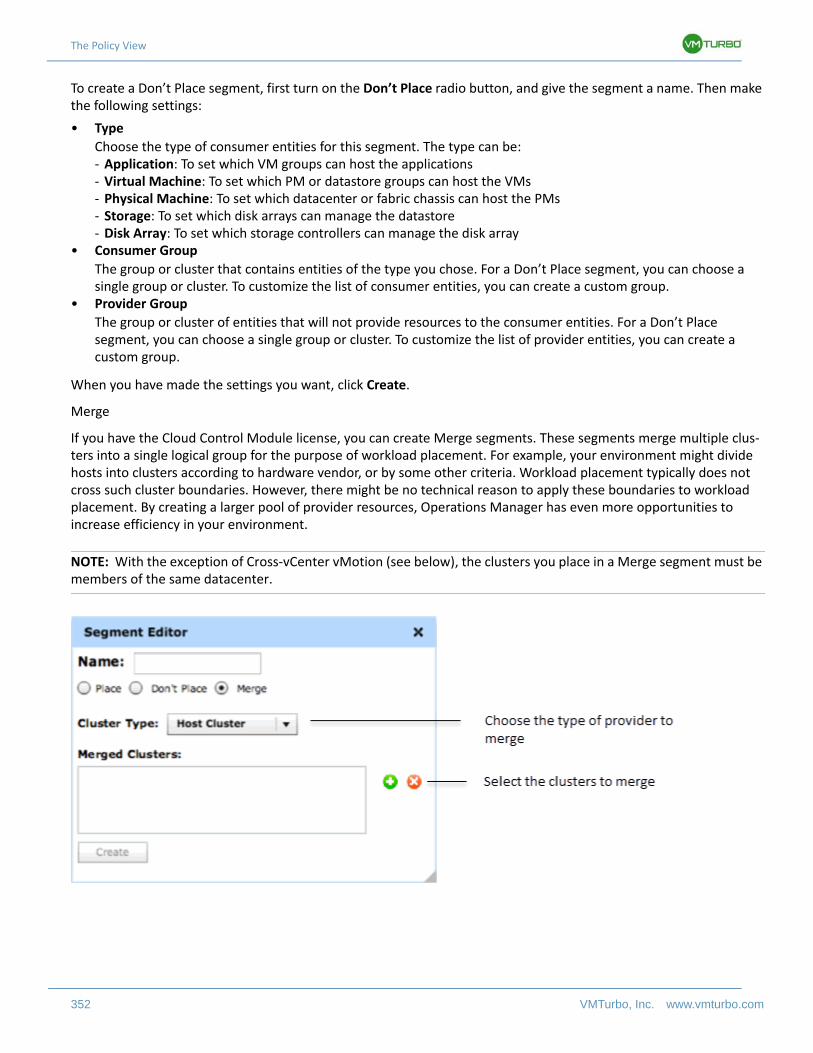
The Policy View
352 VMTurbo, Inc. www.vmturbo.com
To create a Don’t Place segment, first turn on the Don’t Place radio button, and give the segment a name. Then make the following settings:
• Type
Choose the type of consumer entities for this segment. The type can be:- Application: To set which VM groups can host the applications- Virtual Machine: To set which PM or datastore groups can host the VMs- Physical Machine: To set which datacenter or fabric chassis can host the PMs- Storage: To set which disk arrays can manage the datastore- Disk Array: To set which storage controllers can manage the disk array
• Consumer Group
The group or cluster that contains entities of the type you chose. For a Don’t Place segment, you can choose a single group or cluster. To customize the list of consumer entities, you can create a custom group.
• Provider Group
The group or cluster of entities that will not provide resources to the consumer entities. For a Don’t Place segment, you can choose a single group or cluster. To customize the list of provider entities, you can create a custom group.
When you have made the settings you want, click Create.
Merge
If you have the Cloud Control Module license, you can create Merge segments. These segments merge multiple clus-ters into a single logical group for the purpose of workload placement. For example, your environment might divide hosts into clusters according to hardware vendor, or by some other criteria. Workload placement typically does not cross such cluster boundaries. However, there might be no technical reason to apply these boundaries to workload placement. By creating a larger pool of provider resources, Operations Manager has even more opportunities to increase efficiency in your environment.
NOTE: With the exception of Cross-vCenter vMotion (see below), the clusters you place in a Merge segment must be members of the same datacenter.
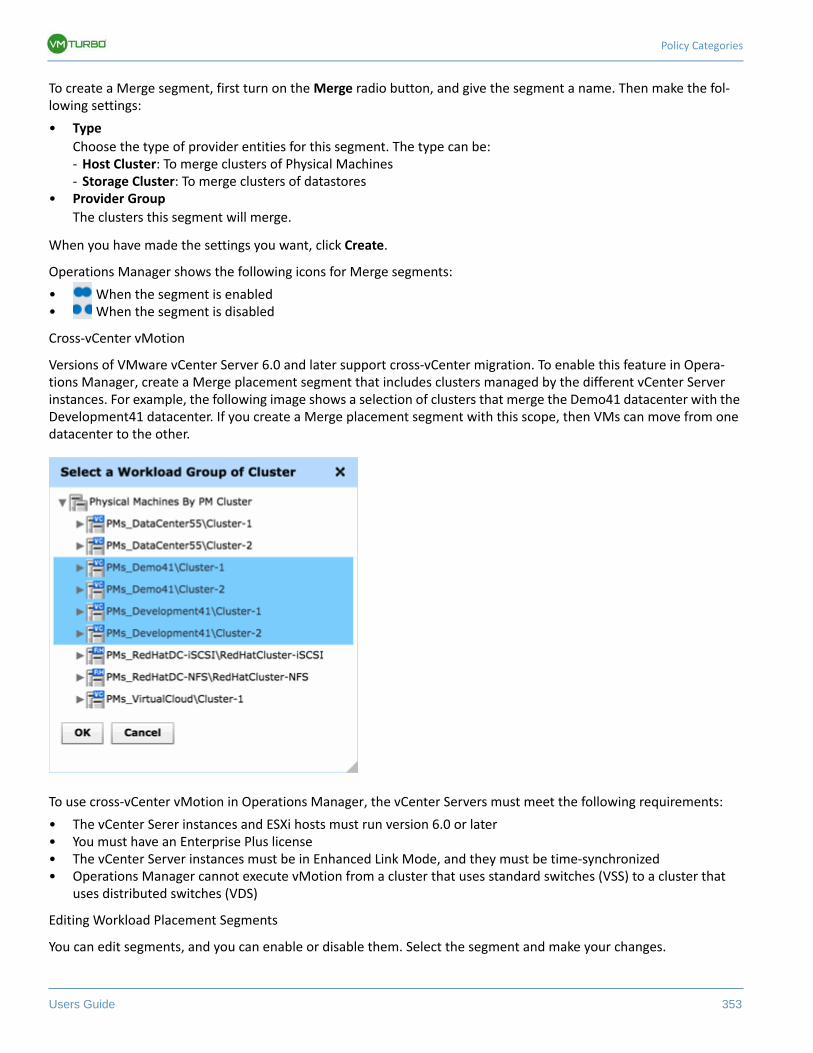
Policy Categories
Users Guide 353
To create a Merge segment, first turn on the Merge radio button, and give the segment a name. Then make the fol-lowing settings:
• Type
Choose the type of provider entities for this segment. The type can be:- Host Cluster: To merge clusters of Physical Machines- Storage Cluster: To merge clusters of datastores
• Provider Group
The clusters this segment will merge.
When you have made the settings you want, click Create.
Operations Manager shows the following icons for Merge segments:
• When the segment is enabled• When the segment is disabled
Cross-vCenter vMotion
Versions of VMware vCenter Server 6.0 and later support cross-vCenter migration. To enable this feature in Opera-tions Manager, create a Merge placement segment that includes clusters managed by the different vCenter Server instances. For example, the following image shows a selection of clusters that merge the Demo41 datacenter with the Development41 datacenter. If you create a Merge placement segment with this scope, then VMs can move from one datacenter to the other.
To use cross-vCenter vMotion in Operations Manager, the vCenter Servers must meet the following requirements:
• The vCenter Serer instances and ESXi hosts must run version 6.0 or later• You must have an Enterprise Plus license• The vCenter Server instances must be in Enhanced Link Mode, and they must be time-synchronized• Operations Manager cannot execute vMotion from a cluster that uses standard switches (VSS) to a cluster that
uses distributed switches (VDS)
Editing Workload Placement Segments
You can edit segments, and you can enable or disable them. Select the segment and make your changes.
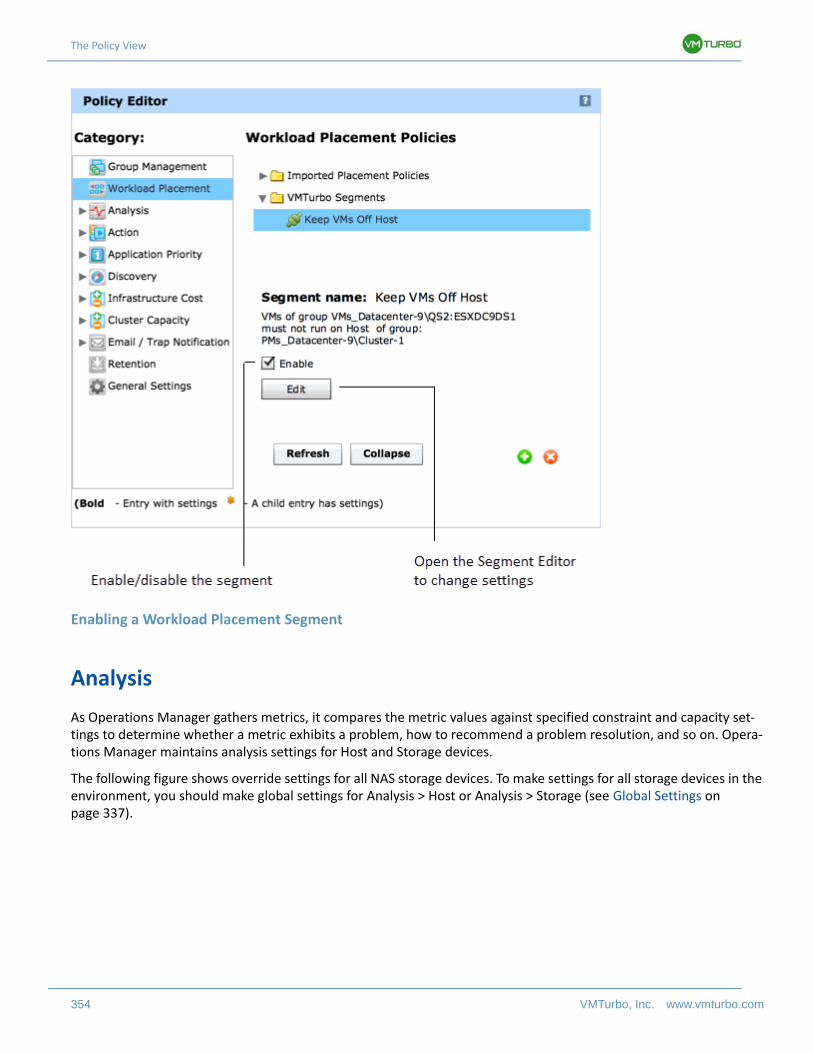
The Policy View
354 VMTurbo, Inc. www.vmturbo.com
Enabling a Workload Placement Segment
Analysis
As Operations Manager gathers metrics, it compares the metric values against specified constraint and capacity set-tings to determine whether a metric exhibits a problem, how to recommend a problem resolution, and so on. Opera-tions Manager maintains analysis settings for Host and Storage devices.
The following figure shows override settings for all NAS storage devices. To make settings for all storage devices in the environment, you should make global settings for Analysis > Host or Analysis > Storage (see Global Settings on page 337).
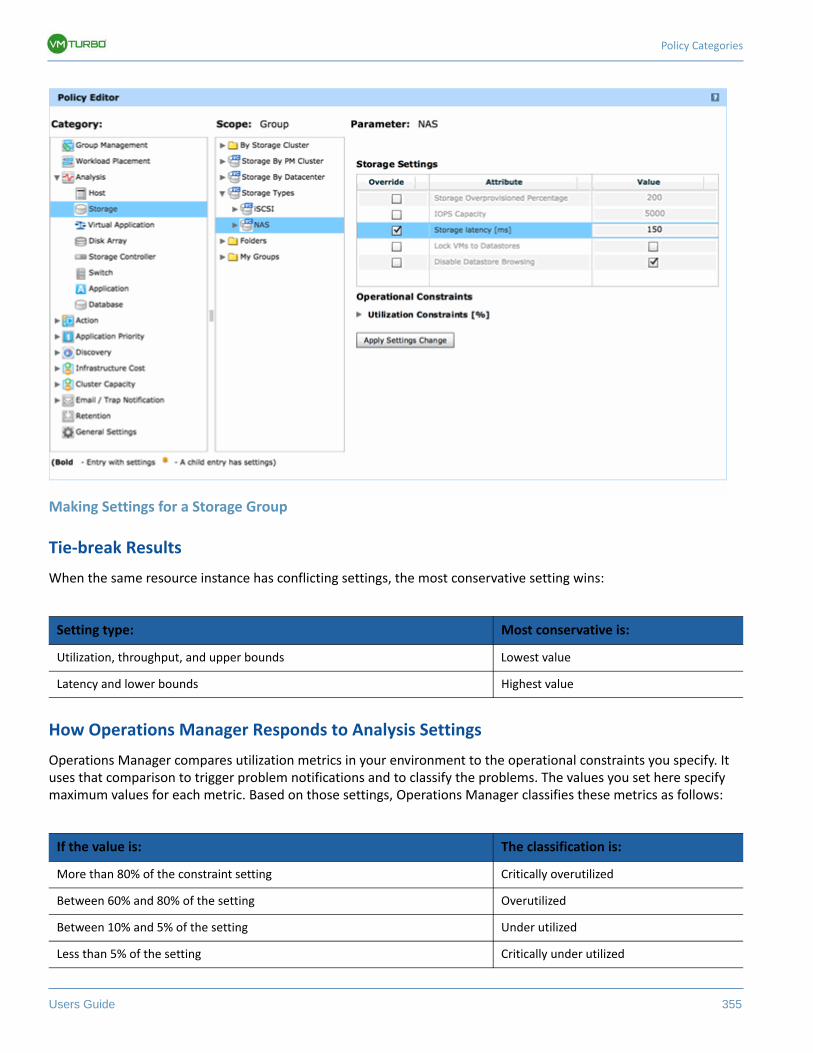
Policy Categories
Users Guide 355
Making Settings for a Storage Group
Tie-break Results
When the same resource instance has conflicting settings, the most conservative setting wins:
How Operations Manager Responds to Analysis Settings
Operations Manager compares utilization metrics in your environment to the operational constraints you specify. It uses that comparison to trigger problem notifications and to classify the problems. The values you set here specify maximum values for each metric. Based on those settings, Operations Manager classifies these metrics as follows:
Setting type: Most conservative is:
Utilization, throughput, and upper bounds Lowest value
Latency and lower bounds Highest value
If the value is: The classification is:
More than 80% of the constraint setting Critically overutilized
Between 60% and 80% of the setting Overutilized
Between 10% and 5% of the setting Under utilized
Less than 5% of the setting Critically under utilized
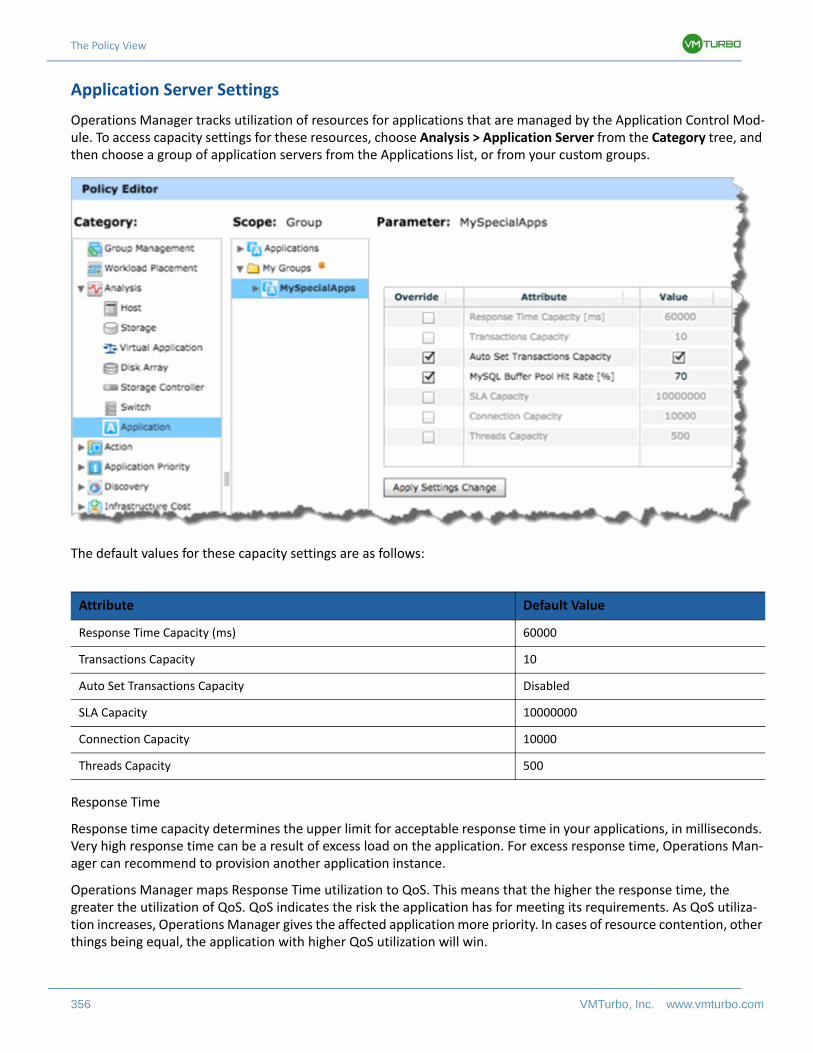
The Policy View
356 VMTurbo, Inc. www.vmturbo.com
Application Server Settings
Operations Manager tracks utilization of resources for applications that are managed by the Application Control Mod-ule. To access capacity settings for these resources, choose Analysis > Application Server from the Category tree, and then choose a group of application servers from the Applications list, or from your custom groups.
The default values for these capacity settings are as follows:
Response Time
Response time capacity determines the upper limit for acceptable response time in your applications, in milliseconds. Very high response time can be a result of excess load on the application. For excess response time, Operations Man-ager can recommend to provision another application instance.
Operations Manager maps Response Time utilization to QoS. This means that the higher the response time, the greater the utilization of QoS. QoS indicates the risk the application has for meeting its requirements. As QoS utiliza-tion increases, Operations Manager gives the affected application more priority. In cases of resource contention, other things being equal, the application with higher QoS utilization will win.
Attribute Default Value
Response Time Capacity (ms) 60000
Transactions Capacity 10
Auto Set Transactions Capacity Disabled
SLA Capacity 10000000
Connection Capacity 10000
Threads Capacity 500
Policy Categories
Users Guide 357
Transactions
This resource measures the number of transactions per second. Excess transactions indicate a heavy load on the appli-cation server, and usually means you should provision a new instance. You can set the transaction capacity, or direct Operations Manager to automatically set it.
• Transaction Capacity
If you know the rate of transactions your applications can maintain, then you can set it here. The value that you set indicates when Operations Manager considers utilization to be 100%. The default value is 10 — If an application experiences 10 transactions per second or more, Operations Manager sets the utilization index for this resource to 100%.
• Auto Set Transaction Capacity
If you enable this setting, Operations Manager adjusts the transaction capacity to the upper limit your application server experiences. For example, if the Transaction Capacity is set to 10, and the application server experiences 15 transactions per second, then the utilization of this resource would be 150%. However, if you enable Auto Set Transaction Capacity, then Operations Manager would increase the capacity to 15, and show utilization at 100%.
SLA
This sets how much the given application can be at risk for meeting its QoS requirements. The higher the risk, the more priority the application has to get resources from the underlying providers.
NOTE: Measurement of QoS against the capacity set for SLA requires instrumentation to monitor QoS-related metrics, or integration of third-party monitoring systems with Operations Manager. If you have such monitoring, then you can provide values for SLA in relation to the scale of your monitoring. Otherwise, you should leave this setting at the default. Also note that this SLA setting does not impact the mapping of Response Time consumption to QoS measure-ments in applications.
Connection
Connection capacity determines the upper limit for concurrent connections to the application. Excess connections can indicate the need to provision a new instance.
Threads
For most types of applications and servers managed by the Application Control Module (ACM), Operations Manager discovers the thread pool capacity on the server, and uses that in utilization calculations. For this release, the follow-ing types of supported ACM targets do not provide thread pool data that Operations Manager can use:
• Microsoft Exchange Server
For entities of this type, you can select a group of these entities and specify the thread pool capacity. Operations Man-ager assumes a default capacity of 500 threads, which is according to best practices in the field.
Load Balancer Settings
To manage load balancers, Operations Manager tracks transactions that occur on the virtual applications (vservers) each load balancer manages. You can set the capacity of transactions per second as a policy for virtual applications. Operations Manager will list transaction utilization as a percentage of the capacity you set.
Attribute Default Value
Virtual Application Transaction Capacity 1000
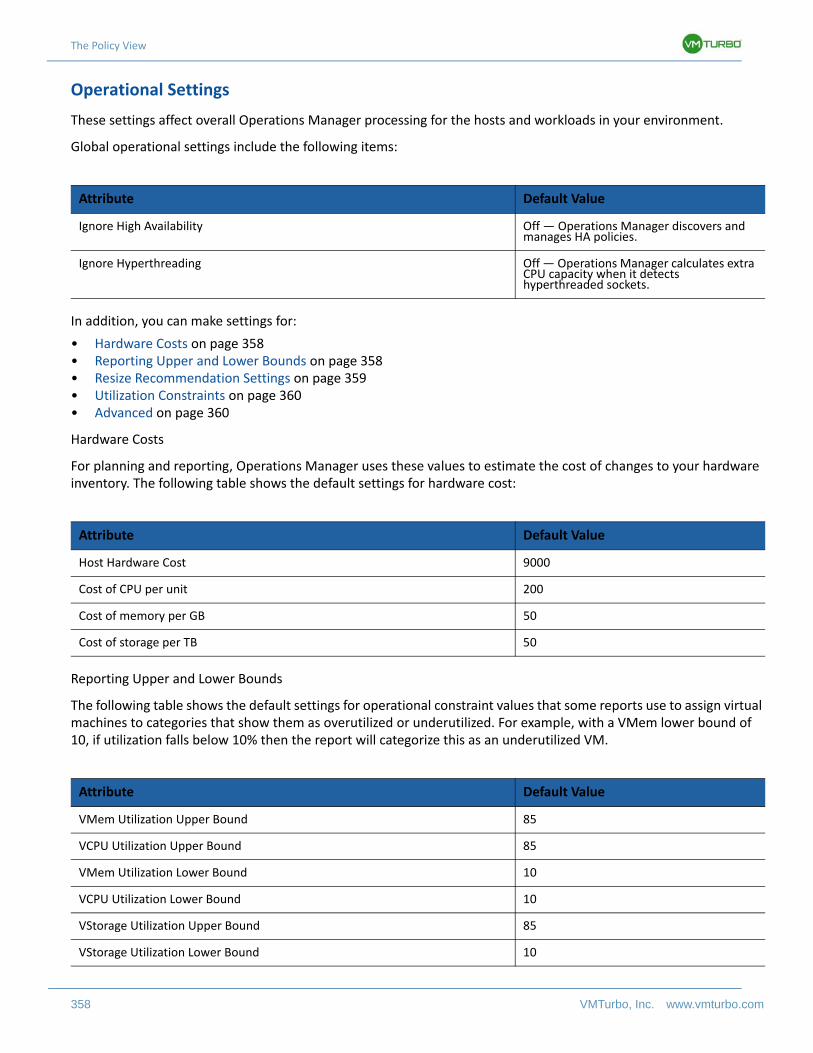
The Policy View
358 VMTurbo, Inc. www.vmturbo.com
Operational Settings
These settings affect overall Operations Manager processing for the hosts and workloads in your environment.
Global operational settings include the following items:
In addition, you can make settings for:
• Hardware Costs on page 358• Reporting Upper and Lower Bounds on page 358• Resize Recommendation Settings on page 359• Utilization Constraints on page 360• Advanced on page 360
Hardware Costs
For planning and reporting, Operations Manager uses these values to estimate the cost of changes to your hardware inventory. The following table shows the default settings for hardware cost:
Reporting Upper and Lower Bounds
The following table shows the default settings for operational constraint values that some reports use to assign virtual machines to categories that show them as overutilized or underutilized. For example, with a VMem lower bound of 10, if utilization falls below 10% then the report will categorize this as an underutilized VM.
Attribute Default Value
Ignore High Availability Off — Operations Manager discovers and manages HA policies.
Ignore Hyperthreading Off — Operations Manager calculates extra CPU capacity when it detects hyperthreaded sockets.
Attribute Default Value
Host Hardware Cost 9000
Cost of CPU per unit 200
Cost of memory per GB 50
Cost of storage per TB 50
Attribute Default Value
VMem Utilization Upper Bound 85
VCPU Utilization Upper Bound 85
VMem Utilization Lower Bound 10
VCPU Utilization Lower Bound 10
VStorage Utilization Upper Bound 85
VStorage Utilization Lower Bound 10
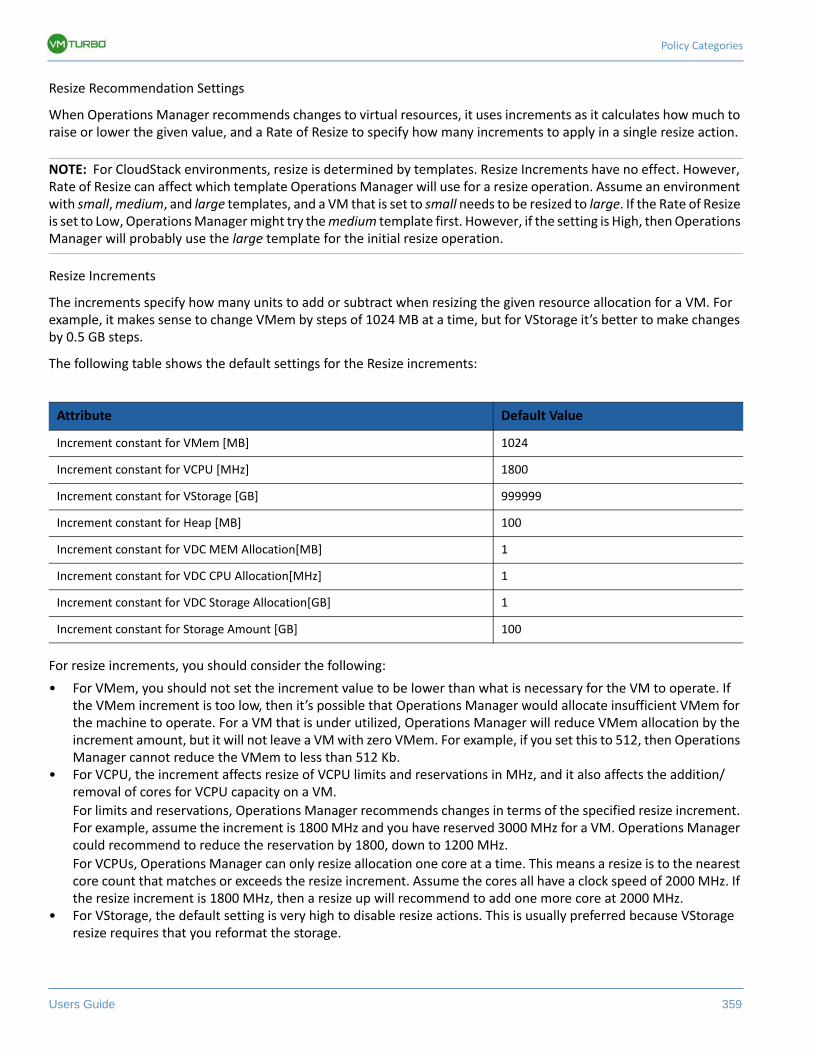
Policy Categories
Users Guide 359
Resize Recommendation Settings
When Operations Manager recommends changes to virtual resources, it uses increments as it calculates how much to raise or lower the given value, and a Rate of Resize to specify how many increments to apply in a single resize action.
NOTE: For CloudStack environments, resize is determined by templates. Resize Increments have no effect. However, Rate of Resize can affect which template Operations Manager will use for a resize operation. Assume an environment with small, medium, and large templates, and a VM that is set to small needs to be resized to large. If the Rate of Resize is set to Low, Operations Manager might try the medium template first. However, if the setting is High, then Operations Manager will probably use the large template for the initial resize operation.
Resize Increments
The increments specify how many units to add or subtract when resizing the given resource allocation for a VM. For example, it makes sense to change VMem by steps of 1024 MB at a time, but for VStorage it’s better to make changes by 0.5 GB steps.
The following table shows the default settings for the Resize increments:
For resize increments, you should consider the following:
• For VMem, you should not set the increment value to be lower than what is necessary for the VM to operate. If the VMem increment is too low, then it’s possible that Operations Manager would allocate insufficient VMem for the machine to operate. For a VM that is under utilized, Operations Manager will reduce VMem allocation by the increment amount, but it will not leave a VM with zero VMem. For example, if you set this to 512, then Operations Manager cannot reduce the VMem to less than 512 Kb.
• For VCPU, the increment affects resize of VCPU limits and reservations in MHz, and it also affects the addition/removal of cores for VCPU capacity on a VM.
For limits and reservations, Operations Manager recommends changes in terms of the specified resize increment. For example, assume the increment is 1800 MHz and you have reserved 3000 MHz for a VM. Operations Manager could recommend to reduce the reservation by 1800, down to 1200 MHz.
For VCPUs, Operations Manager can only resize allocation one core at a time. This means a resize is to the nearest core count that matches or exceeds the resize increment. Assume the cores all have a clock speed of 2000 MHz. If the resize increment is 1800 MHz, then a resize up will recommend to add one more core at 2000 MHz.
• For VStorage, the default setting is very high to disable resize actions. This is usually preferred because VStorage resize requires that you reformat the storage.
Attribute Default Value
Increment constant for VMem [MB] 1024
Increment constant for VCPU [MHz] 1800
Increment constant for VStorage [GB] 999999
Increment constant for Heap [MB] 100
Increment constant for VDC MEM Allocation[MB] 1
Increment constant for VDC CPU Allocation[MHz] 1
Increment constant for VDC Storage Allocation[GB] 1
Increment constant for Storage Amount [GB] 100
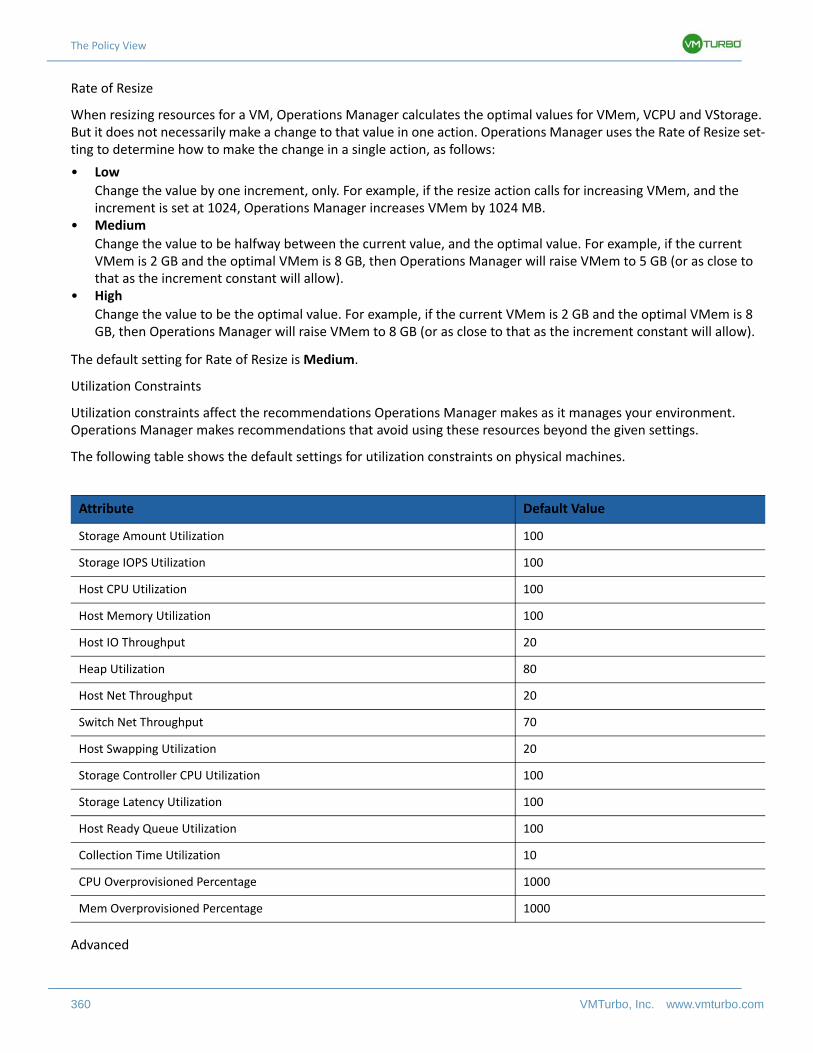
The Policy View
360 VMTurbo, Inc. www.vmturbo.com
Rate of Resize
When resizing resources for a VM, Operations Manager calculates the optimal values for VMem, VCPU and VStorage. But it does not necessarily make a change to that value in one action. Operations Manager uses the Rate of Resize set-ting to determine how to make the change in a single action, as follows:
• Low
Change the value by one increment, only. For example, if the resize action calls for increasing VMem, and the increment is set at 1024, Operations Manager increases VMem by 1024 MB.
• Medium
Change the value to be halfway between the current value, and the optimal value. For example, if the current VMem is 2 GB and the optimal VMem is 8 GB, then Operations Manager will raise VMem to 5 GB (or as close to that as the increment constant will allow).
• High
Change the value to be the optimal value. For example, if the current VMem is 2 GB and the optimal VMem is 8 GB, then Operations Manager will raise VMem to 8 GB (or as close to that as the increment constant will allow).
The default setting for Rate of Resize is Medium.
Utilization Constraints
Utilization constraints affect the recommendations Operations Manager makes as it manages your environment. Operations Manager makes recommendations that avoid using these resources beyond the given settings.
The following table shows the default settings for utilization constraints on physical machines.
Advanced
Attribute Default Value
Storage Amount Utilization 100
Storage IOPS Utilization 100
Host CPU Utilization 100
Host Memory Utilization 100
Host IO Throughput 20
Heap Utilization 80
Host Net Throughput 20
Switch Net Throughput 70
Host Swapping Utilization 20
Storage Controller CPU Utilization 100
Storage Latency Utilization 100
Host Ready Queue Utilization 100
Collection Time Utilization 10
CPU Overprovisioned Percentage 1000
Mem Overprovisioned Percentage 1000
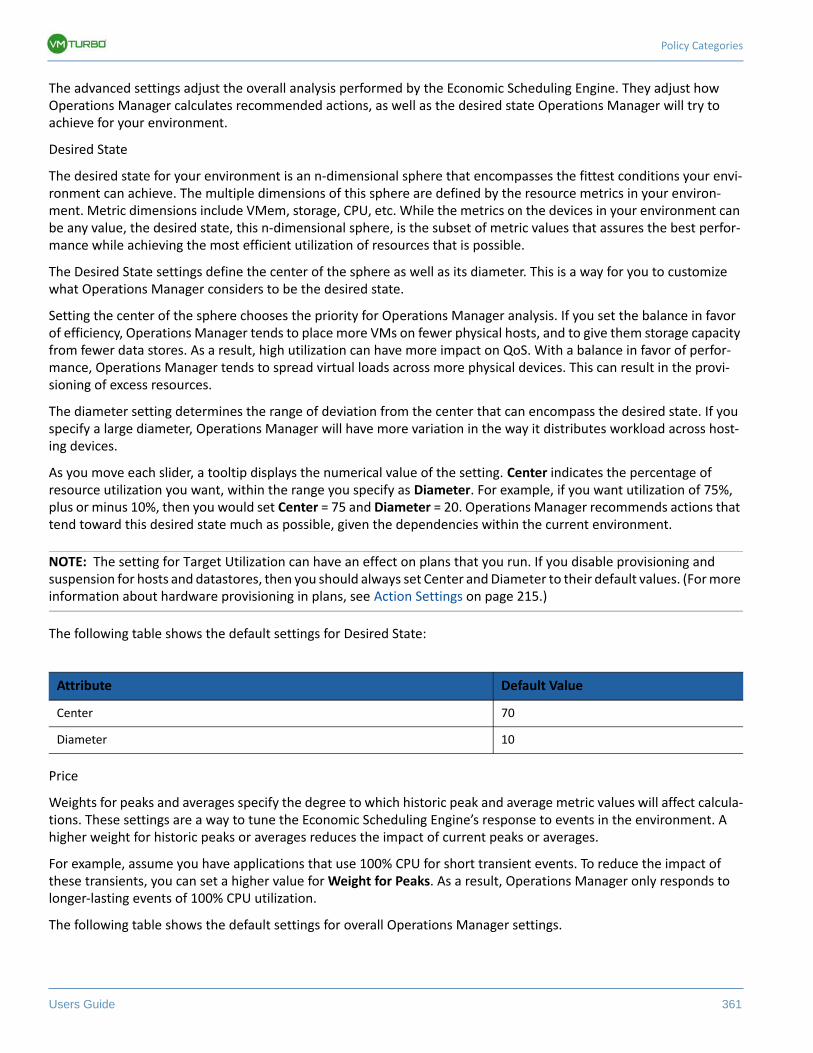
Policy Categories
Users Guide 361
The advanced settings adjust the overall analysis performed by the Economic Scheduling Engine. They adjust how Operations Manager calculates recommended actions, as well as the desired state Operations Manager will try to achieve for your environment.
Desired State
The desired state for your environment is an n-dimensional sphere that encompasses the fittest conditions your envi-ronment can achieve. The multiple dimensions of this sphere are defined by the resource metrics in your environ-ment. Metric dimensions include VMem, storage, CPU, etc. While the metrics on the devices in your environment can be any value, the desired state, this n-dimensional sphere, is the subset of metric values that assures the best perfor-mance while achieving the most efficient utilization of resources that is possible.
The Desired State settings define the center of the sphere as well as its diameter. This is a way for you to customize what Operations Manager considers to be the desired state.
Setting the center of the sphere chooses the priority for Operations Manager analysis. If you set the balance in favor of efficiency, Operations Manager tends to place more VMs on fewer physical hosts, and to give them storage capacity from fewer data stores. As a result, high utilization can have more impact on QoS. With a balance in favor of perfor-mance, Operations Manager tends to spread virtual loads across more physical devices. This can result in the provi-sioning of excess resources.
The diameter setting determines the range of deviation from the center that can encompass the desired state. If you specify a large diameter, Operations Manager will have more variation in the way it distributes workload across host-ing devices.
As you move each slider, a tooltip displays the numerical value of the setting. Center indicates the percentage of resource utilization you want, within the range you specify as Diameter. For example, if you want utilization of 75%, plus or minus 10%, then you would set Center = 75 and Diameter = 20. Operations Manager recommends actions that tend toward this desired state much as possible, given the dependencies within the current environment.
NOTE: The setting for Target Utilization can have an effect on plans that you run. If you disable provisioning and suspension for hosts and datastores, then you should always set Center and Diameter to their default values. (For more information about hardware provisioning in plans, see Action Settings on page 215.)
The following table shows the default settings for Desired State:
Price
Weights for peaks and averages specify the degree to which historic peak and average metric values will affect calcula-tions. These settings are a way to tune the Economic Scheduling Engine’s response to events in the environment. A higher weight for historic peaks or averages reduces the impact of current peaks or averages.
For example, assume you have applications that use 100% CPU for short transient events. To reduce the impact of these transients, you can set a higher value for Weight for Peaks. As a result, Operations Manager only responds to longer-lasting events of 100% CPU utilization.
The following table shows the default settings for overall Operations Manager settings.
Attribute Default Value
Center 70
Diameter 10
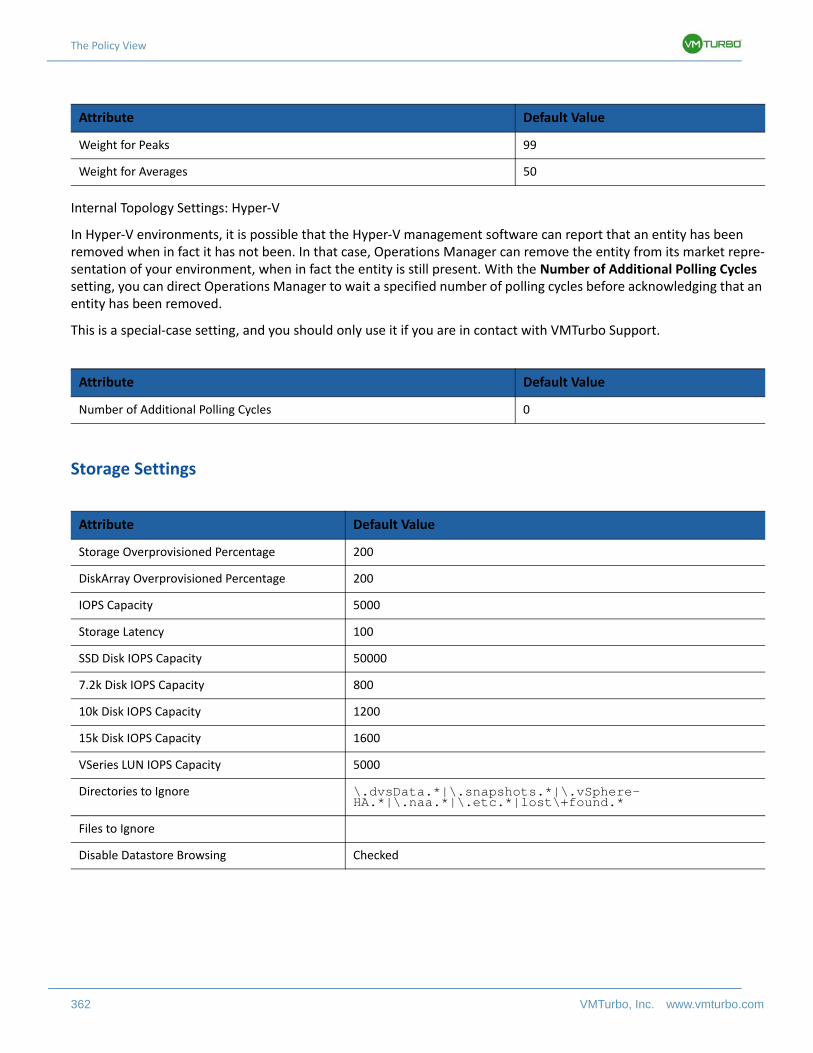
The Policy View
362 VMTurbo, Inc. www.vmturbo.com
Internal Topology Settings: Hyper-V
In Hyper-V environments, it is possible that the Hyper-V management software can report that an entity has been removed when in fact it has not been. In that case, Operations Manager can remove the entity from its market repre-sentation of your environment, when in fact the entity is still present. With the Number of Additional Polling Cycles setting, you can direct Operations Manager to wait a specified number of polling cycles before acknowledging that an entity has been removed.
This is a special-case setting, and you should only use it if you are in contact with VMTurbo Support.
Storage Settings
Attribute Default Value
Weight for Peaks 99
Weight for Averages 50
Attribute Default Value
Number of Additional Polling Cycles 0
Attribute Default Value
Storage Overprovisioned Percentage 200
DiskArray Overprovisioned Percentage 200
IOPS Capacity 5000
Storage Latency 100
SSD Disk IOPS Capacity 50000
7.2k Disk IOPS Capacity 800
10k Disk IOPS Capacity 1200
15k Disk IOPS Capacity 1600
VSeries LUN IOPS Capacity 5000
Directories to Ignore \.dvsData.*|\.snapshots.*|\.vSphere-HA.*|\.naa.*|\.etc.*|lost\+found.*
Files to Ignore
Disable Datastore Browsing Checked
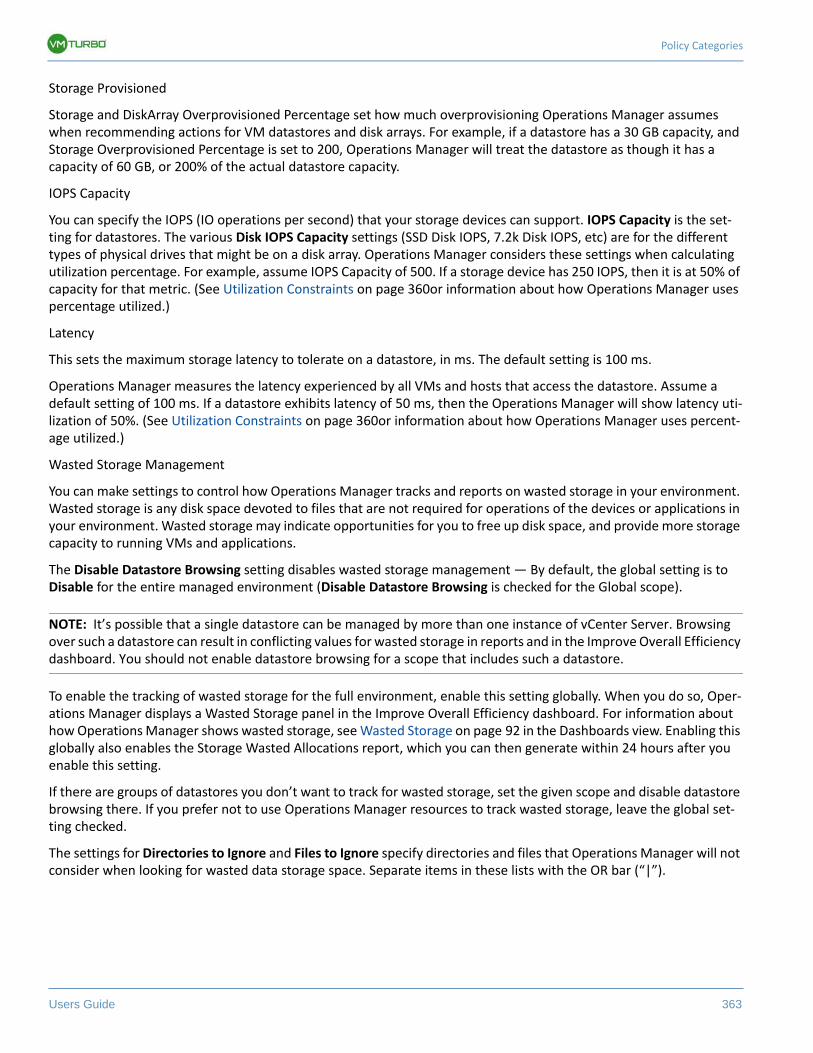
Policy Categories
Users Guide 363
Storage Provisioned
Storage and DiskArray Overprovisioned Percentage set how much overprovisioning Operations Manager assumes when recommending actions for VM datastores and disk arrays. For example, if a datastore has a 30 GB capacity, and Storage Overprovisioned Percentage is set to 200, Operations Manager will treat the datastore as though it has a capacity of 60 GB, or 200% of the actual datastore capacity.
IOPS Capacity
You can specify the IOPS (IO operations per second) that your storage devices can support. IOPS Capacity is the set-ting for datastores. The various Disk IOPS Capacity settings (SSD Disk IOPS, 7.2k Disk IOPS, etc) are for the different types of physical drives that might be on a disk array. Operations Manager considers these settings when calculating utilization percentage. For example, assume IOPS Capacity of 500. If a storage device has 250 IOPS, then it is at 50% of capacity for that metric. (See Utilization Constraints on page 360or information about how Operations Manager uses percentage utilized.)
Latency
This sets the maximum storage latency to tolerate on a datastore, in ms. The default setting is 100 ms.
Operations Manager measures the latency experienced by all VMs and hosts that access the datastore. Assume a default setting of 100 ms. If a datastore exhibits latency of 50 ms, then the Operations Manager will show latency uti-lization of 50%. (See Utilization Constraints on page 360or information about how Operations Manager uses percent-age utilized.)
Wasted Storage Management
You can make settings to control how Operations Manager tracks and reports on wasted storage in your environment. Wasted storage is any disk space devoted to files that are not required for operations of the devices or applications in your environment. Wasted storage may indicate opportunities for you to free up disk space, and provide more storage capacity to running VMs and applications.
The Disable Datastore Browsing setting disables wasted storage management — By default, the global setting is to Disable for the entire managed environment (Disable Datastore Browsing is checked for the Global scope).
NOTE: It’s possible that a single datastore can be managed by more than one instance of vCenter Server. Browsing over such a datastore can result in conflicting values for wasted storage in reports and in the Improve Overall Efficiency dashboard. You should not enable datastore browsing for a scope that includes such a datastore.
To enable the tracking of wasted storage for the full environment, enable this setting globally. When you do so, Oper-ations Manager displays a Wasted Storage panel in the Improve Overall Efficiency dashboard. For information about how Operations Manager shows wasted storage, see Wasted Storage on page 92 in the Dashboards view. Enabling this globally also enables the Storage Wasted Allocations report, which you can then generate within 24 hours after you enable this setting.
If there are groups of datastores you don’t want to track for wasted storage, set the given scope and disable datastore browsing there. If you prefer not to use Operations Manager resources to track wasted storage, leave the global set-ting checked.
The settings for Directories to Ignore and Files to Ignore specify directories and files that Operations Manager will not consider when looking for wasted data storage space. Separate items in these lists with the OR bar (“|”).
The Policy View
364 VMTurbo, Inc. www.vmturbo.com
Lock VMs to Datastores
The setting to lock VMs to a storage group specifies whether Operations Manager will respect storage group boundar-ies when moving a VM’s data to another datastore. This setting is only available when you have selected a datastore group. When this is enabled, if a VM’s data is currently on a datastore within the selected storage group, then any move of that data will be to a datastore that is in the same storage group.
Controlling Shared-Nothing Migration
If you have enabled storage moves and VM moves, Operations Manager can perform shared-nothing migrations, which move the VM and the VM’s data simultaneously. For example, assume a VM on a host also uses local storage on that host. In that case, Operations Manager can move that VM and move its data to a different host in a single action.
Shared-nothing migrations are available for any environments that support automation of both VM moves and stor-age moves. In addition, you must have the action modes for VM and storage moves set to Manual or Automated. If you meet these criteria, then all VM moves will take advantage of this feature.
It’s possible that you want to automate storage and VM moves, but you do not want to use shared-nothing migration. The Lock VMs to Datastores option supports this — Two use cases are:
• Ensure data on shared storage does not migrate to local storage
Shared-Nothing migration can result in migrating data from shared storage to local storage. To ensure that your data remains on the shared storage, create a group of the shared datastores in question. Then set the scope of the Policy view to that group, and enable Lock VMs to Datastores.
• Ensure data stays on the host’s local storage
Assume your VM uses local storage on a host, and you want to always keep that data local to the physical machine that hosts the VM.
To ensure data stays local to the VM's host, create a group that contains the local datastores in question. Then set the scope of the Policy view to that group, and enable Lock VMs to Datastores. This ensures that the VM will only move to a host with a datastore in that group, and the VM’s data will be local to the physical machine that hosts the VM.
Action Modes
When Operations Manager uncovers potential bottlenecks, over provisioning, or other issues, it can identify and per-form actions that will prevent those issues from occurring, and keep the environment in the desired state. You can specify action modes that determine how Operations Manager handles the actions it identifies for switches, disk arrays, datastores, hosts, and VMs.
Action Automation Support
Operations Manager doesn’t automate the same actions equally for all technologies. This is because the underlying technologies do not provide the same degree of automation. For example, assume you set the Suspend action to be automated for all VMs. In that case, Operations Manager can automate suspension for VMs managed by vCenter and XenServer, but it cannot automatically suspend VMs managed by Hyper-V. This is because Hyper-V does not provide programmatic access to the Suspend VM operation. In this case, Operations Manager will recommend that you per-form the suspension using the Hyper-V console.
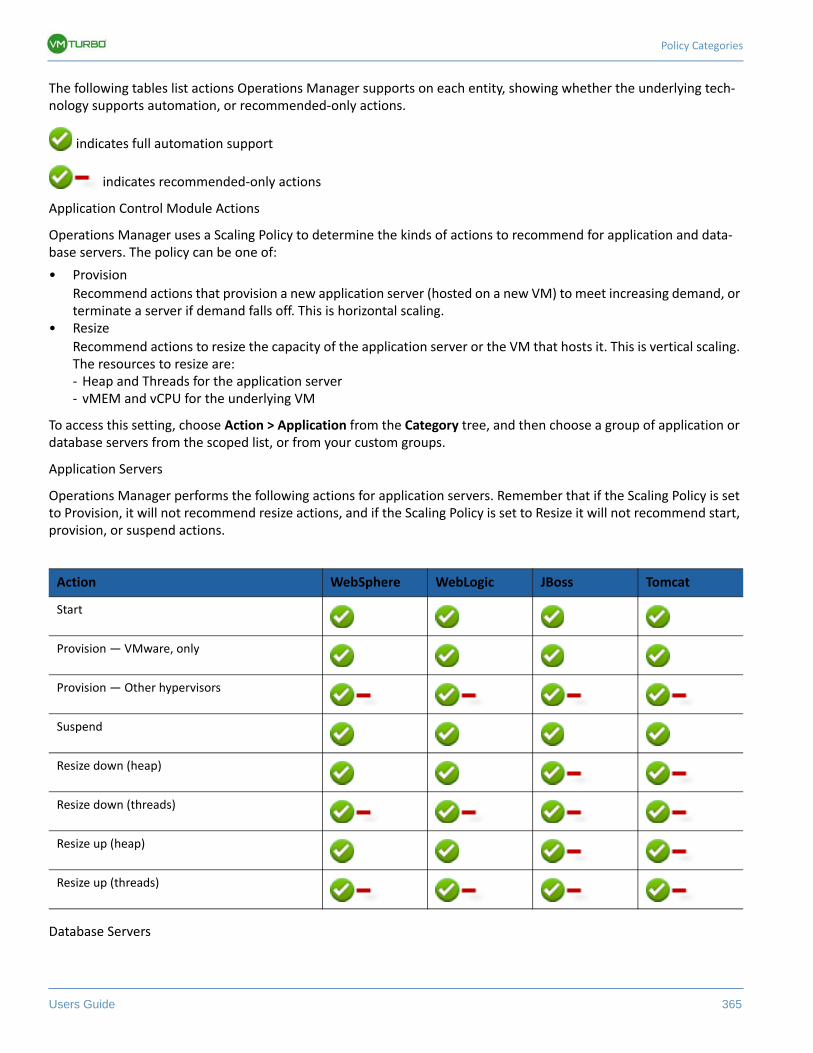
Policy Categories
Users Guide 365
The following tables list actions Operations Manager supports on each entity, showing whether the underlying tech-nology supports automation, or recommended-only actions.
indicates full automation support
indicates recommended-only actions
Application Control Module Actions
Operations Manager uses a Scaling Policy to determine the kinds of actions to recommend for application and data-base servers. The policy can be one of:
• Provision
Recommend actions that provision a new application server (hosted on a new VM) to meet increasing demand, or terminate a server if demand falls off. This is horizontal scaling.
• Resize
Recommend actions to resize the capacity of the application server or the VM that hosts it. This is vertical scaling. The resources to resize are:- Heap and Threads for the application server- vMEM and vCPU for the underlying VM
To access this setting, choose Action > Application from the Category tree, and then choose a group of application or database servers from the scoped list, or from your custom groups.
Application Servers
Operations Manager performs the following actions for application servers. Remember that if the Scaling Policy is set to Provision, it will not recommend resize actions, and if the Scaling Policy is set to Resize it will not recommend start, provision, or suspend actions.
Database Servers
Action WebSphere WebLogic JBoss Tomcat
Start
Provision — VMware, only
Provision — Other hypervisors
Suspend
Resize down (heap)
Resize down (threads)
Resize up (heap)
Resize up (threads)
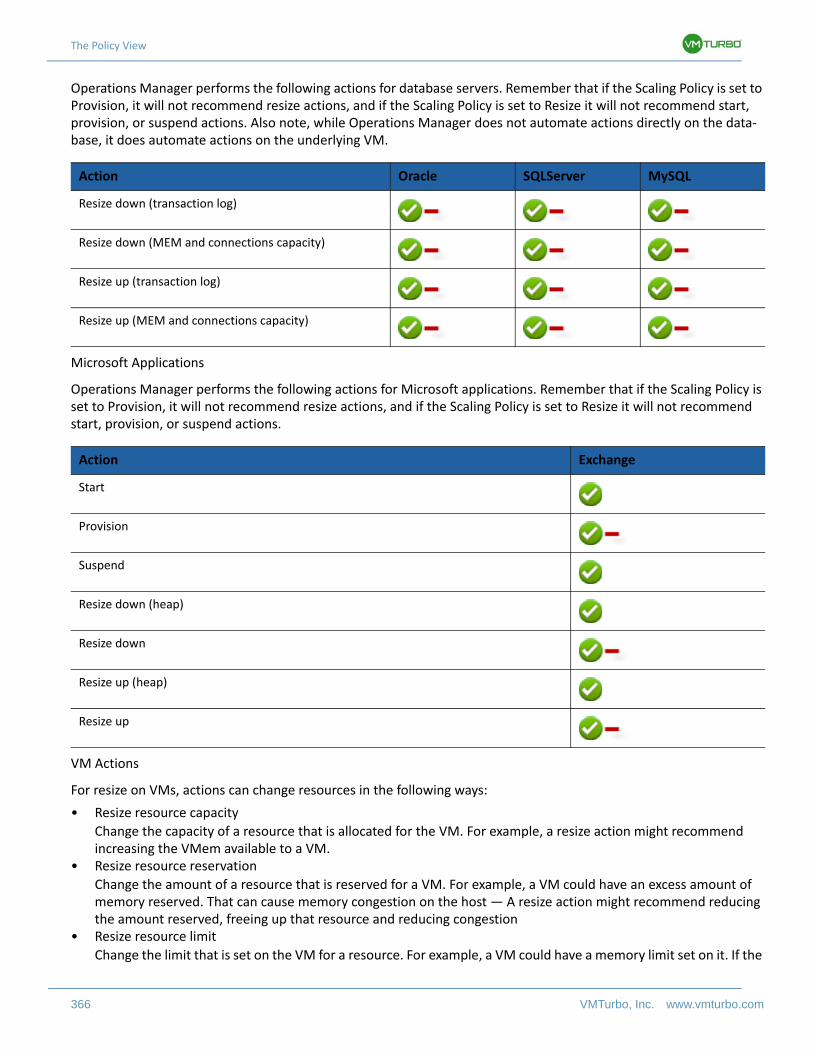
The Policy View
366 VMTurbo, Inc. www.vmturbo.com
Operations Manager performs the following actions for database servers. Remember that if the Scaling Policy is set to Provision, it will not recommend resize actions, and if the Scaling Policy is set to Resize it will not recommend start, provision, or suspend actions. Also note, while Operations Manager does not automate actions directly on the data-base, it does automate actions on the underlying VM.
Microsoft Applications
Operations Manager performs the following actions for Microsoft applications. Remember that if the Scaling Policy is set to Provision, it will not recommend resize actions, and if the Scaling Policy is set to Resize it will not recommend start, provision, or suspend actions.
VM Actions
For resize on VMs, actions can change resources in the following ways:
• Resize resource capacity
Change the capacity of a resource that is allocated for the VM. For example, a resize action might recommend increasing the VMem available to a VM.
• Resize resource reservation
Change the amount of a resource that is reserved for a VM. For example, a VM could have an excess amount of memory reserved. That can cause memory congestion on the host — A resize action might recommend reducing the amount reserved, freeing up that resource and reducing congestion
• Resize resource limit
Change the limit that is set on the VM for a resource. For example, a VM could have a memory limit set on it. If the
Action Oracle SQLServer MySQL
Resize down (transaction log)
Resize down (MEM and connections capacity)
Resize up (transaction log)
Resize up (MEM and connections capacity)
Action Exchange
Start
Provision
Suspend
Resize down (heap)
Resize down
Resize up (heap)
Resize up
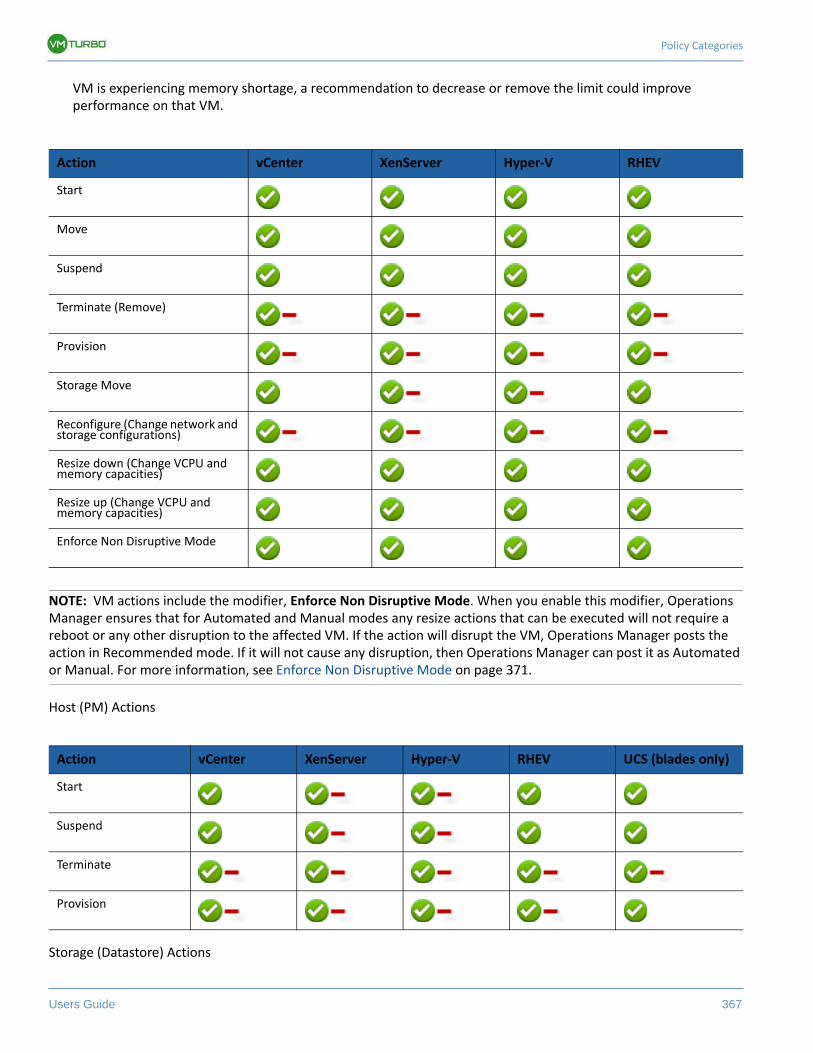
Policy Categories
Users Guide 367
VM is experiencing memory shortage, a recommendation to decrease or remove the limit could improve performance on that VM.
NOTE: VM actions include the modifier, Enforce Non Disruptive Mode. When you enable this modifier, Operations Manager ensures that for Automated and Manual modes any resize actions that can be executed will not require a reboot or any other disruption to the affected VM. If the action will disrupt the VM, Operations Manager posts the action in Recommended mode. If it will not cause any disruption, then Operations Manager can post it as Automated or Manual. For more information, see Enforce Non Disruptive Mode on page 371.
Host (PM) Actions
Storage (Datastore) Actions
Action vCenter XenServer Hyper-V RHEV
Start
Move
Suspend
Terminate (Remove)
Provision
Storage Move
Reconfigure (Change network and storage configurations)
Resize down (Change VCPU and memory capacities)
Resize up (Change VCPU and memory capacities)
Enforce Non Disruptive Mode
Action vCenter XenServer Hyper-V RHEV UCS (blades only)
Start
Suspend
Terminate
Provision
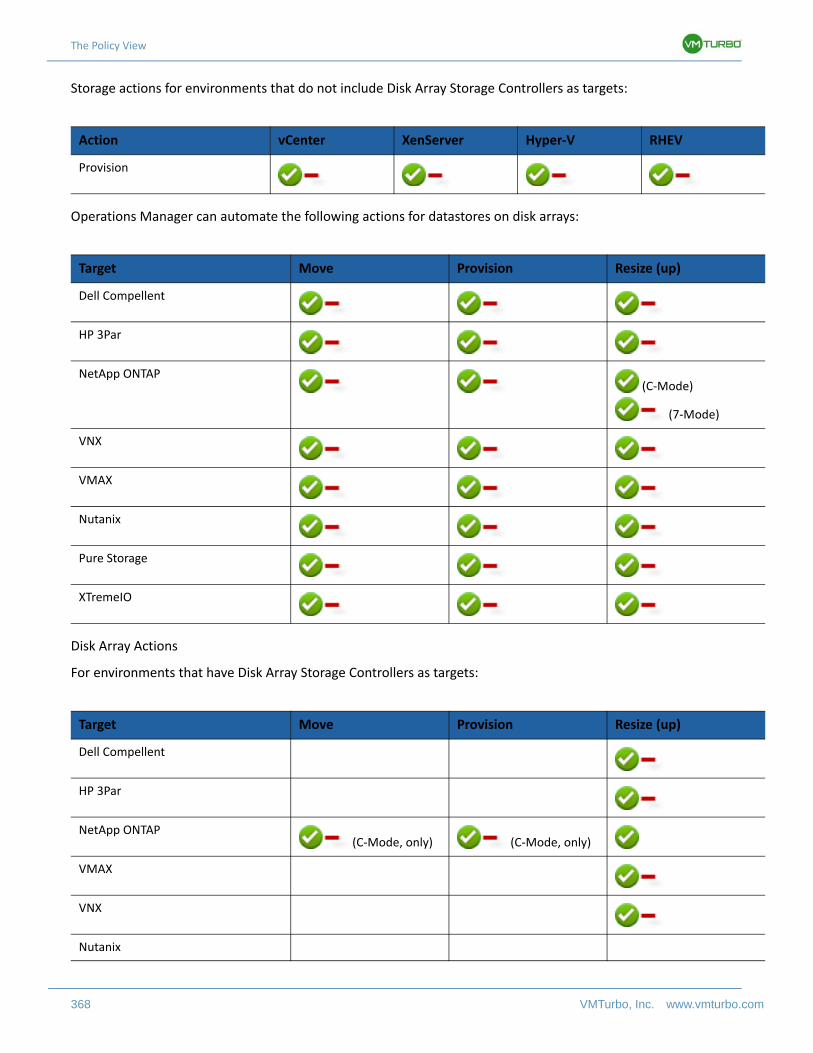
The Policy View
368 VMTurbo, Inc. www.vmturbo.com
Storage actions for environments that do not include Disk Array Storage Controllers as targets:
Operations Manager can automate the following actions for datastores on disk arrays:
Disk Array Actions
For environments that have Disk Array Storage Controllers as targets:
Action vCenter XenServer Hyper-V RHEV
Provision
Target Move Provision Resize (up)
Dell Compellent
HP 3Par
NetApp ONTAP (C-Mode)
(7-Mode)
VNX
VMAX
Nutanix
Pure Storage
XTremeIO
Target Move Provision Resize (up)
Dell Compellent
HP 3Par
NetApp ONTAP (C-Mode, only) (C-Mode, only)
VMAX
VNX
Nutanix
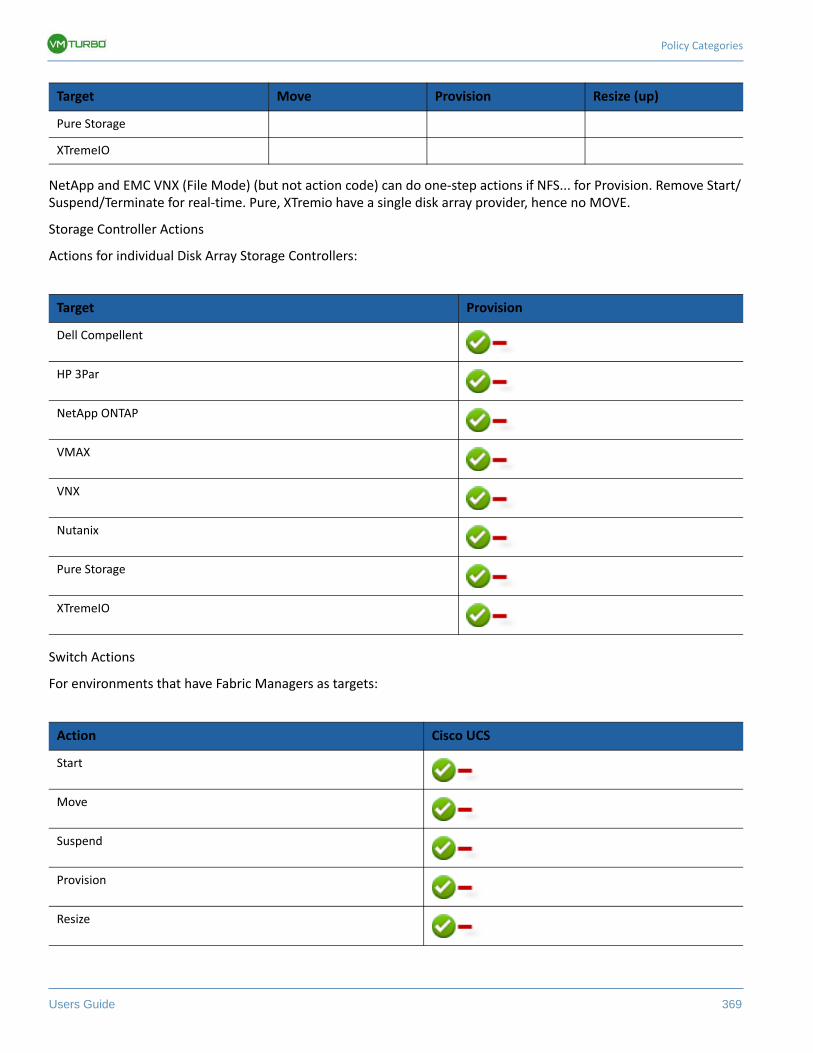
Policy Categories
Users Guide 369
NetApp and EMC VNX (File Mode) (but not action code) can do one-step actions if NFS... for Provision. Remove Start/Suspend/Terminate for real-time. Pure, XTremio have a single disk array provider, hence no MOVE.
Storage Controller Actions
Actions for individual Disk Array Storage Controllers:
Switch Actions
For environments that have Fabric Managers as targets:
Pure Storage
XTremeIO
Target Provision
Dell Compellent
HP 3Par
NetApp ONTAP
VMAX
VNX
Nutanix
Pure Storage
XTremeIO
Action Cisco UCS
Start
Move
Suspend
Provision
Resize
Target Move Provision Resize (up)
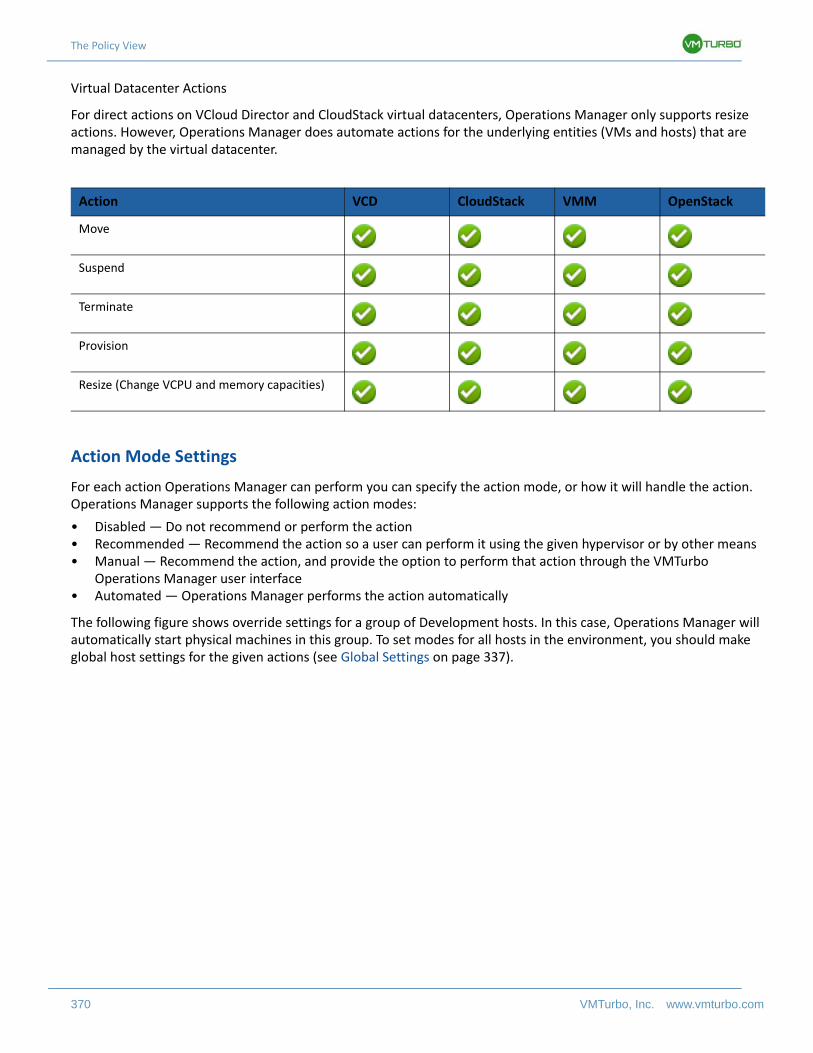
The Policy View
370 VMTurbo, Inc. www.vmturbo.com
Virtual Datacenter Actions
For direct actions on VCloud Director and CloudStack virtual datacenters, Operations Manager only supports resize actions. However, Operations Manager does automate actions for the underlying entities (VMs and hosts) that are managed by the virtual datacenter.
Action Mode Settings
For each action Operations Manager can perform you can specify the action mode, or how it will handle the action. Operations Manager supports the following action modes:
• Disabled — Do not recommend or perform the action• Recommended — Recommend the action so a user can perform it using the given hypervisor or by other means• Manual — Recommend the action, and provide the option to perform that action through the VMTurbo
Operations Manager user interface• Automated — Operations Manager performs the action automatically
The following figure shows override settings for a group of Development hosts. In this case, Operations Manager will automatically start physical machines in this group. To set modes for all hosts in the environment, you should make global host settings for the given actions (see Global Settings on page 337).
Action VCD CloudStack VMM OpenStack
Move
Suspend
Terminate
Provision
Resize (Change VCPU and memory capacities)
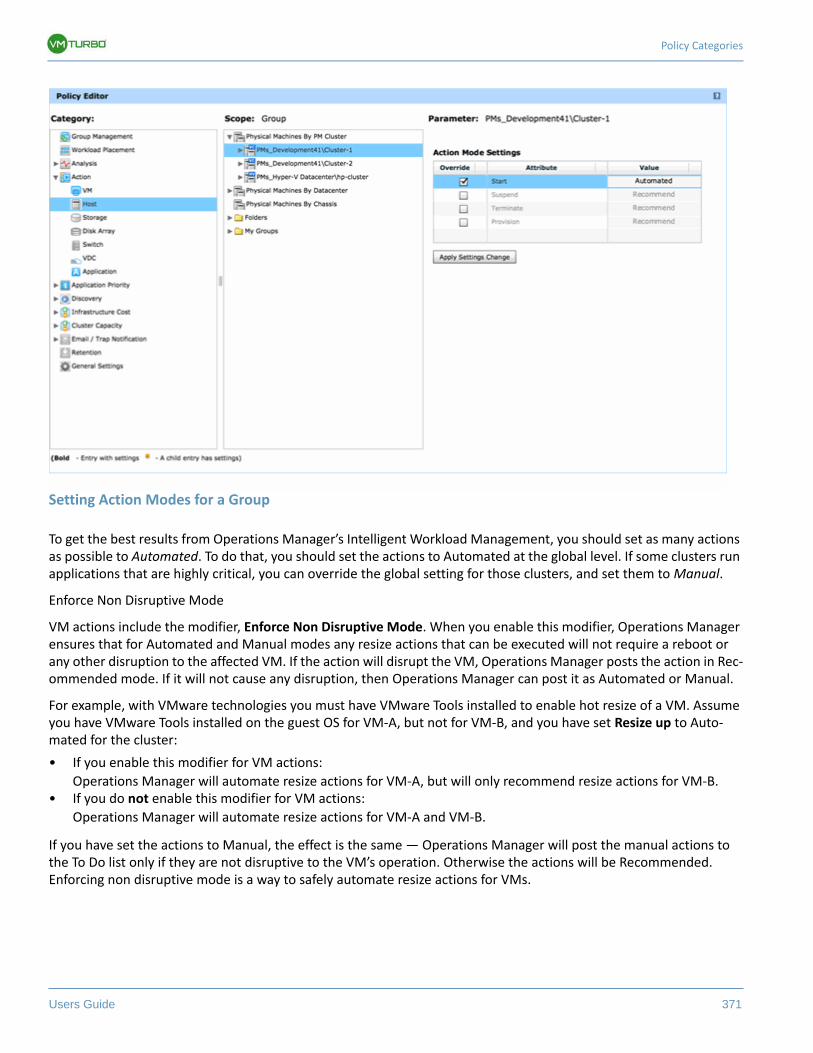
Policy Categories
Users Guide 371
Setting Action Modes for a Group
To get the best results from Operations Manager’s Intelligent Workload Management, you should set as many actions as possible to Automated. To do that, you should set the actions to Automated at the global level. If some clusters run applications that are highly critical, you can override the global setting for those clusters, and set them to Manual.
Enforce Non Disruptive Mode
VM actions include the modifier, Enforce Non Disruptive Mode. When you enable this modifier, Operations Manager ensures that for Automated and Manual modes any resize actions that can be executed will not require a reboot or any other disruption to the affected VM. If the action will disrupt the VM, Operations Manager posts the action in Rec-ommended mode. If it will not cause any disruption, then Operations Manager can post it as Automated or Manual.
For example, with VMware technologies you must have VMware Tools installed to enable hot resize of a VM. Assume you have VMware Tools installed on the guest OS for VM-A, but not for VM-B, and you have set Resize up to Auto-mated for the cluster:
• If you enable this modifier for VM actions:
Operations Manager will automate resize actions for VM-A, but will only recommend resize actions for VM-B.• If you do not enable this modifier for VM actions:
Operations Manager will automate resize actions for VM-A and VM-B.
If you have set the actions to Manual, the effect is the same — Operations Manager will post the manual actions to the To Do list only if they are not disruptive to the VM’s operation. Otherwise the actions will be Recommended. Enforcing non disruptive mode is a way to safely automate resize actions for VMs.
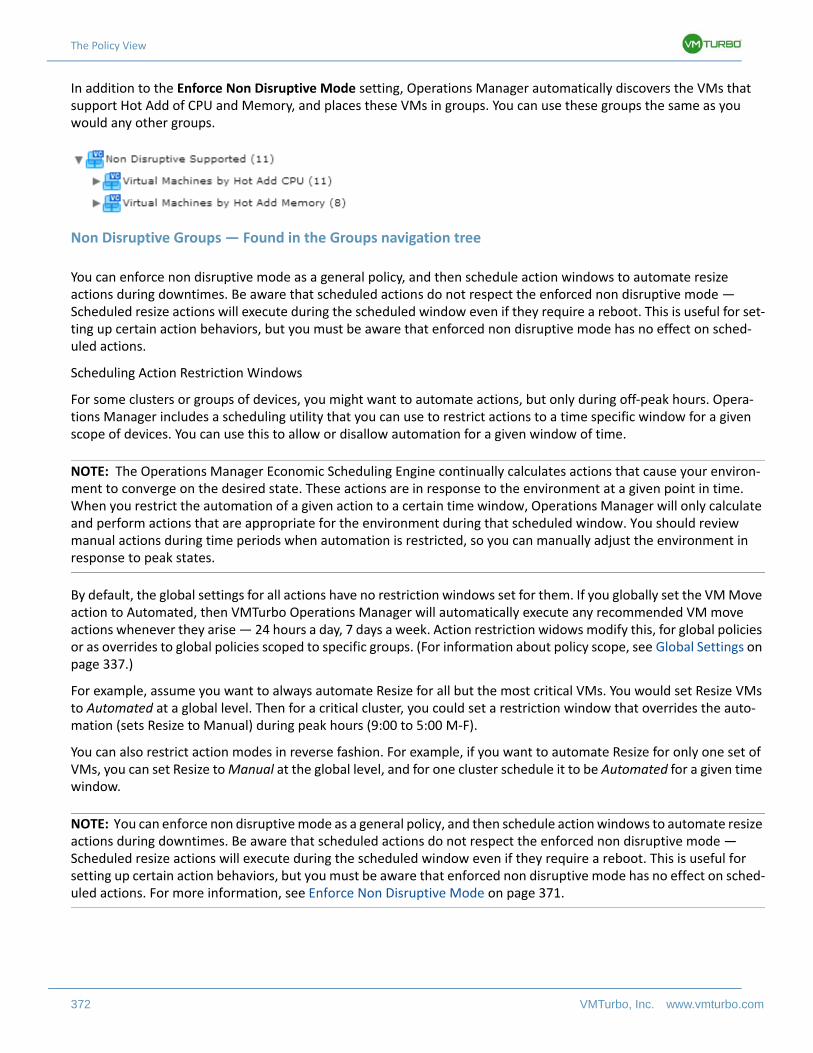
The Policy View
372 VMTurbo, Inc. www.vmturbo.com
In addition to the Enforce Non Disruptive Mode setting, Operations Manager automatically discovers the VMs that support Hot Add of CPU and Memory, and places these VMs in groups. You can use these groups the same as you would any other groups.
Non Disruptive Groups — Found in the Groups navigation tree
You can enforce non disruptive mode as a general policy, and then schedule action windows to automate resize actions during downtimes. Be aware that scheduled actions do not respect the enforced non disruptive mode — Scheduled resize actions will execute during the scheduled window even if they require a reboot. This is useful for set-ting up certain action behaviors, but you must be aware that enforced non disruptive mode has no effect on sched-uled actions.
Scheduling Action Restriction Windows
For some clusters or groups of devices, you might want to automate actions, but only during off-peak hours. Opera-tions Manager includes a scheduling utility that you can use to restrict actions to a time specific window for a given scope of devices. You can use this to allow or disallow automation for a given window of time.
NOTE: The Operations Manager Economic Scheduling Engine continually calculates actions that cause your environ-ment to converge on the desired state. These actions are in response to the environment at a given point in time. When you restrict the automation of a given action to a certain time window, Operations Manager will only calculate and perform actions that are appropriate for the environment during that scheduled window. You should review manual actions during time periods when automation is restricted, so you can manually adjust the environment in response to peak states.
By default, the global settings for all actions have no restriction windows set for them. If you globally set the VM Move action to Automated, then VMTurbo Operations Manager will automatically execute any recommended VM move actions whenever they arise — 24 hours a day, 7 days a week. Action restriction widows modify this, for global policies or as overrides to global policies scoped to specific groups. (For information about policy scope, see Global Settings on page 337.)
For example, assume you want to always automate Resize for all but the most critical VMs. You would set Resize VMs to Automated at a global level. Then for a critical cluster, you could set a restriction window that overrides the auto-mation (sets Resize to Manual) during peak hours (9:00 to 5:00 M-F).
You can also restrict action modes in reverse fashion. For example, if you want to automate Resize for only one set of VMs, you can set Resize to Manual at the global level, and for one cluster schedule it to be Automated for a given time window.
NOTE: You can enforce non disruptive mode as a general policy, and then schedule action windows to automate resize actions during downtimes. Be aware that scheduled actions do not respect the enforced non disruptive mode — Scheduled resize actions will execute during the scheduled window even if they require a reboot. This is useful for setting up certain action behaviors, but you must be aware that enforced non disruptive mode has no effect on sched-uled actions. For more information, see Enforce Non Disruptive Mode on page 371.
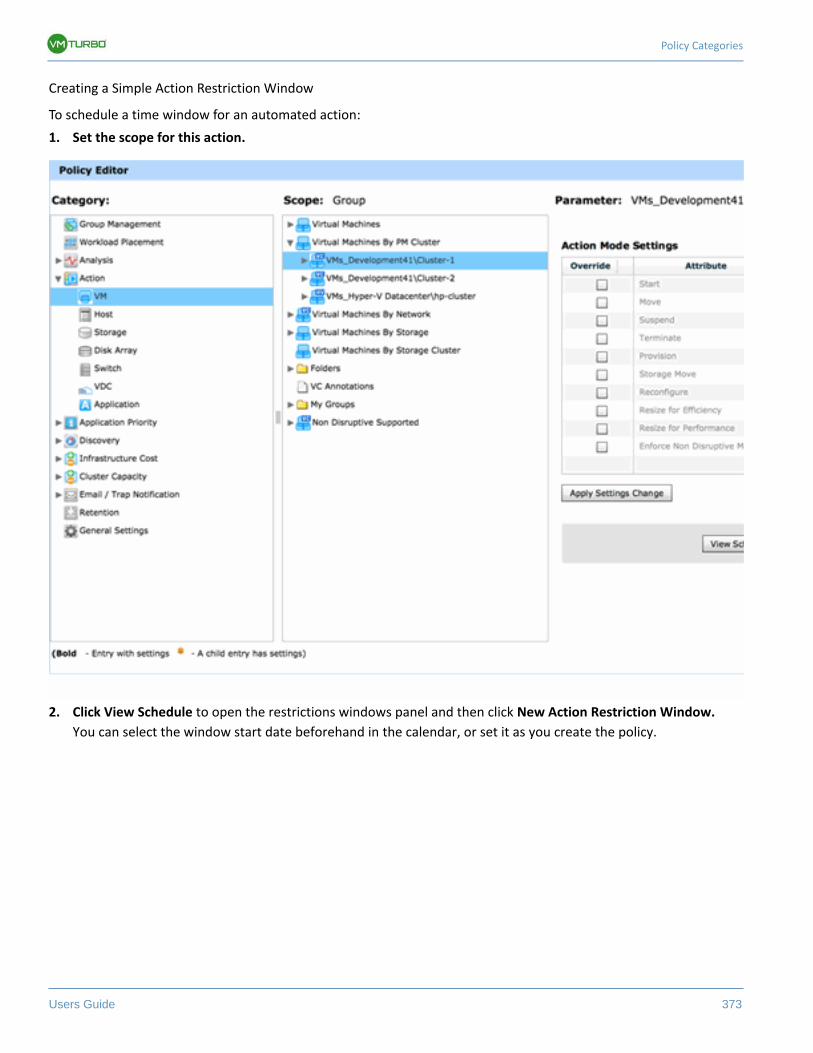
Policy Categories
Users Guide 373
Creating a Simple Action Restriction Window
To schedule a time window for an automated action:
1. Set the scope for this action.
2. Click View Schedule to open the restrictions windows panel and then click New Action Restriction Window.
You can select the window start date beforehand in the calendar, or set it as you create the policy.
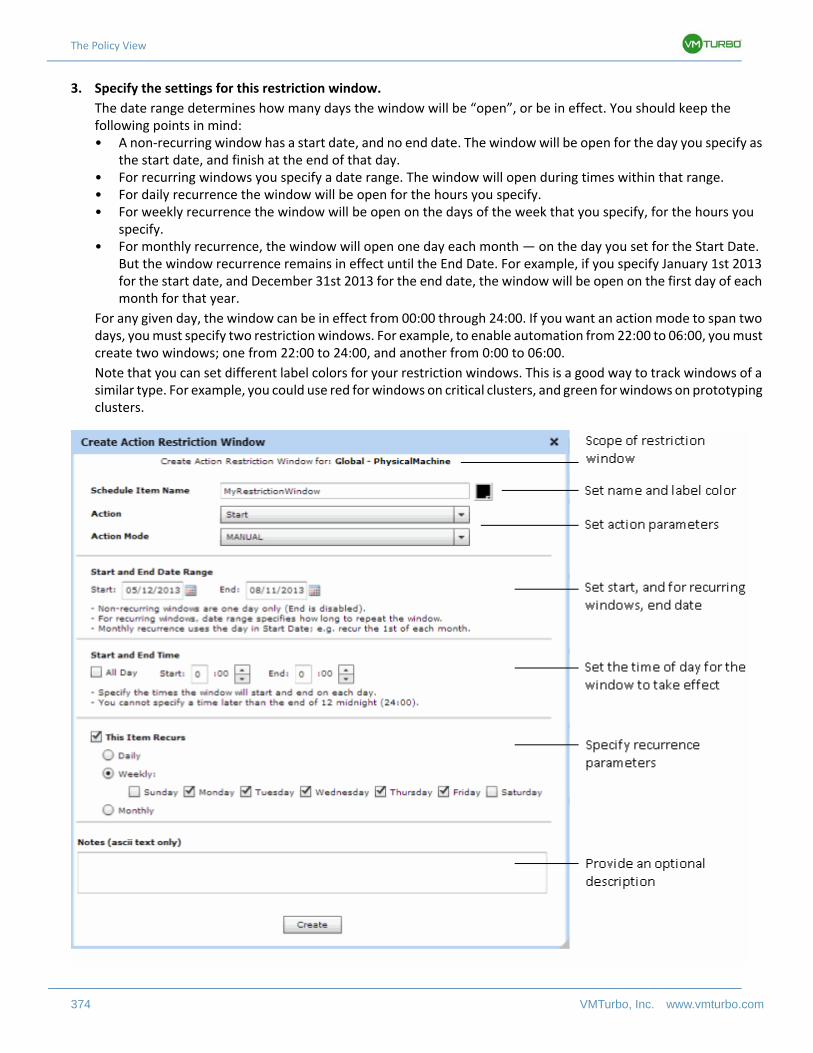
The Policy View
374 VMTurbo, Inc. www.vmturbo.com
3. Specify the settings for this restriction window.
The date range determines how many days the window will be “open”, or be in effect. You should keep the following points in mind:• A non-recurring window has a start date, and no end date. The window will be open for the day you specify as
the start date, and finish at the end of that day.• For recurring windows you specify a date range. The window will open during times within that range.• For daily recurrence the window will be open for the hours you specify.• For weekly recurrence the window will be open on the days of the week that you specify, for the hours you
specify.• For monthly recurrence, the window will open one day each month — on the day you set for the Start Date.
But the window recurrence remains in effect until the End Date. For example, if you specify January 1st 2013 for the start date, and December 31st 2013 for the end date, the window will be open on the first day of each month for that year.
For any given day, the window can be in effect from 00:00 through 24:00. If you want an action mode to span two days, you must specify two restriction windows. For example, to enable automation from 22:00 to 06:00, you must create two windows; one from 22:00 to 24:00, and another from 0:00 to 06:00.
Note that you can set different label colors for your restriction windows. This is a good way to track windows of a similar type. For example, you could use red for windows on critical clusters, and green for windows on prototyping clusters.
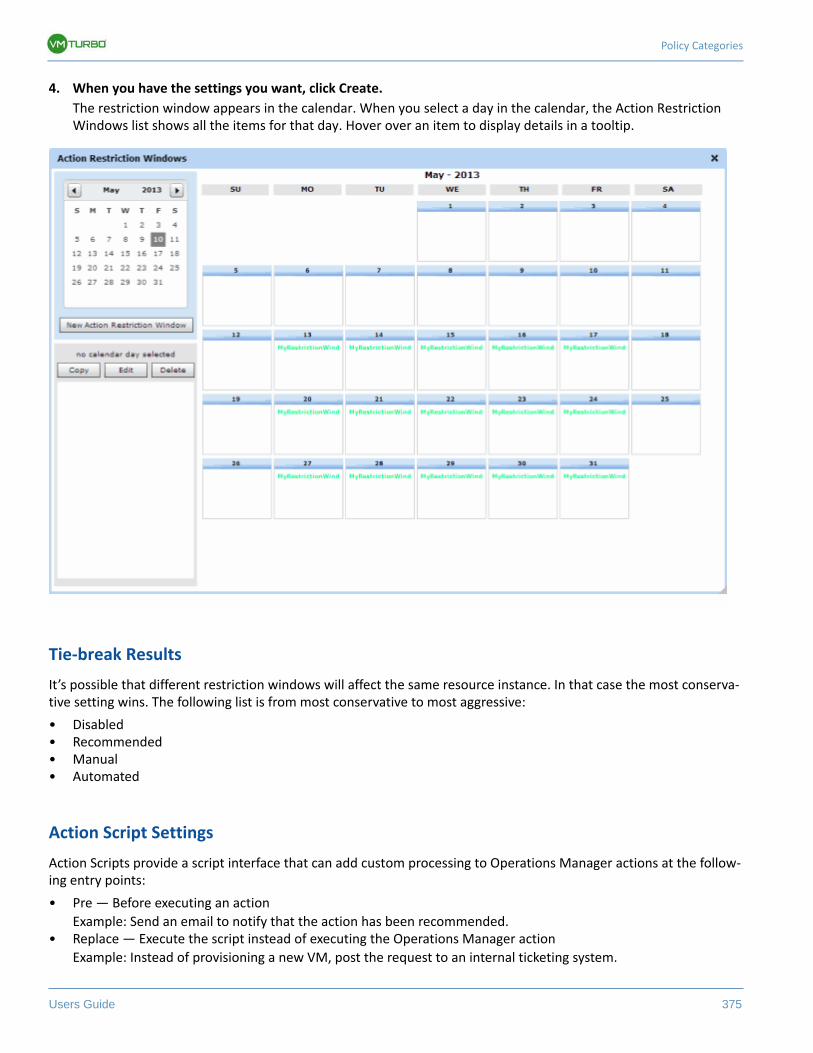
Policy Categories
Users Guide 375
4. When you have the settings you want, click Create.
The restriction window appears in the calendar. When you select a day in the calendar, the Action Restriction Windows list shows all the items for that day. Hover over an item to display details in a tooltip.
Tie-break Results
It’s possible that different restriction windows will affect the same resource instance. In that case the most conserva-tive setting wins. The following list is from most conservative to most aggressive:
• Disabled• Recommended• Manual• Automated
Action Script Settings
Action Scripts provide a script interface that can add custom processing to Operations Manager actions at the follow-ing entry points:
• Pre — Before executing an action
Example: Send an email to notify that the action has been recommended.• Replace — Execute the script instead of executing the Operations Manager action
Example: Instead of provisioning a new VM, post the request to an internal ticketing system.
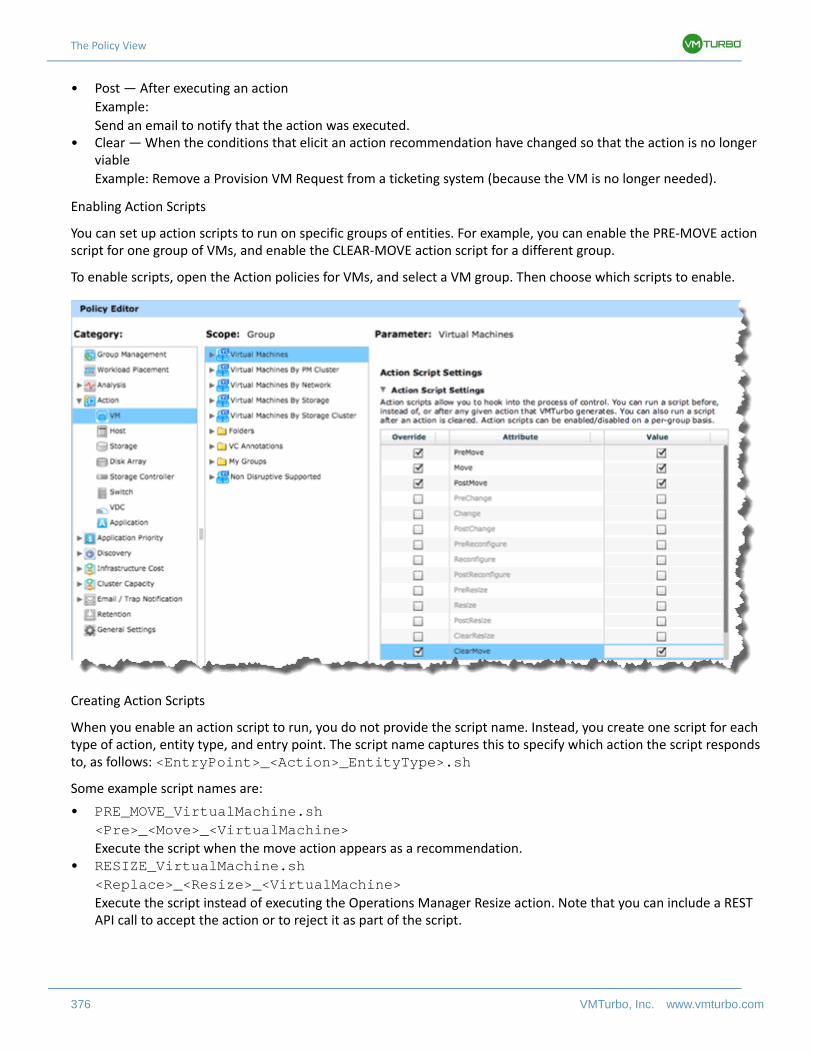
The Policy View
376 VMTurbo, Inc. www.vmturbo.com
• Post — After executing an action
Example:
Send an email to notify that the action was executed.• Clear — When the conditions that elicit an action recommendation have changed so that the action is no longer
viable
Example: Remove a Provision VM Request from a ticketing system (because the VM is no longer needed).
Enabling Action Scripts
You can set up action scripts to run on specific groups of entities. For example, you can enable the PRE-MOVE action script for one group of VMs, and enable the CLEAR-MOVE action script for a different group.
To enable scripts, open the Action policies for VMs, and select a VM group. Then choose which scripts to enable.
Creating Action Scripts
When you enable an action script to run, you do not provide the script name. Instead, you create one script for each type of action, entity type, and entry point. The script name captures this to specify which action the script responds to, as follows: <EntryPoint>_<Action>_EntityType>.sh
Some example script names are:
• PRE_MOVE_VirtualMachine.sh<Pre>_<Move>_<VirtualMachine>Execute the script when the move action appears as a recommendation.
• RESIZE_VirtualMachine.sh<Replace>_<Resize>_<VirtualMachine>Execute the script instead of executing the Operations Manager Resize action. Note that you can include a REST API call to accept the action or to reject it as part of the script.
Policy Categories
Users Guide 377
• POST_RECONFIGURE_VirtualMachine.sh<Post>_<Reconfigure>_<VirtualMachine>Execute the script after a Reconfigure action. Note that a POST script executes after an action has succeeded or failed.
• CLEAR_MOVE_VirtualMachine.sh<Clear>_<Move>_<VirtualMachine>Execute the script after a Move action has cleared.
The supported entry points and actions are:
To pass information into the script, Operations Manager sets values to environment variables. You can reference these environment variables in your scripts. For example, assume you want to send an email that includes the name of the VM that is an action target. You can get that name via the VMT_TARGET_NAME environment variable.
Operations Manager sets the following environment variables for an action:
• VMT_TARGET_INTERNAL
The internal name of the VM this action will affect.• VMT_TARGET_NAME
The VM’s display name.• VMT_CURRENT_INTERNAL
The internal name for the current configuration or placement.• VMT_CURRENT_NAME
The display name for the current configuration or placement.• VMT_NEW_INTERNAL
The internal name for the new configuration or placement.• VMT_NEW_NAME
The display name for the new configuration or placement.• VMT_ACTION_INTERNAL
The UUID for the proposed action. You can use this to access the action via the REST API.• VMT_ACTION_NAME
The name of the action.
Application Priority
Application priority determines the conditions under which Operations Manager recommends suspending or termi-nating a VM. Suspending a VM means powering it down, but leaving it in the in the hypervisor’s list of managed VMs. Terminating a VM means removing it from the hypervisor. When Operations Manager recommends that you termi-nate a VM, this indicates that the VM is dormant, and no applications are running on it.
Entry Point Action
• Pre• Replace (do not specify an entry point in the filename)• Post• Clear
• Move• Change• Reconfigure• Resize
The Policy View
378 VMTurbo, Inc. www.vmturbo.com
NOTE: Your environment may include some VMs that you never want to terminate. You might think that you can set all applications to Mission Critical as a way to direct that Operations Manager never recommends termination. In fact, Operations Manager can recommend that you terminate a dormant VM that has Mission Critical applications on it. To ensure VMs never terminate, disable the Terminate action for all VMs or for a group of VMs. For more information, see Action Modes on page 364.
Operations Manager monitors resource consumption, and works to keep Mission Critical applications running. If a Mission Critical application needs resources and none are immediately available, Operations Manager may recom-mend suspending non-critical VMs to free up resources, which makes them available to the critical application.
By default, all applications are Mission Critical (see the Global Setting for Application Priority). You can specify the priority for applications to be:
• Mission Critical
The focus of Operations Manager is to keep these applications running. For example, it will never suggest suspending the VM that hosts a mission critical application.
• Normal
Operations Manager may suggest suspending a VM that hosts normal applications to free up resources that a mission critical application might need.
• Low
Operations Manager does not consider the needs of low priority applications when calculating the desired state for your environment.
You specify application priority for groups. The most important groups for application priority are:
• Applications
Each group is named for a discovered application, and contains all the instances of that named application.• Physical Machines
For each physical machines, all the applications running on that machine.
If a VM has any Mission Critical applications on it, Operations Manager will always try to find resources for that VM, and will never recommend suspending it in order to free up resources. Operations Manager can recommend termi-nating a VM with Mission Critical applications, if the VM is truly dormant.
For a VM with all Normal applications, if the VM uses resources that are needed elsewhere, then Operations Manager may recommend suspending this VM. For a VM with Low-priority applications, it can recommend terminating the VM to free up resources.
NOTE: Operations Manager defines a Guest Load application for each VM. The Guest Load represents all consumption that Operations Manager cannot assign to a specific application. This includes processes for the VM’s operating system. Operations Manager ignores Guest Load priority when deciding how to free up resources. However, if a VM has only the Guest Load application on it, and that application is set to Low Priority, then Operations Manager may recommend terminating that VM.
The following figure shows override settings for the applications hosted by a specific physical machine. To set priority for all applications in the environment, you should make global settings for Application Priority (see Global Settings on page 337).
Policy Categories
Users Guide 379
Setting Priority for the Applications on a Specific Host
Tie-break Results
When the same resource instance has conflicting settings, the most conservative setting wins. The following list is from most conservative to most aggressive:
• Mission Critical• Normal• Low
Discovery Policies
Operations Manager sweeps through your environment to discover the inventory items (applications, VMs, hosts, data stores, etc.) in your environment. It performs initial discovery when you first start it and add target hypervisors, and events that can change the inventory trigger subsequent discovery. You can set policies to direct:
• Application Discovery on page 379 - Application Signatures (how Operations Manager recognizes application processes), and credentials to access the VMs that host the applications
• Load Balancer Discovery on page 383 - Mapping application signatures to virtual applications• vCenter Annotation Grouping on page 385 - vCenter tags Operations Manager can use for grouping
Application Discovery
Operations Manager discovers applications via WMI (for applications on Windows VMs) and SNMP (for applications on other VMs). To keep the list of discovered applications current, Operations Manager polls the environment every 20 minutes.
NOTE: For SNMP monitoring, Operations Manager receives trap messages via port 162.
For Operations Manager to perform application discovery, it requires:
• The appropriate agent running on the given VM- For VMs running Windows, the VM must have a WMI agent running on it- For SNMP discovery, VMs must run Linux, and the VM must have a running SNMP agent
• VM Access Credentials on page 381 for the given protocol (WMI, or SNMP)
The Policy View
380 VMTurbo, Inc. www.vmturbo.com
• Application Signatures on page 380 to identify the applications you want to discover and manage
Application signatures identify running processes that belong to a specific application. Operations Manager ships with a default set of application signatures — you can add others to the list.
Default Application Discovery
By default, Operations Manager discovers the following applications:
Application Signatures
An application signature is a search string that matches process names. A single application may launch a number of processes to perform its job. Rather than tracking each process as a separate application, Operations Manager can group these processes and monitor the group as a single application.
Each process will have a unique name, but the process name typically includes part of the name of the main applica-tion, or some other text that identifies it as part of the overall application. This name that’s shared in all the process names is the application signature.
Note that the same application signature is valid for all the protocols application discovery supports. When you make the list of signatures, you do not need to identify what protocol will be used to monitor them. As Operations Manager scans a VM for application processes, it uses the full list of signatures, no matter what the operating system is for that VM.
To specify an application signature:
1. Select Application Discovery to display the editor.
2. Create a new application signature.
3. Provide an application name.
Application names should be unique. If you provide a name that is identical to a default application name (as described in Default Application Discovery on page 380), then Operations Manager will use your custom applica-tion signature when grouping application processes.
4. Enter regular expressions to identify the characters that must be in an application process name.
You can also specify characters that must not be in the process name. Any process name that satisfies the applica-tion signature identifies a member of the given application.
For example, assume the following strings: - Match: s.* - No-match: sq.*In this case, the signature would match all process names that begin with 's', except those that begin with 'sq'.
Application Name Description
MSSQL Microsoft SQL Server
IIS Microsoft Internet Information Services
LSASS Microsoft Active Directory services
XenDesktop Citrix XenDesktop
VMView VMware View
SharePoint Microsoft Sharepoint Server
Guest Load The resources that Operations Manager has not assigned to any specific application (for more information, see Guest Load on page 130)
Policy Categories
Users Guide 381
Creating Application Signatures
VM Access Credentials
To discover and monitor applications, Operations Manager uses WMI on VMs running Windows, and SNMP on other VMs. You must provide valid credentials for any of the VMs that host applications you want to monitor.
NOTE: For WMI application discovery and management, the given target hypervisor requires specific permissions that allow WMI access. For more information, see the Green Circle article, Application Discovery Setup .
You select VM groups and set specific credentials for those VMs. You can select a top-level group to provide one set of credentials for all the VMs in the inventory, and then select lower-level groups to override the more general settings (for more about settings overrides, see Policy Scope on page 337).
Note that you set credentials for groups of VMs, not for individual VMs. When discovering applications on the VMs in a group, Operations Manager assumes all those VMs honor the same credentials. If the VMs in default groupings don’t all honor the same credentials, you can create custom groups to keep the same credentials together. For infor-mation about creating custom groups, see Group Management on page 342.
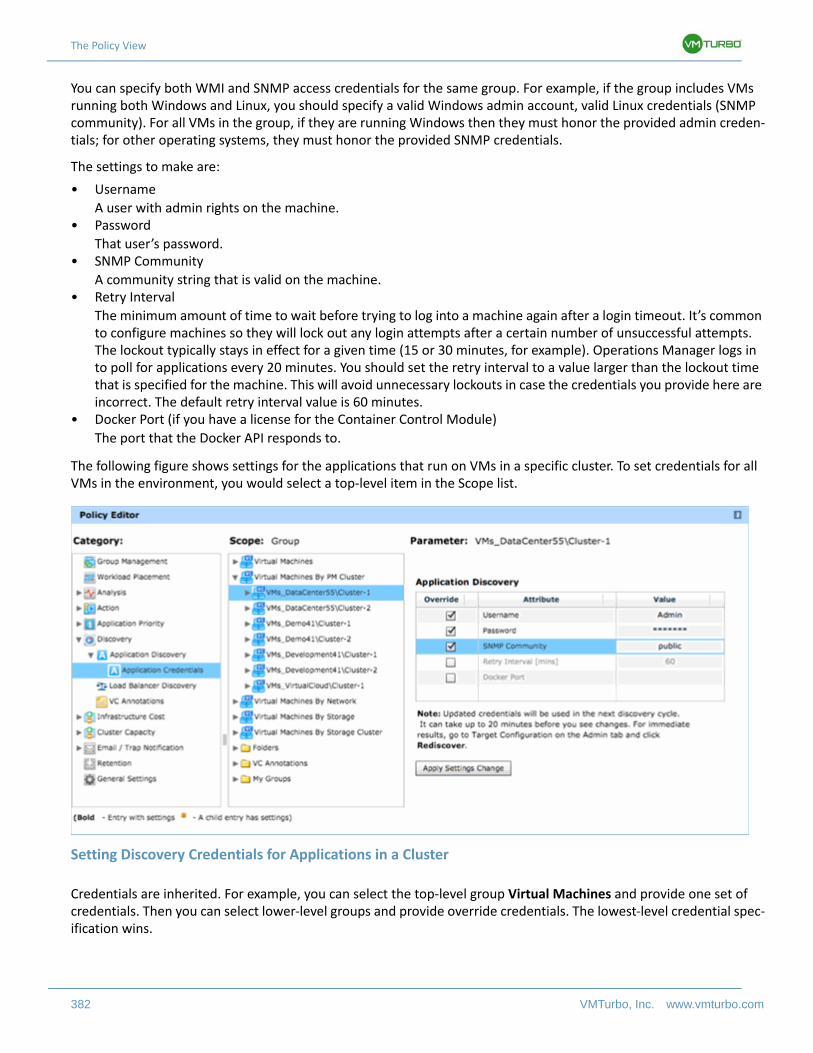
The Policy View
382 VMTurbo, Inc. www.vmturbo.com
You can specify both WMI and SNMP access credentials for the same group. For example, if the group includes VMs running both Windows and Linux, you should specify a valid Windows admin account, valid Linux credentials (SNMP community). For all VMs in the group, if they are running Windows then they must honor the provided admin creden-tials; for other operating systems, they must honor the provided SNMP credentials.
The settings to make are:
• Username
A user with admin rights on the machine.• Password
That user’s password.• SNMP Community
A community string that is valid on the machine.• Retry Interval
The minimum amount of time to wait before trying to log into a machine again after a login timeout. It’s common to configure machines so they will lock out any login attempts after a certain number of unsuccessful attempts. The lockout typically stays in effect for a given time (15 or 30 minutes, for example). Operations Manager logs in to poll for applications every 20 minutes. You should set the retry interval to a value larger than the lockout time that is specified for the machine. This will avoid unnecessary lockouts in case the credentials you provide here are incorrect. The default retry interval value is 60 minutes.
• Docker Port (if you have a license for the Container Control Module)
The port that the Docker API responds to.
The following figure shows settings for the applications that run on VMs in a specific cluster. To set credentials for all VMs in the environment, you would select a top-level item in the Scope list.
Setting Discovery Credentials for Applications in a Cluster
Credentials are inherited. For example, you can select the top-level group Virtual Machines and provide one set of credentials. Then you can select lower-level groups and provide override credentials. The lowest-level credential spec-ification wins.
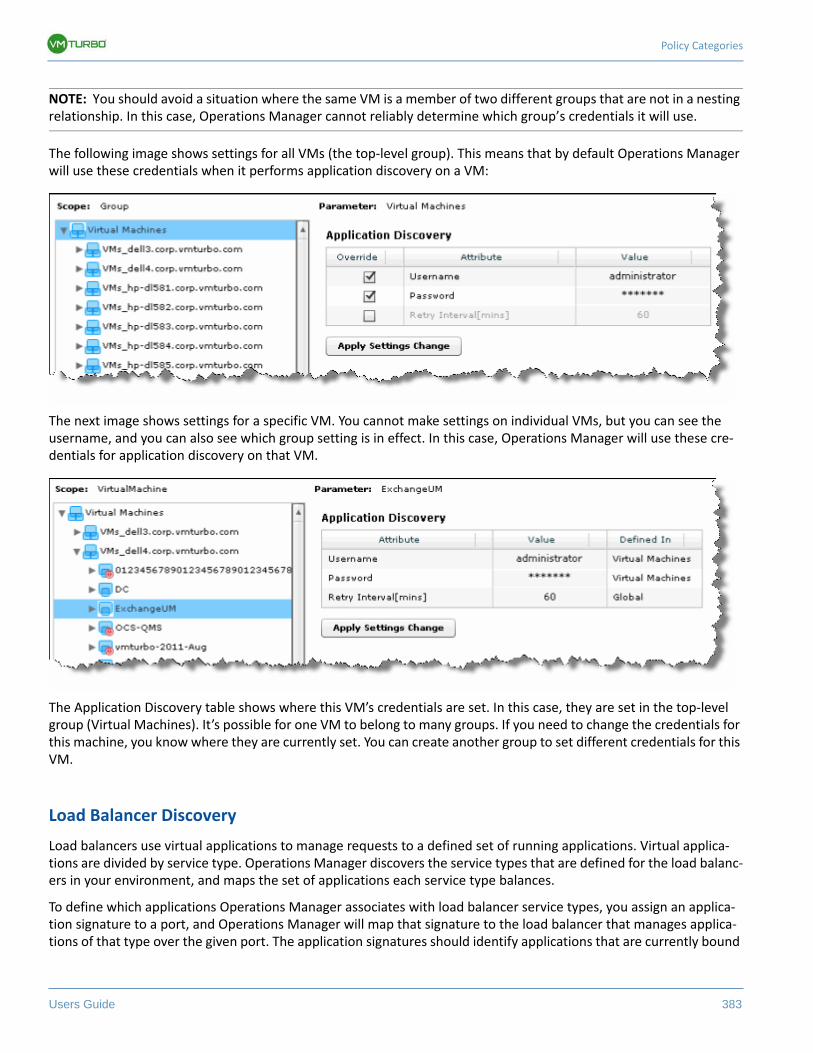
Policy Categories
Users Guide 383
NOTE: You should avoid a situation where the same VM is a member of two different groups that are not in a nesting relationship. In this case, Operations Manager cannot reliably determine which group’s credentials it will use.
The following image shows settings for all VMs (the top-level group). This means that by default Operations Manager will use these credentials when it performs application discovery on a VM:
The next image shows settings for a specific VM. You cannot make settings on individual VMs, but you can see the username, and you can also see which group setting is in effect. In this case, Operations Manager will use these cre-dentials for application discovery on that VM.
The Application Discovery table shows where this VM’s credentials are set. In this case, they are set in the top-level group (Virtual Machines). It’s possible for one VM to belong to many groups. If you need to change the credentials for this machine, you know where they are currently set. You can create another group to set different credentials for this VM.
Load Balancer Discovery
Load balancers use virtual applications to manage requests to a defined set of running applications. Virtual applica-tions are divided by service type. Operations Manager discovers the service types that are defined for the load balanc-ers in your environment, and maps the set of applications each service type balances.
To define which applications Operations Manager associates with load balancer service types, you assign an applica-tion signature to a port, and Operations Manager will map that signature to the load balancer that manages applica-tions of that type over the given port. The application signatures should identify applications that are currently bound
The Policy View
384 VMTurbo, Inc. www.vmturbo.com
to specific load balancers. (Application binding to load balancers is part of the load balancer configuration.) This pro-vides a general mechanism to map applications to load balancers — you only need to know the appropriate applica-tion signature, and the port number.
NOTE: If you have enabled the Hybrid Cloud Control Module, and you have specified an AWS target that includes Elastic Load Balancing, then Operations Manager can discover that load balancer and recommend balancing across the cloud for workload bursts.
To assign signatures to a load balancer, you must first have defined appropriate signatures for the specific applications running in your environment. For information about defining application signatures, see Application Discovery on page 379. When you have the appropriate application signatures, assign them to load balancer ports as follows:
1. Choose Discovery > Load Balancer in the Category list.
A list of discovered load balancer ports appears. These are on the load balancers you set up as targets in the Admin view (see Adding Load Balancers as Targets on page 306).
2. Assign application signatures to a load balancer ports.
Assign already defined signatures to the each port. Operations Manager will resolve these signatures to the appro-priate load balancer.
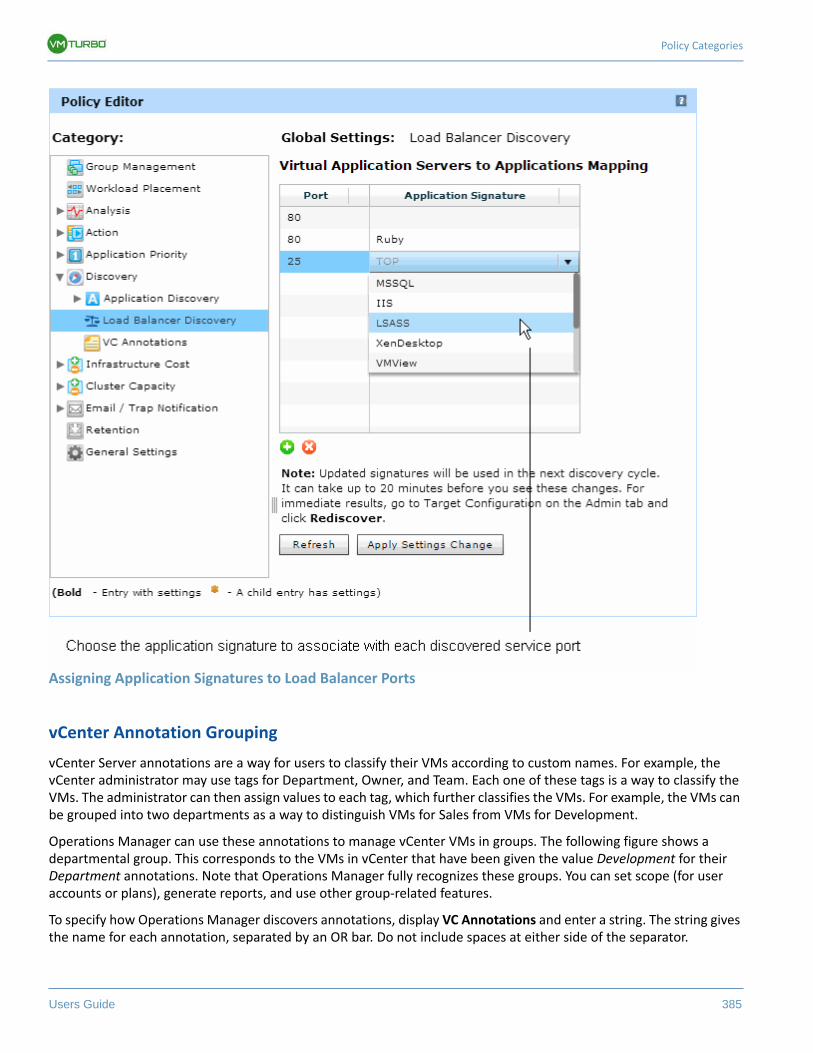
Policy Categories
Users Guide 385
Assigning Application Signatures to Load Balancer Ports
vCenter Annotation Grouping
vCenter Server annotations are a way for users to classify their VMs according to custom names. For example, the vCenter administrator may use tags for Department, Owner, and Team. Each one of these tags is a way to classify the VMs. The administrator can then assign values to each tag, which further classifies the VMs. For example, the VMs can be grouped into two departments as a way to distinguish VMs for Sales from VMs for Development.
Operations Manager can use these annotations to manage vCenter VMs in groups. The following figure shows a departmental group. This corresponds to the VMs in vCenter that have been given the value Development for their Department annotations. Note that Operations Manager fully recognizes these groups. You can set scope (for user accounts or plans), generate reports, and use other group-related features.
To specify how Operations Manager discovers annotations, display VC Annotations and enter a string. The string gives the name for each annotation, separated by an OR bar. Do not include spaces at either side of the separator.
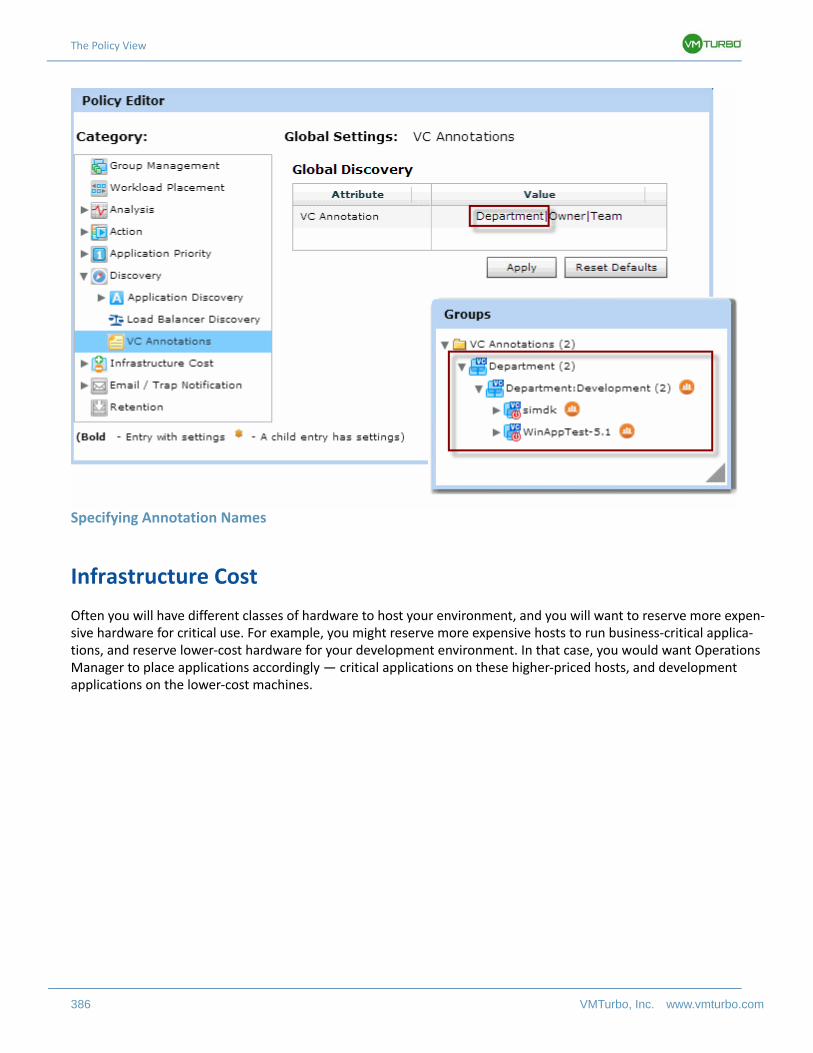
The Policy View
386 VMTurbo, Inc. www.vmturbo.com
Specifying Annotation Names
Infrastructure Cost
Often you will have different classes of hardware to host your environment, and you will want to reserve more expen-sive hardware for critical use. For example, you might reserve more expensive hosts to run business-critical applica-tions, and reserve lower-cost hardware for your development environment. In that case, you would want Operations Manager to place applications accordingly — critical applications on these higher-priced hosts, and development applications on the lower-cost machines.
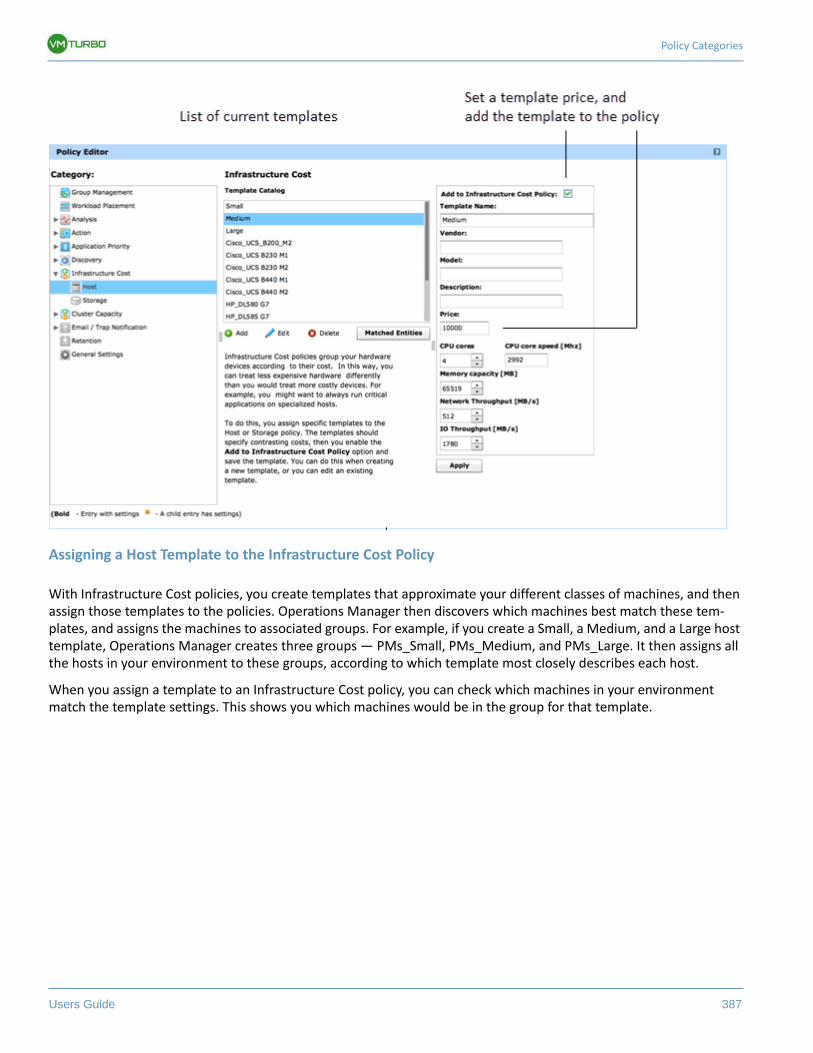
Policy Categories
Users Guide 387
Assigning a Host Template to the Infrastructure Cost Policy
With Infrastructure Cost policies, you create templates that approximate your different classes of machines, and then assign those templates to the policies. Operations Manager then discovers which machines best match these tem-plates, and assigns the machines to associated groups. For example, if you create a Small, a Medium, and a Large host template, Operations Manager creates three groups — PMs_Small, PMs_Medium, and PMs_Large. It then assigns all the hosts in your environment to these groups, according to which template most closely describes each host.
When you assign a template to an Infrastructure Cost policy, you can check which machines in your environment match the template settings. This shows you which machines would be in the group for that template.
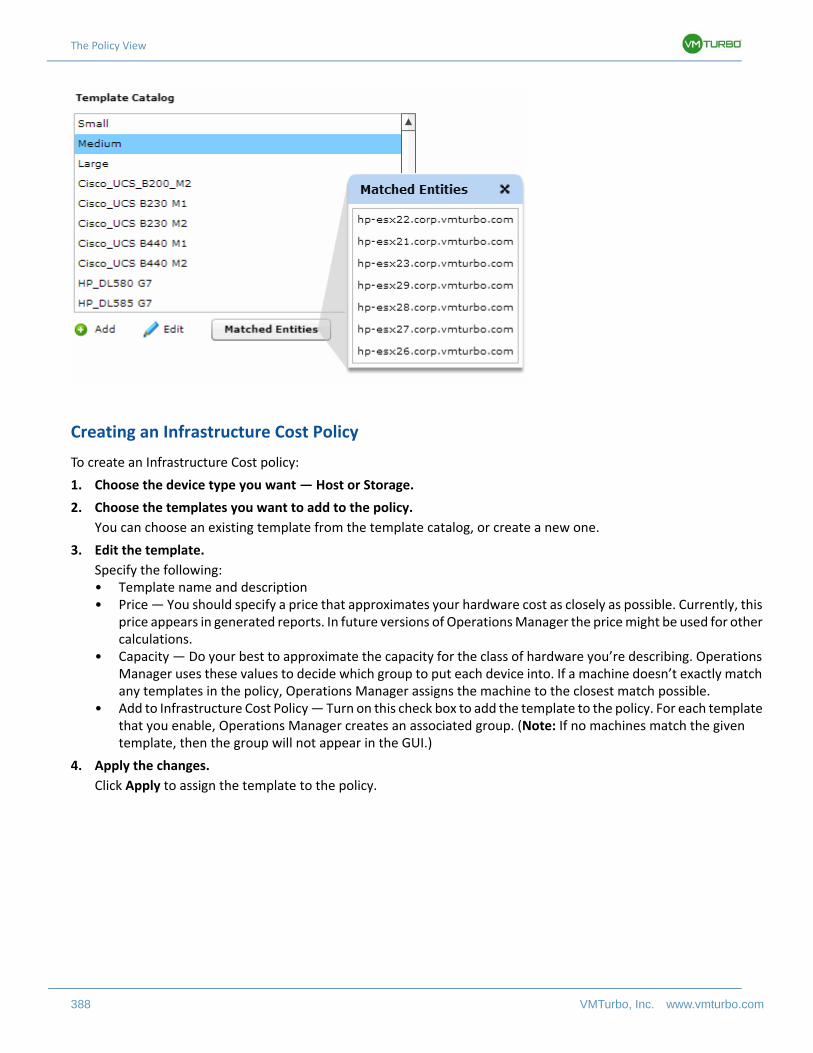
The Policy View
388 VMTurbo, Inc. www.vmturbo.com
Creating an Infrastructure Cost Policy
To create an Infrastructure Cost policy:
1. Choose the device type you want — Host or Storage.
2. Choose the templates you want to add to the policy.
You can choose an existing template from the template catalog, or create a new one.
3. Edit the template.
Specify the following:• Template name and description• Price — You should specify a price that approximates your hardware cost as closely as possible. Currently, this
price appears in generated reports. In future versions of Operations Manager the price might be used for other calculations.
• Capacity — Do your best to approximate the capacity for the class of hardware you’re describing. Operations Manager uses these values to decide which group to put each device into. If a machine doesn’t exactly match any templates in the policy, Operations Manager assigns the machine to the closest match possible.
• Add to Infrastructure Cost Policy — Turn on this check box to add the template to the policy. For each template that you enable, Operations Manager creates an associated group. (Note: If no machines match the given template, then the group will not appear in the GUI.)
4. Apply the changes.
Click Apply to assign the template to the policy.
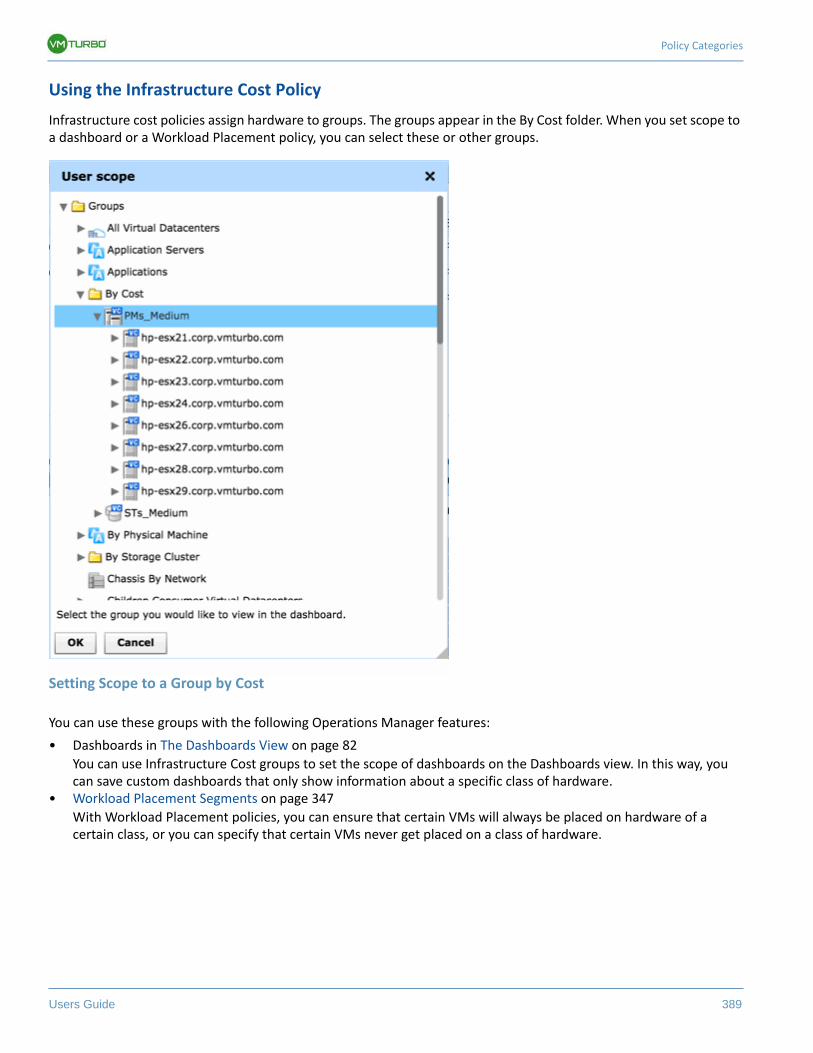
Policy Categories
Users Guide 389
Using the Infrastructure Cost Policy
Infrastructure cost policies assign hardware to groups. The groups appear in the By Cost folder. When you set scope to a dashboard or a Workload Placement policy, you can select these or other groups.
Setting Scope to a Group by Cost
You can use these groups with the following Operations Manager features:
• Dashboards in The Dashboards View on page 82
You can use Infrastructure Cost groups to set the scope of dashboards on the Dashboards view. In this way, you can save custom dashboards that only show information about a specific class of hardware.
• Workload Placement Segments on page 347
With Workload Placement policies, you can ensure that certain VMs will always be placed on hardware of a certain class, or you can specify that certain VMs never get placed on a class of hardware.
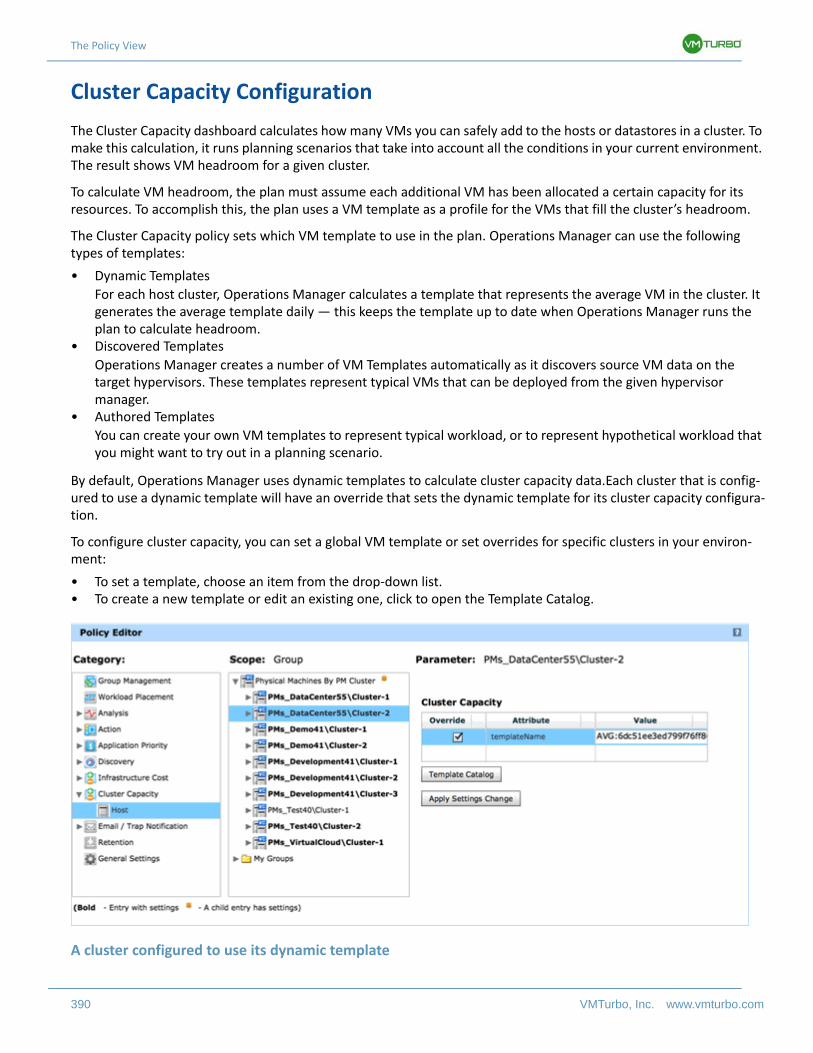
The Policy View
390 VMTurbo, Inc. www.vmturbo.com
Cluster Capacity Configuration
The Cluster Capacity dashboard calculates how many VMs you can safely add to the hosts or datastores in a cluster. To make this calculation, it runs planning scenarios that take into account all the conditions in your current environment. The result shows VM headroom for a given cluster.
To calculate VM headroom, the plan must assume each additional VM has been allocated a certain capacity for its resources. To accomplish this, the plan uses a VM template as a profile for the VMs that fill the cluster’s headroom.
The Cluster Capacity policy sets which VM template to use in the plan. Operations Manager can use the following types of templates:
• Dynamic Templates
For each host cluster, Operations Manager calculates a template that represents the average VM in the cluster. It generates the average template daily — this keeps the template up to date when Operations Manager runs the plan to calculate headroom.
• Discovered Templates
Operations Manager creates a number of VM Templates automatically as it discovers source VM data on the target hypervisors. These templates represent typical VMs that can be deployed from the given hypervisor manager.
• Authored Templates
You can create your own VM templates to represent typical workload, or to represent hypothetical workload that you might want to try out in a planning scenario.
By default, Operations Manager uses dynamic templates to calculate cluster capacity data.Each cluster that is config-ured to use a dynamic template will have an override that sets the dynamic template for its cluster capacity configura-tion.
To configure cluster capacity, you can set a global VM template or set overrides for specific clusters in your environ-ment:
• To set a template, choose an item from the drop-down list.• To create a new template or edit an existing one, click to open the Template Catalog.
A cluster configured to use its dynamic template
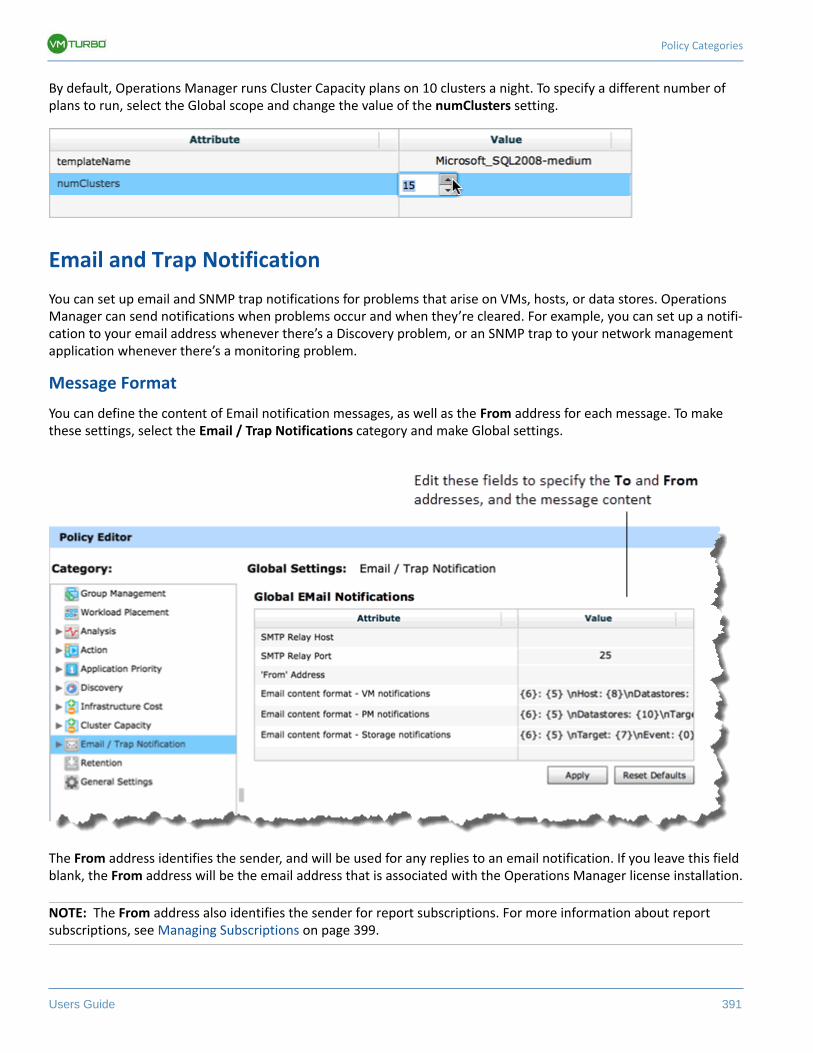
Policy Categories
Users Guide 391
By default, Operations Manager runs Cluster Capacity plans on 10 clusters a night. To specify a different number of plans to run, select the Global scope and change the value of the numClusters setting.
Email and Trap Notification
You can set up email and SNMP trap notifications for problems that arise on VMs, hosts, or data stores. Operations Manager can send notifications when problems occur and when they’re cleared. For example, you can set up a notifi-cation to your email address whenever there’s a Discovery problem, or an SNMP trap to your network management application whenever there’s a monitoring problem.
Message Format
You can define the content of Email notification messages, as well as the From address for each message. To make these settings, select the Email / Trap Notifications category and make Global settings.
The From address identifies the sender, and will be used for any replies to an email notification. If you leave this field blank, the From address will be the email address that is associated with the Operations Manager license installation.
NOTE: The From address also identifies the sender for report subscriptions. For more information about report subscriptions, see Managing Subscriptions on page 399.
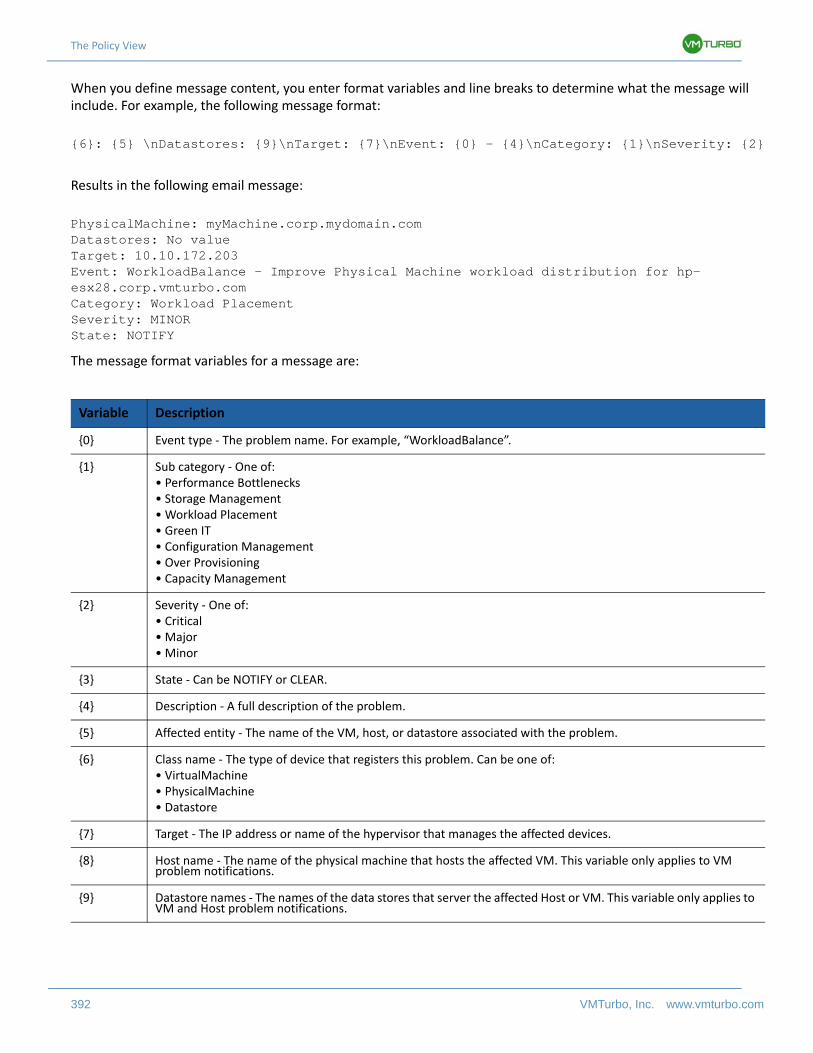
The Policy View
392 VMTurbo, Inc. www.vmturbo.com
When you define message content, you enter format variables and line breaks to determine what the message will include. For example, the following message format:
{6}: {5} \nDatastores: {9}\nTarget: {7}\nEvent: {0} - {4}\nCategory: {1}\nSeverity: {2}
Results in the following email message:
PhysicalMachine: myMachine.corp.mydomain.com Datastores: No valueTarget: 10.10.172.203Event: WorkloadBalance - Improve Physical Machine workload distribution for hp-esx28.corp.vmturbo.comCategory: Workload PlacementSeverity: MINORState: NOTIFY
The message format variables for a message are:
Variable Description
{0} Event type - The problem name. For example, “WorkloadBalance”.
{1} Sub category - One of:• Performance Bottlenecks• Storage Management• Workload Placement• Green IT• Configuration Management• Over Provisioning• Capacity Management
{2} Severity - One of:• Critical• Major• Minor
{3} State - Can be NOTIFY or CLEAR.
{4} Description - A full description of the problem.
{5} Affected entity - The name of the VM, host, or datastore associated with the problem.
{6} Class name - The type of device that registers this problem. Can be one of:• VirtualMachine• PhysicalMachine• Datastore
{7} Target - The IP address or name of the hypervisor that manages the affected devices.
{8} Host name - The name of the physical machine that hosts the affected VM. This variable only applies to VM problem notifications.
{9} Datastore names - The names of the data stores that server the affected Host or VM. This variable only applies to VM and Host problem notifications.
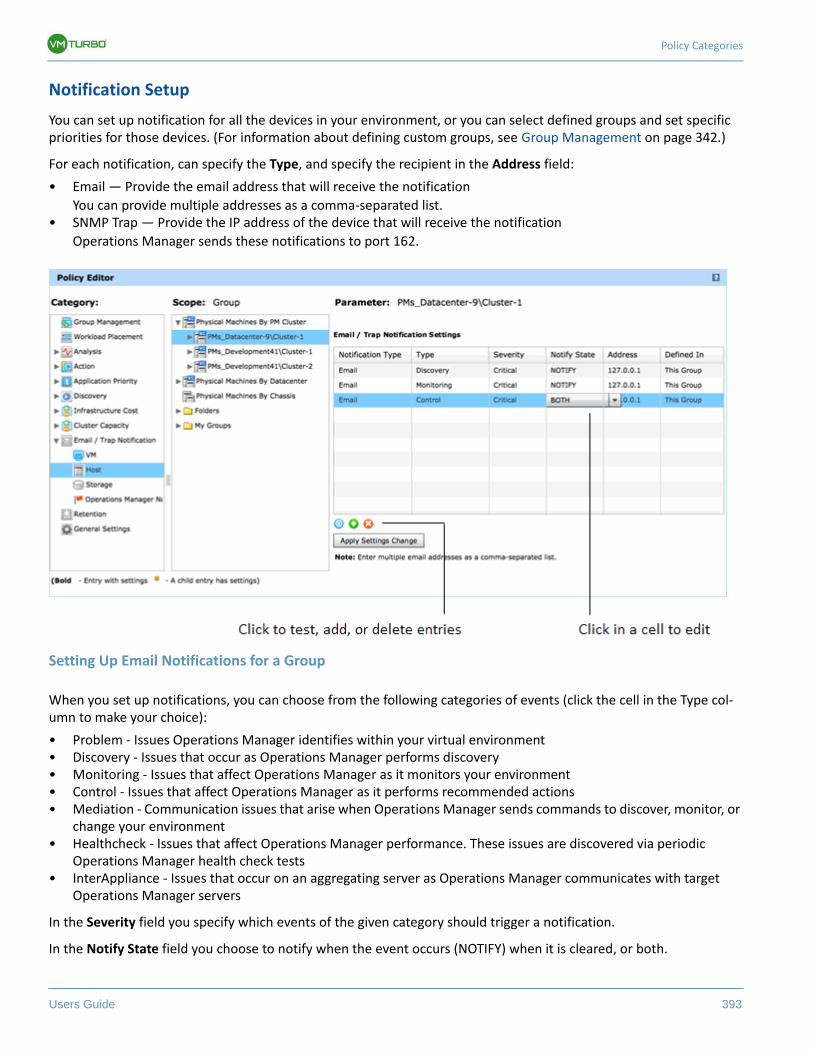
Policy Categories
Users Guide 393
Notification Setup
You can set up notification for all the devices in your environment, or you can select defined groups and set specific priorities for those devices. (For information about defining custom groups, see Group Management on page 342.)
For each notification, can specify the Type, and specify the recipient in the Address field:
• Email — Provide the email address that will receive the notification
You can provide multiple addresses as a comma-separated list.• SNMP Trap — Provide the IP address of the device that will receive the notification
Operations Manager sends these notifications to port 162.
Setting Up Email Notifications for a Group
When you set up notifications, you can choose from the following categories of events (click the cell in the Type col-umn to make your choice):
• Problem - Issues Operations Manager identifies within your virtual environment• Discovery - Issues that occur as Operations Manager performs discovery• Monitoring - Issues that affect Operations Manager as it monitors your environment• Control - Issues that affect Operations Manager as it performs recommended actions• Mediation - Communication issues that arise when Operations Manager sends commands to discover, monitor, or
change your environment• Healthcheck - Issues that affect Operations Manager performance. These issues are discovered via periodic
Operations Manager health check tests• InterAppliance - Issues that occur on an aggregating server as Operations Manager communicates with target
Operations Manager servers
In the Severity field you specify which events of the given category should trigger a notification.
In the Notify State field you choose to notify when the event occurs (NOTIFY) when it is cleared, or both.
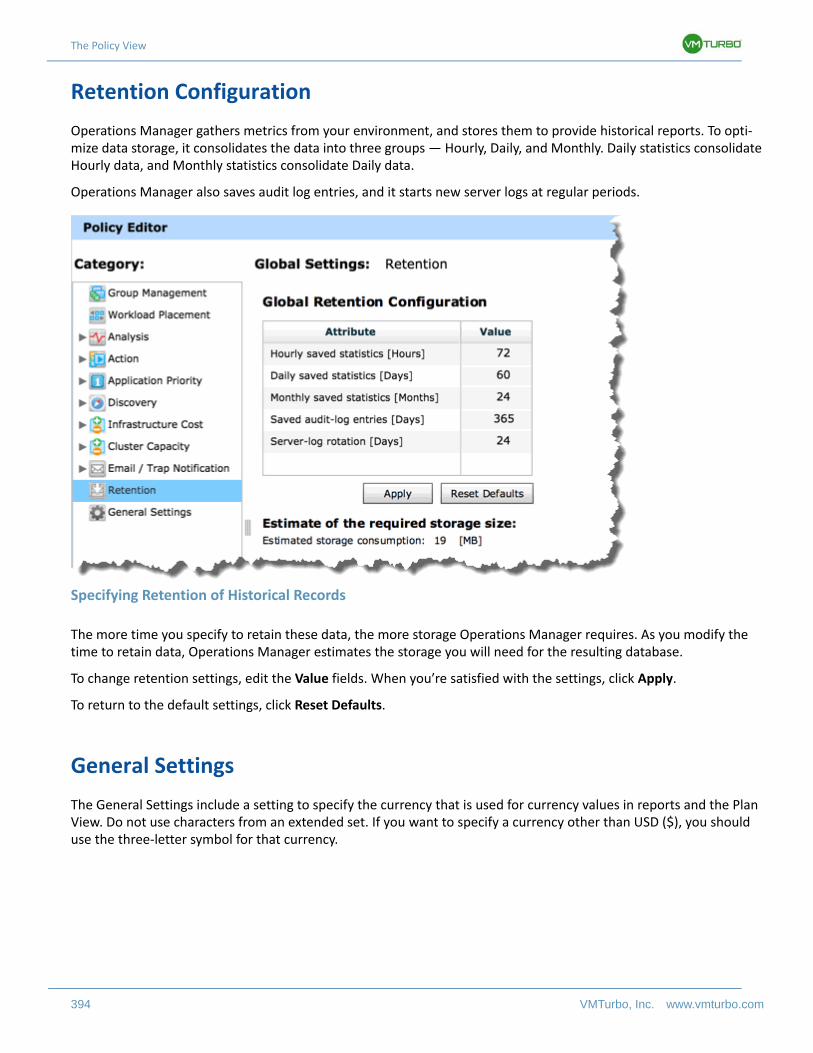
The Policy View
394 VMTurbo, Inc. www.vmturbo.com
Retention Configuration
Operations Manager gathers metrics from your environment, and stores them to provide historical reports. To opti-mize data storage, it consolidates the data into three groups — Hourly, Daily, and Monthly. Daily statistics consolidate Hourly data, and Monthly statistics consolidate Daily data.
Operations Manager also saves audit log entries, and it starts new server logs at regular periods.
Specifying Retention of Historical Records
The more time you specify to retain these data, the more storage Operations Manager requires. As you modify the time to retain data, Operations Manager estimates the storage you will need for the resulting database.
To change retention settings, edit the Value fields. When you’re satisfied with the settings, click Apply.
To return to the default settings, click Reset Defaults.
General Settings
The General Settings include a setting to specify the currency that is used for currency values in reports and the Plan View. Do not use characters from an extended set. If you want to specify a currency other than USD ($), you should use the three-letter symbol for that currency.
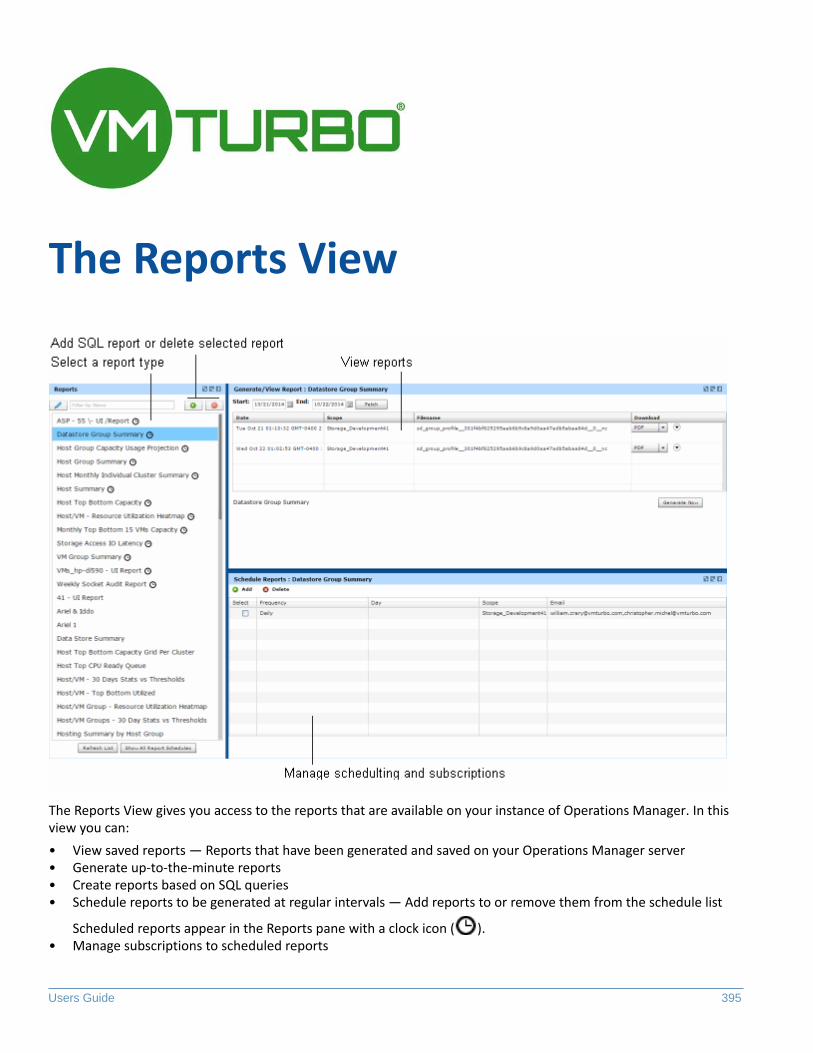
Users Guide 395
The Reports View
The Reports View gives you access to the reports that are available on your instance of Operations Manager. In this view you can:
• View saved reports — Reports that have been generated and saved on your Operations Manager server• Generate up-to-the-minute reports• Create reports based on SQL queries• Schedule reports to be generated at regular intervals — Add reports to or remove them from the schedule list
Scheduled reports appear in the Reports pane with a clock icon ( ).• Manage subscriptions to scheduled reports
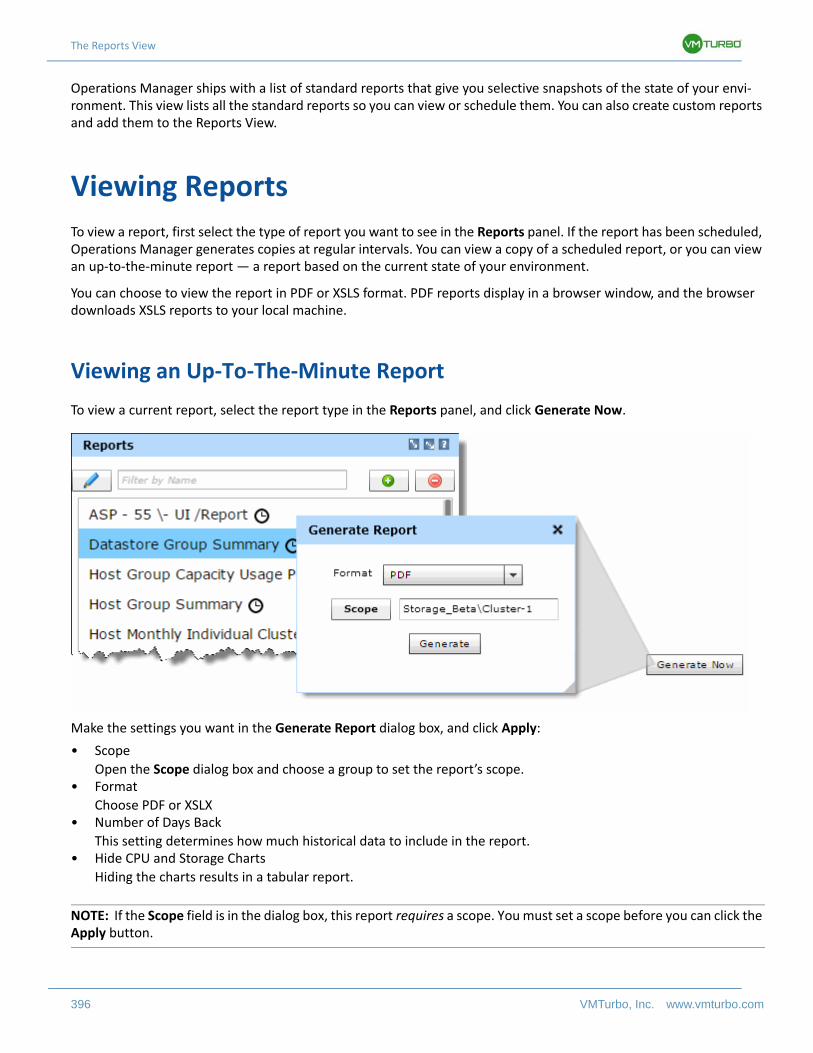
The Reports View
396 VMTurbo, Inc. www.vmturbo.com
Operations Manager ships with a list of standard reports that give you selective snapshots of the state of your envi-ronment. This view lists all the standard reports so you can view or schedule them. You can also create custom reports and add them to the Reports View.
Viewing Reports
To view a report, first select the type of report you want to see in the Reports panel. If the report has been scheduled, Operations Manager generates copies at regular intervals. You can view a copy of a scheduled report, or you can view an up-to-the-minute report — a report based on the current state of your environment.
You can choose to view the report in PDF or XSLS format. PDF reports display in a browser window, and the browser downloads XSLS reports to your local machine.
Viewing an Up-To-The-Minute Report
To view a current report, select the report type in the Reports panel, and click Generate Now.
Make the settings you want in the Generate Report dialog box, and click Apply:
• Scope
Open the Scope dialog box and choose a group to set the report’s scope.• Format
Choose PDF or XSLX• Number of Days Back
This setting determines how much historical data to include in the report.• Hide CPU and Storage Charts
Hiding the charts results in a tabular report.
NOTE: If the Scope field is in the dialog box, this report requires a scope. You must set a scope before you can click the Apply button.
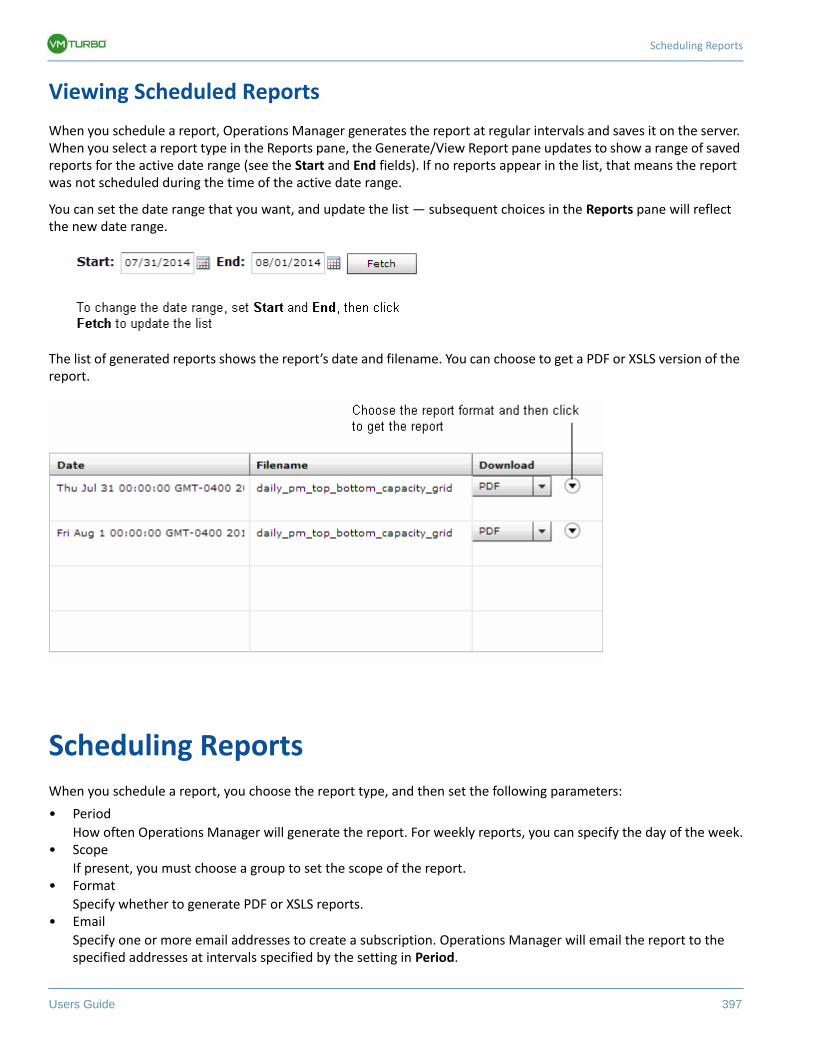
Scheduling Reports
Users Guide 397
Viewing Scheduled Reports
When you schedule a report, Operations Manager generates the report at regular intervals and saves it on the server. When you select a report type in the Reports pane, the Generate/View Report pane updates to show a range of saved reports for the active date range (see the Start and End fields). If no reports appear in the list, that means the report was not scheduled during the time of the active date range.
You can set the date range that you want, and update the list — subsequent choices in the Reports pane will reflect the new date range.
The list of generated reports shows the report’s date and filename. You can choose to get a PDF or XSLS version of the report.
Scheduling Reports
When you schedule a report, you choose the report type, and then set the following parameters:
• Period
How often Operations Manager will generate the report. For weekly reports, you can specify the day of the week.• Scope
If present, you must choose a group to set the scope of the report.• Format
Specify whether to generate PDF or XSLS reports.• Email
Specify one or more email addresses to create a subscription. Operations Manager will email the report to the specified addresses at intervals specified by the setting in Period.
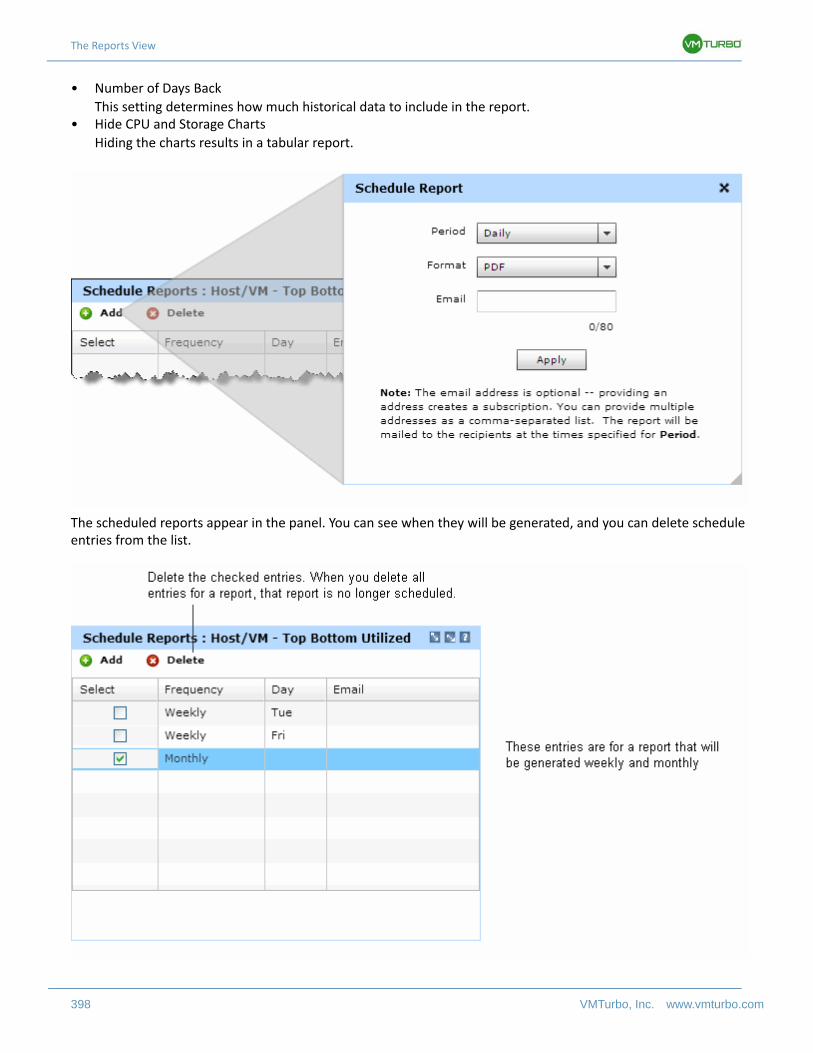
The Reports View
398 VMTurbo, Inc. www.vmturbo.com
• Number of Days Back
This setting determines how much historical data to include in the report.• Hide CPU and Storage Charts
Hiding the charts results in a tabular report.
The scheduled reports appear in the panel. You can see when they will be generated, and you can delete schedule entries from the list.
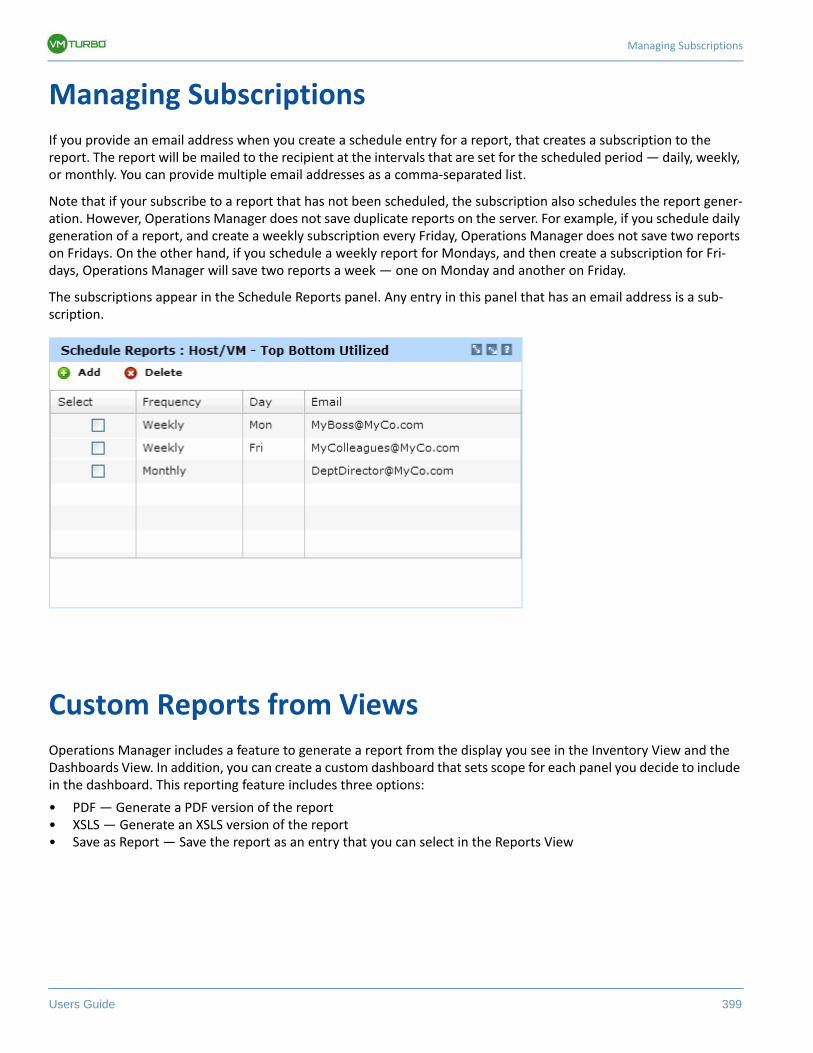
Managing Subscriptions
Users Guide 399
Managing Subscriptions
If you provide an email address when you create a schedule entry for a report, that creates a subscription to the report. The report will be mailed to the recipient at the intervals that are set for the scheduled period — daily, weekly, or monthly. You can provide multiple email addresses as a comma-separated list.
Note that if your subscribe to a report that has not been scheduled, the subscription also schedules the report gener-ation. However, Operations Manager does not save duplicate reports on the server. For example, if you schedule daily generation of a report, and create a weekly subscription every Friday, Operations Manager does not save two reports on Fridays. On the other hand, if you schedule a weekly report for Mondays, and then create a subscription for Fri-days, Operations Manager will save two reports a week — one on Monday and another on Friday.
The subscriptions appear in the Schedule Reports panel. Any entry in this panel that has an email address is a sub-scription.
Custom Reports from Views
Operations Manager includes a feature to generate a report from the display you see in the Inventory View and the Dashboards View. In addition, you can create a custom dashboard that sets scope for each panel you decide to include in the dashboard. This reporting feature includes three options:
• PDF — Generate a PDF version of the report• XSLS — Generate an XSLS version of the report• Save as Report — Save the report as an entry that you can select in the Reports View
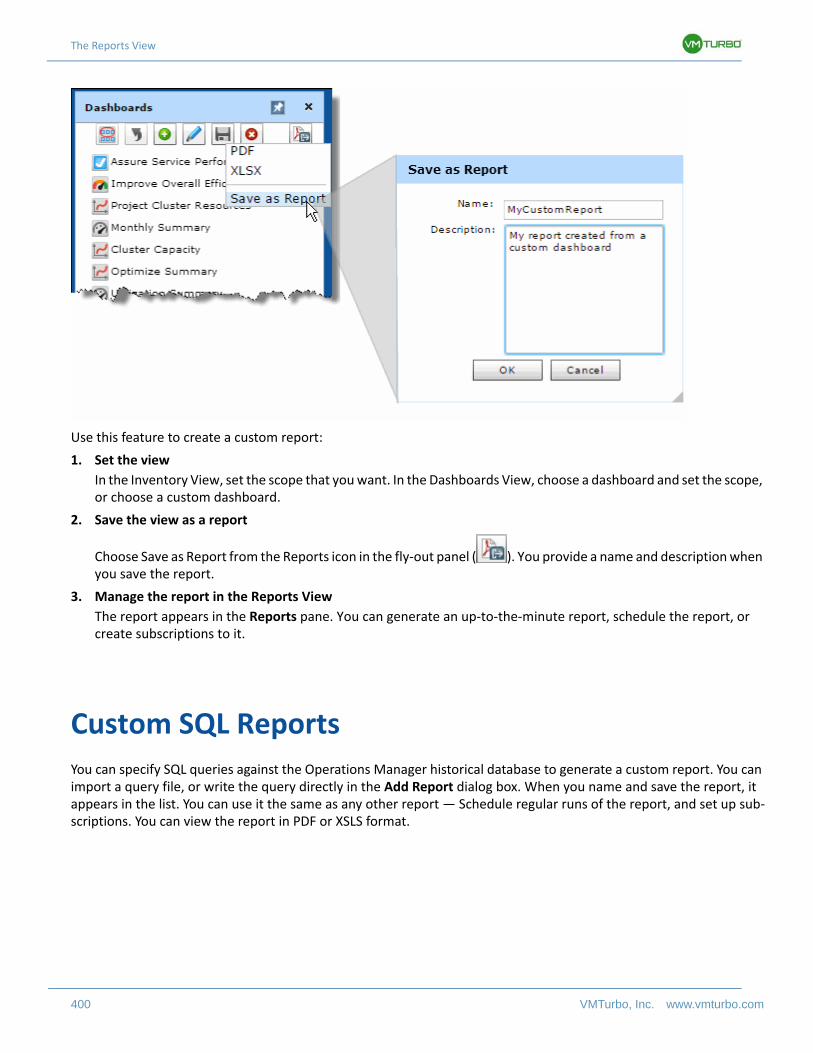
The Reports View
400 VMTurbo, Inc. www.vmturbo.com
Use this feature to create a custom report:
1. Set the view
In the Inventory View, set the scope that you want. In the Dashboards View, choose a dashboard and set the scope, or choose a custom dashboard.
2. Save the view as a report
Choose Save as Report from the Reports icon in the fly-out panel ( ). You provide a name and description when you save the report.
3. Manage the report in the Reports View
The report appears in the Reports pane. You can generate an up-to-the-minute report, schedule the report, or create subscriptions to it.
Custom SQL Reports
You can specify SQL queries against the Operations Manager historical database to generate a custom report. You can import a query file, or write the query directly in the Add Report dialog box. When you name and save the report, it appears in the list. You can use it the same as any other report — Schedule regular runs of the report, and set up sub-scriptions. You can view the report in PDF or XSLS format.
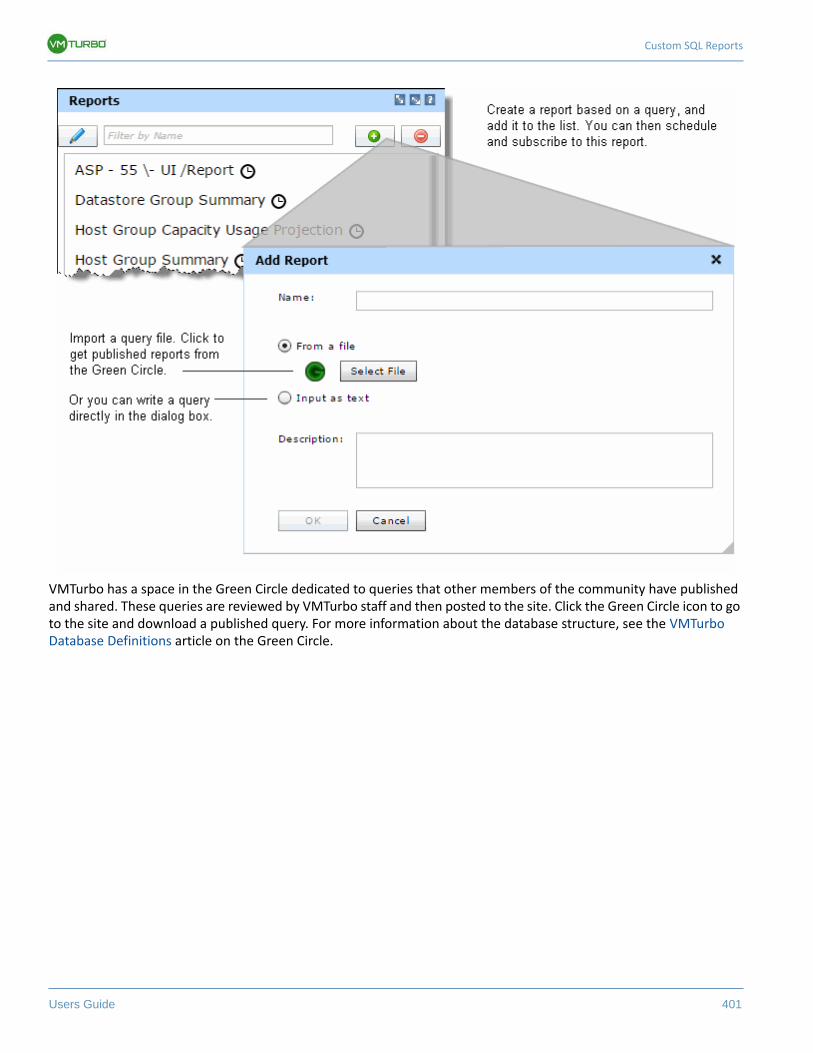
Custom SQL Reports
Users Guide 401
VMTurbo has a space in the Green Circle dedicated to queries that other members of the community have published and shared. These queries are reviewed by VMTurbo staff and then posted to the site. Click the Green Circle icon to go to the site and download a published query. For more information about the database structure, see the VMTurbo Database Definitions article on the Green Circle.
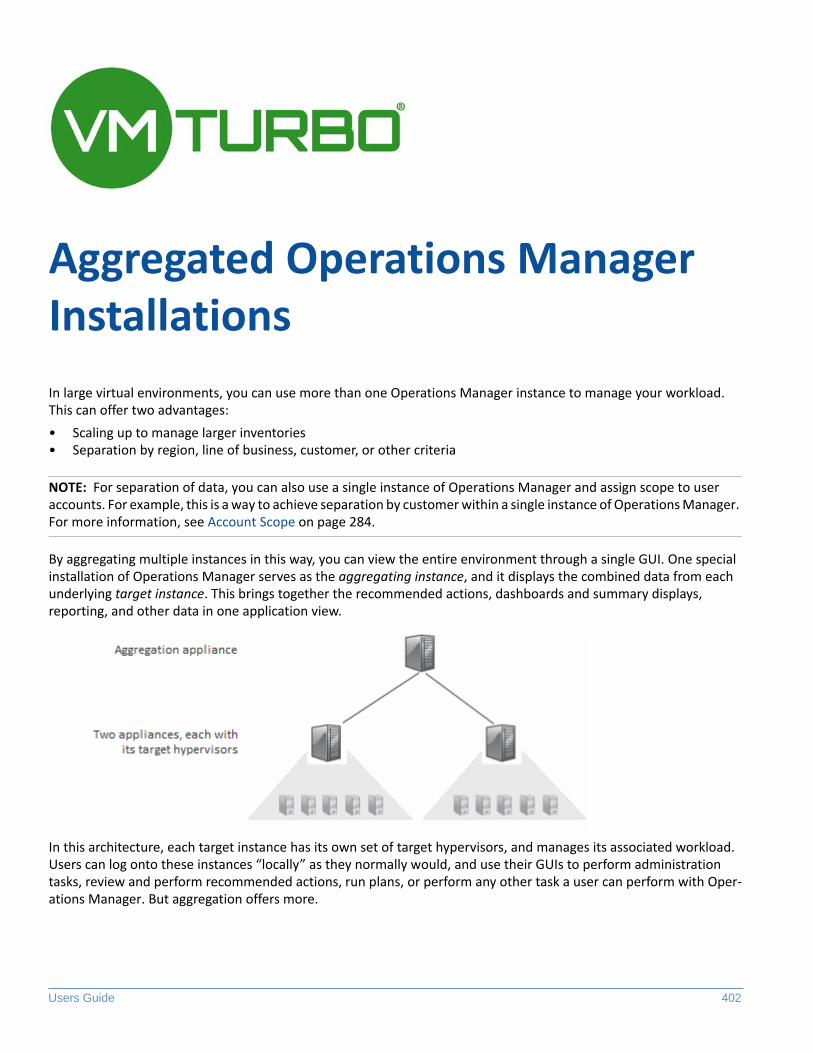
Users Guide 402
Aggregated Operations Manager Installations
In large virtual environments, you can use more than one Operations Manager instance to manage your workload. This can offer two advantages:
• Scaling up to manage larger inventories• Separation by region, line of business, customer, or other criteria
NOTE: For separation of data, you can also use a single instance of Operations Manager and assign scope to user accounts. For example, this is a way to achieve separation by customer within a single instance of Operations Manager. For more information, see Account Scope on page 284.
By aggregating multiple instances in this way, you can view the entire environment through a single GUI. One special installation of Operations Manager serves as the aggregating instance, and it displays the combined data from each underlying target instance. This brings together the recommended actions, dashboards and summary displays, reporting, and other data in one application view.
In this architecture, each target instance has its own set of target hypervisors, and manages its associated workload. Users can log onto these instances “locally” as they normally would, and use their GUIs to perform administration tasks, review and perform recommended actions, run plans, or perform any other task a user can perform with Oper-ations Manager. But aggregation offers more.
Operations Manager Versions and Aggregation
Users Guide 403
The aggregation instance treats the underlying instances as its target servers. Users can log onto the aggregation instance and use the GUI to manage the aggregated environment by executing recommended actions, viewing aggre-gated dashboards and summary panels, and performing other tasks. You perform these tasks through the aggregating GUI, but you can effect changes on the inventory managed by the underlying Operations Manager instances.
NOTE: An aggregating instance cannot manage hypervisors and aggregated target instances at the same time.All the targets of an aggregating instance must be target instances of Operations Manager.
Operations Manager Versions and Aggregation
Note that all instances of Operations Manager in the aggregation architecture must be running the same version. If you update the version you are running, you should update all instances in the architecture. The earliest version of Operations Manager that supports aggregation is 3.2-19954.
Aggregated User Accounts and Login
For any account you use to log into an aggregating instance, you should be sure the underlying Control Instances have matching user accounts. In this way, a user with an account on the aggregating instance can then log onto any of the underlying target instances. For example, a user should be able to open underlying instances from the GUI of the aggregating instance, and then set policies for those targets.
User accounts are stored locally on each instance. As a result, accounts can get out of sync. If a target was added to your aggregating instance, then you won’t necessarily have an account on the new target. To remedy this situation, ask the administrator of the target to create an account for you with settings (username, password, role, etc.) that are identical to your current aggregating account.
Active Directory Authentication
For Active Directory accounts, user authentication works as you would expect:
• When you create a user account on the aggregating instance, that user account gets pushed down to the underlying instances. You can then log into the underlying instances using the same credentials.
• The Active Directory domain and server specifications are local to each Operations Manager instance. In this way, each instance can use authentication that is local to its domain.
Aggregated Operations Manager Installations
404 VMTurbo, Inc. www.vmturbo.com
Aggregation Details
The aggregation instance provides a view of the whole environment that is being managed by the target instances. The aggregating instance requests data from the target instances as its GUI needs the data.
The following list provides details of how the aggregation instance manages data from the target instances.
• System-defined Groups
Operations Manager automatically groups devices in your environment into clusters and other groups. For example, it lists datastores by storage type, and VMs by storage. The aggregating instance adds the aggregated devices to these groups as appropriate. For example, if the different target instances all include iSCSI disks, then the aggregating instance shows all of these disks in the same iSCSI group. You can select these groups or items in these groups to set the scope of the aggregating instance.
• Custom Groups
The aggregating instance displays all the custom groups that are defined in the target instances. You can select these groups or items in these groups to set the scope on the aggregating instance. You can create groups on the aggregating instance that include devices from different target instances. Groups you create on the aggregating instance do not have any effect on groups that are defined on target instances.
• To Do List
On the aggregating instance, the To Do list shows recommended actions for all the target instances. If manual execution for the action is enabled on the target instance, then you can select that action and execute it from the aggregating instance. This sends a message to the corresponding target instance, which then executes the action.
• Dashboards View
The Project Cluster Resources dashboard is not aggregated. This dashboard displays a list of target instances, and you can log into these instances to project cluster resources.
For the other dashboards, the data you see shows a combination of the target instances. For example, the Assure Service Performance dashboard shows information for the combination of all hosts in your environment. As you set the scope of the dashboard, you can choose from all the groups and clusters in the environment.
• Inventory View
The data you see in the summary panels shows a combination of the target instances. For example if your target instances each manage a number of LSASS applications, the navigation list will show the combination of all these applications under the heading for LSASS. You can select groups to set the scope of this view.
• Plan View
Plans are not aggregated. The Plan view displays a list of target instances. You can log into these instances to run plans on them.
• Deploy View
The Deploy view displays a list of target instances. You can log into these instances to deploy VMs on them.• Optimize View
The data you see in this view shows a combination of the target instances. You can select groups to set the scope of this view.
Configuring Aggregation
Users Guide 405
• Admin View
On the aggregating instance, this view supports the following tasks:- License Configuration
License configuration for the aggregating instance gets pushed down to the target instances. For information about applying licenses, see License Configuration on page 314.
- User Authentication Configuration
You can manage user accounts for the aggregating instance. These accounts get pushed down to the target instances as well. For more information, see Aggregated User Accounts and Login on page 403 and User Authentication Configuration on page 277.
- Maintenance
Maintenance actions such as software updates and diagnostics are for the aggregation instance, only. The target instances must perform their own maintenance activities. For more information, see Maintenance on page 315.
• Policy View
The Policy view displays a list of target instances. You can log into these instances to specify policies on them.• Reports
The Reporting button displays a list of target instances. You can log into these instances to run their reports.
Individual devices in the navigation tree include buttons to generate reports on demand. When you click this icon, the aggregating instance passes the request to the appropriate target instance, which generates the report.
Configuring Aggregation
By default, each instance of Operations Manager is configured to run stand-alone. To set up aggregation, specify underlying instances of Operations Manager as targets for the aggregating instance. For information about specifying these targets, see Adding Operations Manager Targets for Aggregation on page 313.

Aggregated Operations Manager Installations
406 VMTurbo, Inc. www.vmturbo.com