Embed Size (px)
Citation preview
©2012 MFMER | slide-1
Operationalizing Market Analytics
Misty Hathaway Chair, Division of Marketing – Mayo Clinic
Marketing World 2012 18 July 2012, Boston, MA

©2012 MFMER | slide-2
Key Take-Aways:
• Define critical metrics and identify their source.
• What are you trying to accomplish? How will leadership evaluate
your work?
• Be focused and disciplined. And flexible in a dynamic marketplace.
• Develop a scorecard, likely with multi-level reporting.
• Format matters.
©2012 MFMER | slide-3
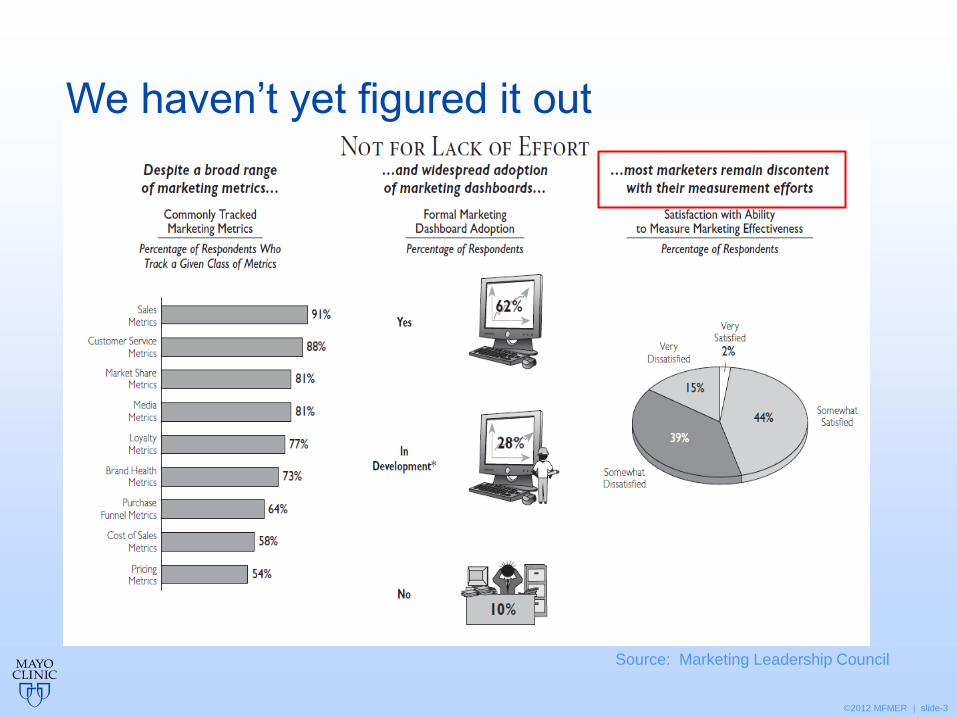
We haven’t yet figured it out
Source: Marketing Leadership Council

©2012 MFMER | slide-4
Fundamentals of Analytics
• What question are you trying to answer?
• What metrics best measure your strategies?
• What data exist?
• Do you need to collect new data?
• What matters most?
• How do you best communicate the metrics, and to whom?
©2012 MFMER | slide-5
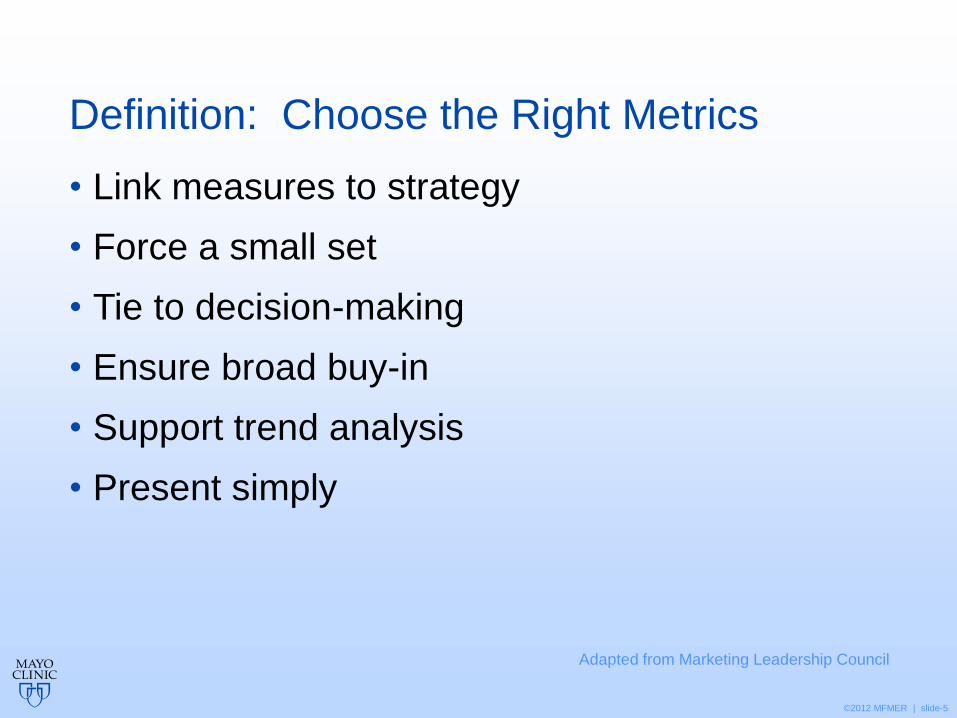
Definition: Choose the Right Metrics
• Link measures to strategy
• Force a small set
• Tie to decision-making
• Ensure broad buy-in
• Support trend analysis
• Present simply
Adapted from Marketing Leadership Council
©2012 MFMER | slide-6
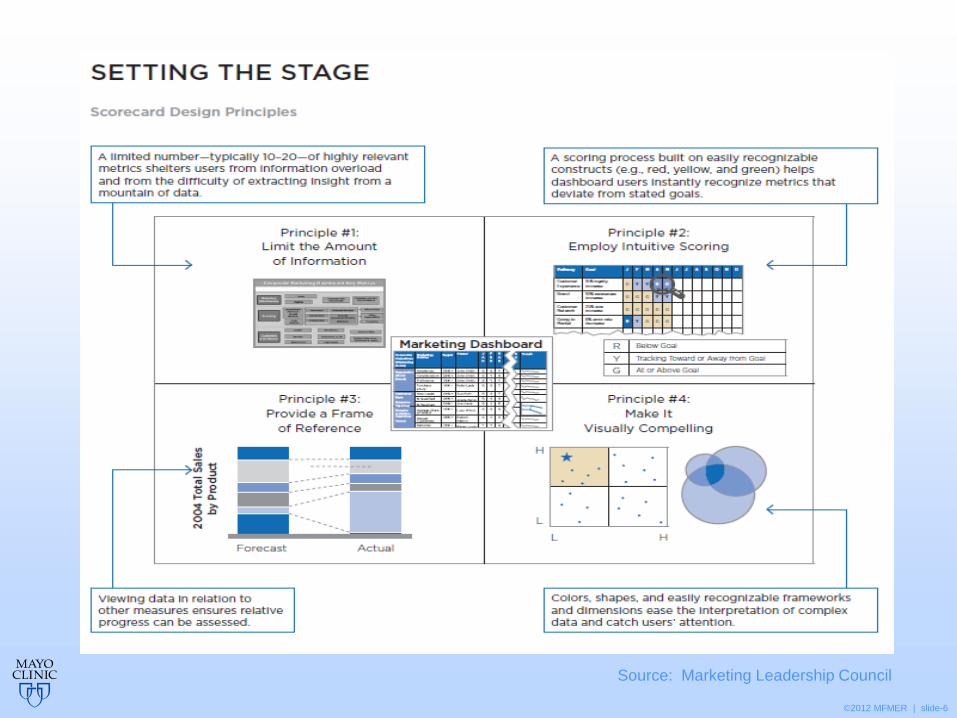
Source: Marketing Leadership Council
©2012 MFMER | slide-7
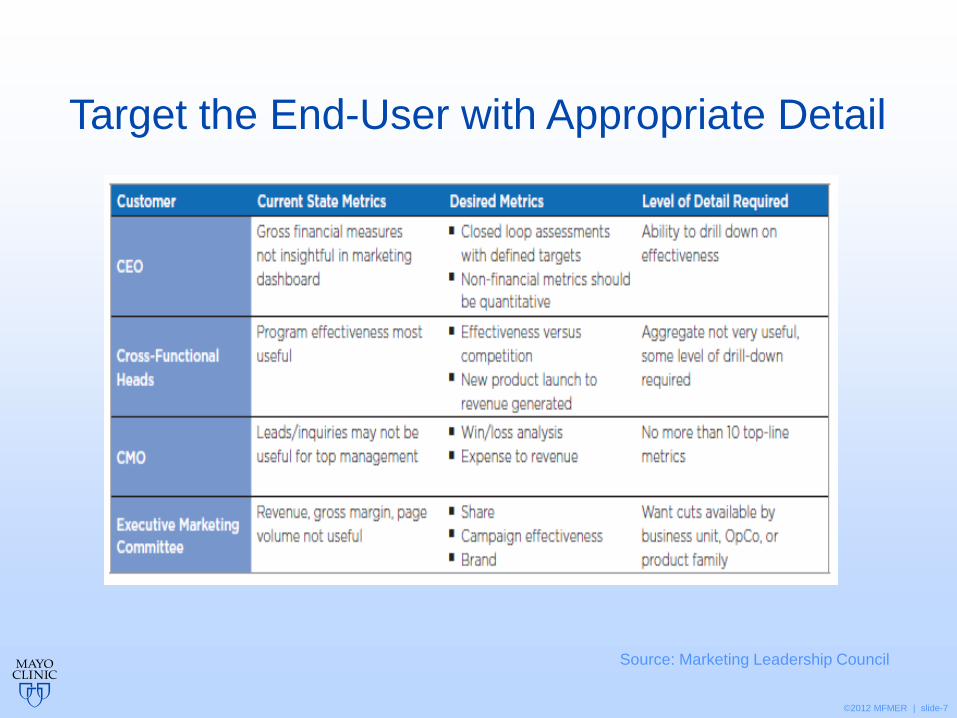
Target the End-User with Appropriate Detail
Source: Marketing Leadership Council
©2012 MFMER | slide-8
Know When to Stop
Obsession…..can lead to Data Overload and Paralysis

©2012 MFMER | slide-9
Poor display erodes credibility and diminishes impact

©2012 MFMER | slide-10
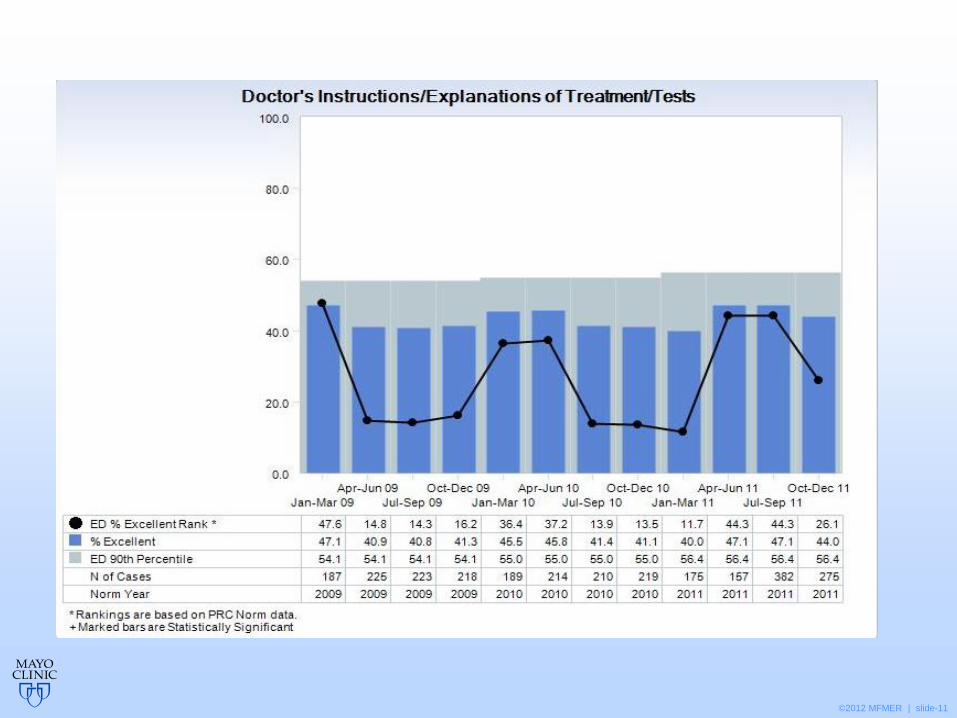
©2012 MFMER | slide-11

©2012 MFMER | slide-12
Examples of Measurement

©2012 MFMER | slide-13
Tracking Advertising
©2012 MFMER | slide-14
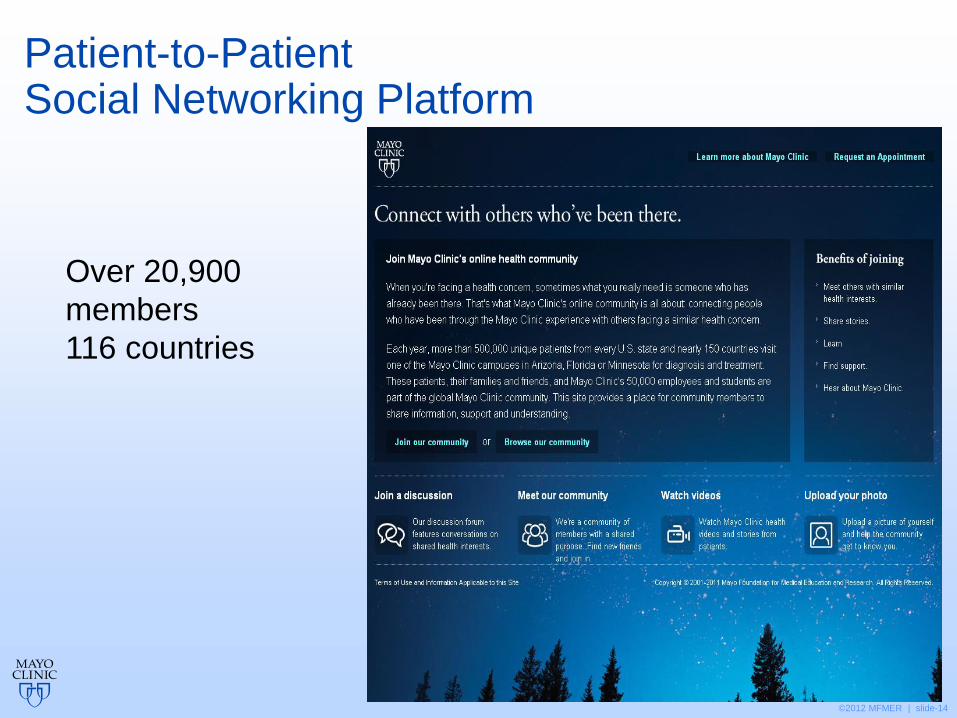
Patient-to-Patient Social Networking Platform
Over 20,900
members
116 countries

©2012 MFMER | slide-15
Patient Mobile App
Over 11,000
installs in
initial 5 weeks
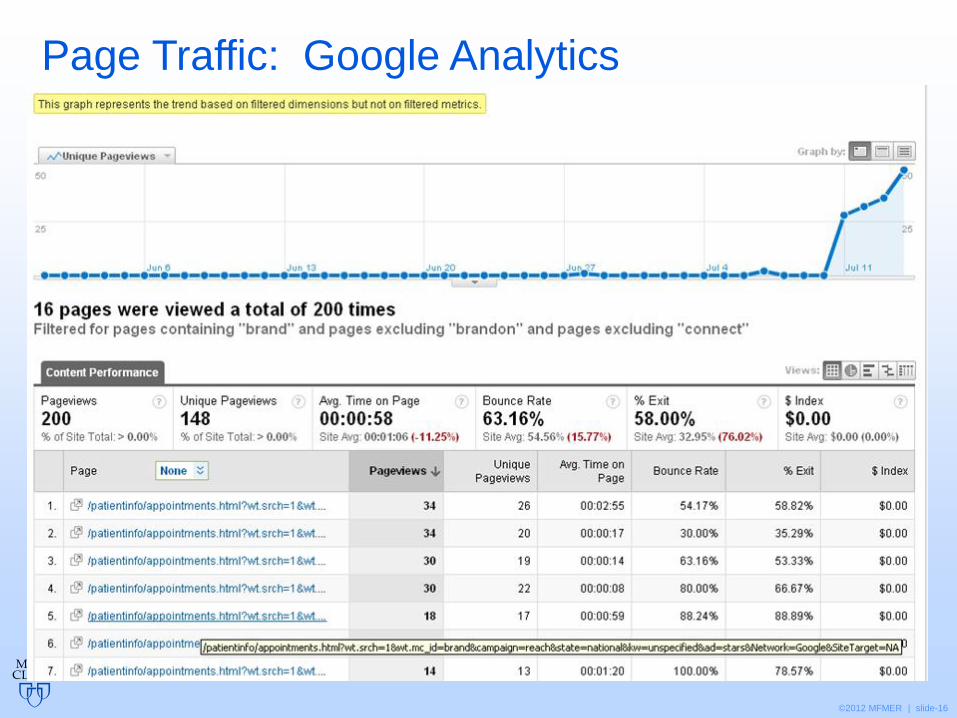
©2012 MFMER | slide-16
Page Traffic: Google Analytics
©2012 MFMER | slide-17
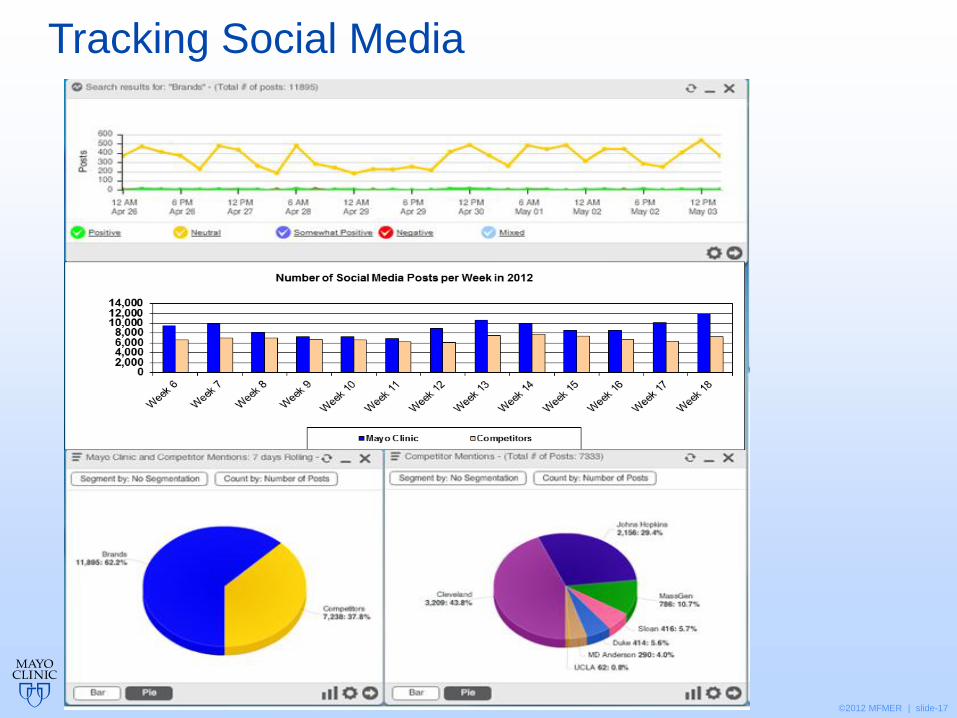
Tracking Social Media

©2012 MFMER | slide-18
Sometimes you need to Gather Your Own Data
©2012 MFMER | slide-19
.
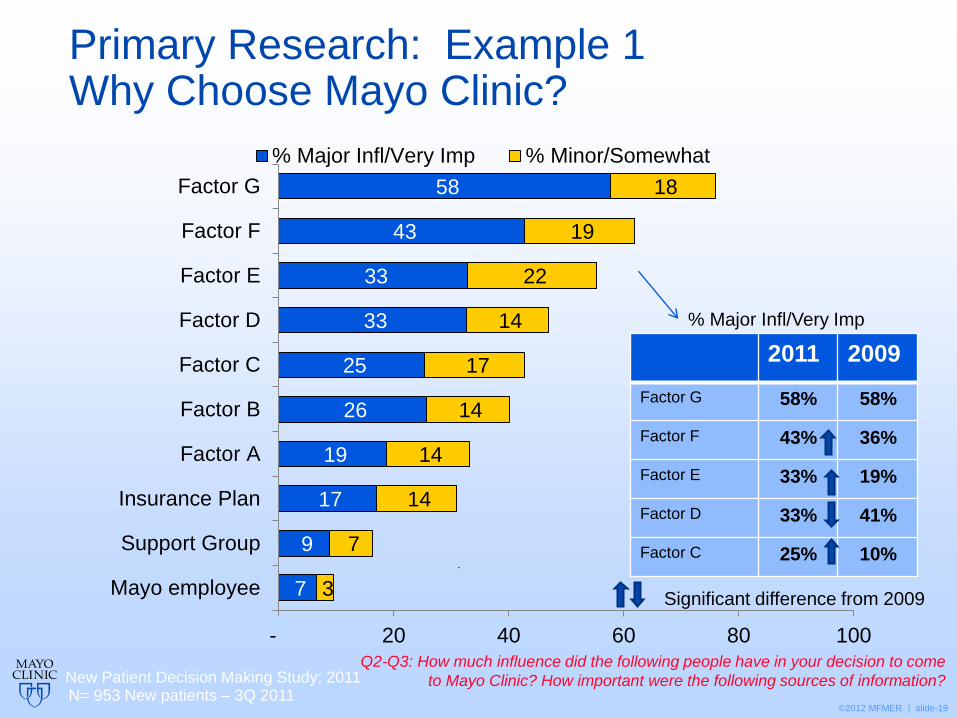
Primary Research: Example 1 Why Choose Mayo Clinic?
7
9
17
19
26
25
33
33
43
58
3
7
14
14
14
17
14
22
19
18
- 20 40 60 80 100
Mayo employee
Support Group
Insurance Plan
Factor A
Factor B
Factor C
Factor D
Factor E
Factor F
Factor G
% Major Infl/Very Imp % Minor/Somewhat
N= 953 New patients – 3Q 2011
Q2-Q3: How much influence did the following people have in your decision to come
to Mayo Clinic? How important were the following sources of information? New Patient Decision Making Study; 2011
2011 2009
Factor G 58% 58%
Factor F 43% 36%
Factor E 33% 19%
Factor D 33% 41%
Factor C 25% 10%
% Major Infl/Very Imp
Significant difference from 2009
©2012 MFMER | slide-20
20
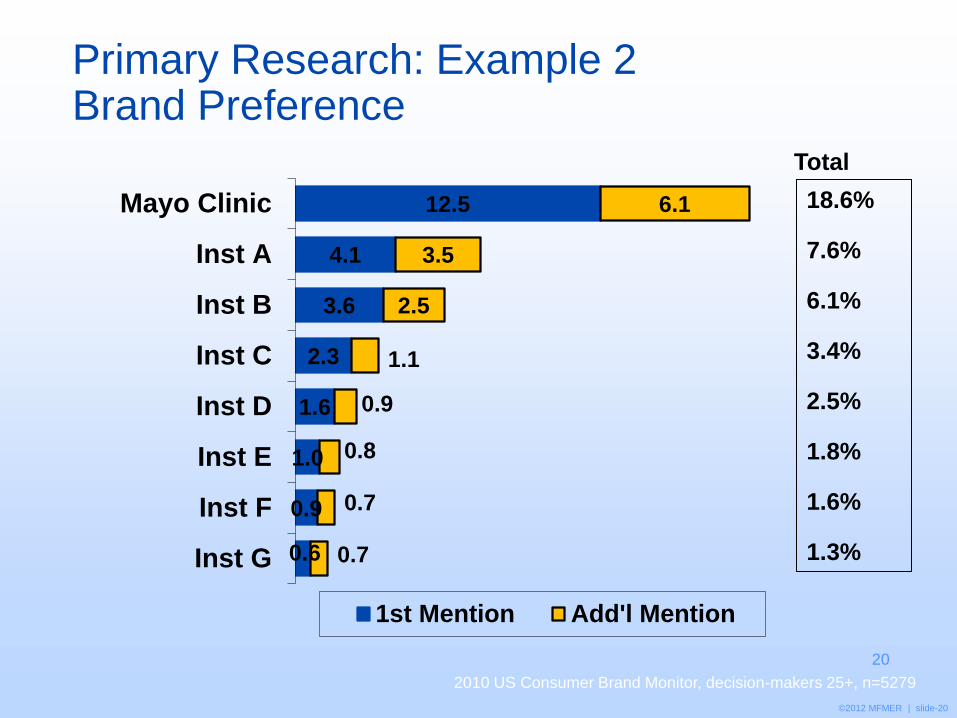
Primary Research: Example 2 Brand Preference
0.6
0.9
1.0
1.6
2.3
3.6
4.1
12.5
0.7
0.7
0.8
0.9
1.1
2.5
3.5
6.1
Inst G
Inst F
Inst E
Inst D
Inst C
Inst B
Inst A
Mayo Clinic
1st Mention Add'l Mention
2010 US Consumer Brand Monitor, decision-makers 25+, n=5279
18.6%
7.6%
6.1%
3.4%
2.5%
1.8%
1.6%
1.3%
Total
©2012 MFMER | slide-21
21
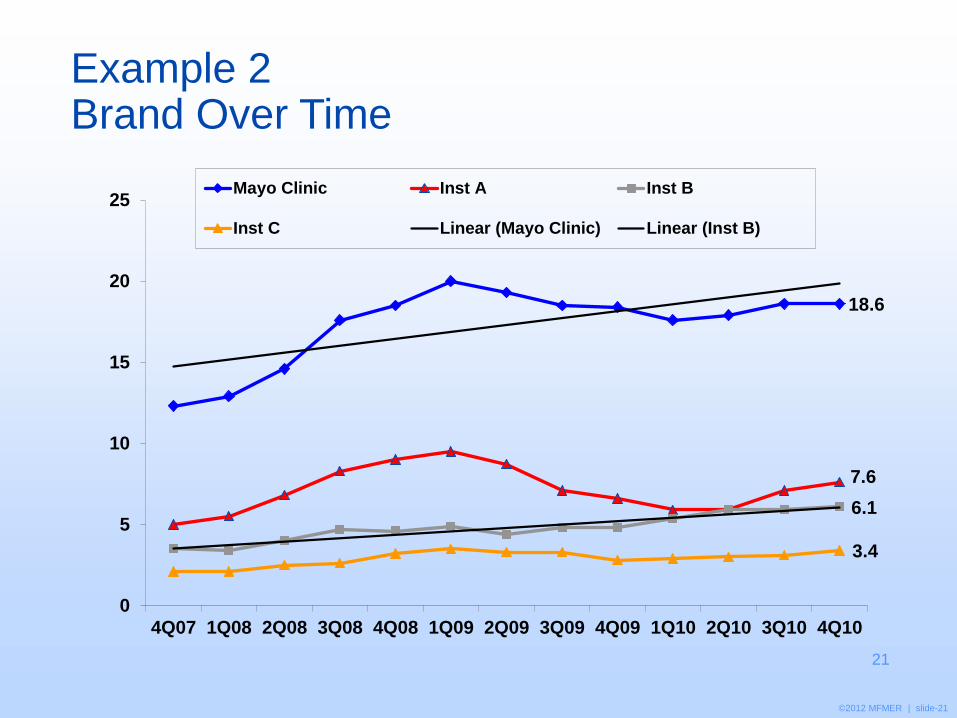
Example 2 Brand Over Time
18.6
7.6
6.1
3.4
0
5
10
15
20
25
4Q07 1Q08 2Q08 3Q08 4Q08 1Q09 2Q09 3Q09 4Q09 1Q10 2Q10 3Q10 4Q10
Mayo Clinic Inst A Inst B
Inst C Linear (Mayo Clinic) Linear (Inst B)
©2012 MFMER | slide-22
22
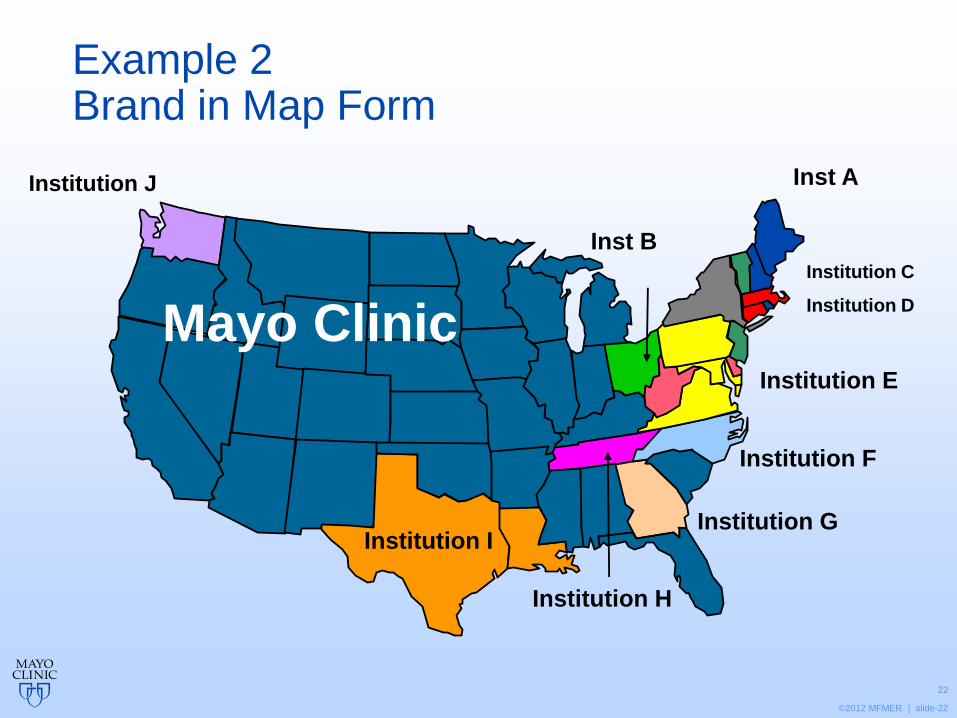
Example 2 Brand in Map Form
Mayo Clinic
Institution J
Institution I Institution G
Institution F
Inst B
Inst A
Institution C
Institution D
Institution H
Institution E

©2012 MFMER | slide-23
Maps can tell a Story Spinal Fusion except Cervical Procedures DRG: 497 & 498 Mapping xx Provider Percent Market Share
Data Sources: DSS, MHA, and Polaris
Year: 2006

©2012 MFMER | slide-24
How much detail is needed?
©2012 MFMER | slide-25
Division of Marketing - Confidential
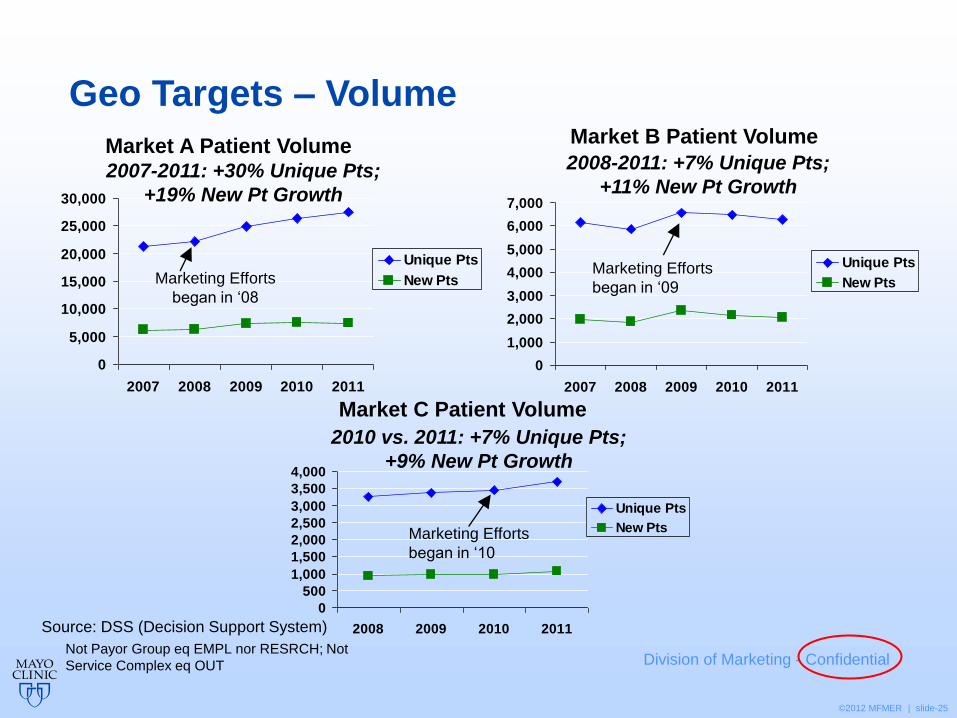
Geo Targets – Volume
0
5,000
10,000
15,000
20,000
25,000
30,000
2007 2008 2009 2010 2011
Unique Pts
New Pts
0
1,000
2,000
3,000
4,000
5,000
6,000
7,000
2007 2008 2009 2010 2011
Unique Pts
New Pts
Source: DSS (Decision Support System)
Market A Patient Volume Market B Patient Volume
Marketing Efforts
began in ‘08
Marketing Efforts
began in ‘09
0
500
1,000
1,500
2,000
2,500
3,000
3,500
4,000
2008 2009 2010 2011
Unique Pts
New Pts
Market C Patient Volume
Marketing Efforts
began in ‘10
2007-2011: +30% Unique Pts;
+19% New Pt Growth
2008-2011: +7% Unique Pts;
+11% New Pt Growth
2010 vs. 2011: +7% Unique Pts;
+9% New Pt Growth
Not Payor Group eq EMPL nor RESRCH; Not
Service Complex eq OUT
©2012 MFMER | slide-26
©2012 MFMER | slide-27
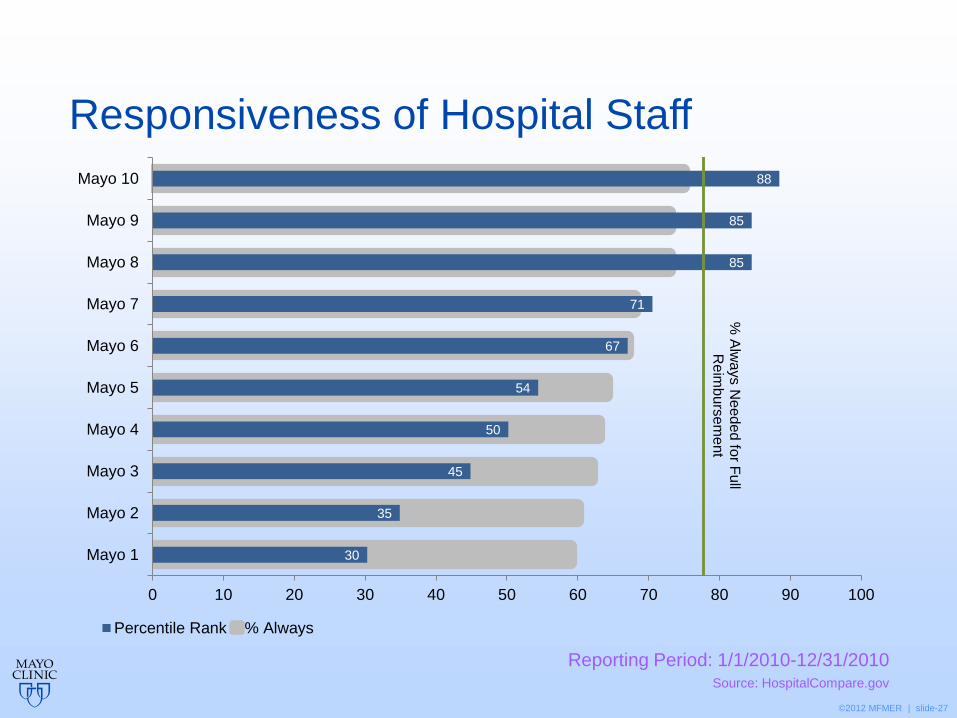
Responsiveness of Hospital Staff
30
35
45
50
54
67
71
85
85
88
% A
lwa
ys N
eed
ed
for F
ull
Re
imb
urs
em
en
t
0 10 20 30 40 50 60 70 80 90 100
Mayo 1
Mayo 2
Mayo 3
Mayo 4
Mayo 5
Mayo 6
Mayo 7
Mayo 8
Mayo 9
Mayo 10
Percentile Rank % Always
Reporting Period: 1/1/2010-12/31/2010
Source: HospitalCompare.gov

©2012 MFMER | slide-28
Synthesize the Information
©2012 MFMER | slide-29
©2012 MFMER | slide-30
Take-aways - Again
• Define critical metrics and identify their source.
• What are you trying to accomplish? How will leadership evaluate your work?
• Be focused and disciplined. And flexible in a dynamic marketplace.
• Develop a scorecard, likely with multi-level reporting.
• Format matters.
©2012 MFMER | slide-31
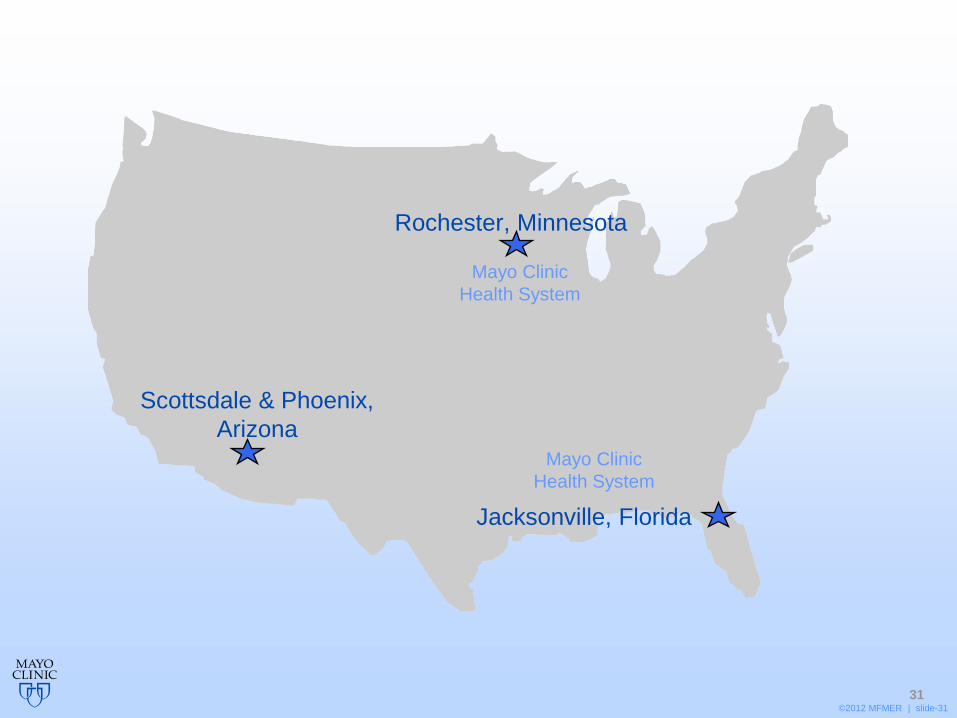
31
Scottsdale & Phoenix,
Arizona
Rochester, Minnesota
Jacksonville, Florida
Mayo Clinic
Health System
Mayo Clinic
Health System

©2012 MFMER | slide-32
Questions & Discussion