Embed Size (px)
Citation preview

(*) David Aikman, Andrew G. Haldane and Sujit kapadia, Bank of England. The authors would like to thank Rafael
Repullo for his excellent comments on an earlier draft of this paper.
This article is the exclusive responsibility of the authors and does not necessarily reflect the opinion of the Banco
de España or the Bank of England.
David Aikman, Andrew G. Haldane and Sujit Kapadia (*)
OPERATIONALISING A MACROPRUDENTIAL REGIME:
GOALS, TOOLS AND OPEN ISSUES

BANCO DE ESPAÑA 11 ESTABILIDAD FINANCIERA, NÚM. 24
OPERATIONALISING A MACROPRUDENTIAL REGIME:
GOALS, TOOLS AND OPEN ISSUES
Since the early 1970s, the probability of systemic crises appears to have been rising. The
costs of systemic crises have risen in parallel. The incidence and scale of systemic crises
have risen to levels never previously seen in financial history [Reinhart and Rogoff (2011)].
It has meant that reducing risks to the financial system as a whole – systemic risks – has
emerged as a top public policy priority.
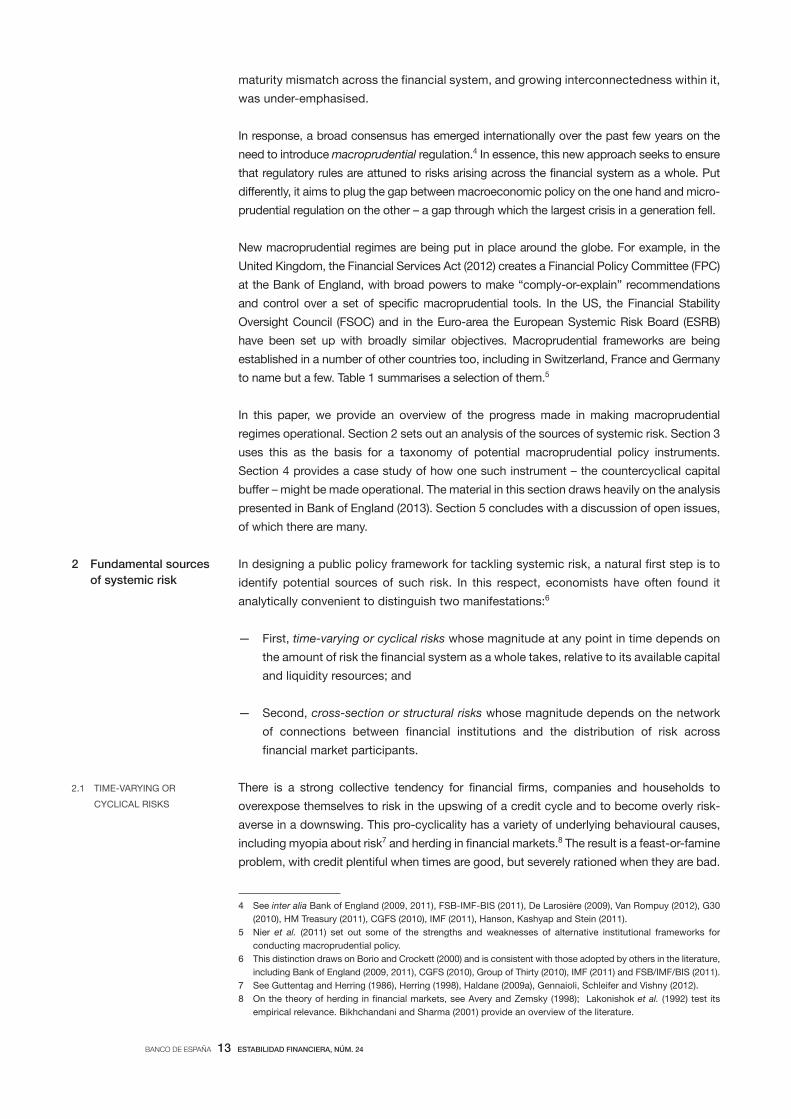
The ongoing financial crisis is the most visible manifestation of this trend. Five years on
from its inception, the level of real output in each of the major industrialised economies
remains significantly below its pre-crisis path (Chart 1). In cumulative terms, crisis-induced
output losses have so far reached almost 60 %, over 40 % and over 30 % of annual pre-
crisis GDP in the UK, Euro-area and US respectively.1
With the benefit of hindsight, the pre-crisis policy framework was ill-equipped to forestall
the build-up in systemic risk which generated these huge costs. Monetary policy
internationally was aimed at balancing nominal demand in line with the supply capacity of
the economy. And microprudential regulation meanwhile focused on the health and
conduct of individual financial institutions. This approach appeared to work well for some
time – we entered a “Great Moderation”.2 Certainly, demand and inflation were stable and
there were few failures of financial institutions.
But at the same time, something dramatic was happening within the financial sector. Global
banks’ balance sheets doubled between 1990 and 2007. In some countries, such as the UK
and Spain, the ballooning of balance sheets was more dramatic still. As financial exuberance
took hold, credit became too cheaply priced. Latent financial vulnerabilities began to emerge.
To some extent, these emerging fault-lines reflected fundamental weaknesses in the
microprudential regime. In particular, regulatory limits on banks’ leverage ratios were set
1 Introduction
1 It could plausibly be argued that these output costs are an overstatement of the damage caused by the financial
crisis as the pre-crisis level may have been unsustainable.
2 See Blanchard and Simon (2001) and Bernanke (2004).
THE SEVERE AND PERSISTENT REAL COSTS OF FINANCIAL CRISES CHART 1
90
95
100
105
110
115
120
125
130
2004 2006 2008 2010 2012
UNITED KINGDOM
Index (2004=100)
13%
90
95
100
105
110
115
120
125
130
2004 2006 2008 2010 2012
EURO AREA
11%
90
95
100
105
110
115
120
125
130
2004 2006 2008 2010 2012
UNITED ESTATES
7%
Index (2004=100) Index (2004=100)
SOURCE: Authors’ calculations.
BANCO DE ESPAÑA 12 ESTABILIDAD FINANCIERA, NÚM. 24
at levels which, with hindsight, were far too low.3 But there are also limits to what prudential
regulation could reasonably achieve as long as it was static and calibrated
to institution-specific balance sheets. With this focus, the build-up of leverage and
3 See Wellink (2011) for a summary of weaknesses in the pre-crisis microprudential regime. Consistent with
regulatory definitions, this paper defines leverage ratios by dividing the relevant measures of capital by assets (e.g.
a leverage ratio of 4%) rather than the reverse (e.g. a leverage ratio of 25 times). But the discussion uses the
standard English language interpretation of associating rising levels of leverage with greater indebtedness – under
the definition used here, this is equivalent to a falling leverage ratio.
Governance Structure Mandate Powers
United Kingdom
Financial Policy
Committee (FPC)
– Chair: Governor of the Bank
of England
– 10 voting members (5 from BoE,
including head of prudential regulator;
head of conduct regulator; 4 external
members), one non-voting HM
Treasury representative
– Meets quarterly
– Protect and enhance the resilience
of the UK nancial system
– Subject to this, support
the government’s economic objectives
including for growth and employment
– Cannot take actions that would
be detrimental to medium-to-long
term growth
– Direction powers over Countercyclical Capital
Buffers and Sectoral Capital Requirements
– Comply-or-explain Recommendation powers
over prudential and conduct regulators
– Recommendations (not comply-or-explain)
to other bodies (eg on regulatory perimeter)
– Measures cannot be directed at individual
institutions
United States
Financial Stability
Oversight Council
(FSOC)
– Chair: US Secretary of the Treasury
– 10 voting and 5 non-voting members
from Federal Reserve and supervisory
agencies
– Meets at least quarterly
– Identify and respond to emerging
threats to nancial stability
– Promote market discipline, eliminate
bailout expectations
– Recommendations to the supervisory
authorities on heightened prudential standards
– Designation of systemically important non-bank
nancial institutions and nancial market utilities
– Reporting to Congress on regulatory gaps
European Union
European Systemic
Risk Board (ESRB)
– Chair: ECB President
– 37 voting members, including central
bank governors, and 28 non-voting
members from supervisory agencies
– Meets quarterly
– Prevent or mitigate systemic risks
to the EU nancial system
– Contribute to smooth functioning
of the internal market and sustainable
nancial sector growth
– Systemic risk warnings and non-binding
recommendations to European
member states
Germany
German Financial
Stability Commission
(Ausschuss für
Finanzstabilität)
– Chair: The Federal Minister of Finance
(or deputy)
– Three representatives from the Ministry
of Finance, three from the Deutsche
Bundesbank; and three from
the BaFin. Non-voting role for
the chairman of the FMSA
– Meets quarterly
Tasks of the Commission include:
– Consideration of decisive issues
for nancial stability
– Strengthening cooperation in a crisis
between institutions represented on
the Commission
– Warnings and recommendations to
the German government, the BaFin,
or any other public sector institution
within Germany. Recipients obliged
to respond within an appropriate timeframe.
– Legal right to request data (forthcoming)
both from reporting entities and other
public authorities
France
Financial Stability
Council (Conseil de
stabilité nancière CSF)
– Chair: Finance Minister
– 9 members (Banque de France
Governor, the Secretary General
and deputy of the prudential supervisor
(ACP), the head of the markets
regulator, the head of the accounting
standards authority and three external
independent members)
– Maintain the stability of the nancial
system and guaranteeing that the
nancial sector makes a sustainable
contribution to economic growth
– Ensure co-operation and exchange
of information among its members
– Recommendations to institutions
represented on the CSF (which
may be published) to prevent threats
to nancial stability. Recipients must inform
the CSF of the actions taken in response
– At the proposal of the Governor of the BdF,
de ning capital requirements on exposures
in France and outside the EEA
– At the proposal of the Governor of the BdF,
stipulating criteria or conditions for loans
issued by banks
Switzerland – The Swiss National Bank has the right
to submit proposals to the Federal
Council, following consultation with
the Swiss Financial Market Supervisory
Authority (FINMA)
– Decision-making power rests with
the Federal Council
– Increase the resilience of the banking
sector and the overall economy against
risks posed by excessive credit growth
– Counter excessive credit growth
and price rises
– Sector-speci c countercyclical capital
buffer targeting residential mortgage lending
Sweden
Council for cooperation
on macroprudential
policy
– Chair: Governor of the Riksbank
– 6 members (a Deputy Governor of the
Riksbank and its Head of Financial
Stability, the Director General,
Chief Economist and Chief Legal
Council of Finansinspektionen,
the microprudential supervisor)
– Meets at least twice a year
SOURCES: Bank of England, Financial Stability Oversight Council, European Systemic Risk Board, Bundesbank, Banque de France, Swiss National Bank and Riksbank.
– Discuss both authorities’ assessments
of systemic risks, appropriate prevention
measures and issues relating to
development of macroprudential policy
in general
Not de ned
A SELECTION OF SYSTEMIC RISK FRAMEWORKS AROUND THE WORLD TABLE 1
BANCO DE ESPAÑA 13 ESTABILIDAD FINANCIERA, NÚM. 24
maturity mismatch across the financial system, and growing interconnectedness within it,
was under-emphasised.
In response, a broad consensus has emerged internationally over the past few years on the
need to introduce macroprudential regulation.4 In essence, this new approach seeks to ensure
that regulatory rules are attuned to risks arising across the financial system as a whole. Put
differently, it aims to plug the gap between macroeconomic policy on the one hand and micro-
prudential regulation on the other – a gap through which the largest crisis in a generation fell.
New macroprudential regimes are being put in place around the globe. For example, in the
United Kingdom, the Financial Services Act (2012) creates a Financial Policy Committee (FPC)
at the Bank of England, with broad powers to make “comply-or-explain” recommendations
and control over a set of specific macroprudential tools. In the US, the Financial Stability
Oversight Council (FSOC) and in the Euro-area the European Systemic Risk Board (ESRB)
have been set up with broadly similar objectives. Macroprudential frameworks are being
established in a number of other countries too, including in Switzerland, France and Germany
to name but a few. Table 1 summarises a selection of them.5
In this paper, we provide an overview of the progress made in making macroprudential
regimes operational. Section 2 sets out an analysis of the sources of systemic risk. Section 3
uses this as the basis for a taxonomy of potential macroprudential policy instruments.
Section 4 provides a case study of how one such instrument – the countercyclical capital
buffer – might be made operational. The material in this section draws heavily on the analysis
presented in Bank of England (2013). Section 5 concludes with a discussion of open issues,
of which there are many.
In designing a public policy framework for tackling systemic risk, a natural first step is to
identify potential sources of such risk. In this respect, economists have often found it
analytically convenient to distinguish two manifestations:6
— First, time-varying or cyclical risks whose magnitude at any point in time depends on
the amount of risk the financial system as a whole takes, relative to its available capital
and liquidity resources; and
— Second, cross-section or structural risks whose magnitude depends on the network
of connections between financial institutions and the distribution of risk across
financial market participants.
There is a strong collective tendency for financial firms, companies and households to
overexpose themselves to risk in the upswing of a credit cycle and to become overly risk-
averse in a downswing. This pro-cyclicality has a variety of underlying behavioural causes,
including myopia about risk7 and herding in financial markets.8 The result is a feast-or-famine
problem, with credit plentiful when times are good, but severely rationed when they are bad.
2 Fundamental sources
of systemic risk
2.1 TIME-VARYING OR
CYCLICAL RISKS
4 See inter alia Bank of England (2009, 2011), FSB-IMF-BIS (2011), De Larosière (2009), Van Rompuy (2012), G30
(2010), HM Treasury (2011), CGFS (2010), IMF (2011), Hanson, Kashyap and Stein (2011).
5 Nier et al. (2011) set out some of the strengths and weaknesses of alternative institutional frameworks for
conducting macroprudential policy.
6 This distinction draws on Borio and Crockett (2000) and is consistent with those adopted by others in the literature,
including Bank of England (2009, 2011), CGFS (2010), Group of Thirty (2010), IMF (2011) and FSB/IMF/BIS (2011).
7 See Guttentag and Herring (1986), Herring (1998), Haldane (2009a), Gennaioli, Schleifer and Vishny (2012).
8 On the theory of herding in financial markets, see Avery and Zemsky (1998); Lakonishok et al. (1992) test its
empirical relevance. Bikhchandani and Sharma (2001) provide an overview of the literature.
BANCO DE ESPAÑA 14 ESTABILIDAD FINANCIERA, NÚM. 24
This credit cycle is not just disruptive in its own right. Historically, it has also tended to
propagate crises. Credit booms have sown the seeds of subsequent credit crunches for
many centuries. The work of Minsky (1986) and Kindleberger (1989) were both attempts to
make sense of these regular patterns in the relationship between credit growth and crises,
drawing on detailed case studies of past financial crises.
Schularik and Taylor (2012) have recently provided some econometric support for this link
between credit and crises. The authors compile a dataset of financial variables from 12
developed economies over almost 140 years. They find credit growth to be the single best
predictor of financial instability over this period. For example, according to their estimates,
a one standard deviation change in real loan growth raises the probability of a crisis by
between two and three percentage points, relative to an in-sample crisis frequency of just
under 4 per cent. Dell’Ariccia et al. (2012) report similar findings using a dataset of 170
countries back to the 1960s. They find that roughly two-thirds of all credit booms are
followed either by a banking crisis or by a period of sub-par economic growth.9
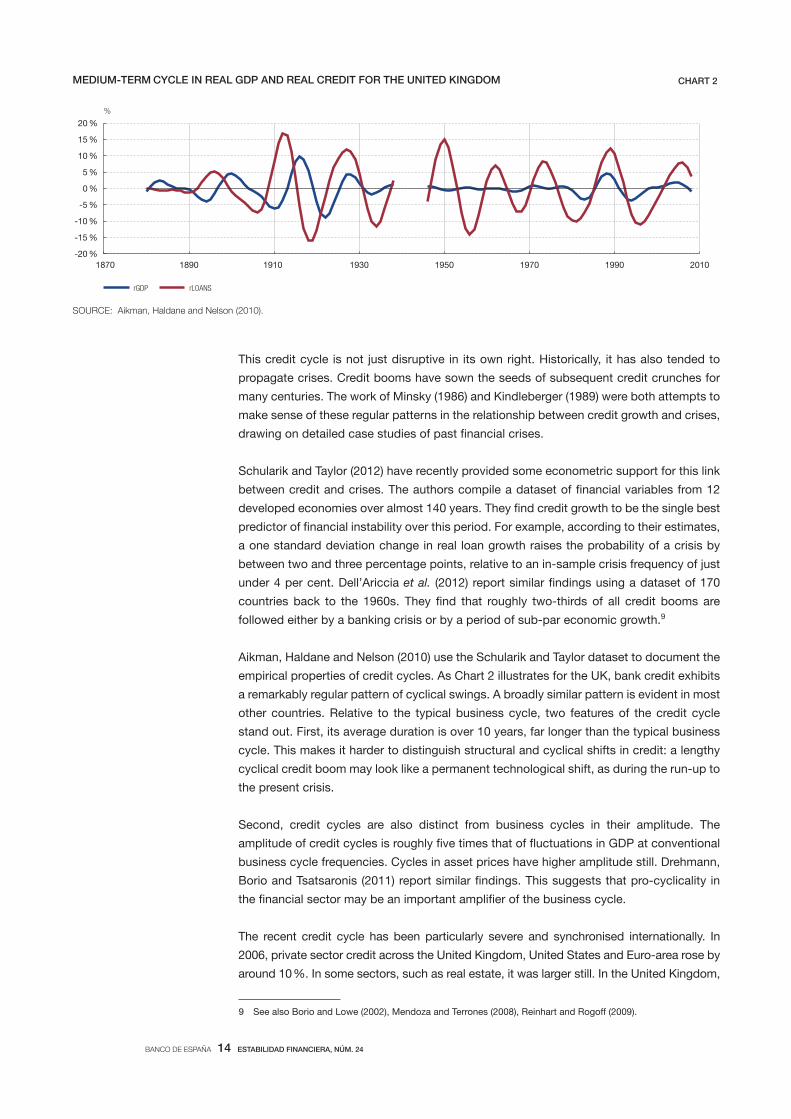
Aikman, Haldane and Nelson (2010) use the Schularik and Taylor dataset to document the
empirical properties of credit cycles. As Chart 2 illustrates for the UK, bank credit exhibits
a remarkably regular pattern of cyclical swings. A broadly similar pattern is evident in most
other countries. Relative to the typical business cycle, two features of the credit cycle
stand out. First, its average duration is over 10 years, far longer than the typical business
cycle. This makes it harder to distinguish structural and cyclical shifts in credit: a lengthy
cyclical credit boom may look like a permanent technological shift, as during the run-up to
the present crisis.
Second, credit cycles are also distinct from business cycles in their amplitude. The
amplitude of credit cycles is roughly five times that of fluctuations in GDP at conventional
business cycle frequencies. Cycles in asset prices have higher amplitude still. Drehmann,
Borio and Tsatsaronis (2011) report similar findings. This suggests that pro-cyclicality in
the financial sector may be an important amplifier of the business cycle.
The recent credit cycle has been particularly severe and synchronised internationally. In
2006, private sector credit across the United Kingdom, United States and Euro-area rose by
around 10 %. In some sectors, such as real estate, it was larger still. In the United Kingdom,
SOURCE: Aikman, Haldane and Nelson (2010).
MEDIUM-TERM CYCLE IN REAL GDP AND REAL CREDIT FOR THE UNITED KINGDOM CHART 2
-20 %
-15 %
-10 %
-5 %
0 %
5 %
10 %
15 %
20 %
1870 1890 1910 1930 1950 1970 1990 2010
rGDP rLOANS
%
9 See also Borio and Lowe (2002), Mendoza and Terrones (2008), Reinhart and Rogoff (2009).
BANCO DE ESPAÑA 15 ESTABILIDAD FINANCIERA, NÚM. 24
the stock of credit extended to commercial real estate companies doubled between 2002
and 2008; in Spain and Ireland, construction accounted for 20 per cent of the level of GDP
in 2007. When the bubble burst, the flow of private credit collapsed.
These credit booms and busts tend, historically, to have been amplified by four factors, all
of which were present in the current crisis. First excessive leverage, especially in the
banking system. When a credit boom is funded by banks operating at low levels of capital,
the consequence is a heightened risk of subsequent banking sector distress when
imbalances unravel. Leverage was a very important amplifier of both the recent credit
boom and bust. A comparison with the late-1990s technology bubble is instructive here.
The collapse of dotcom shares led to significant market volatility, but it was the wave of
defaults on telecom debt that threatened banking stability.10
A second factor that intensifies credit booms and busts is maturity transformation. Funding
long-term assets with short-term liabilities can be socially efficient and welfare-improving.11
But taken to excess, this can expose banks to the risk of runs and the possibility that they
might need to contract wholesale lending, hoard liquidity or sell assets at depressed market
prices to meet actual or prospective withdrawals. Prior to the crisis, many banks reduced
their holdings of liquid assets and became increasingly reliant on funding at shorter
maturities. This amplified the credit cycle, with the growth of bank balance sheets highly
correlated with the proportion of funding sourced from short-term wholesale deposits.12
When the crisis hit, flighty sources of funding disappeared, putting further pressure on
banks’ liquidity and solvency.
A third factor is intra-financial system activity. Links between financial institutions can
help manage risk and distribute funds to where they can be most efficiently deployed. But
cyclicality in such interconnectedness can also fuel credit booms. For example, in the pre-
crisis period, securitisation was perceived to have dispersed risk around the system. But
it reduced incentives for banks to screen and monitor lending, exacerbating over-
borrowing.13 It also lengthened the intermediation chain, masking a significant increase in
leverage and maturity transformation across the system.14
Fourth, the credit cycle can be amplified by a relaxation of the terms and conditions on
transactions in financial markets. In the pre-crisis period, lending spreads fell for both the
household and corporate sectors, while the share of new mortgages extended at high LTV
and LTI ratios rose sharply.15 This contributed to the bubble in real estate lending in a
number of countries, including the US, UK and Spain. Terms in wholesale borrowing
markets also became progressively more lax, as did margining requirements on secured
financing and derivatives transactions. The reversal of these trends was a major contributory
factor to the collapse in interbank markets and the credit crunch.
The systemic consequences of shocks to asset prices and activity also depend importantly
on structural features of the financial sector. These include the distribution or concentration
2.2 CROSS SECTION OR
STRUCTURAL RISKS
10 See Mishkin (2008).
11 See Diamond and Dybvig (1983).
12 Financial Services Authority (2009).
13 Consistent with this, Keys et al. (2010) observe that low documentation subprime mortgage loans with FICO
scores just above 620 defaulted 20% more frequently than their counterparts with scores just below 620 – the
former category were significantly easier to sell to investors via securitisations than the latter.
14 See Hellwig (1995).
15 For example, in the United States typical LTV ratios rose prior to the crisis, with higher LTV ratios subsequently
associated with higher default rates.
BANCO DE ESPAÑA 16 ESTABILIDAD FINANCIERA, NÚM. 24
of risk across the financial system and the opacity (lack of information) and complexity
(difficulty of assessing information) of financial products, institutions and the connections
between them. All of these ingredients were important in the run-up to the crisis.
When risk is concentrated in a small number of institutions or markets, or when the provision
of financial services is highly concentrated, the system is likely to be more vulnerable than if
risks and the provision of services are more evenly distributed. As illustrated by the experiences
of AIG and Lehman Brothers in the current crisis and Long-Term Capital Management and
Credit Anstalt further back in history, distress or failure of a systemically important entity that
is “too big to fail” can trigger spillovers to financial institutions or the wider economy which far
exceed the contagion generated by the collapse of peripheral players.16 In other words, there
are network externalities associated with the failure of key nodes in the financial system.
These externalities arise because individual institutions or infrastructure providers typically fail
to take sufficient account of the effects of their own actions, or failure, on others within the
system. This leads to under-insurance against systemic risk. Systemic significance may also
give rise to expectations of state support, which further distort perceptions of risk by lowering
the cost of funding that such institutions face.17 This supported rapid balance sheet expansion
in the lead-up to the crisis. When such institutions subsequently failed during the crisis, they
were provided state support to cushion their contagious consequences. In the UK, US and the
Euro-area, state support of various types to financial institutions peaked at over 50 % of GDP.
Systemic risk can also be generated by the opacity and complexity of institutions, markets
and financial instruments. These factors hinder the effective operation of market discipline to
limit risk and potentially contribute to perception-driven contagion. Complexity also makes
financial institutions more difficult to resolve. Pre-crisis, financial innovation spawned many
examples of such complexity. For example, uncertainty over off-balance sheet exposures
and banks’ widely differing valuations of the same complex structured products led investors
to lose faith in published balance sheets and to reduce their appetite for complex financial
products and institutions.
Innovation linked to complex trading strategies may also contribute to market stress. For
example, high-frequency trading strategies have been highlighted for their role in amplifying
the 6 May 2010 US “flash crash”. There is evidence that such strategies can drive withdrawals
of liquidity, amplifying stress. More generally, algorithmic trading strategies can lead to
destabilising feedback loops, which in turn may lead to sharp price falls, possibly across a
wide range of market venues.
Given these different sources of systemic risk, a range of different types of macroprudential
tools may be needed to tackle them.18 Prospective macroprudential tools can be roughly
categorised three ways:19
— Those that operate on financial institutions’ balance sheets;
— Those that affect the terms and conditions on financial transactions;
— Those that influence market structures.
3 Tools to tackle
systemic risk
16 See Haldane (2009b), Gai et al. (2011) and Arinaminpathy et al. (2012).
17 Noss and Sowerbutts (2012) quantify the value of this implicit subsidy for UK banks.
18 See also Hanson, Kashyap and Stein (2011) and Berntsson and Molin (2012).
19 See Bank of England (2011).
BANCO DE ESPAÑA 17 ESTABILIDAD FINANCIERA, NÚM. 24
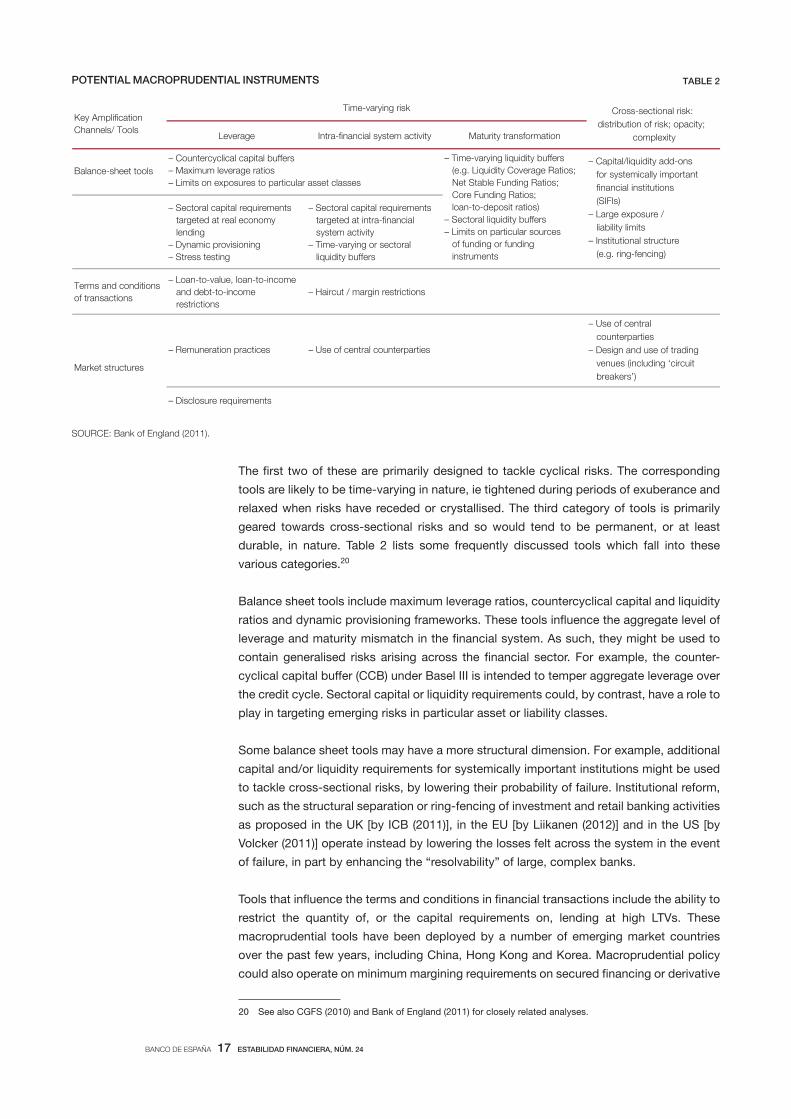
The first two of these are primarily designed to tackle cyclical risks. The corresponding
tools are likely to be time-varying in nature, ie tightened during periods of exuberance and
relaxed when risks have receded or crystallised. The third category of tools is primarily
geared towards cross-sectional risks and so would tend to be permanent, or at least
durable, in nature. Table 2 lists some frequently discussed tools which fall into these
various categories.20
Balance sheet tools include maximum leverage ratios, countercyclical capital and liquidity
ratios and dynamic provisioning frameworks. These tools influence the aggregate level of
leverage and maturity mismatch in the financial system. As such, they might be used to
contain generalised risks arising across the financial sector. For example, the counter-
cyclical capital buffer (CCB) under Basel III is intended to temper aggregate leverage over
the credit cycle. Sectoral capital or liquidity requirements could, by contrast, have a role to
play in targeting emerging risks in particular asset or liability classes.
Some balance sheet tools may have a more structural dimension. For example, additional
capital and/or liquidity requirements for systemically important institutions might be used
to tackle cross-sectional risks, by lowering their probability of failure. Institutional reform,
such as the structural separation or ring-fencing of investment and retail banking activities
as proposed in the UK [by ICB (2011)], in the EU [by Liikanen (2012)] and in the US [by
Volcker (2011)] operate instead by lowering the losses felt across the system in the event
of failure, in part by enhancing the “resolvability” of large, complex banks.
Tools that influence the terms and conditions in financial transactions include the ability to
restrict the quantity of, or the capital requirements on, lending at high LTVs. These
macroprudential tools have been deployed by a number of emerging market countries
over the past few years, including China, Hong Kong and Korea. Macroprudential policy
could also operate on minimum margining requirements on secured financing or derivative
Leverage Intra- nancial system activity Maturity transformation
Balance-sheet tools
– Sectoral capital requirements targeted at real economy lending– Dynamic provisioning – Stress testing
– Sectoral capital requirements targeted at intra- nancial system activity– Time-varying or sectoral liquidity buffers
Terms and conditions of transactions
– Loan-to-value, loan-to-income and debt-to-income restrictions
– Haircut / margin restrictions
– Remuneration practices – Use of central counterparties
– Use of central counterparties – Design and use of trading venues (including ‘circuit breakers’)
– Disclosure requirements
SOURCE: Bank of England (2011).
Market structures
Key Ampli cation Channels/ Tools
Time-varying risk Cross-sectional risk: distribution of risk; opacity;
complexity
– Countercyclical capital buffers– Maximum leverage ratios– Limits on exposures to particular asset classes
– Capital/liquidity add-ons for systemically important nancial institutions (SIFIs)– Large exposure / liability limits– Institutional structure (e.g. ring-fencing)
– Time-varying liquidity buffers (e.g. Liquidity Coverage Ratios; Net Stable Funding Ratios; Core Funding Ratios; loan-to-deposit ratios)– Sectoral liquidity buffers– Limits on particular sources of funding or funding instruments
POTENTIAL MACROPRUDENTIAL INSTRUMENTS TABLE 2
20 See also CGFS (2010) and Bank of England (2011) for closely related analyses.
BANCO DE ESPAÑA 18 ESTABILIDAD FINANCIERA, NÚM. 24
transactions within the financial system – the wholesale market equivalent of minimum LTV
ratios [CGFS (2009)].
The third category of macroprudential tools – market structure – includes a variety of
interventions aimed at altering the topology of the financial network. For example, targeted
disclosure requirements can be used to reduce uncertainty about specific exposures or
interconnections, which may amplify cyclical or structural risks. The structure of remuneration
practices could be used to influence risk-taking incentives by managers of financial firms.
And the design and use of organised trading platforms and/or obligations to clear trades
through central counterparties could bolster the resilience of markets that are central to the
smooth functioning of the financial system.
How might macroprudential policy be operated in practice? In this section, we consider the
tasks involved in operationalising one particular macroprudential tool: the countercyclical
buffer (CCB). 21 The CCB introduces a time-varying capital buffer over and above normal
microprudential standards in relation to banks’ domestic exposures. It can be raised during
periods of exuberance and subsequently reduced.22 The implementation of this tool
requires: a) a risk assessment process; b) a procedure for reaching decisions, explaining
those decisions to the public, coordinating with other relevant bodies – including systemic
risk authorities in other countries – and enforcing decisions with firms; and c) an assessment
of the possible impact of those decisions on financial stability and growth. In what follows,
we describe progress in the UK towards developing a framework for carrying out each of
these steps. The material in this section draws heavily on the analysis presented in Bank of
England (2013).
There are many different approaches for identifying threats to the financial system. Many
authorities use indicator dashboards or cobwebs, including the European Systemic Risk
Board, the Office of Financial Research in the United States, the World Bank, the Reserve
Bank of New Zealand and the Norges Bank.23 Stress testing aims to explore the resilience
of the financial system under various adverse scenarios.24 Other modelling approaches
include early-warning leading indicator models, composite indicators of systemic risk, and
Merton-based models of systemic risk that use contingent claims analysis.25
Given the complexity and state-contingency of signals from indicators and models, it
would not make sense to tie movements in the CCB mechanically to any specific set of
indicators or models. At the same time, the Bank of England’s new Financial Policy
Committee (FPC) has identified a relatively short list of core financial and economic
indicators that it will routinely review to help guide decisions to adjust the CCB. These
are intended to help anchor policy actions, provide some consistency to decision-
making and give a basis for explaining actions to an external audience. They help
enhance the predictability of the regime and reinforce the signalling channel of
macroprudential policy.
4 Case study:
operationalising
countercyclical capital
buffers in the UK
4.1 RISK ASSESSMENT AND
INDICATORS TO GUIDE
DECISION-MAKING
21 See Juks and Melander (2012) for a similar analysis for the case of Sweden.
22 The design features of the CCB are prescribed in some detail in Basel III and, in Europe, the forthcoming CRDIV/
CRR. For further details on the specification of this tool in the United Kingdom, see Bank of England (2013).
23 For the US, see section 3 of the OFR Annual Report (2012). The ESRB’s Risk Dashboard’ is published on the web
(see http://www.esrb.europa.eu/pub/rd/html/index.en.html). On the cobweb approach used in New Zealand and
Norway, see Bedford and Bloor (2009) and Dahl et al. (2011), respectively.
24 See Aikman et al. (2009), Burrows et al. (2012) and Kapadia et al. (2013) for a discussion of the Bank of England’s
approach to stress testing and its “RAMSI” model.
25 On early warning indicator models, see Kaminsky and Reinhart (1999), Drehmann et al. (2011), Borio and Lowe
(2002, 2004) and Barrell et al. (2010). On composite indicator models, see Illing and Liu (2006) and Holló et al. (2012).
On contingent claims models, see Gray et al. (2008) and Gray and Jobst (2011).
BANCO DE ESPAÑA 19 ESTABILIDAD FINANCIERA, NÚM. 24
The full set of indicators is discussed in detail in Bank of England (2013); a brief overview
is given below. Particular emphasis is placed on simple, high-level indicators rather than
more complex metrics. As well as being important for transparency and accountability
reasons, some empirical evidence and case studies suggest that simple indicators can
often out-perform more complex alternatives in their predictive power due to their greater
robustness in the face of uncertainty.26
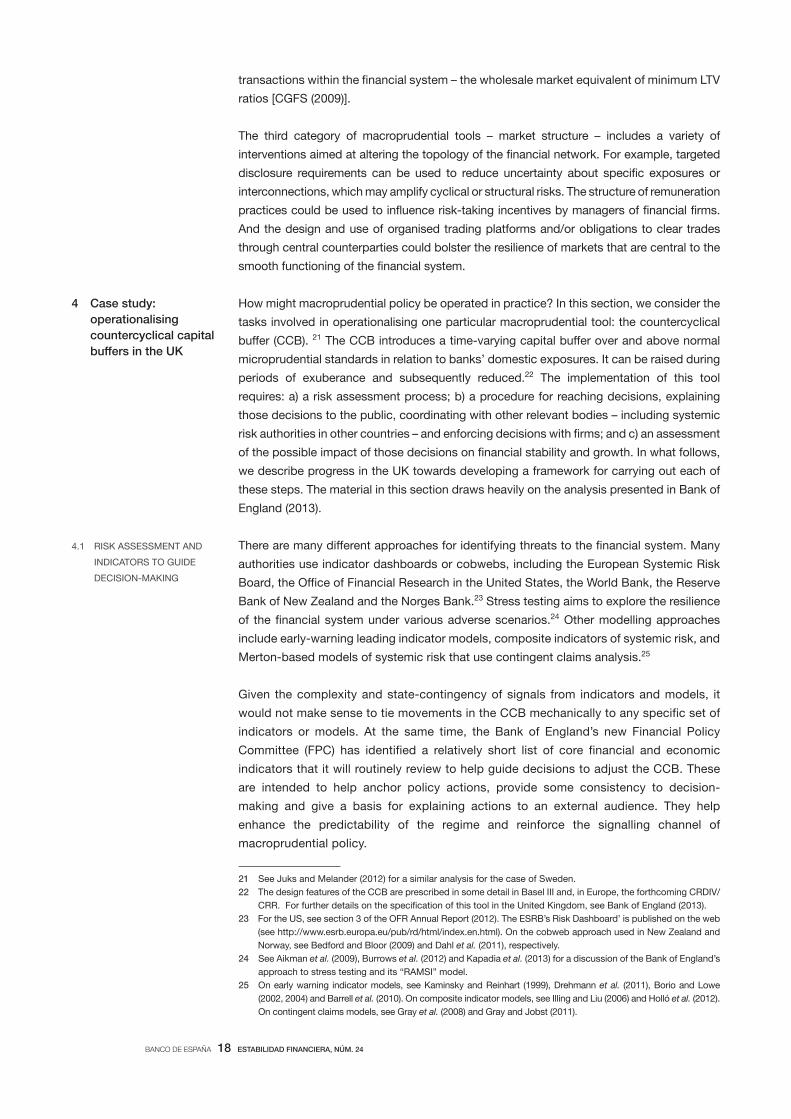
A natural starting point is the so-called “credit-to-GDP gap”, defined as the deviation of
the ratio of household and corporate indebtedness to GDP from its long term trend. This
is given particular prominence in Basel III. It has been found to be a useful leading indicator
of past crises in many countries within sample.27 In the United Kingdom, it performed well
in signalling emerging vulnerabilities in advance of each of the last three major episodes of
financial distress (Chart 3). Prior to the current crisis, it would have suggested activating
the CCB as early as 2002. It also would have suggested activating the CCB ahead of the
UK secondary banking crisis in the 1970s and the small banks’ crisis in the early 1990s.28
As discussed by Bank of England (2013, Box 2) and Giese et al. (2013), however, it is
important to augment the information in the credit-to-GDP gap with a range of complementary
indicators. This partly reflects its poorer ability to signal the possible need to reduce the
CCB in the face of deteriorating credit conditions (Chart 3). The indicator also fails to
account for the absolute level of credit and is agnostic on the sources or quality of credit.
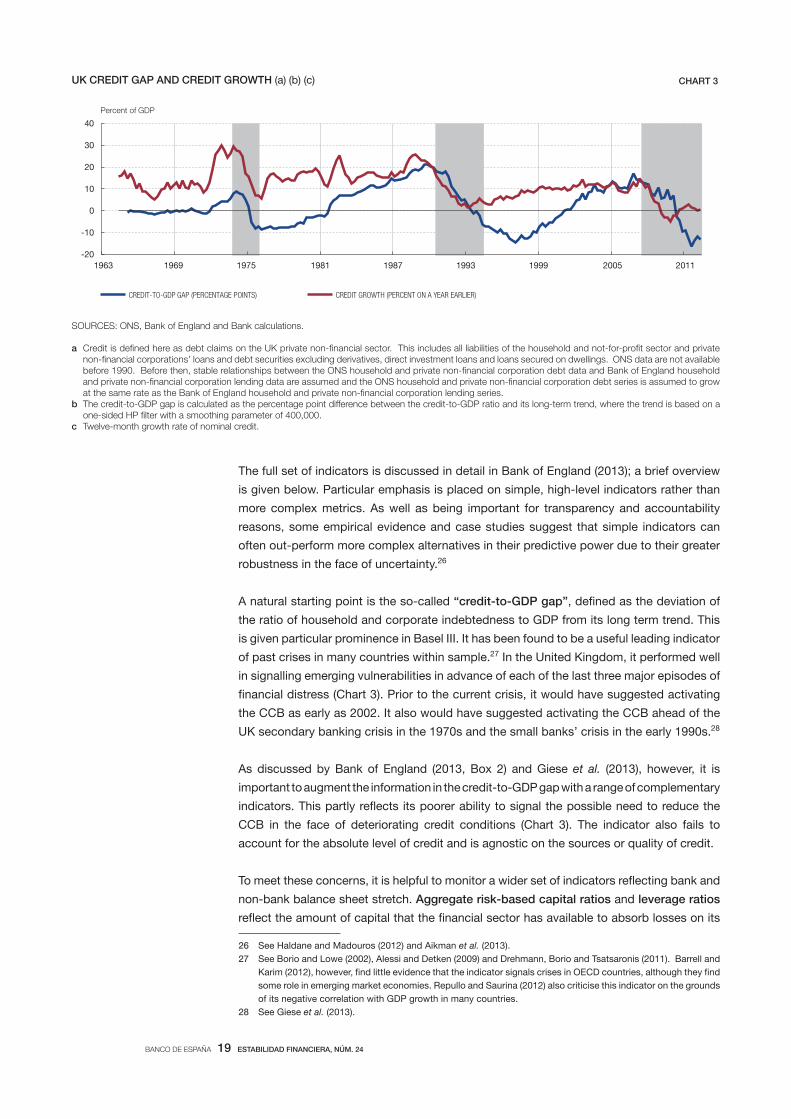
To meet these concerns, it is helpful to monitor a wider set of indicators reflecting bank and
non-bank balance sheet stretch. Aggregate risk-based capital ratios and leverage ratios
reflect the amount of capital that the financial sector has available to absorb losses on its
UK CREDIT GAP AND CREDIT GROWTH (a) (b) (c) CHART 3
-20
-10
0
10
20
30
40
1963 1969 1975 1981 1987 1993 1999 2005 2011
CREDIT-TO-GDP GAP (PERCENTAGE POINTS) CREDIT GROWTH (PERCENT ON A YEAR EARLIER)
Percent of GDP
SOURCES: ONS, Bank of England and Bank calculations.
a
b
c
26 See Haldane and Madouros (2012) and Aikman et al. (2013).
27 See Borio and Lowe (2002), Alessi and Detken (2009) and Drehmann, Borio and Tsatsaronis (2011). Barrell and
Karim (2012), however, find little evidence that the indicator signals crises in OECD countries, although they find
some role in emerging market economies. Repullo and Saurina (2012) also criticise this indicator on the grounds
of its negative correlation with GDP growth in many countries.
28 See Giese et al. (2013).
BANCO DE ESPAÑA 20 ESTABILIDAD FINANCIERA, NÚM. 24
assets, on a risk-weighted and unweighted basis respectively. A rapid build-up in leverage
(i.e. a fall in leverage ratios) in the major UK banks was an important driver of the current
financial crisis (Chart 4). Risk-based capital ratios tended to provide poorer signals before
this crisis, particularly for larger banks29 ; their failure to signal impending problems reflected
a secular decline in average risk weights. Some studies from earlier episodes, however,
have tended to find a more positive role for risk-based standards in predicting bank failure.30
Going forward, there is likely to be value in monitoring both metrics in determining whether
banks have sufficient buffers to absorb future losses during periods of stress. And since
profits are the first line of defence against losses, simple measures of the core profitability
of the banking system, such as the pre-tax return on assets, are also likely to be useful in
such circumstances.
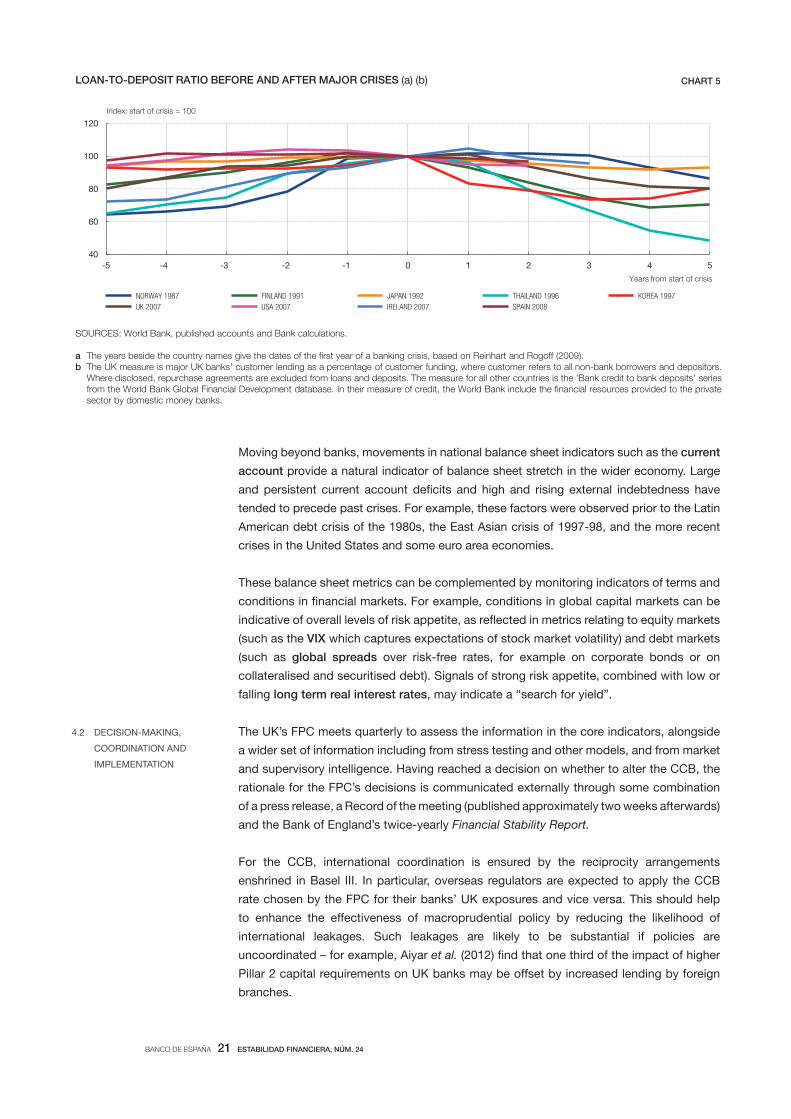
Another helpful indicator of banks’ balance sheet stretch is the loan-to-deposit ratio,
which provides a signal of whether the provision of credit has become too reliant on
unstable funding sources. Rising loan-to-deposit ratios were evident in many countries
prior to this crisis. This indicator also performed well in signalling impending distress in
East Asia in 1997-98 (Chart 5).
Market-based metrics can provide corroborative evidence on perceptions of banking sector
health. Spreads on bank debt, such as subordinated debt spreads and CDS on senior
unsecured debt, indicate financial market participants’ assessment of the likelihood of
bank failure. The views of equity market investors, meanwhile, can be gauged by considering
banks’ price to book ratios and market-based leverage ratios. But these indicators need
to be interpreted with caution. In periods of exuberance, they may be subject to significant
mispricing or indeed even a “volatility paradox”: times of low volatility may be associated
with a build up of leverage, which increases systemic risk.
29 Haldane and Madouros (2012).
30 See Avery and Berger (1991 and Estrella, Park and Peristiani (2000).
UK BANKS LEVERAGE RATIOS (a) CHART 4
0
2
4
6
8
10
12
14
1980 1986 1992 1998 2004 2010
INTERQUARTILE RANGE RANGE MEAN (b) BASEL III DEFINITION (c)
Percent
SOURCES: Published accounts, FSA supervisory data and Bank calculations.
a The mean and ranges shown are based on the simple leverage ratio de ned as the ratio of shareholders’ claims to total assets based on banks’ published accounts (note a discontinuity due to introduction of IFRS accounting standards in 2005, which tends to reduce leverage ratios thereafter). Data exclude Northern Rock from 2008.
b Weighted by total assets.c The 'Basel III leverage ratio', from end-2011 onwards, is calculated as aggregate peer group Tier 1 capital over aggregate leverage ratio exposure, according
to the proposed Basel III de nition. However, Tier 1 capital includes some ‘grandfathered’ instruments which will no longer be eligible after the full transition in 2019. The Basel III sample includes Barclays, HSBC, Lloyds Banking Group, RBS, Nationwide, Santander UK and Co-operative bank. Last data point is October 2012.
BANCO DE ESPAÑA 21 ESTABILIDAD FINANCIERA, NÚM. 24
Moving beyond banks, movements in national balance sheet indicators such as the current
account provide a natural indicator of balance sheet stretch in the wider economy. Large
and persistent current account deficits and high and rising external indebtedness have
tended to precede past crises. For example, these factors were observed prior to the Latin
American debt crisis of the 1980s, the East Asian crisis of 1997-98, and the more recent
crises in the United States and some euro area economies.
These balance sheet metrics can be complemented by monitoring indicators of terms and
conditions in financial markets. For example, conditions in global capital markets can be
indicative of overall levels of risk appetite, as reflected in metrics relating to equity markets
(such as the VIX which captures expectations of stock market volatility) and debt markets
(such as global spreads over risk-free rates, for example on corporate bonds or on
collateralised and securitised debt). Signals of strong risk appetite, combined with low or
falling long term real interest rates, may indicate a “search for yield”.
The UK’s FPC meets quarterly to assess the information in the core indicators, alongside
a wider set of information including from stress testing and other models, and from market
and supervisory intelligence. Having reached a decision on whether to alter the CCB, the
rationale for the FPC’s decisions is communicated externally through some combination
of a press release, a Record of the meeting (published approximately two weeks afterwards)
and the Bank of England’s twice-yearly Financial Stability Report.
For the CCB, international coordination is ensured by the reciprocity arrangements
enshrined in Basel III. In particular, overseas regulators are expected to apply the CCB
rate chosen by the FPC for their banks’ UK exposures and vice versa. This should help
to enhance the effectiveness of macroprudential policy by reducing the likelihood of
international leakages. Such leakages are likely to be substantial if policies are
uncoordinated – for example, Aiyar et al. (2012) find that one third of the impact of higher
Pillar 2 capital requirements on UK banks may be offset by increased lending by foreign
branches.
4.2 DECISION-MAKING,
COORDINATION AND
IMPLEMENTATION
SOURCES: World Bank, published accounts and Bank calculations.
a The years beside the country names give the dates of the rst year of a banking crisis, based on Reinhart and Rogoff (2009).b The UK measure is major UK banks' customer lending as a percentage of customer funding, where customer refers to all non-bank borrowers and depositors.
Where disclosed, repurchase agreements are excluded from loans and deposits. The measure for all other countries is the 'Bank credit to bank deposits' series from the World Bank Global Financial Development database. In their measure of credit, the World Bank include the nancial resources provided to the private sector by domestic money banks.
LOAN-TO-DEPOSIT RATIO BEFORE AND AFTER MAJOR CRISES (a) (b) CHART 5
40
60
80
100
120
-5 -4 -3 -2 -1 0 1 2 3 4 5
NORWAY 1987 FINLAND 1991 JAPAN 1992 THAILAND 1996 KOREA 1997 UK 2007 USA 2007 IRELAND 2007 SPAIN 2008
Index: start of crisis = 100
Years from start of crisis
BANCO DE ESPAÑA 22 ESTABILIDAD FINANCIERA, NÚM. 24
For other macroprudential actions, it will also be important to consider possible cross-
country spillovers when reaching macroprudential decisions. The forthcoming Capital
Requirements Directive and Regulation will institutionalise a coordination process within
the EU to assess such spillovers, including the potentially negative spillovers from failing
to act in a timely fashion to mitigate domestic systemic risks – it is important to balance
policy coordination with a need to avoid inaction bias.
Once policy action on the CCB has been agreed, banks will typically have twelve months to
meet any increase in the CCB – although a shorter implementation period may be
recommended to the regulators in exceptional circumstances. Banks that fail to meet the
buffer level in the required time, or breach it subsequently, will be subject to automatic
restrictions on dividends and discretionary bonuses and will be required to prepare a plan
explaining how they will meet the buffer level within an appropriate timeframe.31 It will be the
responsibility of the microprudential authority to monitor compliance and to impose further
supervisory measures if needed. A decision to decrease the CCB can take effect immediately.
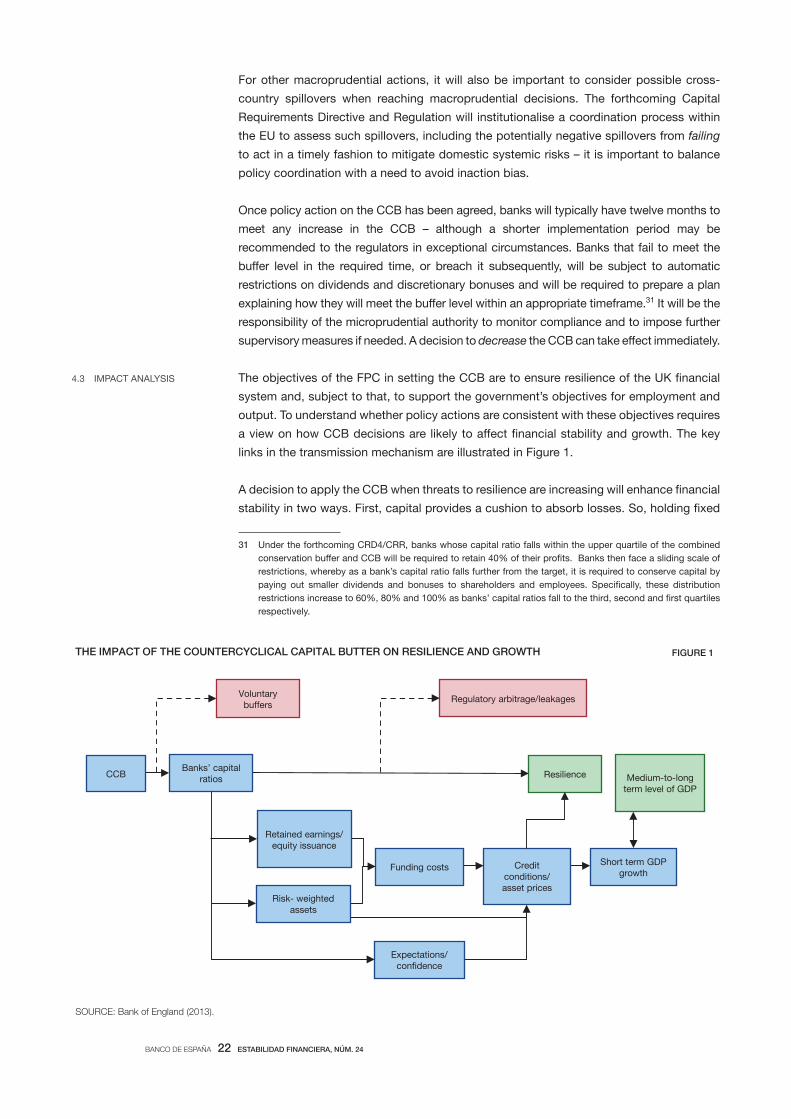
The objectives of the FPC in setting the CCB are to ensure resilience of the UK financial
system and, subject to that, to support the government’s objectives for employment and
output. To understand whether policy actions are consistent with these objectives requires
a view on how CCB decisions are likely to affect financial stability and growth. The key
links in the transmission mechanism are illustrated in Figure 1.
A decision to apply the CCB when threats to resilience are increasing will enhance financial
stability in two ways. First, capital provides a cushion to absorb losses. So, holding fixed
4.3 IMPACT ANALYSIS
SOURCE: Bank of England (2013).
THE IMPACT OF THE COUNTERCYCLICAL CAPITAL BUTTER ON RESILIENCE AND GROWTH
CCB
Voluntary buffers
Banks’ capital ratios Medium-to-long
term level of GDP
Regulatory arbitrage/leakages
Resilience
THE IMPACT OF THE COUNTERCYCLICAL CAPITAL BUTTER ON RESILIENCE AND GROWTH FIGURE 1
Retained earnings/ equity issuance
Risk- weighted assets
Credit conditions/ asset prices
Expectations/ con dence
Funding costs Short term GDP
growth
31 Under the forthcoming CRD4/CRR, banks whose capital ratio falls within the upper quartile of the combined
conservation buffer and CCB will be required to retain 40% of their profits. Banks then face a sliding scale of
restrictions, whereby as a bank’s capital ratio falls further from the target, it is required to conserve capital by
paying out smaller dividends and bonuses to shareholders and employees. Specifically, these distribution
restrictions increase to 60%, 80% and 100% as banks’ capital ratios fall to the third, second and first quartiles
respectively.
BANCO DE ESPAÑA 23 ESTABILIDAD FINANCIERA, NÚM. 24
banks’ asset and liability positions, a change in the CCB will have the direct effect of
increasing the loss absorbing capacity of the banking system, reducing the likelihood and
severity of financial crises. This effect is shown in Figure 1 by the central arrows linking
capital ratios to resilience and medium-to-long term GDP. While the precise magnitude of
this channel is uncertain, there are strong a priori grounds for expecting the sign to be
positive – greater capital reduces the likelihood of crisis.32
Second, the CCB will also affect financial stability through its impact on credit conditions.
This size of this channel will depend on various factors including the sensitivity of risk
premia on bank debt and equity to banks’ leverage,33 the ease with which banks are able
to raise fresh equity in capital markets or adjust retained earnings, the stickiness of loan
interest rates and the degree of competition in the banking sector.
For example, if capital buffers are increased in the midst of a credit boom, then the tighter
credit conditions that follow may boost financial stability by helping to arrest the build-up
of vulnerabilities created by the over-extension of credit. Similarly, if previously accumulated
capital buffers are reduced in the midst of a contraction, then that may help to loosen
credit conditions, so boosting the economy and thereby helping to reduce borrower
defaults. This channel is shown by the arrow in Figure 1, linking credit conditions to short-
term GDP growth. Of course, the strength of these effects may vary depending on whether
policy is being tightened or loosened – we come on to discuss such asymmetries in the
transmission mechanism in Section 5.1.
The effect of these tools on risk-taking behaviour is likely to be more powerful if financial
markets anticipate that the policy change will be reinforced by further policy changes in
these measures. As in other areas of public policy, there could be an important role for
expectations in shaping this collective behaviour. This “signalling channel” of macroprudential
policy is depicted in Figure 1 by the arrows running from capital ratios through to credit
conditions, via the box marked “expectations”, and then on to resilience.
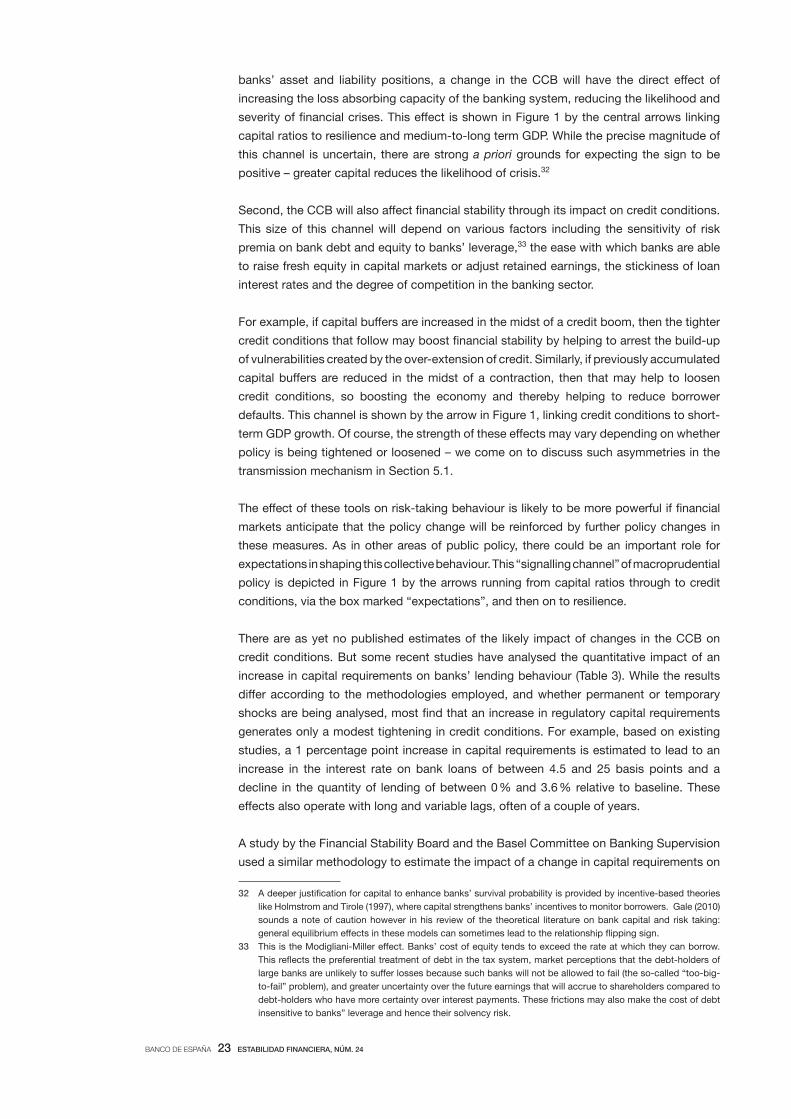
There are as yet no published estimates of the likely impact of changes in the CCB on
credit conditions. But some recent studies have analysed the quantitative impact of an
increase in capital requirements on banks’ lending behaviour (Table 3). While the results
differ according to the methodologies employed, and whether permanent or temporary
shocks are being analysed, most find that an increase in regulatory capital requirements
generates only a modest tightening in credit conditions. For example, based on existing
studies, a 1 percentage point increase in capital requirements is estimated to lead to an
increase in the interest rate on bank loans of between 4.5 and 25 basis points and a
decline in the quantity of lending of between 0 % and 3.6 % relative to baseline. These
effects also operate with long and variable lags, often of a couple of years.
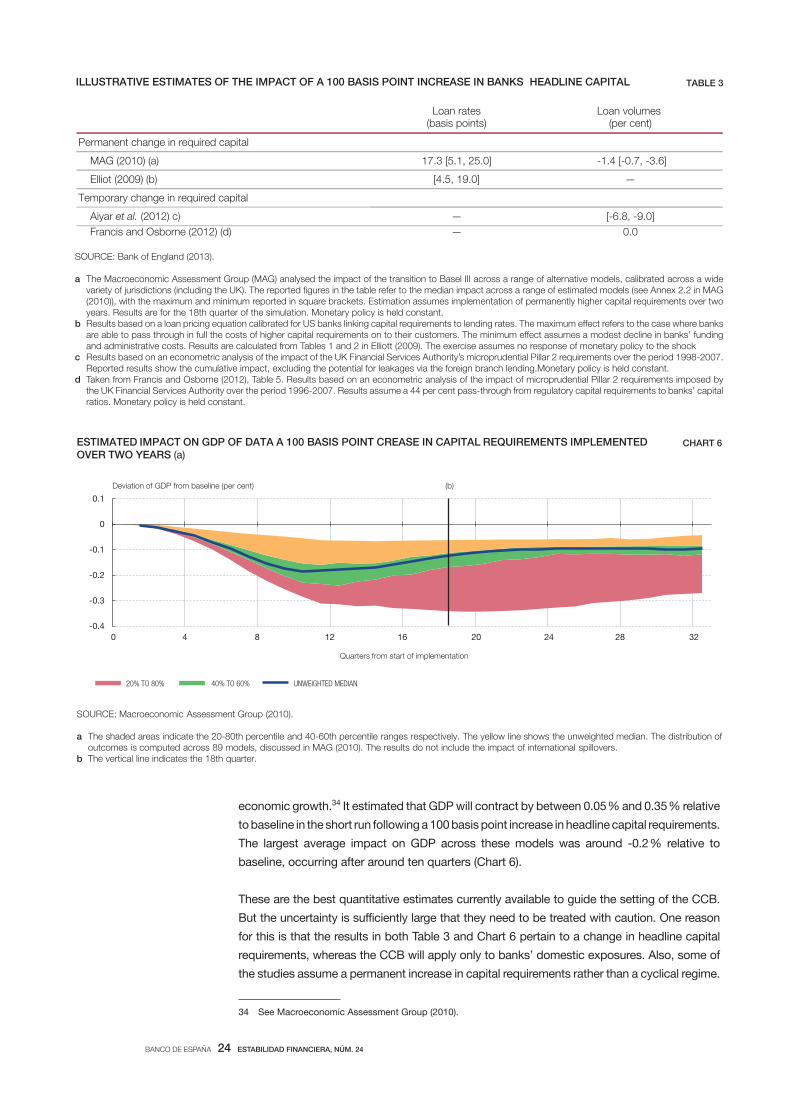
A study by the Financial Stability Board and the Basel Committee on Banking Supervision
used a similar methodology to estimate the impact of a change in capital requirements on
32 A deeper justification for capital to enhance banks’ survival probability is provided by incentive-based theories
like Holmstrom and Tirole (1997), where capital strengthens banks’ incentives to monitor borrowers. Gale (2010)
sounds a note of caution however in his review of the theoretical literature on bank capital and risk taking:
general equilibrium effects in these models can sometimes lead to the relationship flipping sign.
33 This is the Modigliani-Miller effect. Banks’ cost of equity tends to exceed the rate at which they can borrow.
This reflects the preferential treatment of debt in the tax system, market perceptions that the debt-holders of
large banks are unlikely to suffer losses because such banks will not be allowed to fail (the so-called “too-big-
to-fail” problem), and greater uncertainty over the future earnings that will accrue to shareholders compared to
debt-holders who have more certainty over interest payments. These frictions may also make the cost of debt
insensitive to banks” leverage and hence their solvency risk.
BANCO DE ESPAÑA 24 ESTABILIDAD FINANCIERA, NÚM. 24
economic growth.34 It estimated that GDP will contract by between 0.05 % and 0.35 % relative
to baseline in the short run following a 100 basis point increase in headline capital requirements.
The largest average impact on GDP across these models was around -0.2 % relative to
baseline, occurring after around ten quarters (Chart 6).
These are the best quantitative estimates currently available to guide the setting of the CCB.
But the uncertainty is sufficiently large that they need to be treated with caution. One reason
for this is that the results in both Table 3 and Chart 6 pertain to a change in headline capital
requirements, whereas the CCB will apply only to banks’ domestic exposures. Also, some of
the studies assume a permanent increase in capital requirements rather than a cyclical regime.
SOURCE: Bank of England (2013).
a The Macroeconomic Assessment Group (MAG) analysed the impact of the transition to Basel III across a range of alternative models, calibrated across a wide
b
c
d
ratios. Monetary policy is held constant.
Loan rates(basis points)
Loan volumes (per cent)
ermanent change in re uired capital
MAG (2010) (a) .3 [5.1, 25.0] 1. [ 0. , 3.6]
Elliot (2009) (b) [ .5, 19.0] —
Temporary change in re uired capital
Aiyar et al. (2012) c) — [ 6.8, 9.0] Francis and Osborne (2012) (d) — 0.0
ILLUSTRATIVE ESTIMATES OF THE IMPACT OF A 100 BASIS POINT INCREASE IN BANKS HEADLINE CAPITAL TABLE 3
34 See Macroeconomic Assessment Group (2010).
SOURCE: Macroeconomic Assessment Group (2010). a The shaded areas indicate the 20-80th percentile and 40-60th percentile ranges respectively. The yellow line shows the unweighted median. The distribution of
outcomes is computed across 89 models, discussed in MAG (2010). The results do not include the impact of international spillovers. b The vertical line indicates the 18th quarter.
ESTIMATED IMPACT ON GDP OF DATA A 100 BASIS POINT CREASE IN CAPITAL REQUIREMENTS IMPLEMENTED OVER TWO YEARS (a)
CHART 6
-0.4
-0.3
-0.2
-0.1
0
0.1
0 4 8 12 16 20 24 28 32
20% TO 80% 40% TO 60% UNWEIGHTED MEDIAN
Deviation of GDP from baseline (per cent)
Quarters from start of implementation
(b)
BANCO DE ESPAÑA 25 ESTABILIDAD FINANCIERA, NÚM. 24
More fundamentally, all such estimates reflect average relationships between banks’
capital ratios and credit conditions in the past. It is well known that past relationships can
be a poor guide to the future, particularly when there are large structural changes in the
economy. The creation of a macroprudential regime might be one such structural change.
For example, if financial markets come to expect the CCB to be raised in a sequence of
steps when exuberant lending threatens financial stability, then the initial impact of policy
actions might be larger than past relationships would suggest.
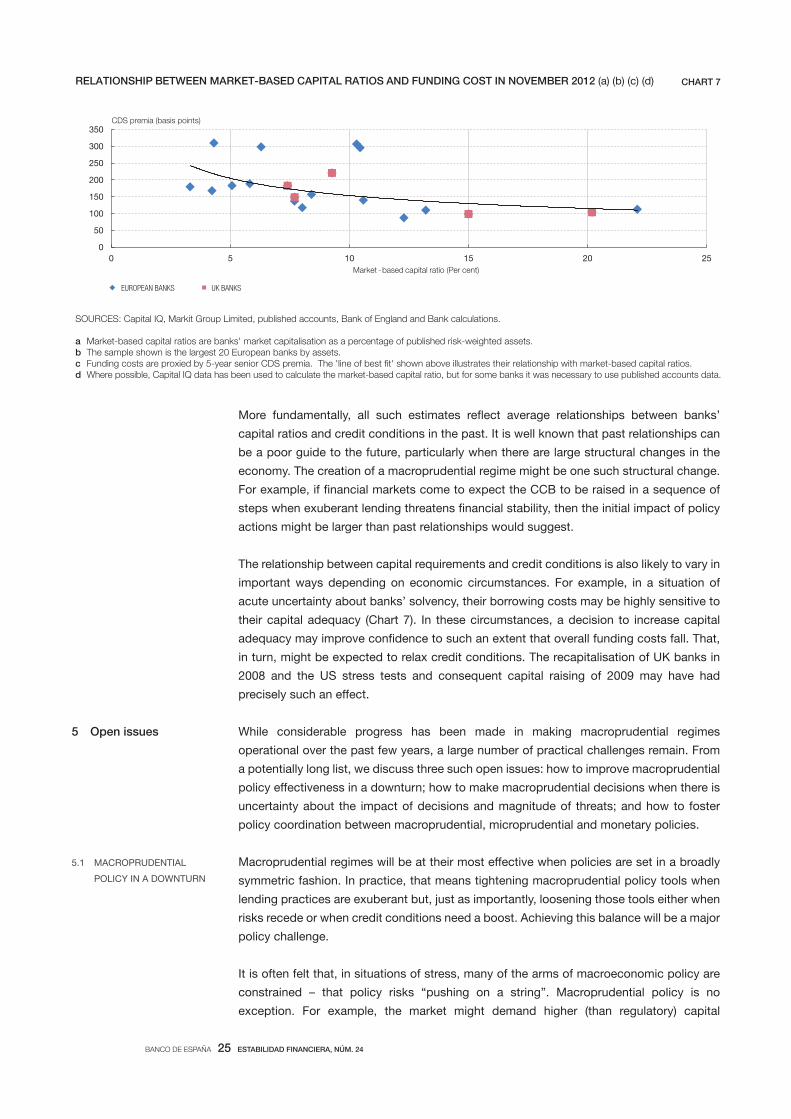
The relationship between capital requirements and credit conditions is also likely to vary in
important ways depending on economic circumstances. For example, in a situation of
acute uncertainty about banks’ solvency, their borrowing costs may be highly sensitive to
their capital adequacy (Chart 7). In these circumstances, a decision to increase capital
adequacy may improve confidence to such an extent that overall funding costs fall. That,
in turn, might be expected to relax credit conditions. The recapitalisation of UK banks in
2008 and the US stress tests and consequent capital raising of 2009 may have had
precisely such an effect.
While considerable progress has been made in making macroprudential regimes
operational over the past few years, a large number of practical challenges remain. From
a potentially long list, we discuss three such open issues: how to improve macroprudential
policy effectiveness in a downturn; how to make macroprudential decisions when there is
uncertainty about the impact of decisions and magnitude of threats; and how to foster
policy coordination between macroprudential, microprudential and monetary policies.
Macroprudential regimes will be at their most effective when policies are set in a broadly
symmetric fashion. In practice, that means tightening macroprudential policy tools when
lending practices are exuberant but, just as importantly, loosening those tools either when
risks recede or when credit conditions need a boost. Achieving this balance will be a major
policy challenge.
It is often felt that, in situations of stress, many of the arms of macroeconomic policy are
constrained – that policy risks “pushing on a string”. Macroprudential policy is no
exception. For example, the market might demand higher (than regulatory) capital
5 Open issues
5.1 MACROPRUDENTIAL
POLICY IN A DOWNTURN
SOURCES: Capital IQ, Markit Group Limited, published accounts, Bank of England and Bank calculations.
a Market-based capital ratios are banks' market capitalisation as a percentage of published risk-weighted assets.b The sample shown is the largest 20 European banks by assets.c d Where possible, Capital IQ data has been used to calculate the market-based capital ratio, but for some banks it was necessary to use published accounts data.
RELATIONSHIP BETWEEN MARKET-BASED CAPITAL RATIOS AND FUNDING COST IN NOVEMBER 2012 (a) (b) (c) (d) CHART 7
0
50
100
150
200
250
300
350
0 5 10 15 20 25
EUROPEAN BANKS UK BANKS
CDS premia (basis points)
Market -based capital ratio (Per cent)
BANCO DE ESPAÑA 26 ESTABILIDAD FINANCIERA, NÚM. 24
requirements in a downswing because they fear the risk of insolvency. That would
potentially reduce the potency of a macroprudential loosening of policy, for example in
stimulating credit and growth.
But recent empirical research by Jiménez et al. (2012) has reached a more optimistic
conclusion on the effects of macroprudential policy loosening. The authors analyse the
economic impact of the Bank of Spain’s dynamic provisioning framework – a close cousin
of the Basel III countercyclical capital buffer. In particular, they ask whether its impact
differed in good times (when buffers were being built up) from the downswing (when the
buffers were being released).
In the upswing, they find that the banks that had to provision more cut their credit supply
by most, as might be expected. But, crucially, this macroprudential policy tightening had
relatively little effect on overall credit conditions or the macroeconomy. The reason was
that other lenders stepped in and picked up the slack created by constrained banks
exiting. In other words, credit was highly substitutable during the boom.
By contrast, the release of buffers in 2008 Q4 was found to have had a large positive
incremental effect on lending, employment and firm survival in 2009 and 2010, albeit
relative to a baseline in which credit conditions were tightening substantially. The reason is
that, in a bust, credit supply is not very substitutable, with fewer alternative suppliers of
credit to households and customers. So, while the overall level of provisioning turned out
to be too small to save Spain from a severe macroeconomic downturn, these results do
suggest that macroprudential policy could in fact be more potent in a downswing, not less.
The design of macroprudential tools can also help to foster a symmetric regime. For
instance, it may make sense to distinguish between stocks and flows of lending in the
application of such tools. Capital requirements are traditionally applied uniformly to both
the stock of banks’ existing assets and to any new loans created. But suppose capital
requirements on new loans could be flexed without affecting those applied to the back-
book of existing assets. Such an approach could be particularly useful in the downswing
as it could stimulate credit supply while reducing the risks associated with release of the
buffers. Banks would only benefit from capital relief to the extent they continued to lend,
thus stimulating credit supply; while their resilience against legacy assets would still be
protected. In the UK, such an approach has recently been put into practice with a lower
effective capital charge placed on new loans relative to old to stimulate credit supply.35
Another major challenge in designing macroprudential policies is how to deal with high
degrees of (Knightian) uncertainty. This can take many forms: uncertainty over the severity
of the threats to financial stability and how these have changed; uncertainty about the
structure of the economy and the financial system; uncertainty about the impact of
alternative policy tools; and uncertainty about the impact of policy actions on market
participants’ expectations.
While there is no clear guide from the academic literature on what optimal policy should be in
such an environment,36 some general policy design lessons can be drawn. For example, it is
clear that policymakers should not worsen this uncertainty problem through their own actions
5.2 MACROPRUDENTIAL
POLICY UNDER
UNCERTAINTY
35 For details, see http://www.fsa.gov.uk/static/pubs/other/adjustments-capital-planning-buffers.pdf.
36 See Brainard (1969) and Hansen and Sargent (2003, 2004).
BANCO DE ESPAÑA 27 ESTABILIDAD FINANCIERA, NÚM. 24
and reactions. Among other things, this calls for as clear and transparent a macroprudential
decision-making process as possible.
There are several potential dimensions to such a transparent regime. One is having as
clear as possible a set of inputs to the policy decision-making process. As discussed in
Section 4, the Bank of England’s FPC has recently published a list of the core indicators it
intends using to set macroprudential policy, for just this reason. The credit-to-GDP ratio
guideline path specified as part of Basel III is also intended to serve an indicator role.
A more sophisticated step would be to produce, and potentially publish, information on
stress-tests for key macroprudential measures such as liquidity, capital, lending and
output. For example, in the United States an annual round of such top-down stress-testing
has been in place since 2009, with a high degree of transparency about both inputs and
outputs. This is generally felt to have reduced market participants’ uncertainty about the
true state of health of US banks’ balance sheets and thereby supported financial stability.
A third layer of transparency concerns the deliberations of the macroprudential policy
committee itself. In the UK, a Record of the meeting of the FPC is published, broadly in line
with the practices of the Bank’s Monetary Policy Committee. This is intended to make
transparent the nature of the FPC’s discussion and the reasoning behind its policy stance.
Over time, this will help external participants understand the shape and nature of the
FPC’s “reaction function”. Inevitably, this will be a two-way process, as the FPC learn more
about how its actions affect the macro-financial environment and market participants learn
more about how the FPC intends operating its tools.
One key policy lesson, which is well-illustrated in a wide range of other policy environments,
is the need to avoid fine-tuning macroprudential responses when uncertainty is great and
past historical evidence limited. Simplicity, both in approach and in action, can be of
considerable value in such uncertain environments in avoiding the large errors that
otherwise might arise if policy is over-fitted, over-complicated or hyper-active.37
A third challenge relates to the co-ordination of macroprudential policies with other policy
levers, in particular micro-prudential and monetary policies. In general, these three arms of
policy would be expected to be complementary and mutually-supportive. For example,
during the pre-crisis credit boom, a macroprudential policy tightening would have helped
alleviate strains on micro-prudential regulation of individual firms. It would also potentially
have helped reduce the costs of the crisis, thereby alleviating some of the burden
subsequently placed on monetary policy.
Nonetheless, because these three arms of policy are, at least to some extent, overlapping
in their impact, they do raise new and important issues of co-ordination. Attaching all three
arms of policy to a single body – in the UK, the Bank of England – can help in this co-
ordination process, as it internalises any policy spillovers, or externalities, which might
otherwise arise between them.
Nonetheless, this framework still requires that the three decision-makers consider the
impact of each others’ actions when making their own policy decisions.38 For example,
monetary policy forecasts for inflation and output will need to include an assumption about
5.3 MACROPRUDENTIAL
POLICY CO-ORDINATION
37 Haldane and Madouros (2012); Aikman et al. (2013).
38 For a recent discussion, see Stein (2013).
BANCO DE ESPAÑA 28 ESTABILIDAD FINANCIERA, NÚM. 24
the stance of macroprudential policy. And macroprudential stress-testing will in turn need
to make assumptions about the course of monetary policy and the macro-economy.
Co-ordination issues also arise when co-ordinating macroprudential and microprudential
policies. By and large, macroprudential tools involve using microprudential tools to address
risks to the stability of the financial system as a whole. At some points in the cycle, there
may be tensions between the instrument settings appropriate for macro and microprudential
purposes. These problems are perhaps most acute during the downswing, when a
macroprudential release of buffers could sit awkwardly with a microprudential approach of
seeking to bolster firms’ resilience.
Potential trade-offs and tensions between policy settings are part and parcel of public policy.
The benefits of having a clearly defined policy framework, including for macroprudential
policy, is that these trade-offs can be discussed and, ideally, resolved openly. Having distinct
policy committees, with distinct statutory remits, ought to make that policy process of
openness and resolution no more difficult, and potentially somewhat easier. It certainly ought
to make it more transparent and understandable to the wider world.
There is an urgent need for more research on all of these important macroprudential
questions – and more besides. If macroprudential policy reduces somewhat the chances
or severity of another systemic crisis, the gains to society are potentially enormous.
AIKMAN, D., P. ALESSANDRI, B. EKLUND, P. GAI, S. KAPADIA, E. MARTIN, N. MORA, G. STERNE, and M. WILLISON
(2009). Funding liquidity risk in a quantitative model of systemic stability, Bank of England Working Paper no. 372.
AIKMAN, D., A. HALDANE, and B. NELSON (2010). “Curbing the credit cycle”, speech at Columbia University Center
on Capitalism and Society Annual Conference.
AIKMAN, D., M. GALESIC, G. GIGERENZER, S. KAPADIA, K. KATSIKOPOULOS, K. KOTHIYAL, E. MURPHY, and
T. NEUMANN (2013). Taking uncertainty seriously: simplicity versus complexity in financial regulation, Bank of
England Financial Stability Paper, forthcoming.
AIYAR, S., C. CALOMIRIS, and T. WIELADEK (2012). Does macropru leak? Evidence from a UK policy experiment.
Bank of England Working Paper no. 445.
ALESSI, L., and C. DETKEN (2009). Real time early warning indicators for costly asset price boom/bust cycles: a role
for global liquidity, ECB Working Paper Series no. 1039, March.
ARINAMINPATHY, N., S. KAPADIA, and R. MAY (2012). “Size and complexity in model financial systems”, Proceedings
of the National Academy of Sciences, vol. 109, no. 45, pp. 18338-18343.
AVERY, C., and P. ZEMSKY (1998). “Multidimensional Uncertainty and Herd Behaviour in Financial Markets”,
American Economic Review, vol. 88, pp. 724-748.
AVERY, R., and A. BERGER (1991). “Risk-Based Capital and Deposit Insurance Reform”, Journal of Banking & Finance,
15, pp. 847-874.
BANK OF ENGLAND (2009). The role of macroprudential policy: a discussion paper, November.
— (2011). Instruments of macroprudential policy, December.
— (2013). The Financial Policy Committee’s powers to supplement capital requirements: a draft policy statement,
January.
BARRELL, R., and D. KARIM (2012). “Macroprudential policy and credit: the right question but the wrong answer”,
mimeo.
BARRELL, R., E. DAVIS, D. KARIM, and I. LIADZE (2010). “Bank regulation, property prices and early warning
systems for banking crises in OECD countries”, Journal of Banking and Finance, vol. 34, no. 9, pp. 2255-2264.
BASEL COMMITTEE ON BANKING SUPERVISION (2010). Basel III: A global regulatory framework for more resilient
banks and banking systems, December.
BEDFORD, P., and C. BLOOR (2009). A cobweb model of financial stability in New Zealand, Reserve Bank of New
Zealand Discussion Paper Series, 2009/11.
BERNANKE, B. (2004). “The great moderation”, speech given at the meetings of the Eastern Economic Association,
Washington DC, February 20.
BERNTSSON, C., and J. MOLIN (2012). “Creating a Swedish toolkit for macroprudential policy”, Riksbank Studies,
November.
BIKHCHANDANI, S., and S. SHARMA (2001). Herd Behaviour in Financial Markets, IMF Working Paper, 47, 3.
BLANCHARD, O., and J. SIMON (2001). “The Long and Large Decline in U.S. Output Volatility”, Brookings Papers
on Economic Activity, 1, pp. 135-164.
BORIO, C. (2009). We are all macroprudentialists now.
BORIO, C., and A. CROCKETT (2000). “In search of anchors for financial and monetary stability”, Greek Economic
Review, 20(2), pp 1-14.
REFERENCES
BANCO DE ESPAÑA 29 ESTABILIDAD FINANCIERA, NÚM. 24
BORIO, C., and P. LOWE (2002). “Assessing the risk of banking crises”, BIS Quarterly Review, December, pp 43-54.
— (2004). Securing sustainable price stability. Should credit come back from the wilderness?, BIS Working Papers,
no. 157.
BRAINARD, W. (1969). “Uncertainty and the effectiveness of policy”, American Economic Review, 57, pp. 411-425.
BURROWS, O., D. LEARMONTH, and J. MCKEOWN (2012). RAMSI: a top-down stress-testing model, Bank of
England Financial Stability Paper no. 17.
COMMITTEE ON THE GLOBAL FINANCIAL SYSTEM (2009). “The role of margin requirements and haircuts in
procyclicality”, CGFS Publications no. 36.
— (2010). “Macroprudential instruments and frameworks: a stocktaking of issues and experiences”, CGFS
Publications no. 38, May.
DAHL, G., T. KLOSTER, U. LARSEN, K. RAKKESTAD, R. REISVAAG, B. SYVERSTEN, and C. TRÆE (2011). A Cobweb
Model of Financial Stability in Norway, edited by Magdalena D. Riiser, Norges Bank Staff Memo no. 15.
DE LAROSIÈRE, J. (2009). The high-level group on financial supervision in the EU, Brussels, 25 February.
DELL’ARICCIA, G., D. IGAN, L. LAEVEN, and H. TONG, with B. BAKKER, and J. VANDENBUSSCHE (2012). Policies for
macrofinancial stability: how to deal with credit booms, IMF Staff Discussion Note, June.
DIAMOND, D., and P. DYBVIG (1983). “Bank Runs, Deposit Insurance, and Liquidity”, Journal of Political Economy, 91,
pp. 401-419.
DREHMANN, M., C. BORIO, and K. TSATSARONIS (2011). “Anchoring countercyclical capital buffers: the role of
credit aggregates”, International Journal of Central Banking, vol. 7(4), pp. 189-240, December.
— (2011). Characterising the financial cycle: don’t lose sight of the medium term!, BIS Working Paper no. 380, June.
ELLIOTT, D. (2009). Quantifying the effects on lending of increased capital requirements, Pew Financial Reform
Project Briefing Papers, no. 7.
ESTRELLA, A., S. PARK, and S. PERISTIANI (2000). “Capital Ratios and Credit Ratings as Predictors of Bank Failures”,
FRBNY Economic Policy Review (July), pp. 33-52.
FINANCIAL SERVICES AUTHORITY (2009). The Turner Review: A regulatory response to the global banking crisis, March.
FINANCIAL STABILITY BOARD, INTERNATIONAL MONETARY FUND and BANK OF INTERNATIONAL SETTLEMENTS
(2011). Macroprudential policy tools and frameworks: progress report to G20, 27 October.
FRANCIS, W., and M. OSBORNE (2012). “Capital requirements and bank behavior in the UK: are there lessons for
international capital standards?”, Journal of Banking and Finance, vol. 36, no. 3, pp. 803-816.
GAI, P., A. HALDANE, and S. KAPADIA (2011). “Complexity, concentration and contagion”, Journal of Monetary
Economics, 58(5).
GALE, D. (2010). “Capital Regulation and risk sharing”, International Journal of Central Banking, pp. 187-204, December.
GENNAIOLI, N., A. SHLEIFER, and R. VISHNY (2012). “Neglected risks, financial innovation, and financial fragility”,
Journal of Financial Economics, Elsevier, vol. 104(3), pp. 452-468.
GIESE, J., H. ANDERSEN, O. BUSH, C. CASTRO, F. FARAG, and S. KAPADIA (2013). “The credit-to-GDP gap and
complementary indicators for macroprudential policy: evidence from the UK”, International Journal of Finance
and Economics, forthcoming.
GRAY, D. F., R. C. MERTON, and Z. BODIE (2008). A new framework for measuring and managing macrofinancial risk
and financial stability, Harvard Business School Working Paper no. 09-015.
GRAY, D. F., and A. JOBST (2011). “Modeling systemic financial sector and sovereign risk”, Sveriges Riksbank
Economic Review, September.
GROUP OF THIRTY (2010). Enhancing financial stability and resilience: macroprudential policy, tools, and systems
for the future, October.
GUTTENTAG, J., and R. HERRING (1986). “Disaster Myopia in International Banking”, Essays in International Finance,
no. 164.
HALDANE, A. (2009a). “Why Banks Failed the Stress Test”, speech given at the Marcus-Evans Conference on
Stress-Testing, 9-10 February.
— (2009b). Rethinking the Financial Network, available at http://www.bankofengland.co.uk/publications/
speeches/2009/speech386.pdf.
HALDANE, A., and V. MADOUROS (2012). The dog and the frisbee, given at the Federal Reserve Bank of Kansas
City’s 36th economic policy symposium, “The Changing Policy Landscape”, Jackson Hole, Wyoming.
HANSEN, L., and T. SARGENT (2003). “Robust Control for Forward Looking Models”, Journal of Monetary Economics,
50(3), pp. 581-604.
— (2004). Robust Control and Economic Model Uncertainty, Princeton University Press.
HANSON, S., A. KASHYAP, and J. STEIN (2011). “A Macroprudential Approach to Financial Regulation”, Journal of
Economic Perspectives, vol 25, no. 1, Winter, pp. 3-28.
HELLWIG, M. (1995). “Systemic aspects of risk management in banking and finance”, Schweizerische Zeitschrift für
Volkswirtschaft und Statistik, 131, pp. 723-737.
HERRING, R. (1998). “Banking Disasters: Causes and Preventative Measures, Lessons Derived from the U.S. Experience”,
in Preventing Bank Crises – Lessons from Recent Global Bank Failures, edited by G. Jr. Caprio, W. C. Hunter,
G. G. Kaufman, and D. M. Leipziger, Proceedings of a conference cosponsored by the Federal Reserve Bank of
Chicago and the Economic Development Institute of the World Bank, The World Bank, Washington D.C.,
September, pp. 209-236.
HM TREASURY (2011). A new approach to financial regulation: building a stronger system, February.
HOLLÓ, D., M. KREMER, and M. LO DUCA (2012). CISS - a composite indicator of systemic stress in the financial
system, European Central Bank Working Paper, no. 1426.
HOLMSTROM, B., and J. TIROLE (1997). “Financial intermediation, loanable funds and the real sector”, Quarterly
Journal of Economics, 112, pp. 663-691.
ILLING, M., and Y. LIU (2006). “Measuring financial stress in a developed country: an application to Canada”, Journal
of Financial Stability, vol. 2, no. 4, pp. 243-265.
BANCO DE ESPAÑA 30 ESTABILIDAD FINANCIERA, NÚM. 24
INTERNATIONAL MONETARY FUND (2011). Macroprudential Policy: An Organizing Framework, March.
JIMÉNEZ, G., S. ONGENA, J. PEYDRÓ, and J. SAURINA (2012). Macroprudential policy, countercyclical bank capital
buffers and credit supply: evidence from the Spanish dynamic provisioning experiments, Barcelona GSE Working
Paper no. 628.
JUKS, R., and O. MELANDER (2012). Countercyclical capital buffers as a macroprudential instrument, Riksbank
Studies.
KAMINSKY, G., and C. REINHART (1999). “The twin crises: The causes of banking and balance of payments
problems”, American Economic Review, vol. 89, no. 3, June, pp. 473-500.
KAPADIA, S., M. DREHMANN, J. ELLIOTT, and G. STERNE (2013). “Liquidity risk, cash flow constraints, and systemic
feedbacks”, in J. G. Haubrich, and A. W. Lo (eds.), Quantifying Systemic Risk, University of Chicago Press.
KEYS, B., T. MUKHERJEE, A. SERU, and V. VIG (2010). “Did Securitization Lead to Lax Screening? Evidence from
Subprime Loans”, Quarterly Journal of Economics, 125.
KINDLEBERGER, C. (1989). Manias, Panics and Crashes: A History of Financial Crises, New York, Basic Books.
KOO, R. (2008). The Holy Grail of Macroeconomics: Lessons from Japan’s Great Recession, Wiley.
LAKONISHOK, J., A. SHLEIFER, and R. VISHNY (1992). “The Impact of Institutional Trading on Stock Prices”,
Journal of Financial Economics, vol. 32, pp. 23-43.
LIIKANEN, E. (2012). High-level expert group on reforming the structure of the EU banking sector, Brussels, October.
LUCAS, R. (1976). “Econometric policy evaluation: a critique”, in K. Brunner and A. Meltzer (eds.), The Phillips curve
and labour markets, Carnegie-Rochester Conference Series on Public Policy, no. 1, New York, American Elsevier,
pp. 19-46.
MACROECONOMIC ASSESSMENT GROUP (2010). Assessing the macroeconomic impact of the transition to
stronger capital and liquidity requirements: Interim Report, Bank for International Settlements, August.
MENDOZA, E., and M. TERRONES (2008). An anatomy of credit booms: Evidence from macro aggregates and micro
data, NBER Working Paper 14049.
MINSKY, H. (1986). Stabilizing an Unstable Economy, New Haven, Conn., Yale University Press.
MISHKIN, F. (2008). “How should we respond to asset price bubbles?”, speech at the Wharton Financial Institutions
Centre and Oliver Wyman Institute’s Annual Financial Risk Roundtable, Philadelphia, Pennsylvania, May.
NIER, E., J. OSINSKI, L. JACOME, and P. MADRID (2011). Institutional models for macroprudential policy, IMF Staff
Discussion Note, November.
NOSS, J., and R. SOWERBUTTS (2012). The implicit subsidy of banks, Financial Stability Paper no. 15.
REINHART, C., and K. ROGOFF (2009). This time is different: Eight Centuries of Financial Folly, Princeton University Press.
— (2011). “From Financial Crash to Debt Crisis”, American Economic Review, 101, pp. 1676-1706.
REPULLO, R., and J. SAURINA (2012). “The countercyclical capital buffer of Basel III: a critical assessment”, in
M. Dewatripont and X. Freixas (eds.), The Crisis Aftermath, New Regulatory Paradigms, CEPR, pp. 45-67.
SCHULARICK, M., and A. TAYLOR (2012). “Credit Booms Gone Bust: Monetary Policy, Leverage Cycles, and Financial
Crises, 1870-2008”, American Economic Review, American Economic Association, vol. 102(2), pp. 1029-1061, April.
STEIN, J. (2013). Overheating in Credit Markets: Origins, Measurement, and Policy Responses, speech delivered at
“Restoring Household Financial Stability after the Great Recession: Why Household Balance Sheets Matter”, a
symposium sponsored by the Federal Reserve Bank of St. Louis, St. Louis, February 5-7.
VAN ROMPUY, H. (2012). Towards a genuine economic and monetary union, Brussels, 5 December.
WELLINK, N. (2011). Basel III: A roadmap to better banking regulation and supervision, St. Petersburg, 24 May.