Embed Size (px)
Citation preview

June 15, 2011 - September 20, 2011
MissionWe support the mission and vision of Financial Management by continuously evolving to assist with the ever changing
financial needs of students and departments on a local, national and global level.
Manage Aid DisbursalManage Invoice Receivables
Core Processes
Student Fiscal ServicesUniversity of Washington : Finance and Facilities : Financial Management
Operational Performance DashboardSummer Quarter 2011
Manage Tuition and Fees
Manage CollectionsProvide Credit Card Services
Provide Cash Management Services
Report Date: 11/17/2011 http://www.washington.edu/students/sfs/forms/dashbaord.pdf Prepared by: Colin Sachs ([email protected])

Customer Output
28%
In-Person Services Satisfaction 90%
76%
64%
Internal Business
76%
91%
24%
Financial
Short-term Loan Default Rate 11.9%
7.3%
Learning & Growth
57%
79%
72%
LEAN Projects
18%
0:02
Student Fiscal Services - Operational Performance DashboardSummer Quarter 2011
SFS Office Green Practices
Aid Dollars Disbursed to Students
Remote Customer Communications
Online Services Satisfaction
Web Check Payments
Electronic 1098T Reporting
Disbursements by Direct Deposit
Perkins Loans Cohort Default Rate
Active Employee Development Plans
90%
Operating Environment (by Fiscal Year)
75%
68%
100%
85%
12.0%
10.1%
Target
46%
90%
75%
90%
80%
Overall Staff Satisfaction
Direct Loan - Origination Errors
Scholarship - Deposits 0:05
10%
29.424.0
2005 2006 2007 2008 2009 2010 2011
Filled SFS Classified & Professional Staff FTE
60,857
74,126
2005 2006 2007 2008 2009 2010 2011
Student Accounts Served Annually*
* Non-duplicate count of students who have had one ormore student account transactions over the course of a year
1,228,415 1,210,3601,467,157
2005 2006 2007 2008 2009 2010 2011
Number of Student Account Transactions
$1,329,178
$1,853,830
$1,613,935
$1,786,360
2005 2006 2007 2008 2009 2010 2011
Fiscal Year Expenditures* across All SFS Budgets
*Unadjusted dollars - excludes re-charges and revenues
2 SFS Dashboard Report

Measure Page
Customer
4
5
7
Internal Business
8
9
10
Financial
11
12
13
14
Learning & Growth
15
16
17
LEAN Projects
18
19
20Appendix - Data Summary
Customer Communications - Channels (Remote vs. In Person)
Collect Loans - Cumulative Perkins Loan Default Rate
Environmental Stewardship - Green Office Practices
Satisfied Staff - Job Satisfaction
Training - EDPs
Educate Customers - Outreach
Disburse Aid/Collect Tuition - In-House vs. Electronic Processing
Student Tax Reporting - e1098Ts
Merchant Credit Card - Cost Recovery
Table of Contents
Collect Loans - Short-Term Loan Default Rate
Collect Loans - Federal Perkins Cohort Default Rate
Disburse Aid - Aid Dollars Disbursed to Students
Customer Satisfaction - Satisfy Students
Collect Tuition - Students Paying On Time
Direct Loan Process - Record Errors
Scholarship Process - Deposits
SFS Dashboard Report 3

Customer Navigate: Dashboard TOC Appendix
Definition
Analysis
Next Steps
Continue working with process partners (i.e., Sponsors, Private
Scholarship providers, the Office of Student Financial Aid, etc.)
to ensure prompt authorization and release of student aid
awards.
SFS disburses financial aid award dollars from private, State
and Federal sources. Aid is first authorized by the appropriate
campus authority, then released by SFS to pay toward
applicable charges on student accounts with any excess being
released to the student to pay for other educational expenses.
The earliest funds can be disbursed is on account set-up day
(i.e., generally, the Wednesday before a quarter start date).
For students receiving financial aid, SFS strives to have the vast
majority of aid dollars released between by the end of the first
week of classes within a quarter -- and investigates causes of
drops in the percentage when this falls one standard deviation
below the mean for normal operational variance within a
quarter.
Financial Aid challenged due to cuts in Federal Aid, plus an
increase in applications, delayed the approval and offering of
aid which impacted disbursements. However, current Winter
quarter's drop below target is well within normal operational
variance for quarter, so is not a cause for concern at this time.
SFS will monitor subsequent quarters.
Targets have been readjusted on a per quarter basis based
prior years data and set at one standard deviation above the
per quarter average rate - and applied to 2008 and forward.
Disburse Aid - Aid Dollars Disbursed to Students
$3
0$
23
$3
1$
34
$3
8$
40
$5
1$
55
$1
13
$1
22
$1
30
$1
44
$1
65
$1
84
$2
04
$9
8$
10
5$
11
2$
12
1$
13
0$
14
9$
17
4$
19
2
$1
01
$1
09
$1
16
$1
24
$1
36
$1
51
$1
68
$1
86
20
02
20
03
20
04
20
05
20
06
20
07
20
08
20
09
20
10
20
11
20
02
20
03
20
04
20
05
20
06
20
07
20
08
20
09
20
10
20
11
20
03
20
04
20
05
20
06
20
07
20
08
20
09
20
10
20
11
20
02
20
03
20
04
20
05
20
06
20
07
20
08
20
09
20
10
20
11
Summer Autumn Winter Spring
Financial Aid Dollars (Millions) Disbursed
Total $ Disbursed $ Disbursed by end of 1st Week
28
%5
1%
59
%6
0%
52
%3
4%
34
%5
7%
30
%2
8%
78
%7
6%
77
%7
6%
78
%7
6%
70
%8
4%
86
%
86
%8
6%
88
%8
7%
85
%9
5%
95
%7
9%
83
%8
5%
88
%8
5%
87
%8
7%
87
%8
7%
94
%7
9%
81
%
Prior Target (>=)70%
46%
Prior Target (>=)85% 84%
93%89%
20
02
20
03
20
04
20
05
20
06
20
07
20
08
20
09
20
10
20
11
20
02
20
03
20
04
20
05
20
06
20
07
20
08
20
09
20
10
20
11
20
03
20
04
20
05
20
06
20
07
20
08
20
09
20
10
20
11
20
02
20
03
20
04
20
05
20
06
20
07
20
08
20
09
20
10
20
11
Summer Autumn Winter Spring
% of Financial Aid Dollars Disbursed by End of 1st Week of Quarter
Current Quarter
4 SFS Dashboard Report
Customer Navigate: Dashboard TOC Appendix
Definition
Analysis
Next Steps
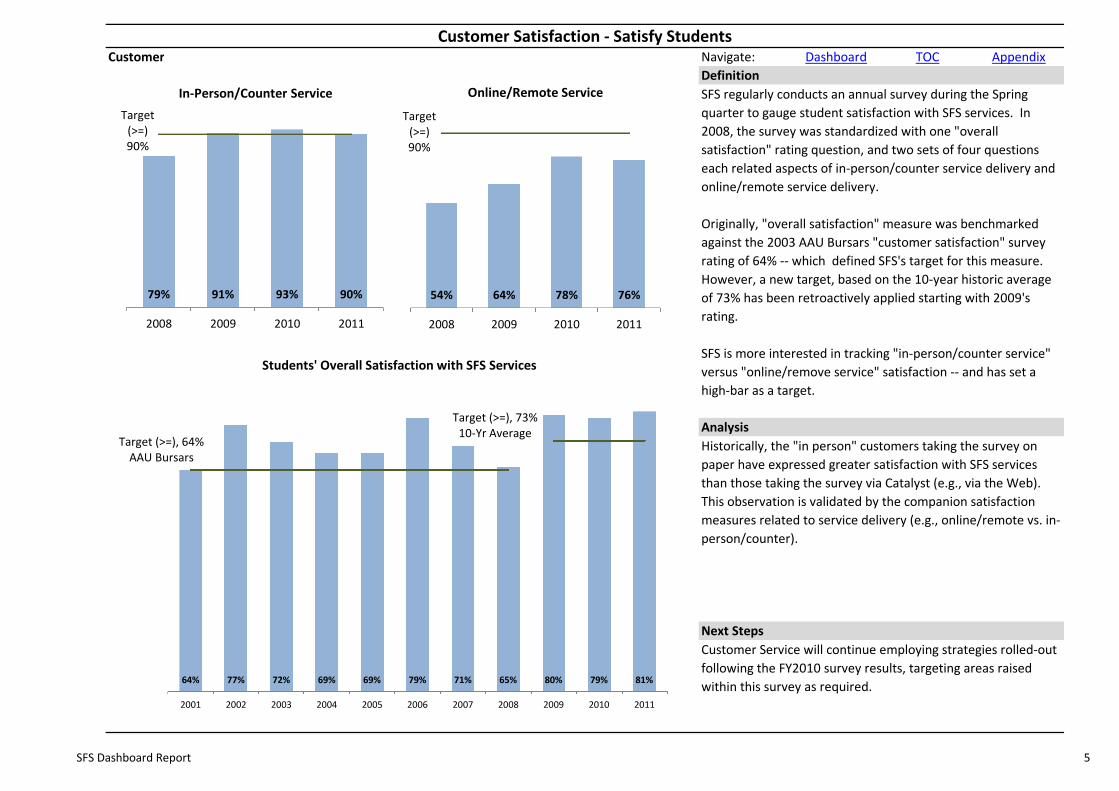
SFS regularly conducts an annual survey during the Spring
quarter to gauge student satisfaction with SFS services. In
2008, the survey was standardized with one "overall
satisfaction" rating question, and two sets of four questions
each related aspects of in-person/counter service delivery and
online/remote service delivery.
Originally, "overall satisfaction" measure was benchmarked
against the 2003 AAU Bursars "customer satisfaction" survey
rating of 64% -- which defined SFS's target for this measure.
However, a new target, based on the 10-year historic average
of 73% has been retroactively applied starting with 2009's
rating.
SFS is more interested in tracking "in-person/counter service"
versus "online/remove service" satisfaction -- and has set a
high-bar as a target.
Historically, the "in person" customers taking the survey on
paper have expressed greater satisfaction with SFS services
than those taking the survey via Catalyst (e.g., via the Web).
This observation is validated by the companion satisfaction
measures related to service delivery (e.g., online/remote vs. in-
person/counter).
Customer Satisfaction - Satisfy Students
Customer Service will continue employing strategies rolled-out
following the FY2010 survey results, targeting areas raised
within this survey as required.64% 77% 72% 69% 69% 79% 71% 65% 80% 79% 81%
Target (>=), 64%AAU Bursars
Target (>=), 73%10-Yr Average
2001 2002 2003 2004 2005 2006 2007 2008 2009 2010 2011
Students' Overall Satisfaction with SFS Services
79% 91% 93% 90%
Target(>=)90%
2008 2009 2010 2011
In-Person/Counter Service
54% 64% 78% 76%
Target(>=)90%
2008 2009 2010 2011
Online/Remote Service
SFS Dashboard Report 5

Customer Navigate: Dashboard TOC Appendix
Definition
Analysis
Next Steps
Customer Communications
SFS provides multiple-channels for customers to contact us
through a customer service phone number, a standard
customer help email address, and web-based instant
messaging (e.g. chat) as well as in person at our customer
service counter and via appointments with our advisors.
Communication volumes are a key workload driver for
customer service and staff responsiveness is critical to our
success.
Strategically, SFS seeks to create self-sufficient customers who
are educated about our services through outreach and
marketing efforts, and can find the information they need, and
access services, through our web site -- and increase the
proportion of communications handled via remote channels
(e.g., email, web chat and phone). Tentatively, SFS is targeting
75% of all communications to be through remote channels.
This measure is currently under development.
In person communication comprises about 1/3 of all customer
interactions. However, there are too few data points to draw
any conclusions of trends at this time (e.g., visitor logging
started in late 2009 and counter traffic data is inferred only as
far back as 2007).
2010 provides the most complete data point, inclusive of all
currently tracked communications channels.
Next measure update in January 2012.
Continue to log communications by channel and monitor
service levels where appropriate (i.e., SFS can track to service
levels for both phone calls and emails, but not for other
channels).
Calls to CSMain Line
Chats fromWebsite
Email tosfshelp@
0%
25%
50%
75%
100%
2007 2008 2009 2010
Customer Communications - Remote/Online% Calls, Emails and Chats by Calendar Year
Note: Chat data incomplete for Aug 2008 to Mar 2009
OfficeVisits
CounterVisits
0%
25%
50%
75%
100%
2007 2008 2009 2010
Customer Communications - Counter/In Person% Office Visits and Counter Visits by Calendar Year
Note: Visits (Security Log) started tracking November 2009.
38,727 38,537 40,318 34,819
16,431 17,260 18,539 19,306
0%
25%
50%
75%
100%
2007 2008 2009 2010
Customer Communications - Remote/Online vs. Counter/In PersonNumber of Calls, Emails and Chats vs. Counter Visits and Office Visits by Calendar Year
Total "Remote"
Total "In Person"
Note: Counter visits are inferred from cashier transaction data starting 2007Office visits are based on security logs that began in 2009
Most complete data set
6 SFS Dashboard Report
Customer Navigate: Dashboard TOC Appendix
Definition
Analysis
Next Steps
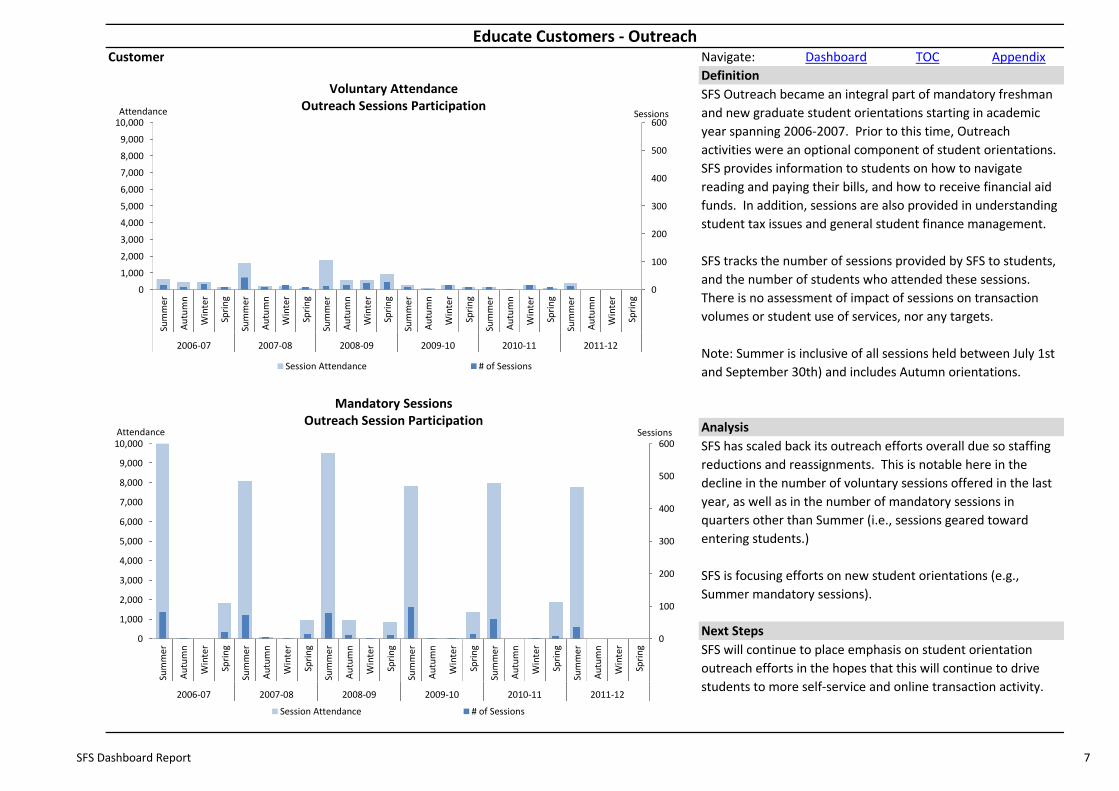
SFS Outreach became an integral part of mandatory freshman
and new graduate student orientations starting in academic
year spanning 2006-2007. Prior to this time, Outreach
activities were an optional component of student orientations.
SFS provides information to students on how to navigate
reading and paying their bills, and how to receive financial aid
funds. In addition, sessions are also provided in understanding
student tax issues and general student finance management.
SFS tracks the number of sessions provided by SFS to students,
and the number of students who attended these sessions.
There is no assessment of impact of sessions on transaction
volumes or student use of services, nor any targets.
Note: Summer is inclusive of all sessions held between July 1st
and September 30th) and includes Autumn orientations.
SFS has scaled back its outreach efforts overall due so staffing
reductions and reassignments. This is notable here in the
decline in the number of voluntary sessions offered in the last
year, as well as in the number of mandatory sessions in
quarters other than Summer (i.e., sessions geared toward
entering students.)
SFS is focusing efforts on new student orientations (e.g.,
Summer mandatory sessions).
SFS will continue to place emphasis on student orientation
outreach efforts in the hopes that this will continue to drive
students to more self-service and online transaction activity.
Educate Customers - Outreach
0
100
200
300
400
500
600
0
1,000
2,000
3,000
4,000
5,000
6,000
7,000
8,000
9,000
10,000
Sum
me
r
Au
tum
n
Win
ter
Spri
ng
Sum
me
r
Au
tum
n
Win
ter
Spri
ng
Sum
me
r
Au
tum
n
Win
ter
Spri
ng
Sum
me
r
Au
tum
n
Win
ter
Spri
ng
Sum
me
r
Au
tum
n
Win
ter
Spri
ng
Sum
me
r
Au
tum
n
Win
ter
Spri
ng
2006-07 2007-08 2008-09 2009-10 2010-11 2011-12
SessionsAttendance
Voluntary AttendanceOutreach Sessions Participation
Session Attendance # of Sessions
0
100
200
300
400
500
600
0
1,000
2,000
3,000
4,000
5,000
6,000
7,000
8,000
9,000
10,000
Sum
me
r
Au
tum
n
Win
ter
Spri
ng
Sum
me
r
Au
tum
n
Win
ter
Spri
ng
Sum
me
r
Au
tum
n
Win
ter
Spri
ng
Sum
me
r
Au
tum
n
Win
ter
Spri
ng
Sum
me
r
Au
tum
n
Win
ter
Spri
ng
Sum
me
r
Au
tum
n
Win
ter
Spri
ng
2006-07 2007-08 2008-09 2009-10 2010-11 2011-12
SessionsAttendance
Mandatory SessionsOutreach Session Participation
Session Attendance # of Sessions
SFS Dashboard Report 7

Internal Business Navigate: Dashboard TOC Appendix
Definition
Analysis
Next Steps
Disburse Aid/Collect Tuition - In-House vs. Electronic Processing
SFS accepts payments from, and issues financial aid
disbursements and refunds to, students through various
channels. Payment channels include in-person cashier
acceptance of cash and checks, and electronic payments by
web check, credit card, wire transfer and lockbox.
Disbursements and refunds are issued by mailed check or
direct deposit to a student's bank account.
SFS seeks to reduce manual and in-house payment processing
and paper check issuance by driving students to use electronic
payment forms (e.g., web check) and direct deposit service.
SFS specifically seeks to aggressively increase web check
adoption rates to 90% starting in 2010.
Starting mid-2010, SFS ceased processing checks in-house and
began utilizing a 3rd party service for disbursement and refund
checks.
While utilization of web check payments continues to rise,
current projections indicate it will be up to five years before
the target of 90% is reached (however, a consistent 80%
utilization should be achieved within 5 quarters) -- provided
SFS does nothing more than it is currently doing to promote
the service.
SFS will continue to advertise and inform students of their on-
line payment options and direct deposit service through a
variety of communications channels, including email and
outreach efforts.
Web Check
Lockbox
Credit
CashChecks
0%
25%
50%
75%
100%
Au
tum
n
Win
ter
Spri
ng
Sum
mer
Au
tum
n
Win
ter
Spri
ng
Sum
mer
Au
tum
n
Win
ter
Spri
ng
Sum
mer
Au
tum
n
Win
ter
Spri
ng
Sum
mer
Au
tum
n
Win
ter
Spri
ng
Sum
mer
Au
tum
n
Win
ter
Spri
ng
Sum
mer
2005-2006
2006-2007 2007-2008 2008-2009 2009-2010 2010-2011 2011-2012
Student Payment Transaction % Volumesby Payment Method
DirectDeposit(ACH)
Checks
0%
25%
50%
75%
100%
Au
tum
n
Win
ter
Spri
ng
Sum
mer
Au
tum
n
Win
ter
Spri
ng
Sum
mer
Au
tum
n
Win
ter
Spri
ng
Sum
mer
Au
tum
n
Win
ter
Spri
ng
Sum
mer
Au
tum
n
Win
ter
Spri
ng
Sum
mer
Au
tum
n
Win
ter
Spri
ng
Sum
mer
2005-2006
2006-2007 2007-2008 2008-2009 2009-2010 2010-2011 2011-2012
Student Disbursements & Refund Transaction% Volumes by Method
45
%
54
%
63
%
69
%
70
%
76
%
22
%
45
%
51
%
62
%
68
%
72
%
26
%
51
%
55
%
64
%
69
%
72
%
28
%
53
%
59
%
68
%
71
%
76
%
Target (>=) 80%
Target (>=) 90%
NACUBO 2008Benchmark (>=) 39%
20
05
20
06
20
07
20
08
20
09
20
10
20
11
20
05
20
06
20
07
20
08
20
09
20
10
20
11
20
06
20
07
20
08
20
09
20
10
20
11
20
06
20
07
20
08
20
09
20
10
20
11
Summer Autumn Winter Spring
Web Check Payments% of All Payment Transactions by Web Check
Current
8 SFS Dashboard Report

Internal Business Navigate: Dashboard TOC Appendix
Definition
Analysis
Next Steps
SFS is responsible for all student-related tax reporting on
students' earnings as they relate to scholarships and grants.
The largest tax processing volumes are related to the
Educational Tax Credit and the issuance of form 1098T.
Starting in 2008, UW offered students the opportunity to "opt
in" to receive electronic 1098Ts through their MyUW login.
SFS actively promotes students use of e1098Ts through
targeted emails, and during freshman orientation sessions and
student tax workshops, as well as flyers and hand-outs in our
Cashier area.
SFS seeks to continue to grow the "opt in" rate to e1098T use,
while targeting a goal of 85% utilization.
SFS saw only a marginal (approximately 2%) increase in e1098T
adoption. This was due to a late initial notification of students
via email (i.e., the first notice went out in early December), and
fewer follow-up notices sent (i.e., only on in early January).
Current (and prior) year reporting does not include "re-prints".
Measure will be adjusted retroactively for 2010, and
subsequent years, to capture this extra work.
SFS will seek to send notices earlier in the year (mid-October)
with at least two follow-up reminders to students (in
November and December.)
Student Tax Reporting - e1098Ts
0%
12%
22% 24%
Target>= 85%
0%
20%
40%
60%
80%
100%
2003 2004 2005 2006 2007 2008 2009 2010
Student Education Tax Credit ReportingCumulative % e1098T "Opt-In" Rates
= Better
2003 2004 2005 2006 2007 2008 2009 2010
Total # 1098Ts 63,869 64,847 64,220 66,092 66,913 68,945 69,801 71,058
e1098Ts 0 0 0 0 0 8,252 15,297 17,070
Paper 1098Ts 63,869 64,847 64,220 66,092 66,913 60,693 54,504 53,988
Number of Printed and Electronic 1098Ts Issued
SFS Dashboard Report 9

Internal Business Navigate: Dashboard TOC Appendix
Definition
Analysis
Next Steps
Merchant Credit Card - Cost Recovery
SFS will continue to monitor the revenue stream over time to
ensure self-sustainability of oversight and compliance needs.
Beginning July of 2009, SFS began receiving revenue to
support centralized merchant credit card account management
which reduces liability and compliance risks to the UW. While
revenue is generated from account activity, it is not generated
for every account managed. This revenue supports 1.0 FTE to
manage oversight and PCI compliance.
SFS tracks the monthly revenue against a target determined to
be a base operating cost. Overall, average monthly revenue
should meet or exceed the target over the course of a fiscal
year. SFS tracks by month to identify potential trends which
would result in a revenue short-fall.
SFS also tracts the number of transactions and the total dollars
of transaction by month to provide context and illustrate the
scope of oversight responsibilities.
Overall, SFS is on-track for meeting FY 2011 revenue goals
(current running average for FY 2011 is $8,233/month, well
above the target of $7,451 to date.)
While FY 2012 is starting off below target, this is normal
seasonal variation. Generally, the first three months of a fiscal
year (i.e., Summer months) have fewer credit card transactions
as there are fewer students on campus making payments to
tuition, housing and food services. This results in "below
target" revenues for these months.
$5
,95
0
$5
,03
6
$6
,05
4
$8
,29
3
$5
,99
7
$7
,92
3
$7
,93
8
$7
,71
4
$9
,76
2
$8
,57
1
$7
,34
6
$6
,45
1
$5
,13
4
$6
,29
0
$6
,97
0
$8
,89
9
$7
,18
0
$8
,59
4
$9
,26
0
$8
,21
8
$1
0,6
97
$9
,68
4
$9
,69
5
$8
,17
5
$6
,29
7
$7
,99
2
Target (>=)$7,451
$-
$2,000
$4,000
$6,000
$8,000
$10,000
$12,000
Jul Aug Sep Oct Nov Dec Jan Feb Mar Apr May Jun Jul Aug Sep Oct Nov Dec Jan Feb Mar Apr May Jun Jul Aug
2009 2010 2011
Merchant Credit Card - Cost RecoveryMonthly Revenues
$-
$5
$10
$15
$20
$25
0
100
200
300
400
500
Jul Aug Sep Oct Nov Dec Jan Feb Mar Apr May Jun Jul Aug Sep Oct Nov Dec Jan Feb Mar Apr May Jun Jul Aug
2009 2010 2011
Millions ($)Thousands(Transactions)
Merchant Credit Card - TransactionsTotal Transaction Volumes and Dollars
# of Transactions Total Dollars
10 SFS Dashboard Report

Financial Navigate: Dashboard TOC Appendix
Definition
Analysis
Next Steps
Collect Loans - Short-Term Loan Default Rate
SFS is responsible for issuing and collecting on short-term
loans. Loans are issued to students via MyUW and must be
paid in-full by the end of the quarter in which the loan was
issued. Students may apply for a one-time extension of
another quarter. This period (i.e., one quarter or one quarter
plus a one quarter extension) is the "term" of the loan.
SFS tracks the number of loans issued each year and compares
this to the total number that are delinquent (i.e., not paid-in-
full within a term). From 2002 to 2010, this has run an average
of 13.9%.
SFS sets as a baseline target a rate of 12% -- or roughly one
standard deviation below the historic average. SFS seeks to
drive down the delinquency rate below this level.
While the number of loans have generally been increasing
annually since 2007, the percentage of loans issues that
become delinquent has remained relatively flat during this
time. However, recent efforts on the part of SFS have dropped
the delinquency rate below target.
An error was discovered in the 2010 reported number
delinquencies which overstated the total number of delinquent
loans. This has been corrected in this report.
Procedures in place for communicating with borrowers will
continue with improvements implemented to ensure a
continued downward trend in delinquencies.
6,911
8,184 8,359
7,4377,131
6,7647,100
7,504 7,767 7,626
1,410 1,179 1,148 905 968 822 967 959 953 906
2002 2003 2004 2005 2006 2007 2008 2009 2010 2011
Number of Short-Term Loans Delinquent Compared to Total NumberIssued
20.4%
14.4% 13.7%12.2%
13.6%12.2%
13.6% 12.8% 12.3% 11.9%Target (<=)
12%
2002 2003 2004 2005 2006 2007 2008 2009 2010 2011
Short-Term Loan Delinquency Rates(Target based on 2002-2010 Average)
$8.75
$11.73$12.53
$11.74 $12.20$12.78
$14.43$15.50 $15.91 $15.66
2002 2003 2004 2005 2006 2007 2008 2009 2010 2011
Total Dollars (Millions) Disbursed for Short-Term Loans
SFS Dashboard Report 11

Financial Navigate: Dashboard TOC Appendix
Definition
Analysis
Next Steps
Collect Loans - Federal Perkins Cohort Default Rate
This measure compares the UW's Federal Perkins Loan Cohort
Default rate against two average default cohort rates (i.e., the
national average and the PAC-10 average rate).
SFS's target is to minimize, as much as possible, defaults within
this program by keeping our rate lower than the National
Average, with a stretch goal of being lower than the PAC-10
average rate. Is should be kept in mind that economic factor
and other issues outside SFS's control influence this measure.
National Average Default Cohort Rate: defined by the U.S. DOE as a national
measure of borrowers who entered repayment during the prior fiscal year
who are in default (>=270 days past due) by the end of the current fiscal
year.
PAC 10 Average Default Cohort Rate: a subset of the National Average
Cohort Default Rate limited to PAC 10 institutions.
SFS has continues to have a consistently lower default rate
than the National Average and, as of 2009, has achieved its
goal of meeting or exceeding the PAC-10 average. SFS expects
UW's cohort default rate to increase in 2011 and beyond due
to a number of economic factors impacting former students'
ability to repay loans.
Note: This measure's targets are variable and our most current FY is judged
initially against the prior FY reporting rates -- as the current year is not
available until May or June of the following year.
SFS will continue with outreach, advising and other
intervention activities as appropriate, while monitoring the
performance of our 3rd party collection agencies.
13
.6%
9.8
%
6.7
%
3.9
%
3.8
%
4.9
%
3.8
%
3.2
%
4.4
%
5.1
%
4.9
%
7.2
%
6.7
%
6.1
%
7.3
%
10.1%
6.5%
1997 1998 1999 2000 2001 2002 2003 2004 2005 2006 2007 2008 2009 2010 2011
Federal Perkins Loan Cohort Default RateCompared to the National and PAC 10 Schools' Average Default Rates
UW Cohort Rate National Average Default Cohort Rate PAC 10 Average Default Cohort Rate
12 SFS Dashboard Report

Financial Navigate: Dashboard TOC Appendix
Definition
Analysis
Next Steps
Collect Loans - Cumulative Perkins Loan Default Rate
The "Cumulative Perkins Loan Default Rate and Defaulted
Dollars by Fiscal Year" measures the overall "historical" default
rate since inception of the program in 1959 in relation to the
dollar amount in default at the end of the fiscal year. This
default rate is derived by comparing the principal outstanding
in default to the total dollars that have ever entered
repayment (and is reported out annually to KPMG on the
annual FISOP report.) These values are derived from the
Campus Partners status summary report for program 04650.
The target for cumulative default rate is based on a 10 year
average (1997 - 2007) of 2.4%. SFS's goal is to minimize the
overall cumulative portfolio default rate.
Target will be re-assessed if the current cumulative default
rate stays below the current target average for an additional
two years (i.e., by end of 2011).
The historical default rate continues to trend downward
indicating a relatively healthy overall repayment rate.
However, we expect that until the current economic conditions
improve, there may be a slight year to year increase starting in
2011 -- similar to that seen from 2007 to 2009.
Monitor this trend in relation to ongoing external economic
conditions and continue to track 3rd party collection agencies'
performance.
$3
.20
$3
.08
$2
.95
$2
.69
$2
.86
$3
.19
$2
.88
$2
.46
$2
.15
$2
.06
$2
.02
$2
.34
$2
.46
$2
.23
$2
.62
3.66%
3.36%
3.01%
2.62%2.77% 2.80%
2.38%
1.90%
1.58%1.41%
1.25%1.35% 1.42%
1.24%
1.47%
Target (<=)2.4%
0.0%
1.0%
2.0%
3.0%
4.0%
5.0%
$-
$0.50
$1.00
$1.50
$2.00
$2.50
$3.00
$3.50
1997 1998 1999 2000 2001 2002 2003 2004 2005 2006 2007 2008 2009 2010 2011
Cumulative Perkins Loan Historical Default RateDefault Rate and Defaulted Dollars (millions) by Fiscal Year
Principal Amount Outstanding in Default Cumulative Portfolio Default Rate Target (<=)
SFS Dashboard Report 13

Financial Navigate: Dashboard TOC Appendix
Definition
Analysis
Next Steps
SFS is responsible for the billing and collection of tuition and
fees each quarter for students billed through the Student
Database System (SDB). This measure takes the number of
late payment fees assessed in a quarter, and divides it by the
total number of students as assessed by the 10th-day census
count to derive a "percentage of students paying tuition on
time."
SFS targets a 97% "on time" payment rate for all but Summer
quarter.
Collect Tuition - Students Paying On Time
This measure has been relatively stable for several years, with
very little variation.
Ongoing outreach and notification efforts regarding
consequences of late payment and how to avoid late payment
continue.
97.4% 96.7% 96.5% 96.6% 96.7% 96.2% 96.3%
Target (>=)97%
2005 2006 2007 2008 2009 2010 2011
Winter
Percent of Students Paying Tuition on Time(Paid before Late Fees Assessed)
41,414 41,446 42,16644,025
45,956 46,460 47,439
1,086 1,363 1,495 1,486 1,511 1,760 1,735
2005 2006 2007 2008 2009 2010 2011
Winter
Number of Students and Students with Late Payments
Total # of Students # Students with Late Payments
14 SFS Dashboard Report
Learning & Growth Navigate: Dashboard TOC Appendix
Definition
Analysis
Next Steps
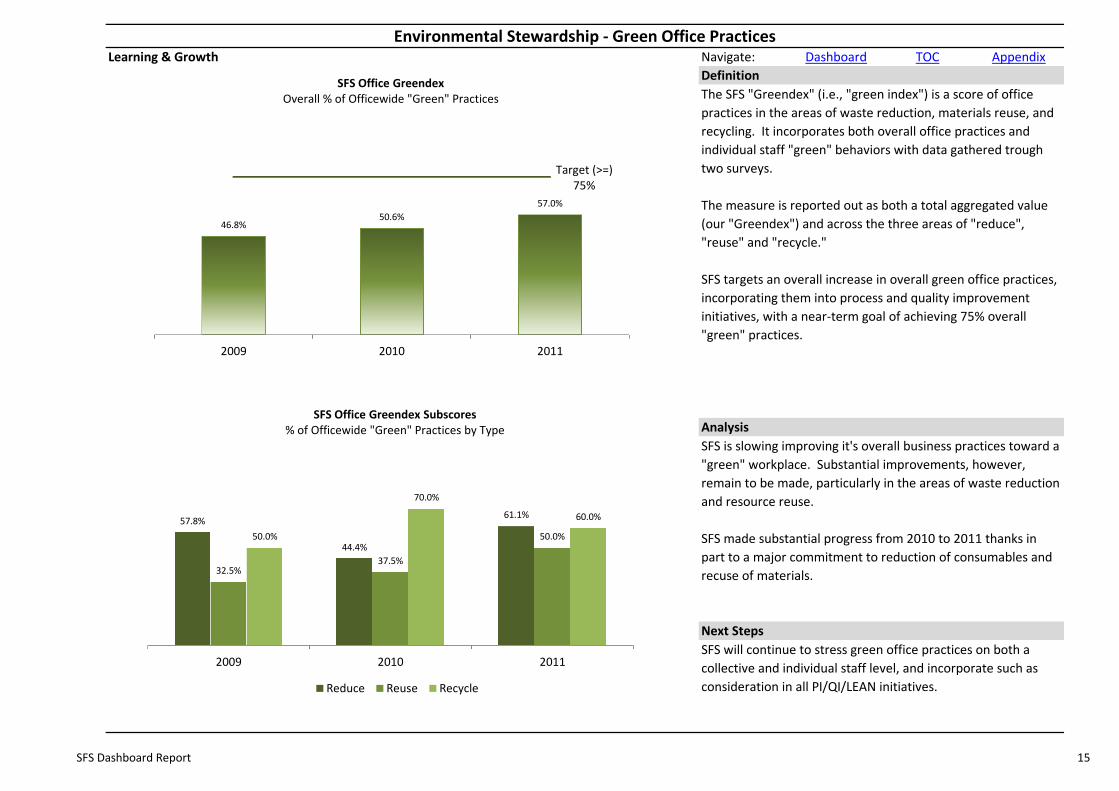
The SFS "Greendex" (i.e., "green index") is a score of office
practices in the areas of waste reduction, materials reuse, and
recycling. It incorporates both overall office practices and
individual staff "green" behaviors with data gathered trough
two surveys.
The measure is reported out as both a total aggregated value
(our "Greendex") and across the three areas of "reduce",
"reuse" and "recycle."
SFS targets an overall increase in overall green office practices,
incorporating them into process and quality improvement
initiatives, with a near-term goal of achieving 75% overall
"green" practices.
SFS is slowing improving it's overall business practices toward a
"green" workplace. Substantial improvements, however,
remain to be made, particularly in the areas of waste reduction
and resource reuse.
SFS made substantial progress from 2010 to 2011 thanks in
part to a major commitment to reduction of consumables and
recuse of materials.
SFS will continue to stress green office practices on both a
collective and individual staff level, and incorporate such as
consideration in all PI/QI/LEAN initiatives.
Environmental Stewardship - Green Office Practices
46.8%50.6%
57.0%
Target (>=)75%
2009 2010 2011
SFS Office GreendexOverall % of Officewide "Green" Practices
57.8%
44.4%
61.1%
32.5%37.5%
50.0%50.0%
70.0%
60.0%
2009 2010 2011
SFS Office Greendex Subscores% of Officewide "Green" Practices by Type
Reduce Reuse Recycle
SFS Dashboard Report 15

Learning & Growth Navigate: Dashboard TOC Appendix
Definition
Analysis
Next Steps
For FY 2009, SFS staff align with FM overall on "Satisfied with
Job" and rate higher on "Overall Satisfaction." However, with
on-going budget reductions and an increased pace of
operational change, it is likely that this is not representative of
current staff perceptions.
Existing trend indicates that staff have been overall more
satisfied over time (as indicated by scores of 4 and 5).
SFS has been seeking input from staff in a variety of ways to
improve operations and will continue to do so.
Satisfied Staff - Job Satisfaction
Every three years, FM conducts a staff survey which includes
questions related to individual staff satisfaction -- both overall
and with their jobs. SFS captures this data for reporting out on
this dashboard report.
To provide better context, SFS trends the survey data for
"Overall Satisfaction" over time by score grouping on a
normalized 5-point scale.
70% 89% 81%
79%83% 81%
FY 2003 FY 2006 FY 2009
% of SFS Staff Satisfied with Job
Satisfaction With Job
FM/Benchmark - Satisfaction With Job
43% 42% 79%
53% 55%
68%
FY 2003 FY 2006 FY 2009
Overall SFS Staff Satisfaction
Overall Satisfaction
FM/Benchmark - Overall Satisfaction
0%
25%
50%
75%
100%
2003 2006 2009
Very Satisfied (4/5) 57.42% 67.38% 79.00%
Satisfied (3) 19.08% 22.12% 18.00%
Unsatisfied (1/2) 23.40% 10.60% 4.00%
Trending - Overall Satisfaction by Score Groups
16 SFS Dashboard Report

Learning & Growth Navigate: Dashboard TOC Appendix
Definition
Analysis
Next Steps
Training - EDPs
SFS aligns with FM's practice of having staff create and
maintain Employee Development Plans -- written documents
which outline an individual's professional goals over a 2-3 year
time-span. These plans typically include goals, alignment with
UW/FM/SFS needs, means defined to achieve the goals, the
time-frame for meeting goals, and resource required (e.g.,
funding, release-time, etc.) EDPs are considered "active" if
written or updated within the past two years.
Measure only includes head-counts of staff who were
employed through the end of the fiscal year.
SFS seeks to have 100% of staff retain active EDPs annually.
SFS has undergone significant turmoil over the course of the
past year, with staff departing and job duties being shuffled to
accommodate an increased workload. This, coupled with
declining budget allocation for training and several staff having
met or exceeded their EDP goals, have lead to less attention
being paid to updating EDPs and/or their taking on additional
individual professional development activity.
Supervisory staff will need to include EDP reviews as part of
annual reviews in order to ensure that all staff have current
EDPs in place, and a concerted oversight effort needs to be
made to sustain active EDP status.
12%
15%
12%
28%
59%
73%88%
72%
41%
0%
25%
50%
75%
100%
2008 2009 2010 2011
Percentage of SFS Personnel EDPs by Status
No EDP Inactive EDP Active EDP
3
4
37
13
19
2218
9
0
5
10
15
20
25
30
2008 2009 2010 2011
Number of SFS Personnel EDPs by Status
No EDP Inactive EDP Active EDP
SFS Dashboard Report 17
LEAN Projects Navigate: Dashboard TOC Appendix
Definition
Analysis
Next Steps
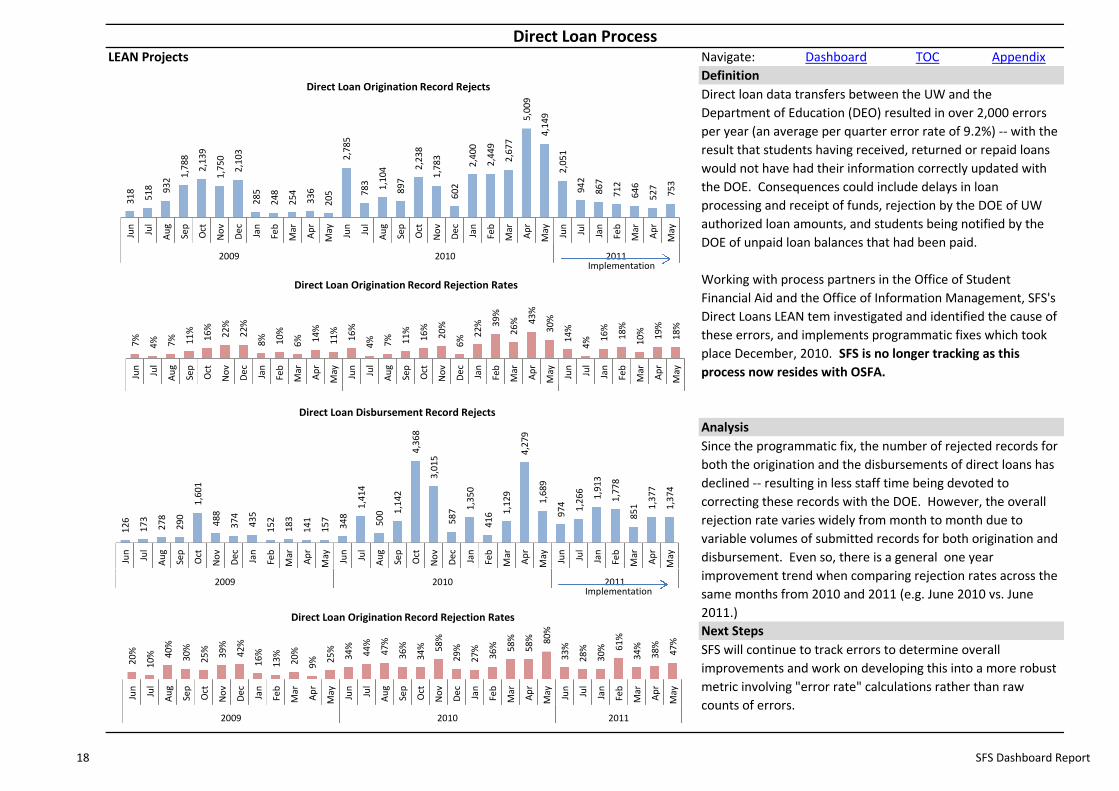
Direct Loan Process
Direct loan data transfers between the UW and the
Department of Education (DEO) resulted in over 2,000 errors
per year (an average per quarter error rate of 9.2%) -- with the
result that students having received, returned or repaid loans
would not have had their information correctly updated with
the DOE. Consequences could include delays in loan
processing and receipt of funds, rejection by the DOE of UW
authorized loan amounts, and students being notified by the
DOE of unpaid loan balances that had been paid.
Working with process partners in the Office of Student
Financial Aid and the Office of Information Management, SFS's
Direct Loans LEAN tem investigated and identified the cause of
these errors, and implements programmatic fixes which took
place December, 2010. SFS is no longer tracking as this
process now resides with OSFA.
SFS will continue to track errors to determine overall
improvements and work on developing this into a more robust
metric involving "error rate" calculations rather than raw
counts of errors.
Since the programmatic fix, the number of rejected records for
both the origination and the disbursements of direct loans has
declined -- resulting in less staff time being devoted to
correcting these records with the DOE. However, the overall
rejection rate varies widely from month to month due to
variable volumes of submitted records for both origination and
disbursement. Even so, there is a general one year
improvement trend when comparing rejection rates across the
same months from 2010 and 2011 (e.g. June 2010 vs. June
2011.)
31
8
51
8 93
2 1,7
88
2,1
39
1,7
50
2,1
03
28
5
24
8
25
4
33
6
20
5
2,7
85
78
3 1,1
04
89
7
2,2
38
1,7
83
60
2
2,4
00
2,4
49
2,6
77
5,0
09
4,1
49
2,0
51
94
2
86
7
71
2
64
6
52
7
75
3
Jun
Jul
Au
g
Sep
Oct
No
v
De
c
Jan
Feb
Mar
Ap
r
May Jun
Jul
Au
g
Sep
Oct
No
v
De
c
Jan
Feb
Mar
Ap
r
May Jun
Jul
Jan
Feb
Mar
Ap
r
May
2009 2010 2011
Direct Loan Origination Record Rejects
Implementation
12
6
17
3
27
8
29
0
1,6
01
48
8
37
4
43
5
15
2
18
3
14
1
15
7
34
8
1,4
14
50
0 1,1
42
4,3
68
3,0
15
58
7 1,3
50
41
6 1,1
29
4,2
79
1,6
89
97
4 1,2
66
1,9
13
1,7
78
85
1 1,3
77
1,3
74
Jun
Jul
Au
g
Sep
Oct
No
v
De
c
Jan
Feb
Mar
Ap
r
May Jun
Jul
Au
g
Sep
Oct
No
v
De
c
Jan
Feb
Mar
Ap
r
May Jun
Jul
Jan
Feb
Mar
Ap
r
May
2009 2010 2011
Direct Loan Disbursement Record Rejects
Implementation
7%
4% 7% 11
%
16
%
22
%
22
%
8% 10
%
6% 1
4%
11
%
16
%
4% 7% 11
%
16
%
20
%
6% 2
2% 3
9%
26
% 43
%
30
%
14
%
4% 1
6%
18
%
10
% 19
%
18
%
Jun
Jul
Au
g
Sep
Oct
No
v
De
c
Jan
Feb
Mar
Ap
r
May Jun
Jul
Au
g
Sep
Oct
No
v
De
c
Jan
Feb
Mar
Ap
r
May Jun
Jul
Jan
Feb
Mar
Ap
r
May
2009 2010 2011
Direct Loan Origination Record Rejection Rates
20
%
10
% 40
%
30
%
25
%
39
%
42
%
16
%
13
%
20
%
9% 2
5%
34
%
44
%
47
%
36
%
34
% 58
%
29
%
27
%
36
% 58
%
58
% 80
%
33
%
28
%
30
% 61
%
34
%
38
%
47
%
Jun
Jul
Au
g
Sep
Oct
No
v
De
c
Jan
Feb
Mar
Ap
r
May Jun
Jul
Au
g
Sep
Oct
No
v
De
c
Jan
Feb
Mar
Ap
r
May Jun
Jul
Jan
Feb
Mar
Ap
r
May
2009 2010 2011
Direct Loan Origination Record Rejection Rates
18 SFS Dashboard Report

LEAN Projects Navigate: Dashboard TOC Appendix
Definition
Analysis
Next Steps
Scholarships Process
SFS handles a variety of scholarship and sponsored payments
that do not originate with the Office of Student Financial Aid,
including receiving and processing private scholarships. SFS
embarked on a LEAN project to improve the processes related
to private scholarships.
A key metric is the amount of time it takes to process a check
in order to have the scholarship applied to the appropriate
student account. The check deposit process as currently
measured involves identifying the student, the sponsor, the
appropriate scholarship budget, and the scholarship amount,
and determining if the payment is for a single quarter or
multiple quarters, and for which specific quarters -- and keying
this data into a database which is used to apply the scholarship
to the students' account. Streamlining this process can reduce
the amount of time required per check.
SFS seeks to reduce the per check deposit processing time.
Process improvements as a result of the LEAN project have
netted substantial gains over the past two months, lowering
the average time to process a check for deposit from 5 minutes
to 2 minutes. This was primarily accomplished by allowing
staff to dedicate blocks of time to processing tasks (e.g.,
schedule time for the activity without additional overlapping
duties such as answering general customer service calls.)
Time was not tracked or reported for June - no data available.
Continue tracking time for deposits and gather historical data
for additional context.
0:07
0:06
0:09
0:06
0:05
0:020:02
0:01
Goal (<=)0:05
0:00
0:01
0:02
0:04
0:05
0:07
0:08
0:10
0:11
Mar Apr May Apr May Jul Aug Sep
2010 2011
Time (Minutes)
Scholarship Check Deposits - Time to Deposit
340299
74137
3789
895
274
0100200300400500600700800900
1000
Mar Apr May Apr May Jul Aug Sep
2010 2011
Scholarship Check Deposits - Number of Checks
SFS Dashboard Report 19

Navigate: Dashboard TOC Appendix
2011
Description Autumn Winter Spring Summer
53,891 50,834 57,944 29,863
49,050 47,439 45,529 17,690
468,877 413,036 416,394 166,668
Not reported Not reported Not reported Not reported
160,233,460$ 159,259,458$ 148,363,309$ 38,880,376$
850,443$ 672,749$ 870,532$ 782,102$
0.53% 0.42% 0.59% 2.01%
97.96% 92.49% 94.14% 87.80%
156,961,857$ 147,296,772$ 139,666,462$ 34,135,413$
98.59% 97.32% 97.48% N/A
157,974,739$ 154,991,976$ 144,624,019$ N/A
99.47% 98.11% 98.77% 97.32%
159,383,016$ 156,256,458$ 146,535,566$ 37,837,653$
Not reported Not reported Not reported Not reported
Not reported Not reported Not reported Not reported
# Loan Accounts Not reported Not reported Not reported Not reported
Not reported Not reported Not reported Not reported
34 32 0 0
106,479$ 62,240$ -$ -$
99.98% 99.99% 99.99% 99.34%
98.33% 98.55% 99.30% 99.49%
84.87% 100.00% 99.85% 99.07%
100.00% 99.95% 99.90% 100.00%
47 30 20 114
138,647$ 104,607$ 103,999$ 774,993$
6 3 Discontinued Discontinued
7,548$ 105$ Discontinued Discontinued
1,874 1,735 1,670 1,168
217,460$ 177,400$ 174,430$ 113,420$
3.8% 3.7% 3.7% 6.6%
123 143 119 132
105 110 91 97
85% 77% 76% 73%
% direct loans reconciled
% other loans reconciled
# of Checks
# Approved
# Received
% Students w/Paid Late
% Approved
Late Pay Charges
$ Amount
# of Late Charges
100.00%
50,217$
3
29,537
27
58,500$
167,803Student Account Transactions # of Transactions (all types)
65%
43
Not reported
782,101$
5,135$
1,169
113,050$
6.7%
118
77
2.02%
% scholarships reconciled
Returned Checks (Students) [1]
Returned Checks (Departments)
$ Amount
# of Checks
$ Amount
$ Amount paid by Registration
% Paid by End of Quarter
$ Paid by End of Quarter
# of Tuition Accounts
$ Tuition Accounts
$ Loans Accounts
# Overawards
$ Overawards
% bank accounts reconciledBudgets Reconciled By Deadline
10th Day Enrollment (all campuses)
Tuition Accounts Referred To Collection
88.31%
34,135,412$
N/A
# of Students
# of Tuition Accounts
Current Quarter Amount
End of Quarter Amount
% of Amount Unpaid
% Paid by Due Date
$ Amount paid by Due Date
% Paid by Registration
Tuition Billed
Appendix - Data Summary
Delinquent Tuition Balance
Active Student Accounts # of Accounts with Activity
38,655,755$
2010
17,523
Summer
162
Unpaid At End Of Quarter
Uncollectible Receivables
Petitions
N/A
97.98%
37,873,652$
Not reported
Not reported
Not reported
99.94%
99.41%
99.39%
20 SFS Dashboard Report
Navigate: Dashboard TOC Appendix
2011
Description Autumn Winter Spring Summer
202,086,172$ 192,396,247$ 185,816,614$ 55,243,075$
155,838,988$ 159,203,511$ 151,336,084$ 15,642,728$
77% 83% 81% 28%
4,211 3,447 3,404 613
32,885 27,294 33,925 9,258
60,090,712$ 55,165,894$ 51,978,237$ 17,641,037$
89% 89% 91% 94%
1,801 1,588 1,404 668
2,136 2,124 1,728 786
1,627 1,039 1,075 859
118 101 155 65
5,564 4,751 4,207 2,313
3,611 3,692 3,398 1,043
10,897,379 11,616,188 10,755,346 2,494,847
118 111 89 41
3.3% 3.0% 2.6% 3.9%
28,408 27,068 28,591 13,899
59,640,711$ 56,394,962$ 56,645,630$ 20,411,251$
560 395 475 220
2.0% 1.5% 1.7% 1.6%
2,138 1,871 1,636 995
8,512,260$ 7,289,931$ 6,858,840$ 2,791,426$
9,775 8,198 7,611 2,926
67,042 59,925 67,550 25,195
76,817 68,123 75,161 28,121
12.7% 12.0% 10.1% 10.4%
87.3% 88.0% 89.9% 89.6%
4,358 2,520 2,379 2,873
10,362,409$ 4,395,998$ 5,668,211$ 3,954,191$
998 910 772 377
4,164,755$ 1,095,952$ 3,036,454$ 154,726$
3,360 1,610 1,607 2,496
6,197,654$ 3,300,046$ 2,631,758$ 3,799,465$
93% 88% 89% 95%
76
2,892
51,020,599$
# Cashier/Manual Payments, Checks Issued
# Lockbox, Web, CC Payments, Direct Deposits
Total # Payments and Disbursements/Refunds
% Lockbox, Web, CC, Direct Deposits
% Cashier/Manual, Checks
1,485
Checks Processed (Manual)
Cash Transmittals (CTs)
Total # Student Account Payments
# Payments
$ Amount
# Errors
% Lockbox Errors
# Payments
2010
Summer
Appendix - Data Summary (Continued)
15,166,960$$ Disbursed 1st Week
% Disbursed 1st Week
Number Aid + Refund Checks
Number of ACH Records
ACH Dollar Amount
% of Students Using ACH
Cash Transactions (approx. #)
$ Amount
Checks Processed (POP)
Cashier Payments
$ Amount
# Web Check Errors
% Web Check Errors
# CC Payments
Lockbox Payment Errors
$ Amount
Total Remote Transactions
Total Transactions
% Of Total In House
% Of Total Remote 85.0%
3,012
861,212$
Total In House Transactions
Web Check Payments
Web Check Payment Errors
Lockbox Payments
Web Credit Card Payments
Disbursements For Quarter
Guaranteed Sponsor Bills Paid <= 60 Days 92%
Scholarship - Sponsor Payments
(total of Billed + Prepaid)
Sponsor Payments Received - Billed
Sponsor Payments Received - Prepaid 2,721
4,046,626$
# of Payments
$ Amount
# of Bills
$ Amount
# of Prepays
$ Amount
% Paid
4,907,838$
291
53
3.6%
16,691,245$
223
1.8%
12,631
1,468
2,885,787
30%
9,588
19,161,312$
87%
822
1,044
1,026
1,047
2,857,644$
4,377
24,734
29,111
15.0%
SFS Dashboard Report 21

Navigate: Dashboard TOC Appendix
2011
Description Autumn Winter Spring Summer
200 191 247 267
317,526$ 401,708$ 482,640$ 880,516$
146 123 152 95
154,370$ 152,696$ 213,944$ 123,258$
32 25 38 44
86,006$ 55,988$ 97,150$ 124,679$
Overawards - Received Number 245
Appendix - Data Summary (Continued)
Overawards - Referred to Collection Number
$ Amount
Invoices Number Assigned
$ Amount
Overawards - Collected (Paid In Full) Number
$ Amount
[1] "Returned Checks" refer to checks processed by cashiers, and excludes web checks and lockbox processed checks. These other types are caputured under "web check errors" and
"lockbox errors". Values are higher for Summer 2011 than prior quarters due to a change in how data is extracted which counts "returned checks" based on banking data prior to its upload
to SDB (prior extractions relied on data from SDB after the file upload and after adjustments had been made to student accounts). The change results in a more accurate count of total
number of "returned checks" due to NSF, and their total dollar amount, than that provided by the prior SDB-based extractions. This technique will be used in all future reporting.
Number Paid Discontinued
Total Outstanding $ Amount Discontinued
38
99,187$
Discontinued
759,412$
56
73,367$
2010
Summer
22 SFS Dashboard Report