Embed Size (px)
Citation preview

Operational Interruption Cost Assessment Methodology IATA -Airline Cost Conference 2016
August 2016 Maintenance Economics - OI Cost Assessment Methodology
Maintenance Economics Annika WOLF

© AIRBUS S.A.S. All rights reserved. Confidential and proprietary document.
Content
August 2016 Maintenance Economics - OI Cost Assessment Methodology
#2 Scope #3 Model Parameters #4 OI Cost Illustration #5 Pitfalls #6 Key Message & Outlook
#1 Definition & Context

© AIRBUS S.A.S. All rights reserved. Confidential and proprietary document.
#1 Definition & Context
*Flight dispatch delays greater than 15min. This incl. ground turn-backs, aborted take-offs and aircraft substitutions if causing delay greater than 15 min
August 2016 Maintenance Economics - OI Cost Assessment Methodology
Diversions
Airborne Interruption
Delays* Cancellations In-Flight Turn-Backs
Operational Interruptions are composed of :
Ground Interruption
as per ATA SPEC2000 definition
The OI Cost Model aims at… making the hidden cost visible
fostering awareness about the cost drivers
supporting prioritization of OI reduction initiatives to efficiently increase the operational reliability of a given fleet

© AIRBUS S.A.S. All rights reserved. Confidential and proprietary document.
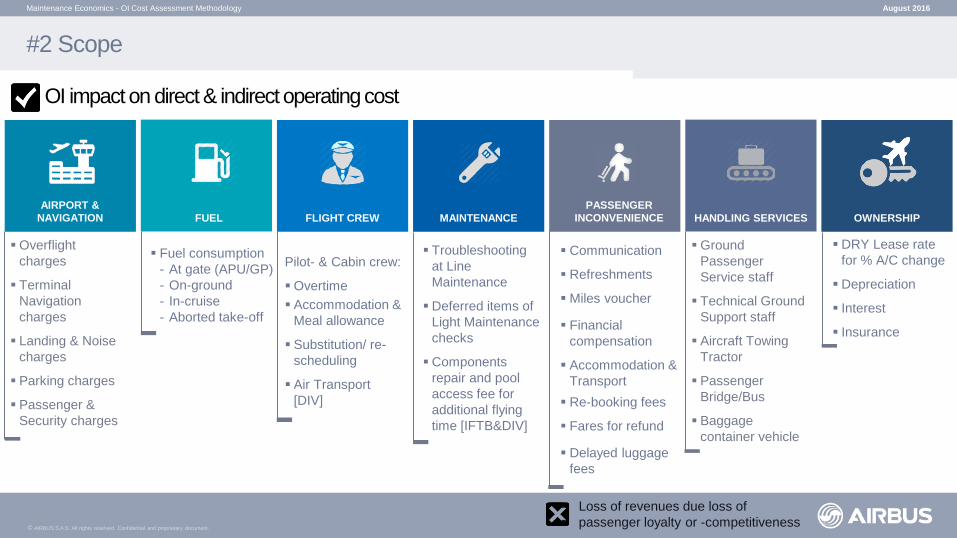
#2 Scope
August 2016 Maintenance Economics - OI Cost Assessment Methodology
Impact on
Total Operating Cost
Focus on additional & avoidable costs triggered by interruptions of scheduled revenue flights. “
” AIRPORT &
NAVIGATION FUEL GROUND CREW
& HANDLING SERVICES PASSENGER
INCONVENIENCE OWNERSHIP FLIGHT CREW MAINTENANCE
© AIRBUS S.A.S. All rights reserved. Confidential and proprietary document.
#2 Scope
August 2016 Maintenance Economics - OI Cost Assessment Methodology
AIRPORT & NAVIGATION FUEL HANDLING SERVICES
PASSENGER INCONVENIENCE OWNERSHIP FLIGHT CREW MAINTENANCE
Overflight charges
Terminal Navigation charges
Landing & Noise charges
Parking charges
Passenger & Security charges
Fuel consumption - At gate (APU/GP) - On-ground - In-cruise - Aborted take-off
Pilot- & Cabin crew:
Overtime Accommodation &
Meal allowance
Substitution/ re-scheduling
Air Transport [DIV]
Troubleshooting at Line Maintenance
Deferred items of Light Maintenance checks
Components repair and pool access fee for additional flying time [IFTB&DIV]
Communication
Refreshments
Miles voucher
Financial compensation
Accommodation & Transport Re-booking fees
Fares for refund
Delayed luggage fees
Ground Passenger Service staff
Technical Ground Support staff
Aircraft Towing Tractor
Passenger Bridge/Bus
Baggage container vehicle
DRY Lease rate for % A/C change
Depreciation
Interest
Insurance
Loss of revenues due loss of passenger loyalty or -competitiveness
OI impact on direct & indirect operating cost
© AIRBUS S.A.S. All rights reserved. Confidential and proprietary document.
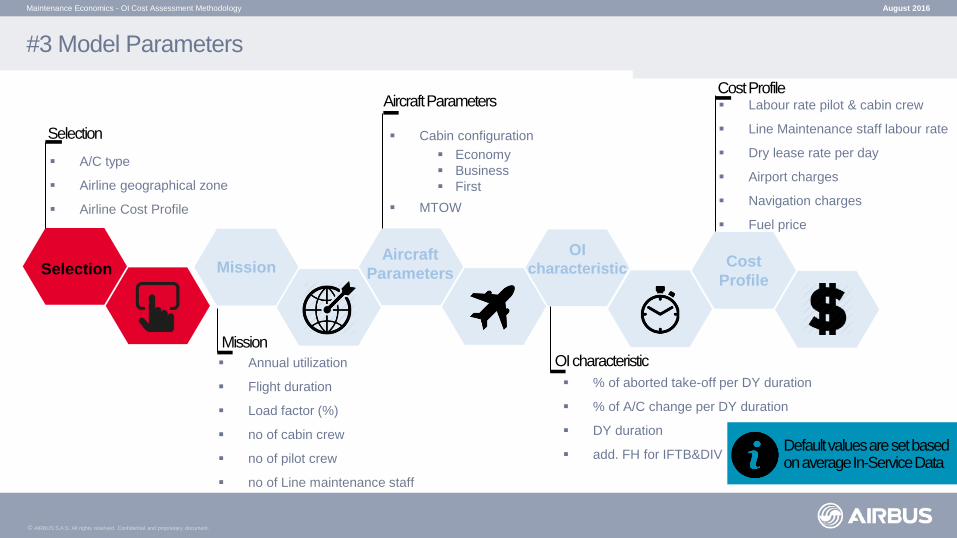
#3 Model Parameters
August 2016 Maintenance Economics - OI Cost Assessment Methodology
Selection Mission Aircraft
Parameters
A/C type
Airline geographical zone
Airline Cost Profile
Selection
Annual utilization
Flight duration
Load factor (%)
no of cabin crew
no of pilot crew
no of Line maintenance staff
Mission
Cabin configuration Economy Business First
MTOW
Aircraft Parameters Labour rate pilot & cabin crew
Line Maintenance staff labour rate
Dry lease rate per day
Airport charges
Navigation charges
Fuel price
Cost Profile
Default values are set based on average In-Service Data
OI characteristic Cost
Profile
% of aborted take-off per DY duration
% of A/C change per DY duration
DY duration
add. FH for IFTB&DIV
OI characteristic
© AIRBUS S.A.S. All rights reserved. Confidential and proprietary document.
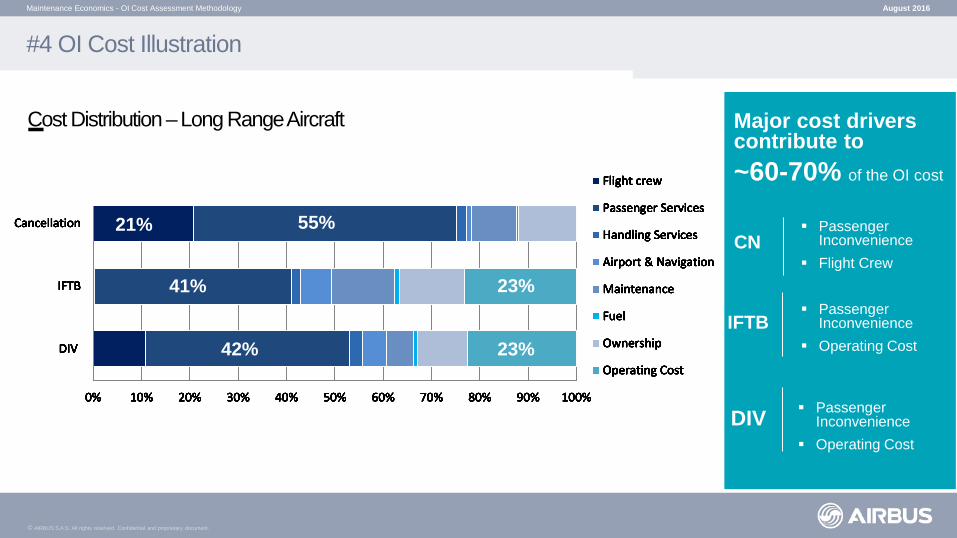
#4 OI Cost Illustration
August 2016 Maintenance Economics - OI Cost Assessment Methodology
Major cost drivers contribute to ~60-70% of the OI cost
0% 10% 20% 30% 40% 50% 60% 70% 80% 90% 100%
DIV
IFTB
Cancellation
1 H DelayFlight crew
Passenger Services
Handling Services
Airport & Navigation
Maintenance
Fuel
Ownership
Operating Cost
0% 10% 20% 30% 40% 50% 60% 70% 80% 90% 100%
DIV
IFTB
Cancellation
1 H DelayFlight crew
Passenger Services
Handling Services
Airport & Navigation
Maintenance
Fuel
Ownership
Operating Cost
0% 10% 20% 30% 40% 50% 60% 70% 80% 90% 100%
DIV
IFTB
Cancellation
1 H DelayFlight crew
Passenger Services
Handling Services
Airport & Navigation
Maintenance
Fuel
Ownership
Operating Cost
0% 10% 20% 30% 40% 50% 60% 70% 80% 90% 100%
DIV
IFTB
Cancellation
1 H DelayFlight crew
Passenger Services
Handling Services
Airport & Navigation
Maintenance
Fuel
Ownership
Operating Cost
0% 10% 20% 30% 40% 50% 60% 70% 80% 90% 100%
DIV
IFTB
Cancellation
1 H DelayFlight crew
Passenger Services
Handling Services
Airport & Navigation
Maintenance
Fuel
Ownership
Operating Cost
0% 10% 20% 30% 40% 50% 60% 70% 80% 90% 100%
DIV
IFTB
Cancellation
1 H DelayFlight crew
Passenger Services
Handling Services
Airport & Navigation
Maintenance
Fuel
Ownership
Operating Cost
0% 10% 20% 30% 40% 50% 60% 70% 80% 90% 100%
DIV
IFTB
Cancellation
1 H DelayFlight crew
Passenger Services
Handling Services
Airport & Navigation
Maintenance
Fuel
Ownership
Operating Cost
0% 10% 20% 30% 40% 50% 60% 70% 80% 90% 100%
DIV
IFTB
Cancellation
1 H DelayFlight crew
Passenger Services
Handling Services
Airport & Navigation
Maintenance
Fuel
Ownership
Operating Cost
CN 55% 21% Passenger
Inconvenience Flight Crew
IFTB
41% 23% Passenger
Inconvenience Operating Cost
DIV
42% 23%
Passenger Inconvenience
Operating Cost
Cost Distribution – Long Range Aircraft
© AIRBUS S.A.S. All rights reserved. Confidential and proprietary document.
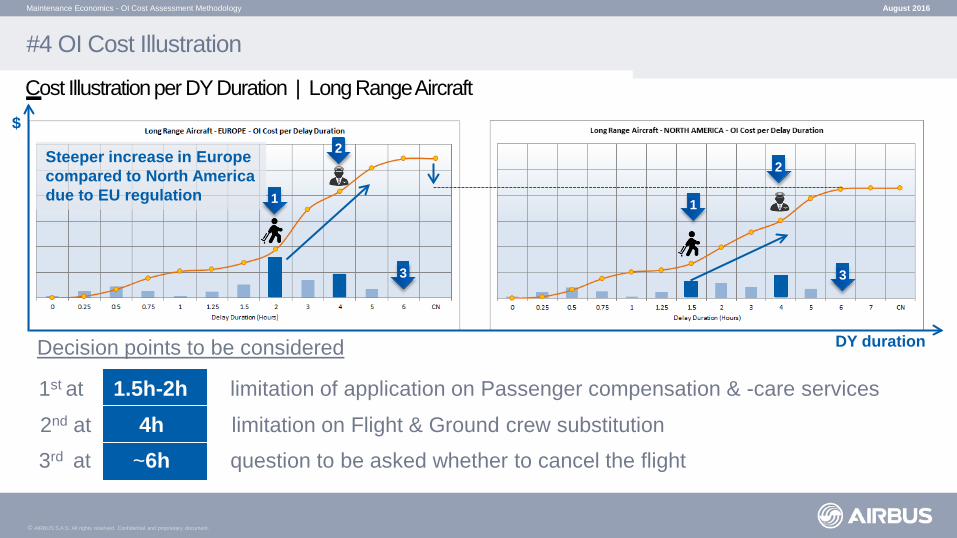
#4 OI Cost Illustration
August 2016 Maintenance Economics - OI Cost Assessment Methodology
Cost Illustration per DY Duration | Long Range Aircraft
3 3
Steeper increase in Europe compared to North America due to EU regulation
1st at 1.5h-2h limitation of application on Passenger compensation & -care services
2nd at 4h limitation on Flight & Ground crew substitution
3rd at ~6h question to be asked whether to cancel the flight
Decision points to be considered
1 1
2 2
DY duration
$

© AIRBUS S.A.S. All rights reserved. Confidential and proprietary document.
| Passenger Load Factor & Cabin Configuration - Single Aisle Aircraft
The Passenger Load Factor influences the CN cost at almost same rate with
#4 OI Cost Illustration
August 2016 Maintenance Economics - OI Cost Assessment Methodology
Cost Influencing Parameter
+8.7% increase of CN cost
Both Load Factor and cabin configuration* directly impact the Passenger Inconvenience cost
* Cabin configuration: Total number of seats and class distribution
DY duration
$
75% 85%
~1%
© AIRBUS S.A.S. All rights reserved. Confidential and proprietary document.
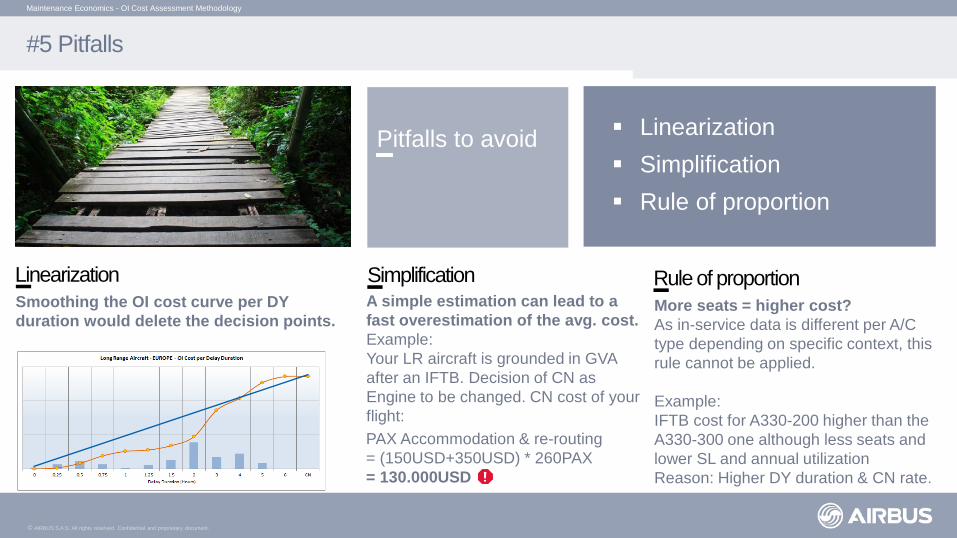
#5 Pitfalls
August 2016
Maintenance Economics - OI Cost Assessment Methodology
A simple estimation can lead to a fast overestimation of the avg. cost. Example: Your LR aircraft is grounded in GVA after an IFTB. Decision of CN as Engine to be changed. CN cost of your flight:
Simplification
Pitfalls to avoid
Linearization Smoothing the OI cost curve per DY duration would delete the decision points.
Linearization Simplification Rule of proportion
Rule of proportion More seats = higher cost? As in-service data is different per A/C type depending on specific context, this rule cannot be applied. Example: IFTB cost for A330-200 higher than the A330-300 one although less seats and lower SL and annual utilization Reason: Higher DY duration & CN rate.
PAX Accommodation & re-routing = (150USD+350USD) * 260PAX = 130.000USD
© AIRBUS S.A.S. All rights reserved. Confidential and proprietary document.
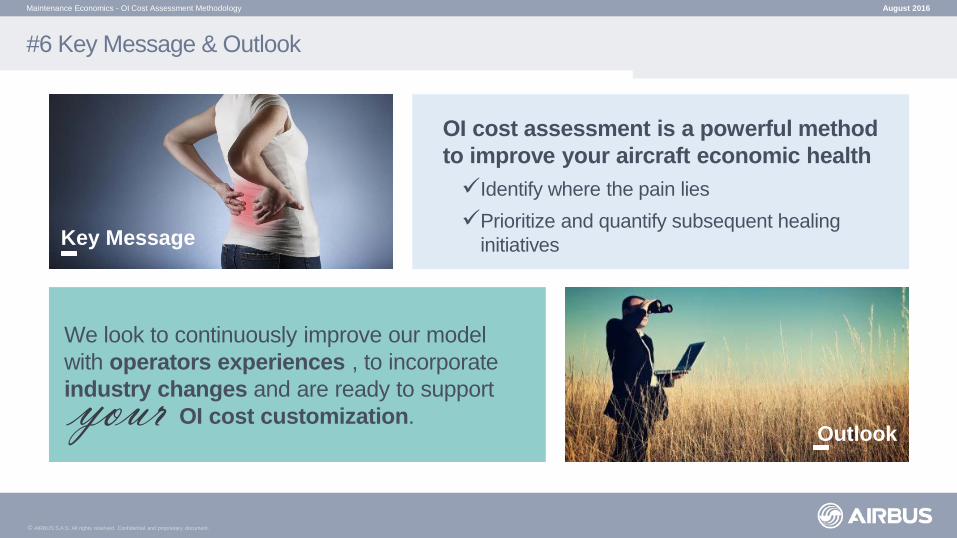
#6 Key Message & Outlook
OI cost assessment is a powerful method to improve your aircraft economic health Identify where the pain lies Prioritize and quantify subsequent healing
initiatives
August 2016 Maintenance Economics - OI Cost Assessment Methodology
Key Message
We look to continuously improve our model with operators experiences , to incorporate industry changes and are ready to support OI cost customization.
Outlook your
© AIRBUS S.A.S. All rights reserved. Confidential and proprietary document.
August 2016 Maintenance Economics - OI Cost Assessment Methodology
© Airbus S.A.S. All rights reserved. Confidential and proprietary document. This document and all information contained herein is the sole property of AIRBUS. No intellectual property rights are granted by the delivery of this document or the disclosure of its content. This document shall not be reproduced or disclosed to a third party without the express written consent of AIRBUS S.A.S. This document and its content shall not be used for any purpose other than that for which it is supplied. The statements made herein do not constitute an offer. They are based on the mentioned assumptions and are expressed in good faith. Where the supporting grounds for these statements are not shown, AIRBUS S.A.S. will be pleased to explain the basis thereof. AIRBUS, its logo, A300, A310, A318, A319, A320, A321, A330, A340, A350, A380, A400M are registered trademarks.

© AIRBUS S.A.S. All rights reserved. Confidential and proprietary document.
Contact
August 2016 Maintenance Economics - OI Cost Assessment Methodology
Annika Wolf [email protected] Maintenance Economics Manager
Contact