Embed Size (px)
Citation preview
AirAsia X Berhad First Quarter 2014 Results
- Investor and Analyst Briefing -

Information contained in our presentation is intended solely for your reference. Such
information is subject to change without notice, its accuracy is not guaranteed and it
may not contain all material information concerning the Company. Neither we nor
our advisors make any representation regarding, and assumes no responsibility or
liability for, the accuracy or completeness of, any errors or omissions in, any
information contained herein.
In addition, the information may contain projections and forward-looking statements
that reflect the company’s current views with respect to future events and financial
performance. These views are based on current assumptions which are subject to
various risk factors and which may change over time. No assurance can be given
that future events will occur, that projections will be achieved, or that the company’s
assumptions are correct. Actual results may differ materially from those projected.
This presentation is strictly not to be distributed without the explicit consent of the
Company’s management under any circumstances.
Disclaimer
2
3
Executive Summary: Key Takeaways for 1Q14 Briefing
Business Updates
First Quarter 2014 Key Operating & Financial Highlights
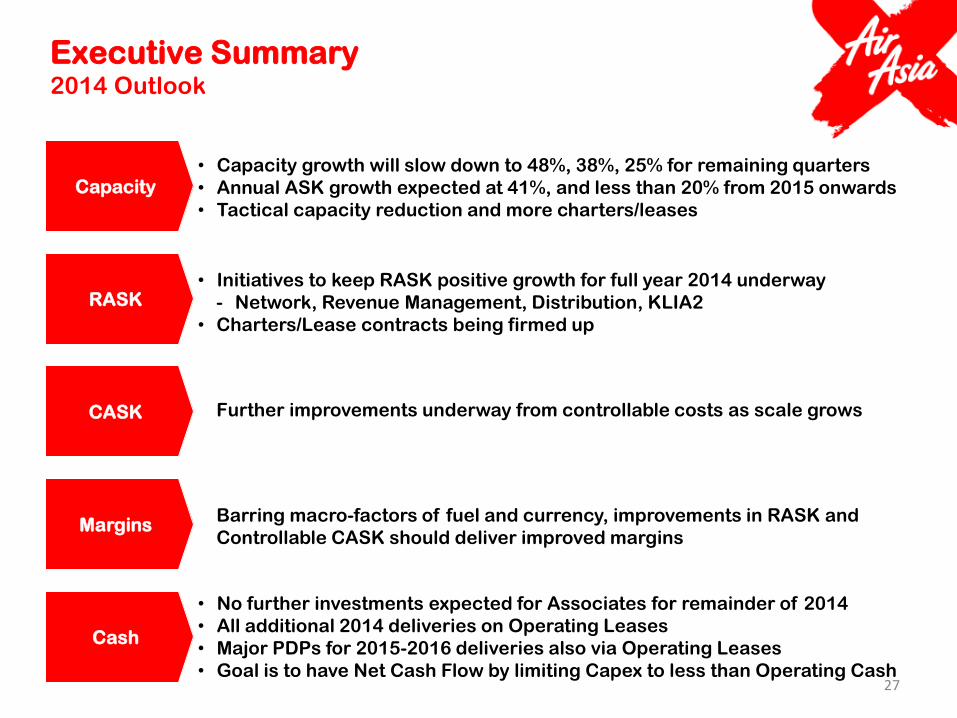
Executive Summary: 2014 Outlook
Appendix
Table of Content
4
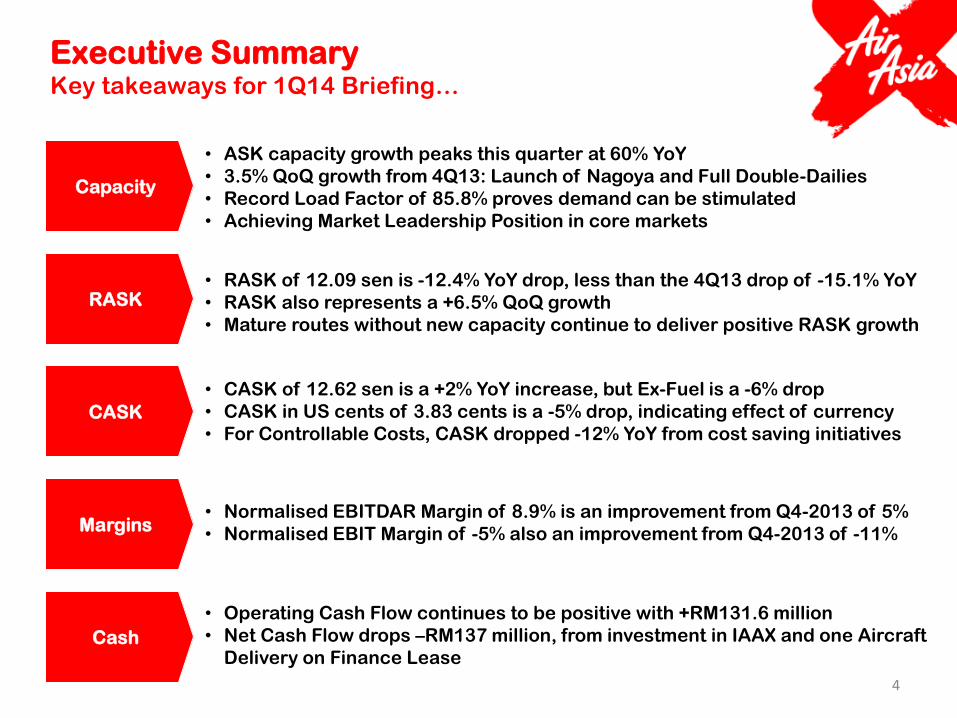
Executive Summary Key takeaways for 1Q14 Briefing…
Capacity
RASK
CASK
Margins
Cash
• ASK capacity growth peaks this quarter at 60% YoY
• 3.5% QoQ growth from 4Q13: Launch of Nagoya and Full Double-Dailies
• Record Load Factor of 85.8% proves demand can be stimulated
• Achieving Market Leadership Position in core markets
• RASK of 12.09 sen is -12.4% YoY drop, less than the 4Q13 drop of -15.1% YoY
• RASK also represents a +6.5% QoQ growth
• Mature routes without new capacity continue to deliver positive RASK growth
• CASK of 12.62 sen is a +2% YoY increase, but Ex-Fuel is a -6% drop
• CASK in US cents of 3.83 cents is a -5% drop, indicating effect of currency
• For Controllable Costs, CASK dropped -12% YoY from cost saving initiatives
• Operating Cash Flow continues to be positive with +RM131.6 million
• Net Cash Flow drops –RM137 million, from investment in IAAX and one Aircraft
Delivery on Finance Lease
• Normalised EBITDAR Margin of 8.9% is an improvement from Q4-2013 of 5%
• Normalised EBIT Margin of -5% also an improvement from Q4-2013 of -11%

5
Business Updates

6
LCC Market Share from Southeast Asia “AirAsia Group Clear Market Leader” in all core markets
Notes: - AA Group: AAB, AAX, TAA, IAA, and PAA - Tig-Scoot: Tiger, and Scoot - Others in South Korea: Jeju Air, Jin Air, Eastar Jet, T’way Air, and Air Busan - Others in China: Spring Air
Source: IATA Passenger Intelligence System (PaxIs) YE Dec’13
AA Group 66%
AA Group 58%
AA Group 46%
AA Group 45%
AA Group 27%
Jetstar 8%
Jetstar 31% Jetstar
39%
Jetstar 13%
Tig-Scoot 15%
Tig-Scoot 3%
Tig-Scoot 15%
Tig-Scoot 32%
Cebu 6% Cebu 7% Cebu 10%
Cebu 17%
Others 5% Others 1%
Others 56%
China Japan Australia Taiwan South Korea
AA Group Jetstar Tiger-Scoot Cebu Others
AirAsia X is also the Overall (LCC + FSC) Market Leader in Passengers
Carried between Malaysia and each of the Five Core Markets above
7
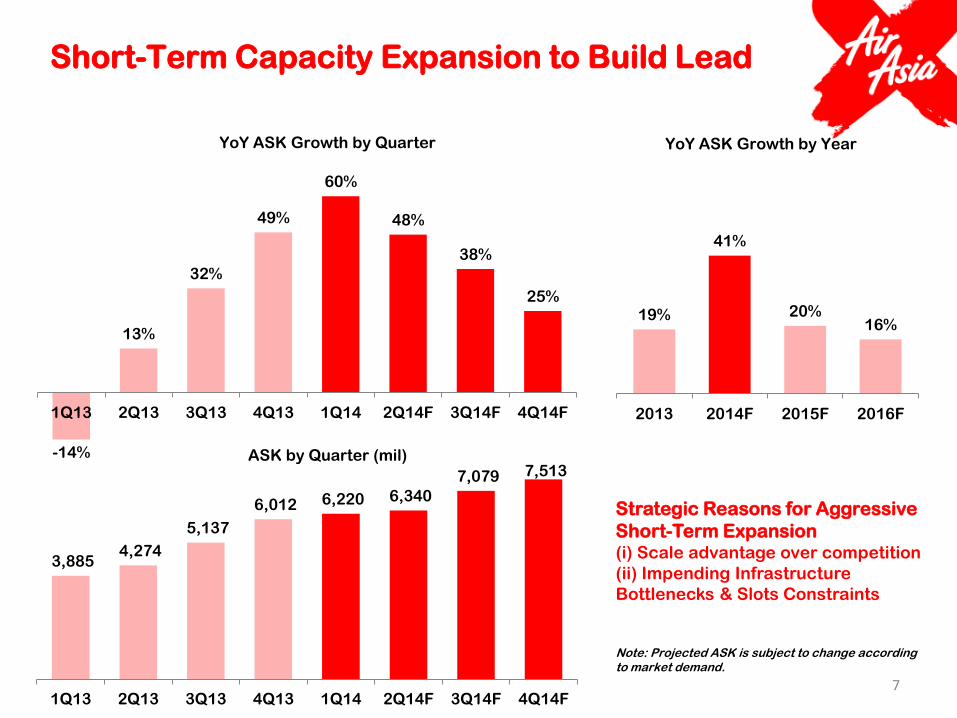
Short-Term Capacity Expansion to Build Lead
-14%
13%
32%
49%
60%
48%
38%
25%
1Q13 2Q13 3Q13 4Q13 1Q14 2Q14F 3Q14F 4Q14F
YoY ASK Growth by Quarter
3,885 4,274
5,137
6,012 6,220 6,340
7,079 7,513
1Q13 2Q13 3Q13 4Q13 1Q14 2Q14F 3Q14F 4Q14F
ASK by Quarter (mil)
19%
41%
20% 16%
2013 2014F 2015F 2016F
YoY ASK Growth by Year
Strategic Reasons for Aggressive
Short-Term Expansion (i) Scale advantage over competition
(ii) Impending Infrastructure
Bottlenecks & Slots Constraints
Note: Projected ASK is subject to change according to market demand.
8
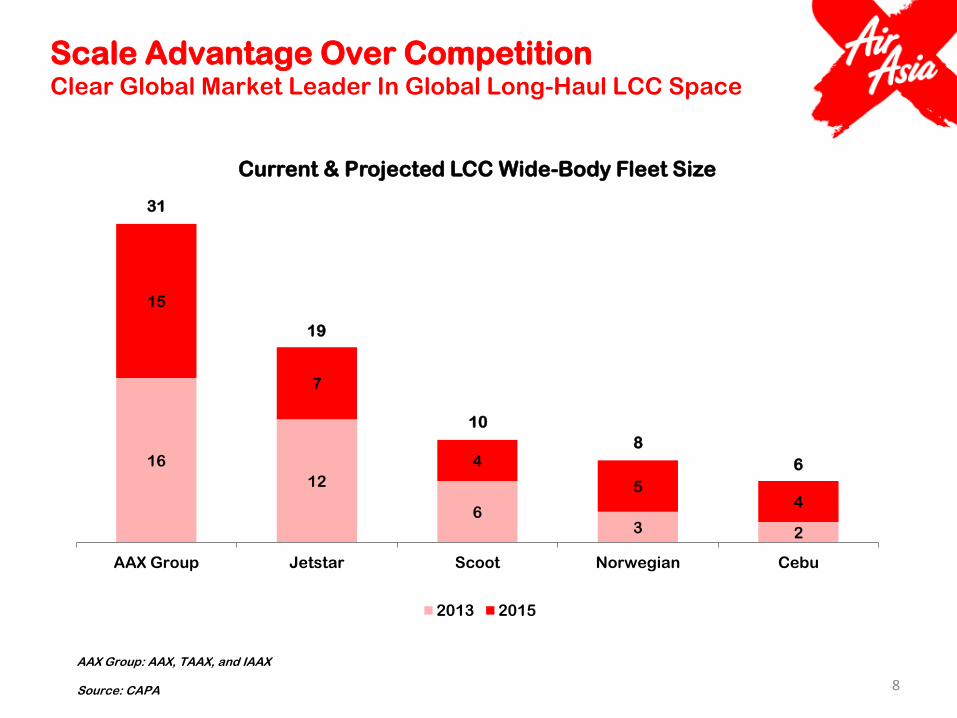
Scale Advantage Over Competition Clear Global Market Leader In Global Long-Haul LCC Space
16
12
6 3 2
15
7
4
5 4
AAX Group Jetstar Scoot Norwegian Cebu
Current & Projected LCC Wide-Body Fleet Size
2013 2015
AAX Group: AAX, TAAX, and IAAX Source: CAPA
31
19
10
8
6

16 16
23
30
38
46
53
7
5
4
1
3
4
7
7
4
2
2
1
1
2013 2014 2015 2016 2017 2018 2019
A330-300 Existing A330-300 Previous Order A330-300 New Order A340-300 Existing A330-200 Existing
38
Fleet Size and Delivery Schedule
9
19
26
31
46
53
57
+37%
+19%
+23%
+21%
+15%
+8%

10
RASK To Stabilize With Time Our Route Portfolio Matures….
9.58
10.59
12.00 12.06
2010 2011 2012 2013
RASK (RM sen)
11
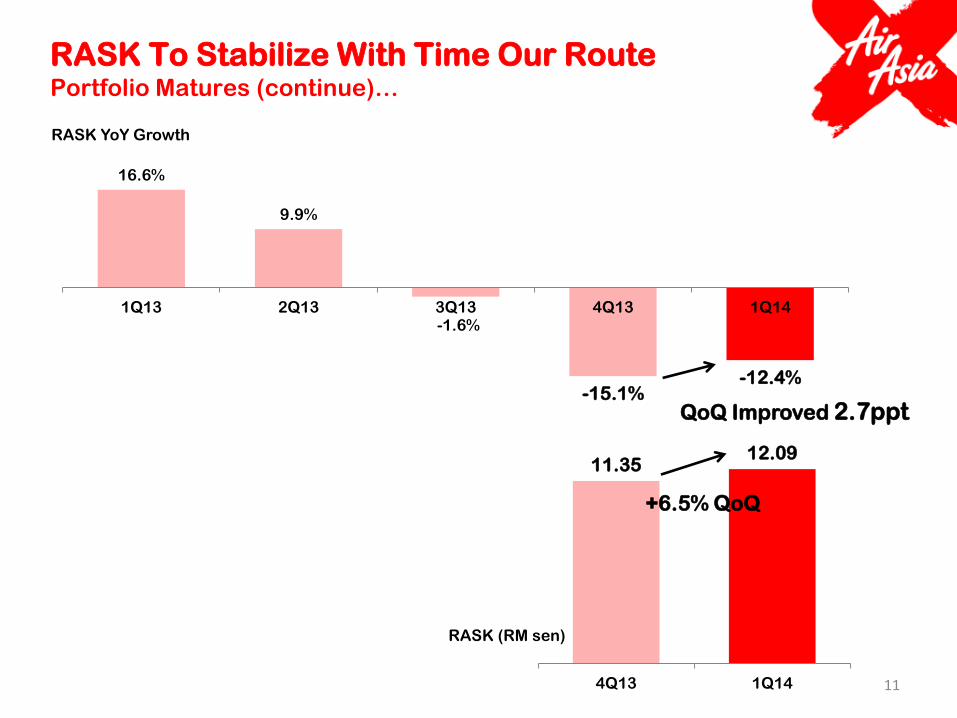
RASK To Stabilize With Time Our Route Portfolio Matures (continue)…
16.6%
9.9%
-1.6%
-15.1% -12.4%
1Q13 2Q13 3Q13 4Q13 1Q14
RASK YoY Growth
11.35 12.09
4Q13 1Q14
QoQ Improved 2.7ppt
+6.5% QoQ
RASK (RM sen)

-20%
-15%
-10%
-5%
0%
-5% 0% 5% 10% 15% 20% 25% 30% 35% 40% 45% 50% 55% 60% 65%
12
Industry Performance On ASK & RASK For Quarter Ended March 2014
ASK YoY Growth
RASK YoY Growth
Source: Company’s financial report / presentation slides on website
-45%
13
Initiatives To Deliver Positive RASK Growth Progress Update…
Increased Network Connectivity
Origin-Destination Revenue Management
Broader Distribution Mix
KLIA2 Passenger Experience
14
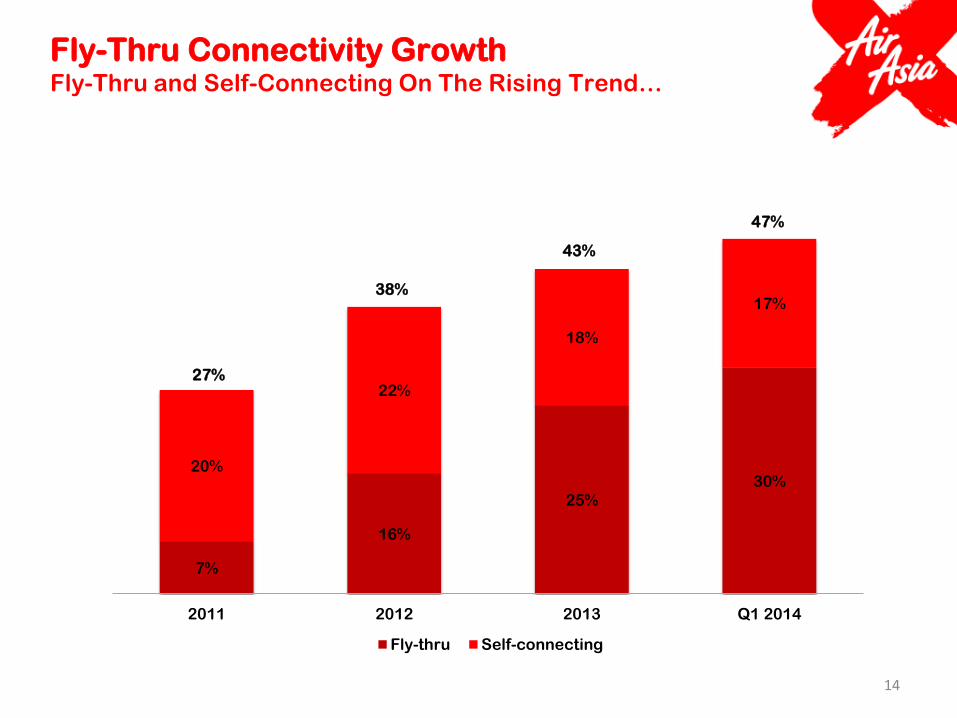
Fly-Thru Connectivity Growth Fly-Thru and Self-Connecting On The Rising Trend…
7%
16%
25%
30% 20%
22%
18%
17%
2011 2012 2013 Q1 2014
Fly-thru Self-connecting
27%
38%
43%
47%
15
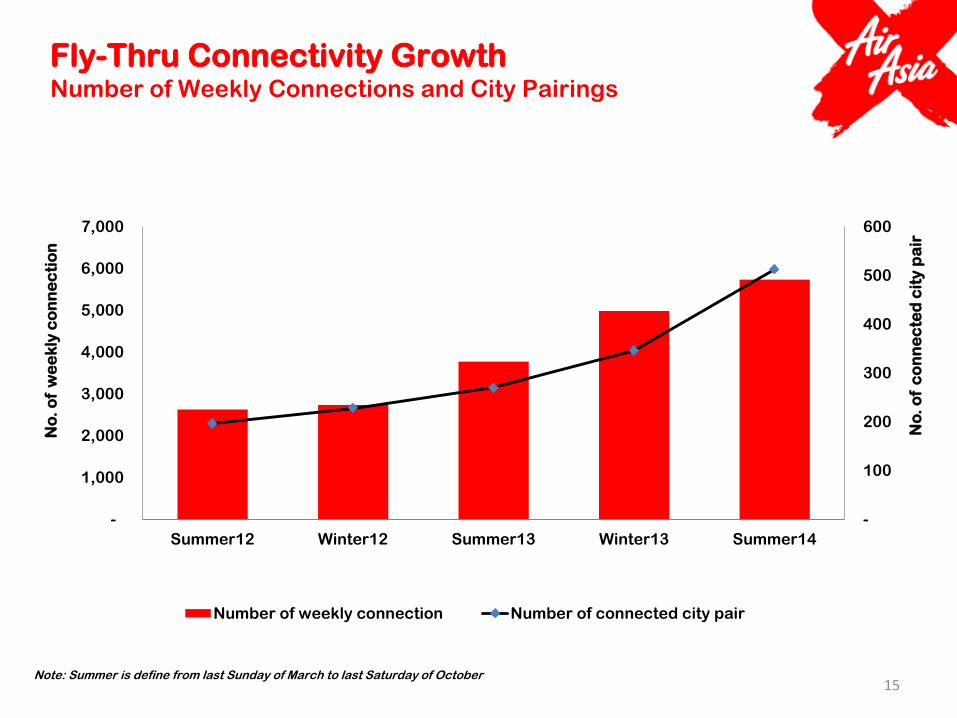
Fly-Thru Connectivity Growth Number of Weekly Connections and City Pairings
-
100
200
300
400
500
600
-
1,000
2,000
3,000
4,000
5,000
6,000
7,000
Summer12 Winter12 Summer13 Winter13 Summer14
No
. o
f c
on
ne
cte
d c
ity
pa
ir
No
. o
f w
ee
kly
co
nn
ec
tio
n
Number of weekly connection Number of connected city pair
Note: Summer is define from last Sunday of March to last Saturday of October

5%
9%
16%
Jan'13 - Jun'13 Jul'13 - Dec'13 Jan'14 - Mar'14
16
Fly-Thru Indirect Market Share of Traffic Strengthening in Core Routes North Asia – Australia
Source: IATA PaxIs Mar’14
Double Daily
Flights to TPE in
July
Double Daily
Flights to AUS in
December
17
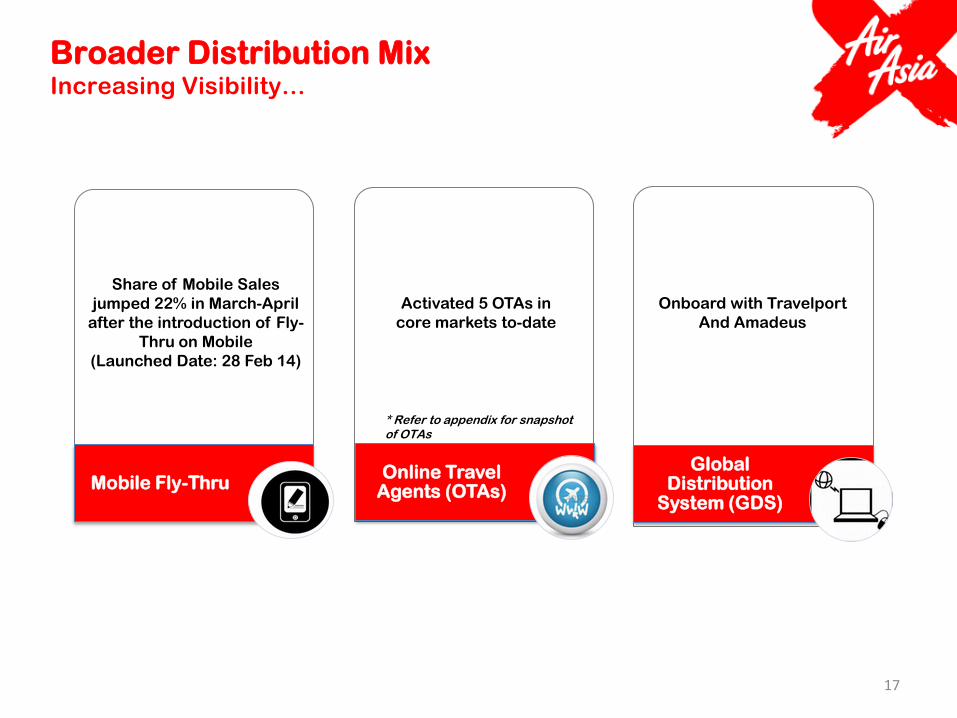
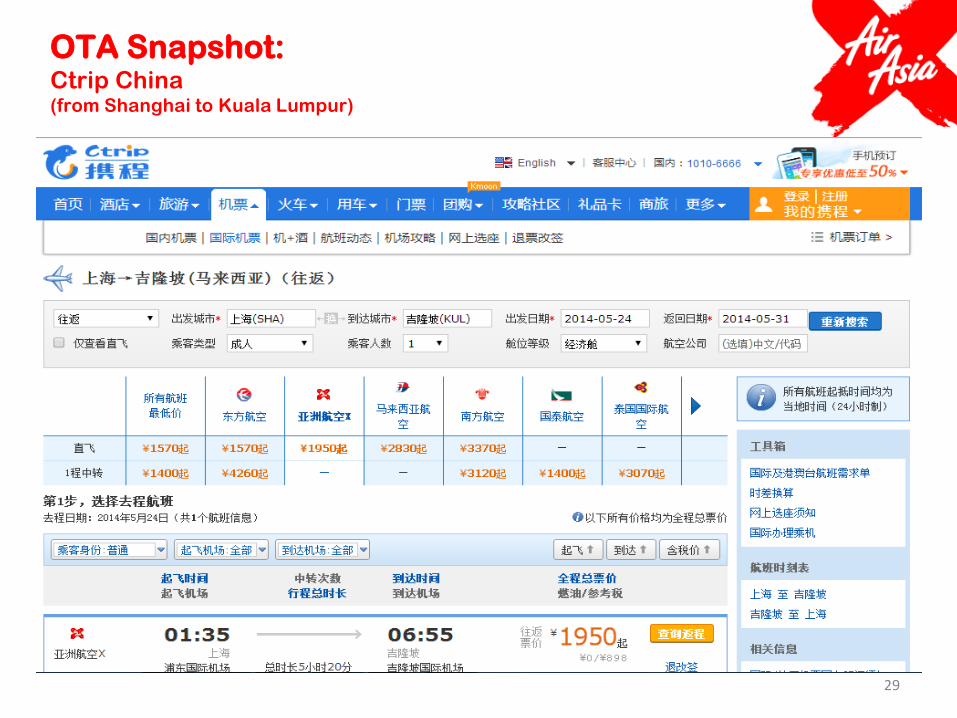
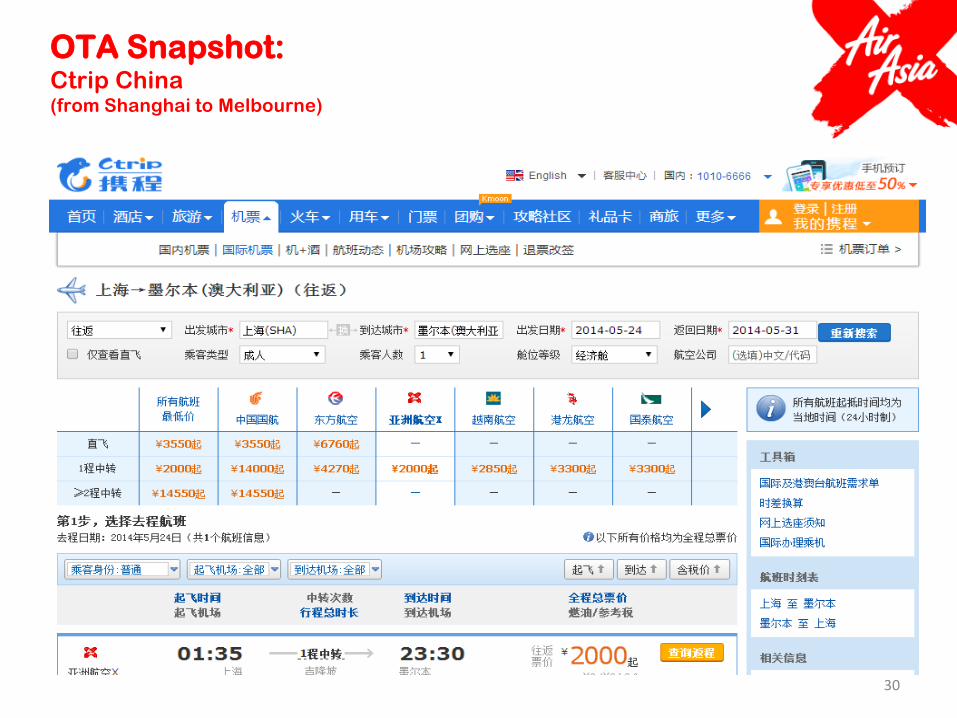
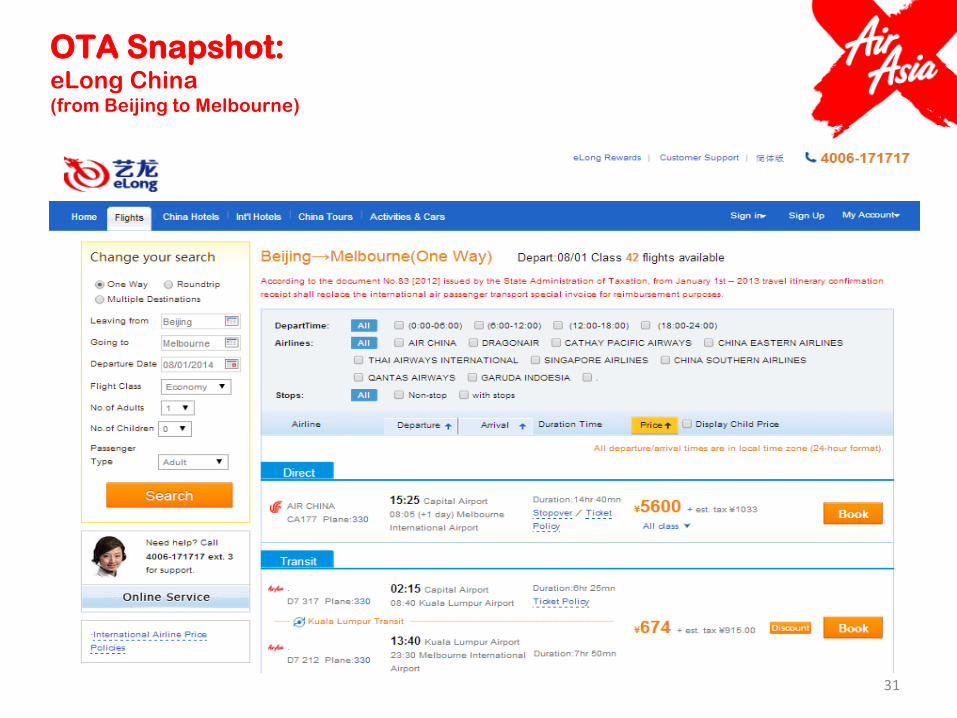
Broader Distribution Mix Increasing Visibility…
Mobile Fly-Thru Online Travel
Agents (OTAs)
Global Distribution
System (GDS)
Share of Mobile Sales
jumped 22% in March-April
after the introduction of Fly-
Thru on Mobile
(Launched Date: 28 Feb 14)
Activated 5 OTAs in
core markets to-date
Onboard with Travelport
And Amadeus
* Refer to appendix for snapshot of OTAs
18
KLIA2 Moved to a new home…
Enhancement to Passengers’ Experience = Revenue Upside
ERL Connectivity
Use of Aerobridge
Larger space for Fly-Thru and Transit
Better Facility such as Lounge and Airside Hotel
19
First Quarter 2014
Key Operating & Financial Highlights
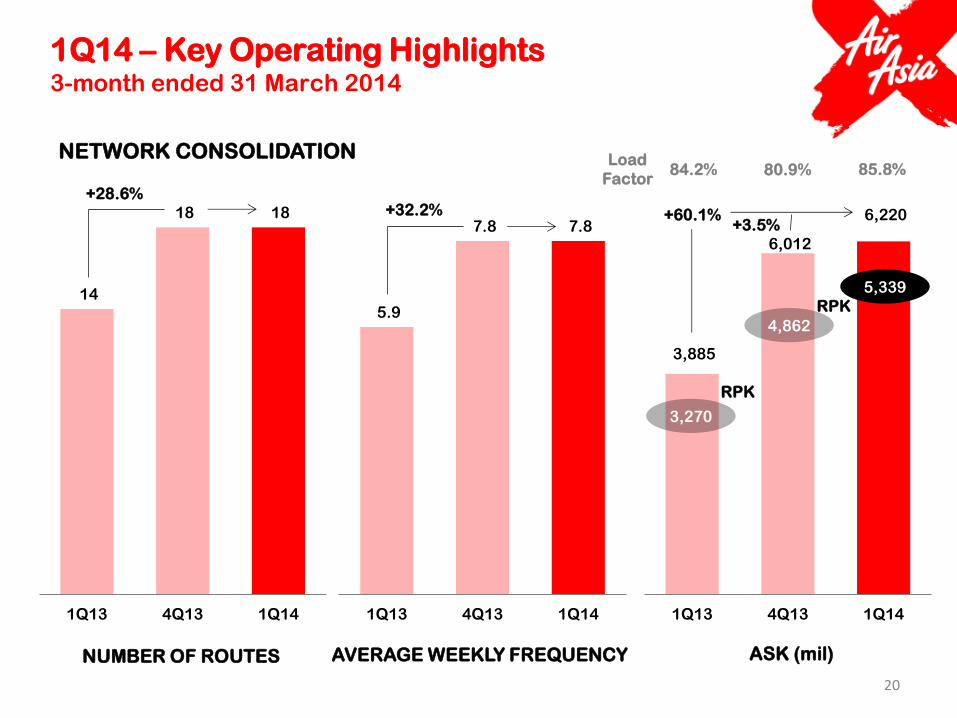
ASK (mil)
NETWORK CONSOLIDATION
AVERAGE WEEKLY FREQUENCY NUMBER OF ROUTES
14
18 18
1Q13 4Q13 1Q14
5.9
7.8 7.8
1Q13 4Q13 1Q14
3,885
6,012
6,220
1Q13 4Q13 1Q14
84.2% 85.8%
RPK
Load
Factor
20
1Q14 – Key Operating Highlights 3-month ended 31 March 2014
5,339
3,270
+28.6% +32.2% +60.1%
+3.5%
80.9%
4,862
RPK
403
478
504
16
38
63
96
137
148
20
26
25
8
1Q13 4Q13 1Q14
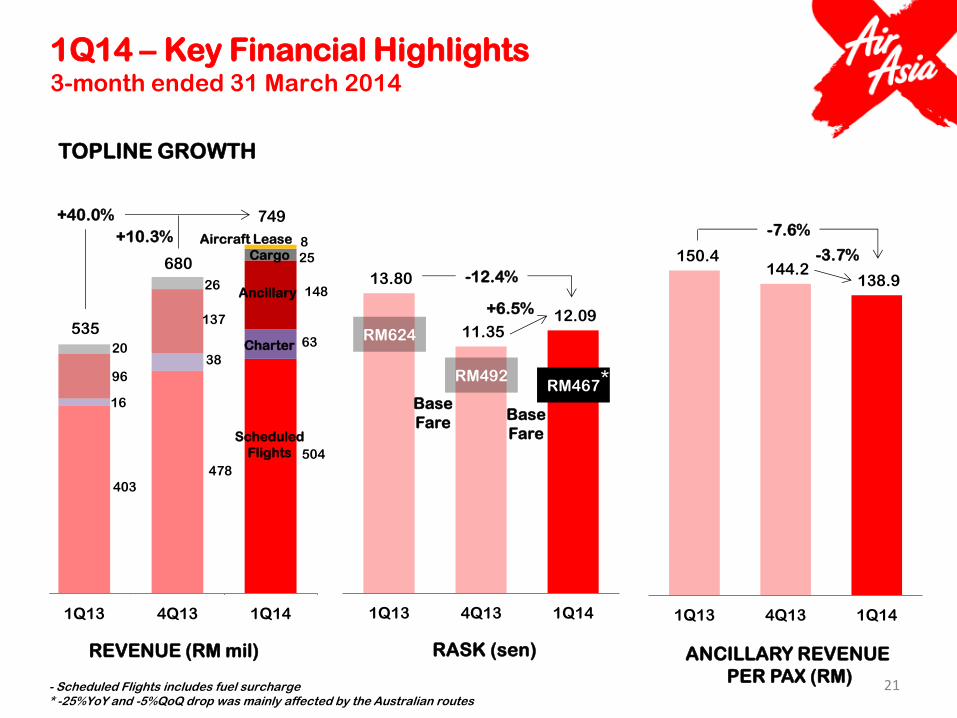
REVENUE (RM mil)
13.80
11.35 12.09
1Q13 4Q13 1Q14
RASK (sen)
150.4 144.2
138.9
1Q13 4Q13 1Q14
ANCILLARY REVENUE
PER PAX (RM)
TOPLINE GROWTH
535
749
Scheduled
Flights
Charter
Ancillary
Cargo
21
1Q14 – Key Financial Highlights 3-month ended 31 March 2014
Aircraft Lease
- Scheduled Flights includes fuel surcharge * -25%YoY and -5%QoQ drop was mainly affected by the Australian routes
-12.4%
+6.5%
-7.6%
-3.7% 680
+40.0%
+10.3%
RM624
RM467 RM492
Base
Fare Base
Fare
*
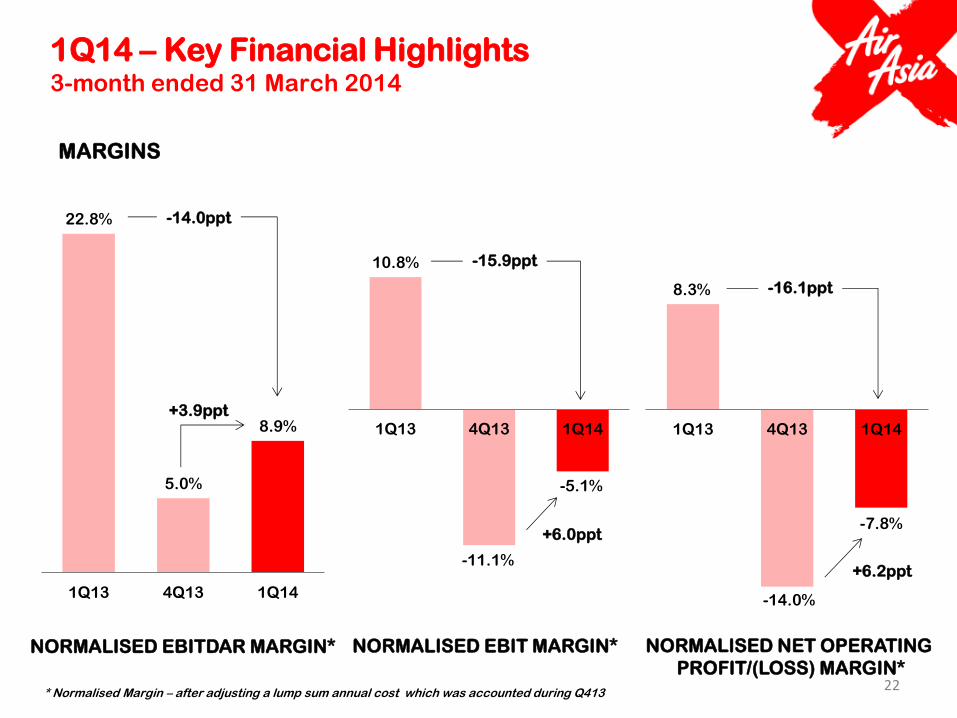
22.8%
5.0%
8.9%
1Q13 4Q13 1Q14
10.8%
-5.1%
1Q13 4Q13 1Q14
-11.1%
8.3%
-7.8%
1Q13 4Q13 1Q14
NORMALISED EBITDAR MARGIN* NORMALISED EBIT MARGIN* NORMALISED NET OPERATING
PROFIT/(LOSS) MARGIN*
MARGINS
22
1Q14 – Key Financial Highlights 3-month ended 31 March 2014
-14.0ppt
+3.9ppt
-15.9ppt
+6.0ppt
-16.1ppt
+6.2ppt
-14.0%
* Normalised Margin – after adjusting a lump sum annual cost which was accounted during Q413

234 260
41
278
322
80
289
358
102
Australia North Asia Others
REVENUE (RM mil)
22.7% 20.3%
39.5%
4.3%
12.9%
2.5% -1.5%
18.0%
6.2%
Australia North Asia Others
EBITDAR MARGIN
1,702 1,975
208
2,804 2,792
416
2,995 2,872
353
Australia North Asia Others
ASK (mil)
13.79 13.19
19.80
9.96 11.59
19.21
9.70 12.51
28.95
Australia North Asia Others
+46.2% YoY
+50.7% QoQ
RASK (sen)
+23.6% YoY
+3.9% QoQ
+37.7% YoY
+11.3% QoQ
+>100% YoY
+28.3% QoQ
-24.2ppt YoY
-5.8ppt QoQ
-2.3ppt YoY
+5.1ppt QoQ
-33.3ppt YoY
+3.7ppt QoQ
+76.0% YoY
+6.8% QoQ
+45.4% YoY
+2.9% QoQ
+69.7% YoY
-15.0% QoQ
-29.7% YoY
-2.6% QoQ
-5.2% YoY
+7.9% QoQ
23
1Q14 – Segment Profitability 3-month ended 31 March 2014
1Q13 1Q14 4Q13

24
1Q14 – Operating Expenditure 3-month ended 31 March 2014
12.37
1Q14 1Q13
12.62
Aircraft
Related Cost
Aircraft
Fuel
Staff Advertising
& Promotions
Others
+0.61
+0.10 (0.02)
(0.21)
(0.23)
CASK (RMsen) +2% YoY CASK ex-fuel (RMsen) -6% YoY
CASK (UScent) -5% YoY CASK ex-fuel (UScent) -12% YoY
Aircraft Related Cost: Aircraft Depreciation & Lease, and Maintenance & Overhaul. Others: Operations, and General & Administrative.
+10%
-2% +4% -26%
-12% -3%
+3%
4.01 3.83
+0.06
(0.03)
(0.03)
(0.08)
(0.11)
RMsen
UScent
RMsen
UScent
-8%
-31%
-18%
CASK YoY Growth
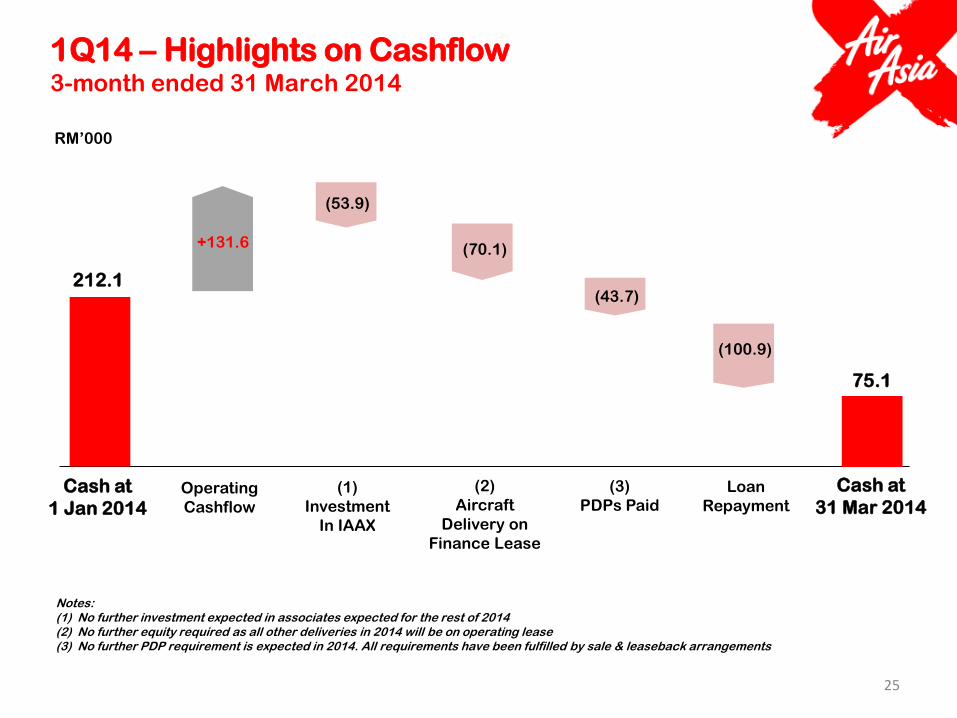
25
1Q14 – Highlights on Cashflow 3-month ended 31 March 2014
RM’000
Cash at
1 Jan 2014
(2)
Aircraft
Delivery on
Finance Lease
212.1
Cash at
31 Mar 2014
75.1
(1)
Investment
In IAAX
Operating
Cashflow
(3)
PDPs Paid
(53.9)
+131.6 (70.1)
(43.7)
Notes: (1) No further investment expected in associates expected for the rest of 2014 (2) No further equity required as all other deliveries in 2014 will be on operating lease (3) No further PDP requirement is expected in 2014. All requirements have been fulfilled by sale & leaseback arrangements
Loan
Repayment
(100.9)

Outlook
26
27
• Capacity growth will slow down to 48%, 38%, 25% for remaining quarters
• Annual ASK growth expected at 41%, and less than 20% from 2015 onwards
• Tactical capacity reduction and more charters/leases
• Initiatives to keep RASK positive growth for full year 2014 underway
- Network, Revenue Management, Distribution, KLIA2
• Charters/Lease contracts being firmed up
Further improvements underway from controllable costs as scale grows
Barring macro-factors of fuel and currency, improvements in RASK and
Controllable CASK should deliver improved margins
• No further investments expected for Associates for remainder of 2014
• All additional 2014 deliveries on Operating Leases
• Major PDPs for 2015-2016 deliveries also via Operating Leases
• Goal is to have Net Cash Flow by limiting Capex to less than Operating Cash
Executive Summary 2014 Outlook
Capacity
RASK
CASK
Margins
Cash

Appendix
28
29
OTA Snapshot: Ctrip China (from Shanghai to Kuala Lumpur)
30
OTA Snapshot: Ctrip China (from Shanghai to Melbourne)
31
OTA Snapshot: eLong China (from Beijing to Melbourne)
Thank You
32