Embed Size (px)
Citation preview

Operational Alternatives for Total Dissolved Gas Management at Grand Coulee Dam
Grand Coulee Dam with mid- and lower-level outlet works operating above and below each other.
November 1998
by Kathleen H. Frizell U.S. Bureau of Reclamation Water Resources Research Laboratory Denver CO
PAP-794 Filename: CAKathy's fi1es\98super\opergc1.wpd WATER RESOURCES
with subdocument opergc2.wpd RESEARCH LABORATORY
OFFICIAL FILE COPY

Table of Contents
Executive Summary ................................................ i
Introduction ......................................................1
Grand Coulee Dam ................................................I
Background......................................................4 Problem Description ......................................... 4 Project Operations ............ . .............. • ... • • .. • . • . • ... 4 Fixed TDG Monitor Locations . 5
Recommendations ...................... .6 Immediately Implemented Operations ............................ 7 Operational Alternatives Deferred to the System-Wide Study ......... 8 Further Investigations ........................................ 8
a Previous Investigations .....................................................9
Investigations ....................................... 9 1997 Outlet Works Test Summary ....................... 10
a
Turbine Operational Options .................................. Analysis of TDG Data for 1996, 1997, and 1998
12 12
Description of Flow Mixing ............................. 19 Travel Time to the Downstream Fixed Monitor .............
Outlet Works Operation . 20 22
Recommended Outlet Works Operation Mode .............. 26
Spillway Operation .. • - • • • .. • ................................ Error Analysis . 27 28
Comparison of Empirical Results to Predictive TDG Theory ......... 31 Temperature Influence on TDG Percent ......................... 31
Comparison of Spill Methods and the Spill Caps ........................
Summary.......................................................37
36
References ......................................................37
D I

A
I
0
12H
Executive Summary
A brief summary is presented of the report "Operational Alternatives for Total Dissolved Gas Management at Grand Coulee Dam." The report discusses the analysis of operations and total dissolved gas (TDG) data for Grand Coulee Dam releases based upon the fixed monitoring location 6 miles downstream from the dam.
Only current operations within the guidelines of the Technical Management Team TDG Management Plan that pertain specifically to Grand Coulee Dam are summarized. Issues that require addressing in the system-wide forums are discussed briefly in the report. All modes of operation, including releases from the powerplants, spillway and two tiers of outlets were analyzed for their potential for TDG production. The TDG analysis was based upon fully mixed flow conditions between the power releases and spill. The analysis was based upon current operations that follow the existing flood control requirements. The flood control requirements produce spill at specific times of the year. New recommended spill cap values for Grand Coulee Dam releases are presented for specific TDG targets in the system. The recommended spill caps for Grand Coulee Dam releases are:
TDG (percent)
110 120 125 130 135
Spillway releases 20 30 75 120 170 (kft3/s)
Outlet works releases 0 10 20 35 55 (kft3/s)
Discharges are based upon spillway releases from all 11 drum gates and outlet works releases using the upper- and mid-level outlets in combined over/under operation.
The spill caps are referenced to the GCGW monitoring station 6 miles downstream from the dam where the TDG readings represent fully mixed flow. Under most operating conditions the powerplant provides the majority of the flow. When spill occurs under the current operating capability, all but small flows from the spillway will increase the TDG measured at the downstream monitor. The small flows from the spillway will degas or strip gas from the level present in the reservoir. This, however, will not necessarily bring Reclamation into compliance with the 110 percent standard. It will mean that we are not adding to the problem, but the fully mixed condition downstream is still dependant upon the TDG level in the reservoir which is being passed by the powerplant discharge.
J
J

The reservoir mildly stratifies seasonally, but is fully mixed with respect to temperature and nitrogen concentration, top to bottom, in the late fall and winter months. As early summer approaches, the lake begins stratifying with respect to both components. This is due to the large run-off entering the lake which generally carries high concentrations of nitrogen. The bottom of the lake tends to have higher concentrations of TDG during the summer months than the surface waters. Therefore, when power releases are made from deep in the lake, the TDG levels recorded by the monitor downstream often exceed the water quality standard without spill of any kind.
If small spillway releases are made during this time, degassing will occur; however, the ratio of spill volumes will not generally produce compliance with standards. On the other hand, if small spillway releases are made in the fall or winter, when they would be mixing with power releases that are at or below the 110 percent standard, then we would be in compliance with the 110 percent standard while spilling and not increasing TDG. Generally, spills are not required or the reservoir level is not high enough during this time of the year under the current flood control rule curve restrictions.
Suggested operational alternatives to manage TDG with releases from Grand Coulee Dam are:
► Turbines will be used for power generation up to the limit of turbine availability and the power demand.
► Powerplant turbines will be operated at speed-no-load when power loads are not available.
► Turbine units will be operated in inefficient zones as appropriate to balance power demand and total release requirements.
► Use the spillway for spills instead of the outlet works when the reservoir is above the level of the spillway crest. The spillway drum gates will be used as the primary structure for spills that are not through the turbines, within their operating limits.
► Operate the outlet works in a combined over/under spill pattern whenever possible to minimize gas production during involuntary spills when the lake elevation is below the level of the spillway crest.
For voluntary ESA-related situations that could potentially result in exceedance of the 110 percent state TDG standard, either because of gas introduced as a result of Grand Coulee operations, or because of ambient gas levels measured in the forebay, Reclamation's policy is to seek, through a request from National Marine Fisheries Service (NMFS), a temporary standards waiver.
31
0 I
I :1

J The report explains the analyses used to determine these operational suggestions and comparisons to existing predictive theories for TDG production. In addition, the report includes suggestions for further investigations to improve knowledge of
~J TDG and temperature profiles in the reservoir forebay.
k
E
i~
ui
_l
ffF

Introduction
Dissolved gas supersaturation has been a major issue in implementation of the NMFS Biological Opinion for Endangered Species Act (ESA) listed Snake River salmon stocks. Reclamation is aware of the concerns of regional fish managers and water quality management agencies regarding potential for damage to aquatic resources downstream of the project, and have been working within the National Marine Fisheries Service (NMFS) regional forum to achieve long-term resolution of the problem. A number of teams have been established within the NMFS regional forum, including the Technical Management Team (TMT), the Dissolved Gas Team (DGT), the Implementation Team (IT), the System Configuration Team (SCT), and the Executive Committee (EC). These teams have been actively involved in defining and managing dissolved gas problems associated with operation of the Columbia and Lower Snake system. The Mid- and Upper-Columbia River segments, that include Grand Coulee Dam and the Canadian Dams, are included in the system-wide team approach. The Transboundary Gas Group (TGG) has recently been formed to help formulate ways to manage total dissolved gas (TDG) into and out of Canada along the Pend O'reille River and the Spokane and Columbia Rivers. Reclamation continues to be an active member of the appropriate teams.
As a participant in the regional forum, Reclamation is working on a Gas Management Program for Grand Coulee Dam. Several studies have already been completed, and others are continuing. This report will discuss the results from investigation of various methods of release from the dam. It includes results from the 1997 outlet works tests, and operational and TDG data from 1996, 1997, and 1998. These analyses are proposed to be used for operational guidelines for
] Grand Coulee Dam releases that can be used to manage TDG levels below Grand Coulee Dam. Recommendations are separated into categories based upon whether they can be locally implemented by Reclamation; must be determined
a with system-wide input; and items for further investigation.
Grand Coulee Dam
Grand Coulee Dam (figure 1) is located at the upper end of the Columbia River about 90 miles west of Spokane, Washington. The dam was constructed from 1933 to 1942 with the forebay dam and additional powerhouse completed in 1974. All Third Powerplant generating units were operational in 1979. The dam forms Franklin Delano Roosevelt (FDR) Lake which stretches approximately 150 miles to the Canadian border. The dam has a hydraulic height of 350 ft. The hydraulic structures are a 1,650-ft-wide gated spillway, an outlet works comprised of 40 active conduits through the dam in two tiers of 20 each, original left and right powerplants on either side of the spillway, and the Third Powerplant located almost parallel to the right dam abutment (figures 1 and 2). The bottom tier of outlets is no longer in service.
IOperational Alternatives for Total Dissolved Gas Management at Grand Coulee Dam 1

Figure 1. - Overall view of Grand Coulee Dam and Third Powerplant. Filename: c:\kathy 's files\98super\gchk~ I hmp
The spillway is located in the center of the dam with eleven 28- by 135-ft drum gates, atop a crest at E1. 1260, controlling releases up to a maximum water surface of El. 1290. The spillway capacity is 1,000,000 ft3/s. The spillway has a submerged roller bucket energy dissipater at El. 874.4 and discharges onto the rock surface downstream.
E 1. 1311.08
Mat w.S E1. 1290.00 If, Et. 1288.00
_ —=_ 1 135's 28 Drum gate Crest El. 1260A0~
.,a 10Z Ring seoi gates
E1. f 136.67
E 1 1088.30
E1.1036.67 o2" Diaoutlet Conduits
U376 1
Discontinued I. E1.978.01
Et 935L 76 02 Dia outlet conduit
12.06 -1 E 1. 90o.00
o'
E 1.869.88 s
Et874.41 Ac s—
SPILLWAY SECTION
Figure 2. - Section of the Grand Coulee spillway showing the locations of the spillway crest and drum gates, the three tiers of outlet works, and the roller bucket energy dissipater.
Operational Alternatives For Iotal Dissolved Gas Management at Grand Coulee Dam 2

The 8.5-ft-diameter outlet works conduits discharge onto the downstream face of the spillway, also utilizing the roller bucket dissipater. Under normal reservoir operations, each outlet tube is capable of discharging from approximately 3,000 to 5,000 ft'/s, depending upon the outlet elevation and the lake level. The centerline of the mid-level outlets is located at El. 1036.67, with the centerline elevation of the upper outlets 100 ft higher. The total capacity of the outlet works at reservoir El. 1290 is 191,920 ft3/s. The outlet works are generally used to lower the lake level in the spring when high runoff is expected and the lake level is below the spillway crest (El. 1260).
The powerplants have a total capacity of 280,000 ft3/s and discharge from the reservoir to the tailrace under submerged conditions. The centerline elevation for intakes of the original left and right powerplants is at El. 1041. The left and right powerplants each contain nine 125,000 kilowatt units which in terms of discharge pass a total of about 100,000 ft'/s. The left powerplant also houses three small station service units of 10,000 kilowatts each, for a total generating capacity of 2,250,000 kilowatts for the left and right powerplants. The Third Powerplant intake has a centerline elevation of 1130. The Third Powerplant has 6 units, three with a capacity of 700,000 kilowatts each, and three which are rated at 805,000 kilowatts each, for a total of 4,515,000 kilowatts. The Third Powerplant is capable of passing 180,000 ft3/s when generating power. When not generating power, the left and right powerplant turbine units can pass 500 ft3/s each and the Third Powerplant turbines 3,000 ft3/s, for a total speed-no-load capacity of 27,000 ft3/s. The tailwater depth varies for a normal powerplant discharge range from about 80 to 100 ft referenced to the invert of the roller bucket.
The Grand Coulee Pump-Generating Plant consists of 6 pumping units and 6 pump generators, which lift water to irrigation facilities to the south of the river. The pump generators may also be used to generate power during peak power demand periods, at a capacity of 50,000 kilowatts each. The pump-generating plant intake is located at centerline El. 1193.27. The extensive irrigation works of the project extend southward on the Columbia Plateau, 125 miles to the vicinity of Pasco, Washington, where the Snake and Columbia Rivers join.
The geometry of the hydraulic structures at Grand Coulee has a major influence on the gas transfer characteristics at the dam and makes addressing the TDG issue more complicated than at many of the lower dams on the Columbia and Snake River systems.
J
J
Operational Alternatives for Total Dissolved Gas Management at Grand Coulee Dam 3
Background
Problem Description
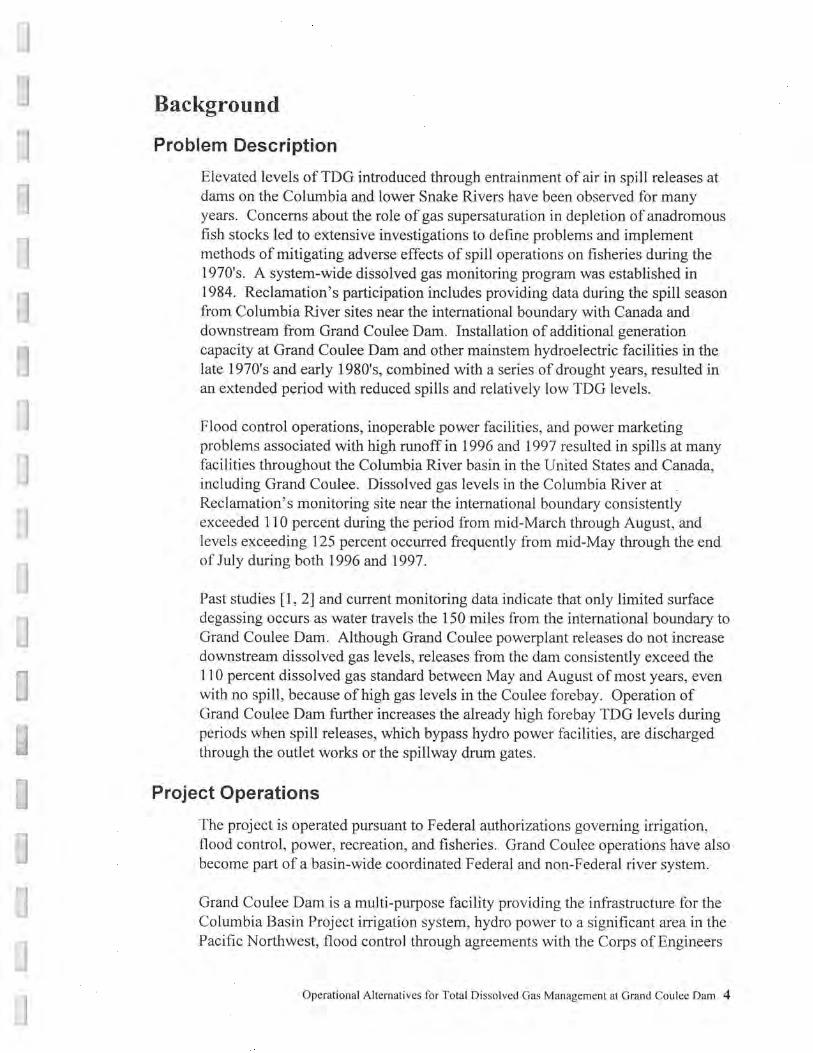
Elevated levels of TDG introduced through entrainment of air in spill releases at dams on the Columbia and lower Snake Rivers have been observed for many years. Concerns about the role of gas supersaturation in depletion of anadromous fish stocks led to extensive investigations to define problems and implement methods of mitigating adverse effects of spill operations on fisheries during the 1970's. A system-wide dissolved gas monitoring program was established in 1984. Reclamation's participation includes providing data during the spill season from Columbia River sites near the international boundary with Canada and downstream from Grand Coulee Dam. Installation of additional generation capacity at Grand Coulee Dam and other mainstem hydroelectric facilities in the late 1970's and early 1980's, combined with a series of drought years, resulted in an extended period with reduced spills and relatively low TDG levels.
Flood control operations, inoperable power facilities, and power marketing problems associated with high runoff in 1996 and 1997 resulted in spills at many facilities throughout the Columbia River basin in the United States and Canada, including Grand Coulee. Dissolved gas levels in the Columbia River at . Reclamation's monitoring site near the international boundary consistently exceeded 110 percent during the period from mid-March through August, and levels exceeding 125 percent occurred frequently from mid-May through the end of July during both 1996 and 1997.
Past studies [1, 2] and current monitoring data indicate that only limited surface degassing occurs as water travels the 150 miles from the international boundary to Grand Coulee Dam. Although Grand Coulee powerplant releases do not increase downstream dissolved gas levels, releases from the dam consistently exceed the 110 percent dissolved gas standard between May and August of most years, even with no spill, because of high gas levels in the Coulee forebay. Operation of Grand Coulee Dam further increases the already high forebay TDG levels during periods when spill releases, which bypass hydro power facilities, are discharged
Project Operations
The project is operated pursuant to Federal authorizations governing irrigation, flood control, power, recreation, and fisheries. Grand Coulee operations have also become part of a basin-wide coordinated Federal and non-Federal river system.
Grand Coulee Dam is a multi-purpose facility providing the infrastructure for the Columbia Basin Project irrigation system, hydro power to a significant area in the Pacific Northwest, flood control through agreements with the Corps of Engineers
through the outlet works or the spillway drum gates.
IOperational Alternatives for Total Dissolved Gas Management at Grand Coulee Dam 4

(COE), and fisheries management through flow augmentation during important periods of migration.
Irrigation works are designed to deliver a full water supply to about 1 million acres of land, about half of which is currently served.
Flood control operating criteria (flood rule curves) define individual year flood control storage requirements and prescribe annual drawdown schedules. Maximum drawdown of the reservoir generally is targeted to occur by May 1, although drawdown timing varies somewhat depending on the water supply forecast. Grand Coulee provides the major portion of the total flood storage in the United States on the Columbia River.
Grand Coulee Dam and FDR Lake are key components of the Federal Columbia River Power System (FCRPS), which is coordinated for power production in the Pacific Northwest. At the Grand Coulee switchyards, power is delivered to the Bonneville Power Administration (BPA), which is the marketing agency for Federally-produced power in the Pacific Northwest.
Non-power operational requirements related to implementation of the NMFS Biological Opinion for ESA listed Snake River salmon stocks, such as the spill priorities for system-wide management of dissolved gas levels, are coordinated through the NMFS TMT on a weekly basis. FCRPS coordination between Reclamation, COE, and BPA is also ongoing.
The TMT develops a water management plan by April 15 of each year, based on the run-off forecast for that year, which is designed to assure that water is available to meet flow objectives and provide for improved survival of listed Snake River salmon and other anadromous fish species. Part of this plan is to specify.a spill priority with specified spill caps (volumes) for each dam on the, river system to meet target TDG levels.
For fisheries purposes, Reclamation operates Grand Coulee during the fall and winter months to provide an 85 percent level of confidence of refill in order to assure availability of water for summer flow augmentation. FDR Lake is drafted up to 10 ft (elevation 1290 to 1280) during the months of July and August to meet biological opinion flow objectives in the lower portions of the river.
Fixed TDG Monitor Locations
Reclamation has funded the installation, operation, and maintenance of TDG meters by Common Sensing, Inc., at the fixed locations at the upstream end of Lake Roosevelt at the Canadian/U.S. boundary and in the river 6 miles downstream from the dam since the 1983 and 1984 seasons. These locations are referred to as CIBW and GCGW, respectively. As a result of recent interest, Reclamation installed a third Common Sensing, Inc., TDG monitor in the lake
Operational Alternatives for Total Dissolved Gas Management at Grand Coulee Dam 5
forebay off the face of the dam in May of 1997. The forebay monitor was initially installed 15 ft below the level of the lake. It was changed during the 1998 season to be located at El. 1193, 15 ft below the minimum operating pool and 97 ft below the maximum reservoir water surface. The new forebay monitor is referred to as FDRW. Data from all these monitors are obtainable from the Hydromet system on 15-minute intervals or from the web site maintained by the COE on hourly intervals.
Recommendations
Operational measures which could be used to manage TDG produced by spills have been evaluated. The following operations procedures are recommended to minimize, to the extent practicable, the local and system-wide impacts of TDG supersaturation on fishery resources of the Columbia and lower Snake Rivers. The following recommendations are based upon the analyses presented in this report. These analyses include use of existing TDG data from the fixed monitor below the dam, the new forebay monitor data, the outlet works field tests performed in 1997, and comparisons to analytical predictions of the structure gas production behavior.
The recommendations are categorized by whether or not they may be enacted by Reclamation actions alone, or need to be addressed by the system-wide teams. In addition, further investigations to assist with operational refinements are suggested. The recommendations are divided into categories because some issues are easier to address and may be locally determined and others require input from the system-wide TDG decision-making forums.
All projects are operated according to the TMT recommendations and guidance, including spill priorities and spill caps established in each year's TDG Management Plan. Reclamation conducts involuntary spill operations at Grand Coulee Dam in accordance with the system recommendations. The 1998 Plan required spill at Grand Coulee up to the discharges given in the following table while attempting to manage the river system at various levels of TDG.
Existing 1998 Spill Cap for Percent TDG Management
110 120 125 130 135
Spill (kft3/s) 5 10 20 30 45
One of the tasks of this operations analysis is to determine if the spill caps are appropriate for Grand Coulee. It is recommended that the spill cap values for the spillway and outlet works be separated as their TDG producing characteristics
Operational Alternatives for Total Dissolved Gas Management at Grand Coulee Dam 6

vary considerably. The following table shows the proposed modifications to the spill caps at Grand Coulee Dam:
Recommended Spill Cap for Percent TDG Management
110 120 125 130 13.5
Spillway releases 20 30 75 120 170 (kft3/s)
Outlet works releases 0 10 20 35 55 (kft3/s)
Discharges are based upon spillway releases from all 11 drum gates and outlet works releases using the upper- and mid-level outlets in combined over/under operation. These spill caps assume that the TDG is recorded at the downstream river monitor and the flow is fully mixed.
Immediately Implemented Operations:
► Turbines will be used for power generation up to the limit of turbine availability and the power demand.
► Powerplant turbines will be operated at speed-no-load when power loads are not available.
► Turbine units will be operated in inefficient zones as appropriate to balance power demand and total release requirements.
► Use the spillway for spills instead of the outlet works when the reservoir is above the level of the spillway crest. The spillway drum gates will be used as the primary structure for spills that are not through the turbines, within their operating limits.
► Operate the outlet works in a combined over/under spill pattern whenever possible to minimize gas production during involuntary spills when the lake elevation is below the level of the spillway crest.
For voluntary ESA-related situations that could potentially result in exceedance of the 110 percent state TDG standard, either because of gas introduced as a result of Grand Coulee operations, or because of ambient gas levels measured in the forebay, Reclamation's policy is to seek, through a request from NMFS, a temporary standards waiver.
11 Operational Alternatives for Total Dissolved Gas Management at Grand Coulee Dam 7

Operational Alternatives Deferred to the System-Wide Study:
Grand Coulee has hydro power capabilities to pass the 7-day 10-year flow event while generating power. The 7-day 10-year flow event is the maximum flow that occurs for 7 consecutive days once every 10 years. This flow event is currently being used for evaluation of structural modifications. Transfer of additional power demand to Grand Coulee to prevent spill would be beneficial to the immediate
~] downstream river reach. However, this operation does not agree with the ongoing ~j system-wide dissolved gas management activities of the TMT, but might fit with
future plans.
Operate FDR Lake at higher elevations to facilitate spillway drum gate use. Limiting winter drawdown of FDR Lake would allow more frequent usage of the. spillway, which is preferred for spills over use of the outlet works. However, this conflicts with current flood control requirements. Implementation of this type of operation would require changes in system flood control targets at The Dalles and rule curves for operation of FDR Lake. The immediate benefits downstream from Grand Coulee may be offset by disadvantages of potentially higher spills and fisheries concerns elsewhere in the system. The system-wide impacts need to be addressed by a larger forum.
Increase the usage of the Banks Lake pump-generating facilities to decrease spills
o below the dam. The total pumping capacity is about 10-12,000 ft3/s to the irrigation works. Further study of power demand and of project operational constraints are needed before this could be implemented.
Other issues such as joint Chief Joseph/Grand Coulee gas abatement studies and assisting with Canadian power marketing are currently under discussion with the Transboundary Gas and the System-wide Dissolved Gas work groups.
Further Investigations:
The third category for operational consideration is the possibility of obtaining additional information that could produce further refinements in operations or better knowledge for further decision-making.
' Historical data indicate that the lake is weakly thermally stratified in the summer months with a higher surface temperature than at depth. The lake also exhibits minimal stratification of nitrogen concentrations with less nitrogen at the surface in the summer months [1, 2].
It is recommended to perform additional test releases through separate powerplants, while still meeting BPA power requirements, to determine the extent that the lake is vertically stratified with respect to TDG at the two different powerplant intake levels. Data can be obtained by project or regional personnel or
Operational Alternatives for Total Dissolved Gas Management at Grand Coulee Dam 8

J
just with the downstream fixed monitor. For example, each unit in the left powerplant can provide about 100 MW. When the power demand would not
~ exceed the amount that can be provided by the left powerplant, then the units in the other powerplants could be taken off line, all power generated by the left
[] powerplant, and the TDG measured downstream. This should be repeated for the ~j right and the Third Powerplants when stratification would be expected.
An annual thermal distribution in the lake forebay will be developed with a string of thermistors located throughout reservoir depth. The monitoring began in late August 1998.
Develop an operator's spill database using an available database manager on a PC. This will assist with future requests for specific spill information, modernize record-keeping at the dam, and assist with electronic transmission of data.
Investigations The following sections will review previous investigations, and discuss the analysis
[ of the existing TDG, spill, total spill, and temperature data for Grand Coulee Dam. In addition, these empirical data will be compared to a current theory available to predict TDG production. The discussion is separated into sections on recent previous investigations, data and error analysis for both the outlet works and spillway, and explanation of reservoir temperature data.
Previous Investigations
To manage TDG levels below Grand Coulee Dam and to assist with setting spill caps throughout the region, Reclamation has implemented the Dissolved Gas Management Plan. An analysis was completed in March 1996 entitled, "Dissolved Gas Supersaturation Studies for Grand Coulee. Dam," to predict expected TDG levels below the dam for various releases [3]. These predictions were based upon the ability of the hydraulic structures to transfer dissolved gas from computations with existing field data. In summary, these analyses showed that all releases from the dam through the outlet works and/or the spillway will increase TDG levels with the exception of very small spillway releases over the entire spillway. However, the accuracy of the predicted percentage increase in TDG levels from the report is possibly not very reliable because of the quantity of relevant TDG data under varying and often unknown operating conditions.
Because of the uncertainties in the TDG data used in the predictive analysis, a test release plan was developed to measure TDG below Grand Coulee Dana for specific releases in 1997. This phase of Reclamation's investigations was documented in "Grand Coulee Dam Total Dissolved Gas Studies, Release Test Plan, February 1997" [4]. This document outlines the concerns being addressed and the reasoning
0 Operational Alternatives for Total Dissolved Gas Management at Grand Coulee Dam 9

0
I
behind the selection of the tests to be performed. In summary, the tests were chosen to obtain the needed data while minimizing impact on the downstream fish population.
Upon approval of the test plan and prior to performing the actual tests, an investigative trip was undertaken. The purpose of the investigative study was to locate a good river section for TDG sampling that would minimize release durations during the actual test period, ensure quality data acquisition, and determine adequacy of the fixed monitoring station. For this study, a small outlet works flow was added to the normal powerplant release. Velocity and TDG data were collected at various locations downstream from the dam. The results from the investigative study are presented in TR-97-16 and the attached report '`Grand Coulee Total Dissolved Gas Study, Investigative Trip, March 6, 1997 " [5]. Results from the investigative study allowed the spill duration to be greatly reduced for the actual tests and provided insight regarding travel time and characteristics of the gas plume. In addition, the Acoustic Doppler Current Profiler (ADCP) and hand-held TDG meters were also used at the GCGW fixed monitoring site to investigate the representativeness of the fixed monitor location. This investigation showed both the selected test section, 2.3 miles below the dam, and the fixed monitor location displayed uniform flow velocities and well mixed TDG characteristics.
1997 Outlet Works Test Summary
Outlet works tests were performed in March 1997. The initial progress report entitled "Grand Coulee Dam Total Dissolved Gas Tests, Outlet Works Test Results" [6] provides the details of the tests performed, the data, and the conclusions. A summary of the test results is reported here.
A method to predict total dissolved gas levels below Grand Coulee Dam for various spill releases was analyzed in the March 1996 report [3] using data recorded in the 1970's and 1980's. Predictions were based upon a theory which uses field data to characterize the ability of a hydraulic structure to transfer dissolved gas downstream. These analyses showed that all releases from the dam through the outlet works and/or the spillway will increase dissolved gas levels with the exception of small spillway releases over the entire width of the spillway. The accuracy of the predicted percentage increase in dissolved gas levels, particularly for the outlet works, was limited by the quality of available data.
A series of outlet works tests with various spill combinations were completed in March 1997. The outlet works tests were performed to measure the effects of specific operating conditions on the TDG levels downstream from Grand Coulee Dam. Spills were minimized to reduce the TDG increase as much as possible
Operational Alternatives for Total Dissolved Gas Management at Grand Coulee Dam 10
j
of
i
1
N__
J

while still obtaining the desired information. Powerplant flows were discontinued for some tests, then set at specific levels to investigate dilution effects.
TDG data were collected at a river section 2.3 miles downstream from the. dam. The ambient forebay and river TDG levels were about 106 percent during the test period. These data at the 2.3 mile. station, for the spill combinations tested, are plotted in figure 3 with the data from the fixed monitoring station 6 miles downstream (GCGW) and the net pen operations about 15 miles downstream.
As may be seen, the lowest TDG values at each distance downstream were recorded for the spills from both the upper- and mid-level outlets operating together in an over/under combination. The TDG reading was about 10 percent less than measured with either the upper-or mid-level outlets operating separately.
n IM
M
C O
U)
M
Q2 04 06 Q8 12
C$iIVCjzU
-it- tp wmtlets023ni -F LWwcLd&@GMN -k- yperabEts@n#M -& iibadE D23nri
nJdcLdets@G03N -6- oa/wdEro dEts @23m-*- uta/u-cla-cLAes @G3aN
Figure 3. - Percent TDG saturation values measured at various river locations with operation of the upper, middle and combined over/under outlet works and various powerplant flows.
The data indicate higher TDG values when operating the upper outlet works alone with no accompanying powerplant flow. With the upper outlets operating alone, the direct increases in TDG with no powerplant flow, powerplant flow equal to the outlet spill, and powerplant flow twice the outlet spill are 37, 33.6, and 27.1 percent, respectively. The jet from the outlet works appears to dive to the bottom of the roller bucket regardless of the tailwater depth or mode of operation. These data also indicate that the TDG percentage decreases as it mixes with additional
-# powerplant flows of lesser supersaturation. The TDG monitoring station
Operational Alternatives for'Total Dissolved Gas Management at Grand Coulee Dam 11
j
of

downstream of the dam does not allow direct evaluation of spillway or outlet works flows because mixing has occurred with the powerplant flows. The local dissolved gas supersaturation at the toe of the dam, depending upon the measurement location, will be greater than measured during these tests.
Also apparent from figure 3 is that degassing occurs as the gas plume travels downstream to the various measurement locations. Degassing between the 2.3 mile measurement station and the fixed monitoring station 6 miles downstream from the dam is on the order of 4 percent/mi in this reach for these flows. Further degassing, about 0.7 percent/mi, appears to be occurring from the monitoring station to the net pens about 9 miles further downstream. Degassing in the river to this level was not really expected based upon COE results at several of their sites where minimal degassing was experienced outside the immediate area of the stilling basins.
An important aspect of the outlet works tests was a better understanding of the behavior of the gas plume including the mixing and travel time to the fixed monitor. These lessons were applied to the following broader operational analysis of the yearly TDG data for 1996, 1997, and 1998, and are discussed in the following sections.
Turbine Operational Options
The turbines at Grand Coulee powerplant facilities can be operated at speed-no-load when power loads are not available., thereby reducing, or under some operating conditions, eliminating the need to spill through the spillway drum gates or outlet works. This capability allows passing flow of 3,000 ft3/s each for the 6 units in the Third powerhouse, and 500 ft3/s each for the 18 units in the left and right powerplants for a total of 27,000 ft3/s under speed-no-load conditions.
Turbines at the Grand Coulee project can generally be operated over a range of flow conditions, with an optimum flow rate, and reduced generation efficiencies as flow rates are increased or decreased. Efficiency curves vary somewhat from unit to unit, and the range of operating conditions may be restricted by cavitation or other mechanical problems. Reclamation can operate the turbines at Grand Coulee powerplant facilities outside optimum efficiency ranges to reduce spill while balancing power and downstream release requirements.
Analysis of TDG Data for 1996, 1997, and 1998
The TDG data for 1996 were obtained from the Hydromet on 15-minute intervals. Data were available. from March 7, 1996, to October 2, 1996. The flow data that accompanied this period was obtained from the COE web site on an hourly basis.
;J Total flow and spill flow were given, but the COE web site does not distinguish between spillway or outlet flows. Assumptions can be made based upon reservoir
Operational Alternatives for Total Dissolved Gas Management at Grand Coulee Dam 12
~J

j
elevation, however, the outlets may still be used when the reservoir elevation exceeds 1260. The outlet works must be used for spill when the reservoir elevation is below 1260 and it is necessary to determine which outlets produced the spill to determine the best way to manage TDG with outlet use. The information on the location and number of outlets producing the spill was obtained as a typed copy from the dispatchers at Grand Coulee Dam. Spillway gate operation, including settings and/or opening and closing times, are not recorded. Therefore, when spill was documented with the reservoir above El. 1260 and no outlets indicated as open, spillway usage was assumed. This information was all compiled, formatted, and analyzed in a Lotus spreadsheet.
The TDG data for 1997 were obtained as hourly data from the Hydromet system and the flow data from the web site maintained by the COE. TDG data were available from January 28 to March 11, and May 9 to August 13, 1997. The new TDG monitor in the FDR forebay was installed May 12 and recorded data until August 13, 1997. Again, the mode of operation was obtained from the dispatchers at Grand Coulee and all the data compiled in a Lotus spreadsheet. The TDG data through mid-June 1998 is also included, however, only one significant spill event
r, occurred.
Use of these data will produce an empirical relationship between TDG and spill for outlet works operation mode or spillway operation. The 1996, 1997, and 1998 TDG and flow data are shown on figures 4, 5, 6, 7, and 8. These are raw data with filtering of obviously bad data, but no separation between outlet works operation mode (i.e. upper, etc.) Spillway operation is indicated.
Of importance in the analysis of the data is the mixing in the pool immediately below the structures and in the river channel to the fixed monitor 6 miles
d downstream from the dam. This monitor has been recording data for many years and is the only source of TDG information with the. exception of the few field
U measurements previously discussed. The very high number of possible operating
U scenarios and the incomplete mixing in the immediate pool downstream of Grand Coulee would make conducting near field tests difficult over the full range of operation. The near field tests have primarily been conducted by the COE for fish passage reasons which is not required at Grand Coulee and for development of gas production theories.
14
Operational Alternatives for Total Dissolved Gas Management at Grand Coulee Dam 13 1
J
Figure 4. - Grand Coulee TDG and spill data for January through April 1996 with only outlet works operation. Filename: c:\Kathy'sfiles\98super\96datal.wpg
Operational Alternatives for Total Dissolved Gas Management at Grand Coulee Dam 14
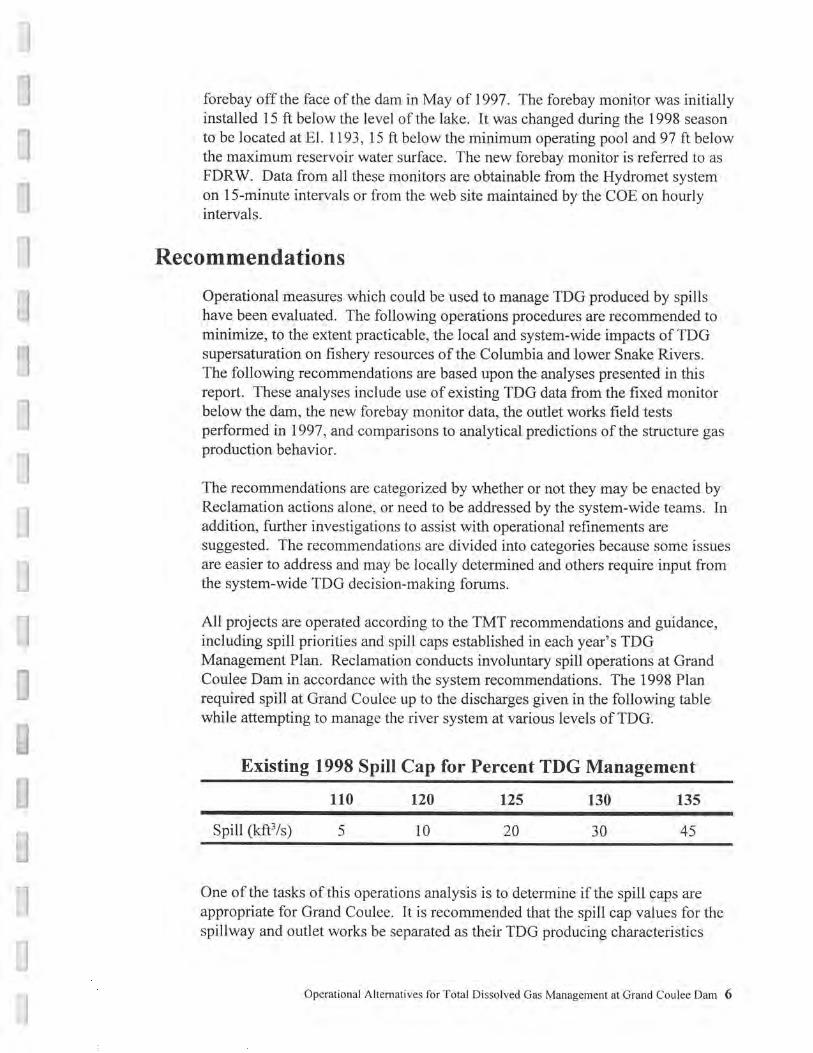
Hgure S. - Grand Coulee TDG and spill data for May through October 2, 1996. Once the spillway drum gates began spilling there was no further outlet works use. Filename: cAkathy's filesW8.super\96data2.wpg
Operational Alternatives for Total Dissolved Gas Management at Grand Coulee Dam 15

170
160
150
140 O
0 130 10 li '
Are
110
300
200
100
-300
-400 3/21/97 3/31/97 4/10/97 4/20/97 4/30/97 5/10/97 5/20/97 5/30/97 6/9/97
100
~IrE~ Nllrl IMA M ` ` 1 liw1A/ pIAM, 1
—TDG-Foreba — TDG-Tailwater — Qriver — Qs ill
Flgure 6. - Grand Coulee Dawn TDG data froze March through May 1997 with outlet works spill only. Filename: c:\Kathy's fileA9hows\gcls7.wpg
Operational Alternatives for Total Dissolved Gas Management at Grand Coulee Dam 16
1
1
1
C~ r..I a:z M = ® C C-I r—I C- I = ® ® C::C7 ® L.J
5/30/97
300
200
100
0A i~
-100 0
-200
-300
-400 7/4/97 6/4/97 6/9/97 6/14/97 6/19/97 6/24/97 6/29/97
— TDG-Forebay — TDG-Tailwater — Qriver — Qspill
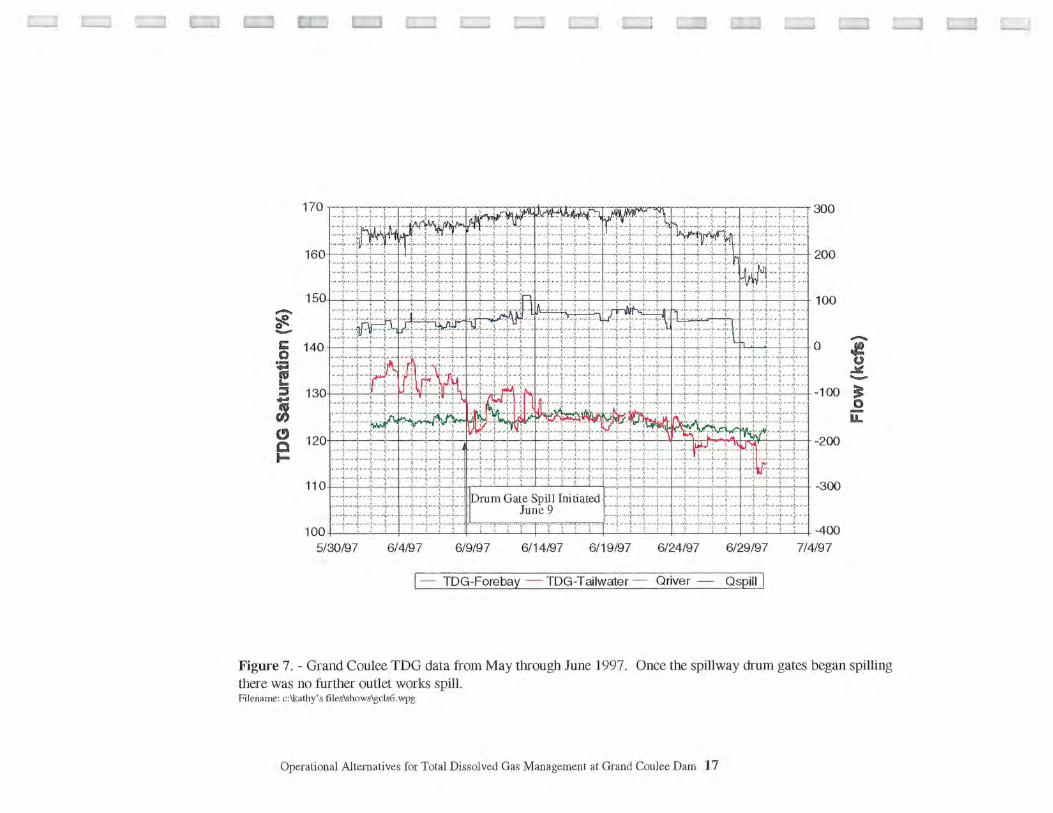
Figure 7. - Grand Coulee TDG data from May through June 1997. Once the spillway drum gates began spilling there was no further outlet works spill. Filename: c:\kathy's fileskshows\gds6.wpg
Operational Alternatives for Total Dissolved Gas Management at Grand Coulee Dam 17

IN 1t
I 175 300
1 ~5
1 55
i E
!j
E
:. •::..3.._...r.......€.......... ...._ ............ ! .........._..
_ I I .... ~ - : r ..,.a:.................• :. ~ . _- ... - _E
5n
90
Inn ..... ~•~ - ., Ii .~i. .~ ~ ' ,
€
`` i •.i -
III€-_
I
•....~ ¢
ss 1'•:51 1 1 ._ -1~ -:-1 ~_ 1 ~#..i _ _, ~ I.. II ~-£
~
~ if
~ ~s : i~ `' ~~i- ~ I' 1' :~ ••~ {.I 1-;
- it 14F o
_
f-
........... ..._ ............. _ .............. ......................... _ .................. '... __ ....................................... '........................... _ ....... - ...... !. - ..........._....................... ..
-50
ton o J
-160
135 S
__ ......................_.....,...._!......._........._._......................_....---......._...................._..... °..._.........__.............._............4 --- __............_------................... ................... ... ............... -300
-330
115
105
........................... __ ............ ..................... ........_.............._....._ ........._.................._..... .............. _ ....... .-------------------- ..` ... - .............................. ._ ........ -....................... _ ......... _....
I ~ ~ ' ~ y{~ A+f 4~~ .................................... .....-.._....-- .......a .... --------- ....... _- ._......................._....._._ _. .
300
•350
-400
I -450
95 26-Cleo-97 26-Jan-98 24-Feb-98 204,tar-98 25-Apr-98 26-May-08 24-Jun48
DAT E
T 0 TIAL S P I LL (kds) -• FDRWTDG — GCGWTDG - SPILL(k o
Figure 8. - Grand Coulee Dam TDG and spill for January through mid June 1998. There was only a very short spill in March from the outlet works and a small spill of short duration in May from the spillway. 1 Filename: cAKathy's fi1es98.super\98data.wpg
Operational Alternatives for Total Dissolved Gas Management at Grand Coulee Dam 18

Description of Flow Mixing
The location of all the hydraulic structures at the dam with respect to each other, the downstream pool, and the river channel, are critical aspects of the flow characteristics and TDG mixing. The spillway and outlet works flow travels down the face of the dam and plunges into the roller bucket energy dissipater at the base of the spillway. The tailwater produces a deep plunge depth during normal operation. The minimum tailwater elevation should be El. 956 because of the backwater from Chief Joseph Dam. The tailwater curve, shown on figure 9, was developed from the river gage located at the bridge %2 mile downstream from the dam with web site data for 1997. As may be seen, there is quite a lot of scatter in the tailwater data. This is most likely caused by reservoir fluctuations at Chief Joseph Dam downstream and possibly the location of the gage which may be influenced by high flow velocities existing the pool below the dam.
Figure 9. - Tailwater data from the gage located at the highway bridge
O below Grand Coulee Dam for 1997. Filename: C:\kathy's files\98super\tw97data.wpg
The spillway and spacing of the outlet works across the spillway face are wider than the river channel. The outlet works conduits on the right (looking downstream) or east side of the spillway are used most often because they are the best aligned with the river channel (figure 1). The left powerplant discharges to the left or west of the spillway with a capacity of about 50,000 ft'/s. This flow is relatively isolated from the main pool, particularly when the spillway is operating. The right powerplant discharges adjacent to the spillway but normal to the discharge from the Third Powerplant, also with a capacity of about 50,000 W/s. The Third Powerplant has a capacity of about 180,000 ft3/s and discharges almost parallel to the original dam axis and normal to all the other hydraulic structures and the river channel. The large capacity of the Third Powerplant highly influences the flow conditions in the pool below the dam and in the river channel
LI downstream. Third Powerplant use is preferred by BPA and the dam operators.
Operational Alternatives for Total Dissolved Gas Management at Grand Coulee Dam 19
Flow generally crosses the downstream pool and travels along the left river bank for quite a distance downstream. During the investigative trip [5], flow was still not fully mixed for about 1'/2 miles under a total flow of about 110,000 ft'/s. With higher flows the distance for complete mixing will be longer.
The Third Powerplant flow is not aerated and discharges far enough away from the roller bucket that its release should not be supersaturated by outlet or spillway releases. The adjacent left and right powerplant releases have a greater probability of mixing with and being supersaturated by the outlet or spillway release.
The total flow, both spill and power release, travels down river about 6 miles to the permanent TDG monitor located out in the river about 20 ft from the left bank at a depth of about 15 ft. The flow is fully mixed by this time [5] and obviously some degassing has occurred with travel to this location (figure 3).
The TDG percent at the fixed monitor located 6 miles downstream from the dam is described by the following equation:
_ Q SPILL (%TDG
SPILL) +QPOWER(%TDG
POWER) %TDGG
~,Ga,—K SP/LL POWER
The TDG readings at the fixed monitor represent fully mixed flow. This equation combines the potentially different TDG percentages associated with spill, either outlet works or spillway, and power generation and the different discharge volumes. The coefficient, K, is inserted to represent the degassing that occurs in the river to the fixed monitor. Degassing is, however, not known well enough to define this coefficient with certainty. When using this equation for direct computations of percent TDGGCGW with known TDG percentages at the dam the coefficient K is not used because of its uncertainty. Therefore, the percent TDGC,CGW values will be conservative because degassing will not be included. The percent TDGGCGW that is the value published on the web sites includes degassing in the river section between the dam and the fixed monitor.
Travel Time to the Downstream Fixed Monitor
During the outlet works tests, it became apparent that travel time to the fixed monitor was an important feature when analyzing the data. With no powerplant
a release and a spill of about 32,000 ft3/s, the travel time ranged from 4.25 to
0 Operational Alternatives for Total Dissolved Gas Management at Grand Coulee Dam 20

5.25 hours to the fixed monitoring station. A total flow, both spill and power, of about 100,000 ft3/s took about 3.5 hours to travel to the monitor. The arrival of the gas plume could easily be tracked using the 15-minute Hydromet recordings. TDG measurements taken from the boat closely matched those of the fixed monitoring station when compared to the Hydromet data that is recorded on 15-minute intervals. The hourly data report on the COE web site is just that, it is the reading on the hour, not an average of the 15-minute readings. Often the highest TDG level is missed, there are discrepancies when compared to the direct Hydromet data, or there is a high TDG reading for an hour after the spill has already been shut off.
In spite of these problems, using the Hydromet data directly with the actual times of spills is the best way to monitor the relationship between spill and TDG. To help correlate the TDG readings and the spill times, the travel time to the monitor was computed for various flow rates. The travel times were computed using hydraulic capacity data from the "Grand Coulee Third Powerplant Degradation Study" by Jim Blanton [7]. In this study, prototype velocity measurements were made in the river below Grand Coulee to calibrate a physical and numerical model that was used for designing the riprap channel below the dam when the Third Powerplant was constructed for peaking power. Average velocity data across river reaches 1-6, from the dam to below the fixed monitor, respectively, were plotted versus discharge for the Chief Joseph pool at El. 956. The Chief Joseph pool influences the tailwater at Grand Coulee. The data for reach 1 showed a lot of turbulence and mixing was still occurring in the pool immediately below the dam and was not used in the average velocity determination. An equation was fit to the velocity data for the remaining reaches producing the following relationship between velocity and discharge through the river to the fixed monitor:
V=0.185 *Q 0.6614
with velocity in ft/s and discharge in 1,000 ft'/s.
The fixed monitor is located at the end of river reach 5, and is located 31,680 ft downstream from the dam. The travel time is this distance to the fixed monitor divided by the velocity for the entire range of flows expected. As the flow increases the travel time to the monitor decreases. The travel times computed by this method compared very well with the times observed during the outlet works tests. The travel time was then rounded to the nearest hour, i.e. if 0<_t<_ 1.5 then t=1. The TDG values were then adjusted to correlate better with the spill time. The result of this adjustment was not as dramatic as expected. Some of the data scatter was eliminated, but on the whole, the trend in the data remained the same.
Operational Alternatives for Total Dissolved Gas Management at Grand Coulee Dam 21

Outlet Works Operation
Unique to Grand Coulee Dam over the lower Columbia and Snake River dams are the outlet works that are used to draft down FDR lake based upon flood forecasts for the spring runoff. There are four possible operating scenarios for the outlet works spills; 1) the upper outlets alone, 2) the mid outlets alone, 3) the upper and mid outlets combined in over/under fashion simultaneously, and 4) mixed operation of upper and mid outlets randomly open. The number of outlets opened depends upon both the reservoir level and the required spill. Lower reservoir water levels require more outlets be open to pass the same spill, thus there is potentially more TDG production with the introduction of additional outlet jets for the same spill than that obtained by fewer outlet jets at a higher reservoir water level. The jets from the outlet works have a very high velocity, are highly concentrated, and are highly aerated. There is some spread of the jet prior to impingement with the tailwater. The jets appear to dive to the bottom of the roller bucket regardless of the tailwater depth [6].
The data sets for 1996 and 1997 were separated out by mode of operation for all the outlet works operating scenarios and the spillway drum gate releases. Separating out only spill data from the entire data set removes the varying seasonal reservoir TDG levels or the no spill TDG values transmitted by power releases only. The data from 1998 included only a short outlet works spill in March and a short spillway spill in May. Data were initially plotted separately for 1996 and 1997 by mode of operation. The same operating modes for 1996 and 1997 were then compared. The data sets were very similar for both years and were therefore combined into one plot for each mode of operation and equations fit to the data. The 1998 data were used to verify results. Figures 10 through 14 show the trends in the TDG production with the various outlet works spill configurations. Figure 15 shows the generation of TDG by the spillway. The equations fit to the data were of similar form used by the COE in the 30 percent draft of the Total Dissolved Gas Abatement Phase II Technical Report [8]. The equations were also of similar form to what would be fit to the theoretical predictions made for Grand Coulee spillway gas production in 1996 [3].
Figure 10 shows the TDG production characteristics of the upper outlets operating. Data were available for spills up to about 55,000 ft3/s with the TDG varying from 101 to 142 percent. This plot, as well as the others following, displays a great deal of scatter. This will be explained as much as possible in the error analysis section. The equation for the upper outlets operating alone is:
TDG =175.79-63.06e -- 0084Q
upper
where the spill discharge, Q, is in 1000 ft3/s.
Operational Alternatives for Total Dissolved Gas Management at Grand Coulee Dam 22

160
I I
, ,
1 f 0
o
F
_.. _
I
.
L
.
140 r._ ................ _.._._. ... - ... i ........_.._ 1 I
_ _. _ _.... _. __. _ .
a ..-..__..__..._ ................ =- _...._._.... ~r......p.._. .__ ._ ' ._b .._..... .......---._... ... .._..;....._...__.... - - - - -- - ..__...
130 4..__ ... _. ............. .... _........... o.. a..; .............. __..4......... O
.. .O .. - --.._... ., .....;. .....f --...._..—~._...._.__. ... ---_..__ ..' ............. -- - C0 Oj :p a
o ..........QL... i
o O ; 4i ■ 10 0~4 ;
.. a ............ ._............4....._.~t...._.._..-._........_...'.......-..._.
.
f....
j
120 ~p
P_ 00^x: ._ b.....:...- -.: .....-_._..... _ ........
_ _...,q.......... .... ;...... i..._
_ ~..........._.._lt.__....._._..._...._
... _.Qp....._..__.._ __...._.__ _.....__.__....__..__.... ..._..... __.___s ..._-__. —__.—_.__......_.... I_..
110 ~A._. ■ o ■
~_. ;.-~ :
.............._.....__......--- ;o I
..__ _ _.... ___._ -......_.-.. ._...-- --__ -
~._.....; _.._..._._ _ ..........................._....__......._....:.__ ......... ..... ..._ ------ ......... -..-- : __...j...... _ _ .......... -.---- - - ...-- - -..... - -
■ ■
■ ■
; f _
100
0 10 20 30 40 60 60 70 80
SPILL (kcfs)
■ 1997 data o 1996 data
Figure 10. - Upper outlet works spill TDG data for 1996 and 1997. Filename: c:\kathy's fi1es\98super\upper.wpg
Figure 11 shows the TDG data for the mid outlets operating for 1997 only. There was no record of only this level outlets operating in 1996. There were a very limited amount of data, therefore, no equation was fit.
,so
_. . 1
140 I
130 1
o 120
~' ■ 110 I~ ; ._ .- ---------- ------------
■ _ _ ■ 1997 data
100 0 10 20 30 40 50 GO 70 60
SPILL (Ws)
Figure 11. - Mid outlet works spill TDG data for 1997 only. There were no other data available for raid-level outlet works operation. Filename: e:\kathy's files\98super\n>id.wpg
Operational Alternatives for Total Dissolved Gas Management at Grand Coulee Dam 23

i!
Comparing figures 10 and 11, upper- and mid-level outlets only, show no significant difference. The range of flows and TDG recorded for the mid-level outlets falls within the scatter of the upper level data. The outlet works tests that were performed in March 1997 also showed that using the mid outlets alone produced very similar gas characteristics to the upper outlets (figure 3). Therefore, the gas producing characteristics of the upper- and mid-level outlets are assumed to be similar.
Figure 12 shows the TDG data versus spill for mixed operation of the outlet works. The majority of the spill was conducted with over/under release and one or two additional outlets operating singularly to achieve desired discharge goals.
150 I i
140 i ..._...._..,_._......._._._;._.._._.._...y........_....._...._...._..._......;..._......_._.__.__.__ i i 1 1 i r _. _ __....._....h._..._.....__ _...._. _ __..._.. ~ _ _—....._ .._ ...... _ ___.........
......... ......_.__._ :................. f_ __..._....... I i i ..._..... _ _..._.__ _ ...... _ _..... _ ...._.... __ _ _..__._. !
130 .. . ..........__.._ O _...... p._. ! <4
T
....._..... ........ _...._.._ _ ......_... _ _ .-..... _... _ _..- _...._. . ...... . ...... i
Uv.._........_
R O O +g .._........... O
. . ...................._..._._;_._._..._.._.— _..!.._ .......... _... i
OO ! i O
i ................... _ .... . _. 120 ;
...._. ,._.__~ -. .....;.__. _ ............_:........._..._.' ' .Q _:........_..._._!_...... ..... _........ ..... ---- -......_. ............. _..._.. . ...............T.........._..._...I__..__.._.._..
110 ~......._ .__-....~.....0..-c>..._..._.._ 4 .. .................... ...............
... .... ...... _ _ ...............I..............__.!._......._...__ .. ... ..... _.._ ....__ _ _ ... __ ...... ...... . _...._... _ _..._
1 I 100
I i I
0 10 20 30 40 60 60 70 80
SPILL (kcfs)
■ 1997 data O 1996 data
Figure 12. - Mixed outlet works spill TDG data for 1996 and 1997. Filename: cAkathy's R1es\98super\mixed.wpg
Mixed outlet works levels were used to spill flows up to about 35,000 ft3/s in both 1996 and 1997. Mixed outlet works spill produced TDG levels from about 107 to 135 percent. This mode of operation produces less TDG than the upper or mid outlets operating alone. This is due to some breakup of the jet on the spillway face due to impingement with the other jet and to less surface area for air entrainment when jets are combined prior to entering the pool. The equation for the mixed outlet works operation mode is:
TDG, iX=208 -92.4_ -0.0038g
Operational Alternatives for Total Dissolved Gas Management at Grand Coulee Dam 24 NI
I!

The data set for combined over/under outlet works spill is shown in figure 13 for both 1996 and 1997. Operation with combined over/under spill was up to about 55,000 ft3/s in 1996 and 75,000 ft3/s in 1997. Combined over/under operation was the preferred method of operation during 1997 because of the earlier findings during the outlet works tests and operators investigations.
140
i ! ! !
130
i cif
120 -.....~_ ...:_ 00 ~..; _ - - ......... --E _ ............. r_ ................. !...
i
.....~....n. ..... .._ e _..._._.s_f
.... _..._... .i.._` _ .............
E i ........ ......... _.._. _ ...... _ - — _.__ __.._...
!
T
.. ........ !
■ • i i i i i !
I i
i .. 110 r._..._...._. ... .; . _ .;._ ....~..._
!
i I E
100
0 10 20 30 40 60 60 70 80
SPILL Xfs)
■ 1997 data O 1996 data -- +2.36 -- -2.36
Figure 13. - Combined over/under outlet works spill TDG data for 1996 and 1997. Filanamz: c:\kathy's files\98super\o_u.wpg
The combined over/under operation produces TDG levels from 105 to 138 percent. There were greater spill volumes reported for over/under operation than for other operation modes. The equation for combined outlet works over/under spill mode is:
TDGa1u =152.13 -36.59e -0- 0132Q
The data for the Mixed and over/under operational modes were very similar. Often, the only difference was that one additional single outlet was opened to achieve the desired spill. As a result, the data sets were combined in figure 14. The previously fit curves for each separate operating mode and a new equation fit to both data sets together are shown.
Operational Alternatives for Total Dissolved Gas Management at Grand Coulee Dam 25

ISO
i
140
f
r ,... _.._... i
600
i I
if ~ ~
130 _.--- .................. -_ ..........
0
A _ ! i
o 120 -
~ f
.,..,._ .:....... .......... ........ .......... .......... .............
■~ I
' 1 ! L-....._......_ 110 .... _ . _... .. _....__L...-._..._..._!._...... ............. _.....- _j -- - ..__._..i....._. .....
I
100
0 10 20 30 40 50 6o 70 80 SPILL (kcfs)
■ 1997 mixed and over/under o 1996 mixed and over/under equation fit mixed
— equation fit over/under — equation fit mixed & over/under
Figure 14. - All mixed and combined over/under outlet works spill data with equation fits. Filename: c:ucathy's fi1es\98supar\a11fit.wpg
As may be seen, these curve fits are all very similar with the fit to all the data giving a slightly higher predicted TDG with high spills and slightly lower predicted TDG with smaller spill than the over/under operation alone. The equation fit to all the outlet works ).nixed and over/under data is:
TDGborh=167.85 -52.9 le -0.0085Q
Recommended Outlet Works Operation Mode
The empirically derived equations for outlet works spill given in the previous sections all may be used to predict expected TDG levels for a specified operational mode. Operation with the upper-level only and the mid-level only produce the most increase in TDG percentage. Figure 14 compares the mixed and combined
Operational Alternatives for Total Dissolved Gas Management at Grand Coulee Dam 26

J 0
over/under operational modes. The mixed operation appears to provide the lower predicted TDG, but over a smaller range of data and when combined with the
` over/under operation predicts higher TDG with spill compared to the over/under operation alone. Therefore, combined over/under operation (TDG.,,,) should be used whenever possible to reduce the TDG production when the outlet works must be utilized. Figure 13 shows a result of the error analysis with an expected envelope of ±2.36 percent saturation representing the measurement uncertainty in the TDG data.
Spillway Operation
o Spillway operation has been shown to produce less TDG than the outlet works during spill of similar volumes. This is logical when considering the processes causing production of TDG. The 1650-ft-long spillway will spread the same spill volume across the entire face, reducing the velocity and depth of the jet, thus the depth of plunge into the tailwater compared to the outlet works. This might allow increased spill volumes under the spill cap when FDR Lake level is above the crest of the spillway.
It has been suggested to limit the drawdown of the lake to maximize spillway drum gate usage by reevaluating the flood rule curve currently in use. This issue is being addressed by the appropriate agencies at this time. The following evaluation of the spillway operation makes no assumptions regarding future times of spill. It is based upon current reservoir operating conditions with the existing flood control criteria. This current criteria generally require drawdown of the lake which limits spillway discharge to late spring or early summer_
The recorded data for total dissolved gas generation by the spillway in 1996 and 1997 is shown in figure 15. These were both high spill years at Grand Coulee with spills approaching 65,000 ft3/s in 1996 and 110,000 ft3/s in 1997. Spillway discharges produced TDG levels from 108 to 132 percent. The spillway data was fit to the following equation:
TDGSPHY =242.55 -126e -0.0009Q
This equation is developed directly from field data and as such is empirical. Using q P Y P g this equation, when the spillway flow is 100,000 ft3/s the predicted TDG level would be 127.4 percent, at 300,000 ft'/s, 146.4 percent, and at 1,000,000 ft3/s, 191.3 percent. The equation predicts TDG level of 116.6 percent with no spill. This is slightly lower than the expected reservoir levels in the months of June, July, and August when these spill data were collected. The spillway clearly produces less TDG than using the outlet works. Figure 15 also shows the bands of expected
Operational Alternatives for Total Dissolved Gas Management at Grand Coulee Dam 27
I
~I
J

measurement uncertainty plotted at ±2.36 percent saturation. The following section will explain the reasoning behind this value.
140
130
t~ 120
0
110
100
0 20 40 60 80 100 120
SPILL (kcfs)
In 1996 data ♦ 1997 data -- +2.36 -- -2.36
Figure 15. - Spillway TDG data from the 1996 and 1997 seasons. Filename: cAKathy's fi1es\98super\spwy1.wpg
Error Analysis
The scatter in the TDG data sets is very apparent. However, experts agree that direct field measurement of the actual TDG is still the best method to use when evaluating TDG production at a specific site [9].
There are several apparent reasons for the scatter in the data:
► the mixing process including the amount of spill versus powerplant flow and the TDG levels of each
► the tailwater depth or plunge depth associated with the total flow for a given spill
► the number of outlets used to comprise the spill which will vary with outlet level used and total head available
the accuracy of the recorded mode of spill
instrument accuracy and measurement uncertainty
the appropriateness of the monitor location
Operational Alternatives for Total Dissolved Gas Management at Grand Coulee Dam 28

of
Each of these factors is addressed in the following discussion. Each plays a role in the accuracy of the data, however, a value has not been determined in most cases.
Various spill amounts are mixed with powerplant releases that also vary greatly. Generally, the spill is set and the power generation fluctuated. Large variations in TDG values occur with mixing of the same spill volume with different powerplant flows and associated plunge depths. This accounts for many of the vertical bands of TDG values at specific spill rates. The TDG levels associated with mixing the same spill with various proportions are explained by the earlier description of flow mixing.
In an attempt to further explain some of the data scatter, the tailwater fluctuations associated with various total power releases were investigated. Tailwater fluctuations accompany the varying power releases and may change up to 22 ft in one day. This leads to subjecting a given spill volume to quite different pressures at plunge depth. The sensitivity of spill to plunge depth was addressed by sorting the TDG data by the amount of total spill occurring during each spill event. A 5 ft tailwater increment was chosen to analyze total releases up to 300,000 ft'/s. Five-foot increments in tailwater beginning at El. 956 were used to group total release volumes. Using the tailwater curve (figure 9) the corresponding release increments for comparison were 0-90,000, 91-140,000, 141-190,000, 191-250,000 and 251-290,000 ft'/s. A plot of this relationship is shown on figure 16. Unfortunately, as may be seen from this plot, there was no clear relationship between tailwater depth associated with total flow, spill, and TDG.
l 0
a
Figure 16. TDG and outlet works spill data sorted by the plunge depth associated with various total spill amounts. Filename: c:\Kathy's fi1es\98superklep_sp.wp-
If Operational Alternatives for Total Dissolved Gas Management at Grand Coulee Dam 29
I

A given spill volume may be comprised of a different number of open outlet conduits depending upon the available reservoir head. For a given discharge, more jets entraining air and plunging into the tailwater will increase TDG production for the same discharge.
Spill records are kept by hand in a log book at Grand Coulee. They are then typed and transmitted to the COE. The mode and times of spill is sometimes not kept as accurately as would be liked. Some assumptions were made when the operation data was not available or unclear. Improvements in recording spill modes and times have been suggested to the operators at Grand Coulee which could help significantly with record keeping now that flow data appears to be under more demand.
Statistical analyses have been performed on vast quantities of TDG data to determine the quality of the data and the accuracy that may be expected in terms of measurement uncertainty. These data have been recorded with several types of modern TDG instruments. The uncertainty associated with these instruments has been computed to be 2.36 [10]. This means that there is a 95 percent confidence that the measurements taken will be within 2.36 percent of the true value. Therefore, a 115 percent saturation measurement should be thought of as 115 ± 2.36 percent saturation. Error bands corresponding to this 95 percent confidence interval have been added to the recommended outlet works combined over/under operation mode and the spillway TDG plots.
Q Most of the equations fit to the data produced acceptable correlation coefficients. This coefficient is a measure of how much a change in one variable (spill) will relate to changes in the other (TDG). A perfect fit would produce a correlation coefficient of 1.0. For the outlet works equations, the coefficients ranged from a low of 0.37 for the mixed equation fit to 0.83 for the combined over/under equation fit. The correlation coefficient for the spillway equation fit was 0.75,
' which under the circumstances is acceptable. This coefficient is a measure of how well the equation fits the data, but not a measure of the quality of the data.
This statistical analysis does not address the issue of sampling uncertainty or the ability of the probe to measure the characteristics of the river at the location
' chosen. In addition, uncertainty or variability in readings is increased directly below the dam near the spill locations due to incomplete mixing and turbulence. The investigative trip conducted in February 1996 [5] confirmed that the fixed monitoring station 6 miles downstream from Grand Coulee should be free of errors due to incomplete TDG mixing.
The TDG data at Grand Coulee do exceed the uncertainty reported for bias and precision determined by these previous investigations. There are many reasons for
Operational Alternatives for Total Dissolved Gas Management at Grand Coulee Dam 30

some of the data scatter, however, attempts to further quantify the data scatter have largely been unsuccessful and/or felt to be unproductive_
Comparison of Empirical Results to Predictive TDG Theory
The results shown and the conclusions drawn in the previous sections are based upon the direct measurement of TDG from the fixed monitoring station 6 miles
a
downstream from Grand Coulee Dam. Direct measurement of the TDG levels associated with various spills at specific sites is the best method to predict future TDG production [9]. Comparisons are still made to existing gas transfer theory in the hope of increasing the comfort level in using these empirically-derived equations and in eventually extending them beyond the limits of the data.
The results presented provide expected levels of TDG for various operating conditions and guidance on the best methods to use for operating the dam to manage TDG. The equations derived reasonably fit the data range used in their development, however, the capacity of both the spillway and the outlet works at Grand Coulee Dam far exceeds the available empirical data. In addition, the scatter seen in the data sets is considerable and could likely not well-predict all possible operations. Because of this, a theory to verify the existing data and the predicted TDG levels at higher flows is desirable.
Johnson [11], Geldart [12], and Hibbs and Gulliver [13] have developed methods to predict TDG levels based upon the geometry of the hydraulic structures, plunge depth, temperature, and pressure. Predictions, based upon computation of a gas transfer efficiency, of the TDG production of the spillway were reported earlier [3]. The empirically-derived equations for TDG versus outlet works and spillway spill are a function of the. diluted or mixed TDG from the spill device and powerplant releases, as are the theoretically-derived predictive curves.
Figure 17 shows the theoretical predictions for spillway operation versus the empirically-developed equation for the spillway for various reservoir TDG levels. The empirically-developed equation closely matches the theoretical equation based upon the mixed flow at the fixed monitoring station and a reservoir TDG level of 120 percent. The empirically-developed equation was developed when the reservoir TDG level was at or above 120 percent and mixed with powerplant releases. This should provide a greater level of confidence in the predictive ability of the theory and the empirically-derived equations for use at Grand Coulee Dam.
Temperature Influence on TDG Percent
Temperature data are gathered at each of the monitoring stations with the TDG data and pressures. Since installation of the forebay meter in May of 1997, several anomalies were apparently occurring in the TDG data. The forebay meter was originally installed at a depth of 15 ft which is at a very shallow depth in the
Operational Alternatives for Total Dissolved Gas Management at Grand Coulee Dam 31
J

ISO
I I i I I I I I 150 ....;..-__......_..._ _.___.}..-'- '-_._._ ...._ _;_.. ___i_._,;,,s ~ .
140
I ' ! r
i r r
130
' 3~
12D 1, __.. ! __------
--
_
I
110i I I
t I
;r
i i i 1 I
i
90 0 25 50 75 100 125 150 175 200 225 250 275 300 325 350 375 400 425 450 475 500
SPILL (WS) # 90MIN + 100MIN -k 110MIN 120N41N rt SPVVY EQ
£i 90MAY6- 100MAX -& 110MAX e 12DMAX
Figure 17. - Comparison of TDG production by the spillway for the empirically-developed equation and as predicted by theory. The legend labels correspond to reservoir TDG levels and a minimum and maximum tailwater condition. Note that the equation
n closely follows that predicted for a reservoir TDG of 120 percent. 1 Filename: cAkathy's fi1as\98super\spwyconip.wpg
reservoir compared to the elevation of all the releases except the spillway. At maximum water surface, the inverts of the spillway, upper outlets, mid outlets, Third Powerplant and older powerplants are at depths of 30, 153.33, 253.33, 160, and 249 ft, respectively. The powerplant and outlet works releases are made from deep in the reservoir and were most likely not clearly represented by the temperature and TDG levels recorded by the shallow forebay monitor in 1997. The monitor was moved in 1998 to 15 ft below the minimum operating pool of 1208.
D The TDG, spill, and total spill data are shown in the previous figures 6-8 for the 1997 and 1998 years. In the 1997 plots, the TDG levels in the forebay later in the summer are less than those in the river indicating at fist inspection that perhaps the powerplants are "gassing" the flow. The 1998 TDG readings seem appropriate. There are several factors causing the unexpected TDG readings because it has been well documented previously [1] and will be discussed in following paragraphs that the powerplants at Grand Coulee simply transfer the reservoir TDG levels.
The corresponding temperature data are shown on figures 18 and 19 showing a temperature increase of both forebay and river temperatures throughout the season. The river temperature has been documented for many years and increases from about 2.5°C in January to about 20`C in August. The temperature plot for 1997 shows that after mid-August the surface forebay temperatures eventually
Operational Alternatives for Total Dissolved Gas Management at Grand Coulee Dam 32
I
0
D
I1
;I
181
C~

exceed those of the river station 6 miles downstream with only power release. With no spill, and withdrawal from deep in the lake, the temperature in the river immediately below the dam will be less than on the surface of the lake. Some warming will occur by the time it travels to the monitoring station 6 miles downstream.
Figure 18. - Temperature profiles for the 1997 season. FDRW data is from the forebay monitor installed in May near the surface of the reservoir. Filename: 6kathy's files\98super\temp97.wpg
Figure 19. - Temperature data for the 1998 season to date with both the river, GCGW, and forebay, FDRW, monitors operating. Filename: Okcathy's files\9 8super\9 8temp.wpg
Operational Alternatives for Total Dissolved Gas Management at Grand Coulee Dam 33

Warming would increase the expected TDG level by the following relationship:
C R
%TDG = T,
*100 where T2>T, C `
T
CTt' = measured concentration of dissolved gas at initial temperature T,, assuming that the water is initially saturated at T,,
C.r2* = saturation concentration of dissolved gas at final temperature T2
The ideal gas law states that the amount of gas a liquid will hold decreases with an increase in temperature. Therefore, if the actual concentration of a dissolved gas remains the same, the percent saturation should increase as the temperature increases. Therefore, if only the temperature change is involved then the TDG below the dam would be less than that recorded by the forebay monitor, because the temperature was greater on the lake surface than in the river for the summer of 1997 (figure 18). However, this was not observed in late summer with no spill in 1997 (figure 7).
To investigate this issue, temperature and TDG profiles were measured by PN region staff on August 12, 1997, to a depth of about 100 ft. These profiles are shown on figures 20 and 21. These data indicate, as expected, that the temperature is decreasing with reservoir depth, however, the trend for increasing TDG with depth must be a function of something else because the colder water in the bottom of the lake should produce a reduction in TDG levels with depth. Therefore, temperature is not the only parameter affecting the TDG percentage.
N
Figure 20. - Temperature profile with depth in FDR lake at the dam on August 12, 1998, showing a decrease in temperature with depth.
it Filename: c:\data\super\97tlow\fdrt_ tdg.wk4
Operational Alternatives for Total Dissolved Gas Management at Grand Coulee Dam 34

Figure 21. - TDG profile associated with the temperature profile in figure 20 on August 12, 1998, showing an increase in TDG with depth.
The difference in TDG percentage is a function of the actual dissolved gas concentrations, in addition to the temperature, and the withdrawal elevations of the powerplant relative to the surface and the forebay monitor elevation. These parameters are constantly changing. Reservoir TDG and temperature are constantly changing with the inflow, weather, surface turbulence, and withdrawal elevation and amount.
The temperature increase and expected TDG increase at the surface is offset by the turbulent stripping of dissolved gas at the surface of the lake. This has been documented historically and is also shown in figure 21 where the TDG percentage is lowest at the surface in spite of the higher temperature. In addition, the river temperature increases throughout the summer causing an increase in TDG pressure over that in the reservoir at the withdrawal elevation. This would also be expected given earlier studies that show that the lake does weakly thermally stratify in the summer months [1, 2]. Temperature and nitrogen concentration data gathered in the 1970's at Pine Tree point, about 3 miles upstream from the dam in FDR Lake is shown on figure 20. Figure 20 indicates that the reservoir is fully mixed with respect to temperature and nitrogen concentration, top to bottom, in the late fall and winter months. As early summer approaches the lake begins stratifying with respect to both components. This is due to the large run-off entering the lake which generally carries high concentrations of nitrogen. The bottom of the lake tends to have higher concentrations of TDG during the summer months than the surface waters. Therefore, when the power releases were made from deep in the lake in 1997, the TDG levels recorded by the monitor downstream often exceeded those of the shallow forebay monitor. In addition, the water quality standard was also exceeded without spill of any kind. This explains the difference between the forebay monitor and the fixed monitor in the river downstream in 1997.
DOperational Alternatives for Total Dissolved Gas Management at Grand Coulee Dam 35

PPM DS ONO
N trogen
Pe,cem
Nitrogen
Sawra6on ~
n L'
e
APRIL MAY JUNE JULY AUG. SEPT. OCT NOV DEC. JAN. FEE. MARCH
Figure 22. - Historical distribution of temperature, dissolved nitrogen concentration, and percent nitrogen saturation in FDR Lake at Pine Tree Point (about 3 miles upstream from the dam) from Seattle Marine Fisheries, 1974. Solid hatch - surface; diagonal hatch - mid; horizontal hatch - bottom
Further investigation of temperature and TDG levels in the reservoir are planned. The forebay monitor was lowered in 1998 to mostly alleviate the problem by having the forebay monitor closer to the withdrawal level. Potential for selective withdrawal from the surface during powerplant releases in the summer months to reduce TDG would produce an undesirable further increase in the water temperature in the river.
Comparison of Spill Methods and the Spill Caps
Any method that passes flow with a submerged release to transfer the TDG levels with no increase is the preferred method of release from the dam. Submerged releases should be made by the following methods:
0. Use the powerplants in generation mode to the limit of the power demand.
► Operate turbines in inefficient zones as appropriate to balance power with total release requirements.
► Use the turbines in speed-no-load mode to spill when power demand has been exceeded and spill is needed.
Not much additional spill may be passed by operating the turbines in inefficient zones or in speed-no-load mode. There will be high runoff seasons, such as 1996
Operational Alternatives for Total Dissolved Gas Management at Grand Coulee Dam 35
I
0
f~l
0
0
H
[7 0

and 1997, when additional spills will be required to draft down the lake or to pass the spring freshet. During those times, when the FDR lake level is above the elevation of the drum gates on the spillway crest, El. 1260, the spillway should be used for required spill volumes. Spillway use has proven to produce less TDG than use of the outlet works. This conclusion is based upon the previous analysis of the existing TDG data for 1996 and 1997 with mixed powerplant and spill releases.
The goal of the TDG analysis was to develop new or verify the existing spill cap information for Grand Coulee Dam. The initial spill cap values for the 1998 season are shown in the following table, with no distinction made between mode of operation, either for the spillway or the outlet works.
Existing 1998 Spill Cap for Percent TDG Management
110 120 125 130 135
Spill (kft3/s) 5 10 20 30 45
However, Reclamation's Grand Coulee Power Office and the COE coordinated spills to use the spillway drum gates whenever possible during 1998 spills.
New spill cap values are separated into spillway or outlet works operation. The spill volumes are based upon fit of equations to the existing field data that is based upon the fully mixed TDG reading at the fixed monitor 6 miles downstream from the dam. Conservative rounding was performed to account for data uncertainties and for simplicity of operation. The outlet works spill cap values are based upon releases being made using the upper- and mid-level outlets in the combined over/under operation mode. Because the outlet works gates must be fully open during use, additional single outlets may need to be open to obtain target spill volumes. This would be the mixed operation as described above and will not significantly effect the TDG levels. erg 4W-A-5 i
The recommended spill cap values for the spillway and outlet works are:
Recommended Spill Cap for Percent TDG Management
110 120 125 130 135
Spillway releases 20 30 75 120 170 (kft3/s)
Outlet works releases 0 10 20 35 55 (kft3/s)
Operational Alternatives for Total Dissolved Gas Management at Grand Coulee Dam 36

As may been seen, when managing for specific levels of TDG, much higher spillway releases can be made than outlet works releases. Unfortunately, the outlet works must be used in high run-off years to evacuate the reservoir when required total releases exceed power demand and other modes of submerged release, and FDR Lake is below the elevation of the spillway crest.
Recent specific spill events were checked against these recommended spill caps to ensure that they are appropriate values. For example, the March 25, 1998, spill event of 56,800 ft3/s with the outlet works produced a maximum TDG value of 136.7 percent at the fixed monitor which would be expected from a spill cap of 55,000 ft3/s for 135 percent TDG.
Summary
Reclamation has initiated a number of short- and long-term actions to reduce gas levels downstream of Grand Coulee Dam in response to regional, state, and tribal concerns regarding TDG levels. Operational alternatives for reducing gas levels were evaluated and gas management operating procedures have been implemented, as described above. A research project has been scoped for the purpose of defining the impacts of Grand Coulee spill operations on native fish in Lake Rufus Woods downstream of Grand Coulee Dam, and the feasibility of structural gas management measures will be evaluated under a two phase study to be completed by the end of the year 2000. Regional coordination of Reclamation's TDG management activities will continue to be conducted within the framework of the NMFS fish forum.
References
[ 1 ] "Dissolved Gas Monitoring at Grand Coulee Dam and Lake Roosevelt," Seattle Marine Laboratories, Seattle WA, 1973.
[2] "Dissolved Gas Supersaturation, Grand Coulee Project, 1973," Seattle Marine Laboratories, Seattle WA, January 1974.
[3] Frizell, Kathleen H., "Dissolved Gas Supersaturation Study for Grand Coulee Dam," U.S. Bureau of Reclamation, PAP-724, Denver CO, March 1996.
[4] Frizell, Kathleen H., "Grand Coulee Dam Dissolved Gas Studies - Release Test Plan," U.S. Bureau of Reclamation, internal memorandum, Denver CO, February 1997.
[5] Frizell, K. H. and T. B. Vermeyen, "Investigative Trip to Grand Coulee Dam Prior to Performing Total Dissolved Gas Tests in the River," U.S. Bureau of Reclamation, TR-97-16, Denver CO, March 1997.
Operational Alternatives for Total Dissolved Gas Management at Grand Coulee Dam 37

j1-
[6] Frizell, K.H., "Grand Coulee Dam Total Dissolved Gas Tests, Outlet Works Test Results, Progress Report," May 1997.
~l [7] Blanton, III, J.O. "Grand Coulee Third Powerplant, Degradation Study," U.S. Bureau of Reclamation, Denver CO, February 1979.
[8] , "Dissolved Gas Abatement Study Phase II Technical Report," U.S. Army Corps of Engineers, Portland and Walla Walla Districts, North Pacific Division, 30% draft, March 1997.
[9] Gulliver, J. S., S. C. Wilhelms, and K. L. Parkhill, "Predictive Capabilities in Oxygen Transfer at Hydraulic Structures," ASCE Journal of Hydraulic Engineering, Vol. 124, No. 7, July, 1998.
[10] Geldert, D. A., J. S. Gulliver, " Dissolved Gas Measurement Uncertainty," Proceedings of the I I' Seminar Water Quality `96, U.S. Army Corps of Engineers Waterways Experiment Station, Seattle, WA, pp. 234-239.
[11] Johnson, P.L., "Prediction of Dissolved Gas at Hydraulic Structures," U.S.
DBureau of Reclamation, GR-8-75, Denver CO, July 1975.
[12] Geldert, D.A., "Parametric Relations to Predict Dissolved Gas Supersaturation Below Spillways," Thesis for Master of Science University of Minnesota, Minneapolis MN, January 1996.
a [13] Hibbs, D.E., J.S. Gulliver, and J.P. McDonald, "Measurement of Effective Saturation Concentration for Gas Transfer," ASCE Journal of Hydraulic Engineering, Vol. 123, No. 2, pp. 86-97, February 1997.
j
Operational Alternatives for Total Dissolved Gas Management at Grand Coulee Dam 38
~LJ