Embed Size (px)
Citation preview
Operating Supplement
Third Quarter 2012
MBIA Inc. and Subsidiaries Quarterly Operating Supplement (1)
(1) This report is unaudited.
Safe Harbor Disclosure 3
Net Premiums Earned, Refundings and Other Accelerations 4
Amortization of Gross Par, Gross Debt Service, Net Unearned Premium and Cash Premiums Collected and Expected 4
Investment Portfolio Including Cash and Cash Equivalents and Secured Loan 5
Insured Portfolio Losses – Loss and Loss Adjustment Expense (LAE) Reserves and Insurance Loss Recoverable 6
Liquidity Position (Current Year and Prior Year) 7
Statutory Balance Sheets Summary, Claims-Paying Resources 8
Insured Portfolio Profile Par Value by Bond Type 9
Insured Portfolio Profile Par Value by Geography 10
Insured Portfolio - 50 Largest Credits Gross Par Outstanding 11
Credit Quality Distribution, Top 10 Below Investment Grade (BIG) Credits 12
Safe Harbor Disclosure
This Operating Supplement includes statements that are not historical or current facts and are “forward-looking statements” made pursuant to the safe harbor provisions of the Private Securities Litigation Reform Act of 1995. The words “believe,” “anticipate,” “project,” “plan,” “expect,” “intend,” “will likely result,” “looking forward” or “will continue,” and similar expressions identify forward-looking statements. These statements are subject to certain risks and uncertainties that could cause actual results to differ materially from historical earnings and those presently anticipated or projected, including, among other risks and uncertainties, uncertainty regarding whether the Company will realize, or will be delayed in realizing, insurance loss recoveries expected in disputes with sellers/servicers of RMBS transactions at the levels recorded in its financial statements, the possibility that the Company will experience severe losses or liquidity needs due to increased deterioration in its insurance portfolios and in particular, due to the performance of CDOs including multi-sector, CMBS and CRE CDOs and RMBS, failure to obtain regulatory approval to implement our risk reduction and liquidity strategies, the possibility that loss reserve estimates are not adequate to cover potential claims, the possibility that MBIA Inc.’s obligations will be accelerated if MBIA Insurance Corporation becomes subject to a rehabilitation or liquidation proceeding, the Company’s ability to access capital and the Company’s exposure to significant fluctuations in liquidity and asset values within the global credit markets, in particular in the ALM business, the Company’s ability to fully implement its strategic plan, including its ability to achieve high stable ratings for National or any other insurance subsidiaries, and the Company’s ability to commute certain of its insured exposures, including as a result of limited available liquidity, the Company’s ability to favorably resolve litigation claims against the Company, and changes in general economic and competitive conditions. These and other factors that could affect financial performance or could cause actual results to differ materially from estimates contained in or underlying the Company’s forward-looking statements are discussed under the “Risk Factors” section in MBIA Inc.’s most recent Annual Report on Form 10-K, which may be updated or amended in the Company’s subsequent filings with the Securities and Exchange Commission. The Company cautions readers not to place undue reliance on any such forward-looking statements, which speak only to their respective dates. The Company undertakes no obligation to publicly correct or update any forward-looking statement if it later becomes aware that such result is not likely to be achieved.
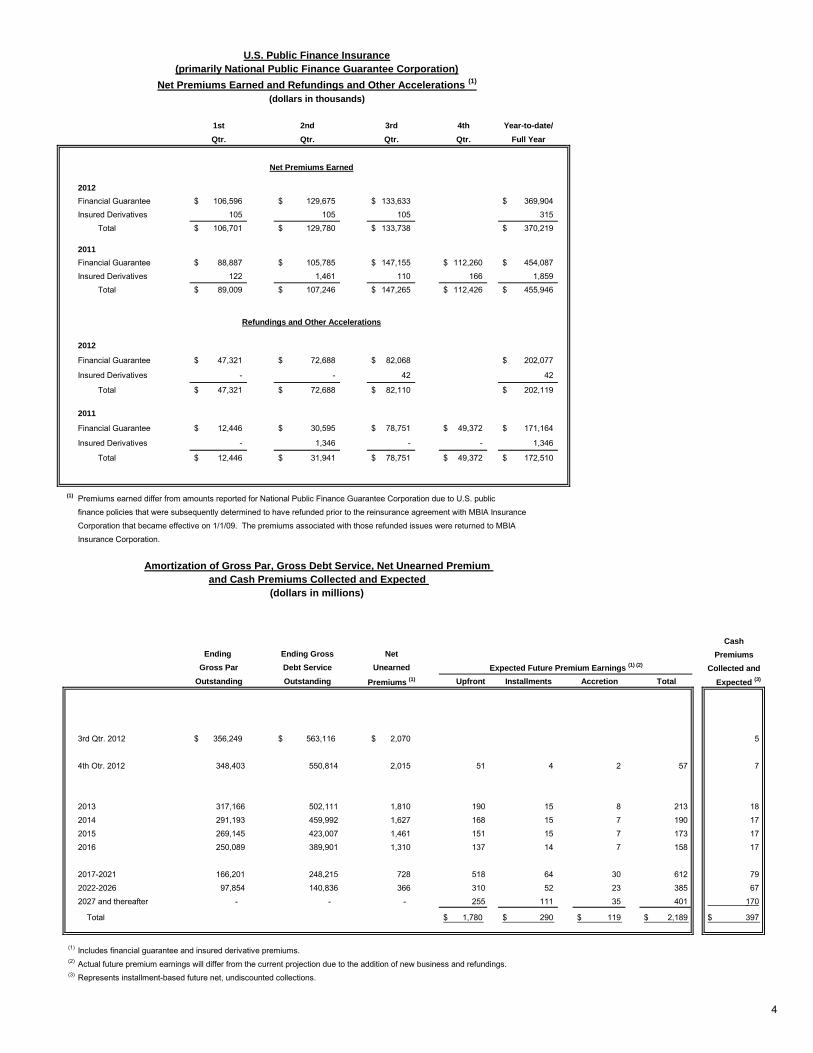
1st 2nd 3rd 4th Year-to-date/
Qtr. Qtr. Qtr. Qtr. Full Year
2012
Financial Guarantee 106,596$ 129,675$ 133,633$ 369,904$
Insured Derivatives 105 105 105 315
Total 106,701$ 129,780$ 133,738$ 370,219$
2011
Financial Guarantee 88,887$ 105,785$ 147,155$ 112,260$ 454,087$
Insured Derivatives 122 1,461 110 166 1,859
Total 89,009$ 107,246$ 147,265$ 112,426$ 455,946$
2012
Financial Guarantee 47,321$ 72,688$ 82,068$ 202,077$
Insured Derivatives - - 42 42
Total 47,321$ 72,688$ 82,110$ 202,119$
2011
Financial Guarantee 12,446$ 30,595$ 78,751$ 49,372$ 171,164$
Insured Derivatives - 1,346 - - 1,346
Total 12,446$ 31,941$ 78,751$ 49,372$ 172,510$
(1) Premiums earned differ from amounts reported for National Public Finance Guarantee Corporation due to U.S. public
finance policies that were subsequently determined to have refunded prior to the reinsurance agreement with MBIA Insurance
Corporation that became effective on 1/1/09. The premiums associated with those refunded issues were returned to MBIA Insurance Corporation.
Cash
Ending Ending Gross Net Premiums
Gross Par Debt Service Unearned Collected and
Outstanding Outstanding Premiums (1) Upfront Installments Accretion Total Expected (3)
3rd Qtr. 2012 356,249$ 563,116$ 2,070$ 5
4th Otr. 2012 348,403 550,814 2,015 51 4 2 57 7
2013 317,166 502,111 1,810 190 15 8 213 18
2014 291,193 459,992 1,627 168 15 7 190 17
2015 269,145 423,007 1,461 151 15 7 173 17
2016 250,089 389,901 1,310 137 14 7 158 17
2017-2021 166,201 248,215 728 518 64 30 612 79
2022-2026 97,854 140,836 366 310 52 23 385 67
2027 and thereafter - - - 255 111 35 401 170
Total 1,780$ 290$ 119$ 2,189$ 397$
(1) Includes financial guarantee and insured derivative premiums.(2) Actual future premium earnings will differ from the current projection due to the addition of new business and refundings. (3) Represents installment-based future net, undiscounted collections.
Refundings and Other Accelerations
(dollars in thousands)
Expected Future Premium Earnings (1) (2)
U.S. Public Finance Insurance
Net Premiums Earned and Refundings and Other Accelerations (1)
(primarily National Public Finance Guarantee Corporation)
(dollars in millions)
Amortization of Gross Par, Gross Debt Service, Net Unearned Premium and Cash Premiums Collected and Expected
Net Premiums Earned
4
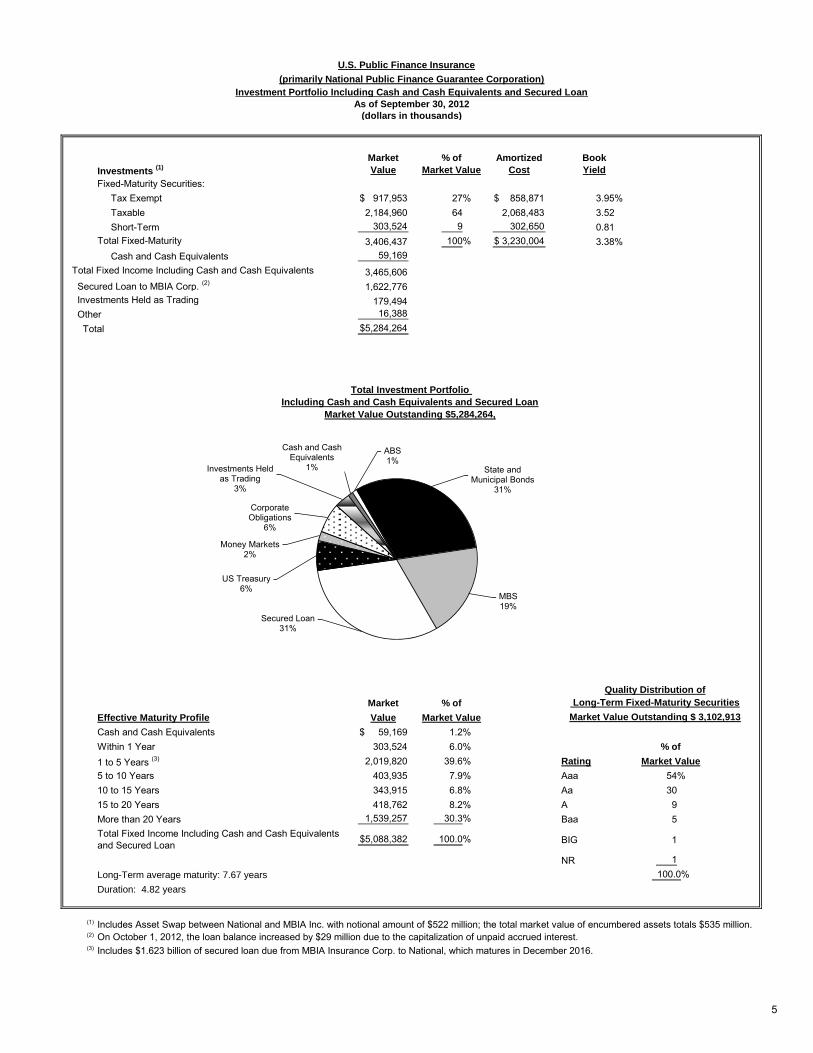
(primarily National Public Finance Guarantee Corporation)Investment Portfolio Including Cash and Cash Equivalents and Secured Loan
As of September 30, 2012(dollars in thousands)
Market % of Amortized BookInvestments (1) Value Market Value Cost YieldFixed-Maturity Securities: Tax Exempt 917,953$ 27% 858,871$ 3.95% Taxable 2,184,960 64 2,068,483 3.52 Short-Term 303,524 9 302,650 0.81
3,406,437 100% 3,230,004$ 3.38% Cash and Cash Equivalents 59,169
3,465,606 Secured Loan to MBIA Corp. (2) 1,622,776 Investments Held as Trading 179,494 Other 16,388 Total 5,284,264$
Market % of
Effective Maturity Profile Value Market Value
Cash and Cash Equivalents 59,169$ 1.2%Within 1 Year 303,524 6.0% % of
1 to 5 Years (3) 2,019,820 39.6% Rating Market Value
5 to 10 Years 403,935 7.9% Aaa 54%10 to 15 Years 343,915 6.8% Aa 3015 to 20 Years 418,762 8.2% A 9More than 20 Years 1,539,257 30.3% Baa 5
5,088,382$ 100.0% BIG 1
NR 1Long-Term average maturity: 7.67 years 100.0%Duration: 4.82 years
(1) Includes Asset Swap between National and MBIA Inc. with notional amount of $522 million; the total market value of encumbered assets totals $535 million.(2)
(3) Includes $1.623 billion of secured loan due from MBIA Insurance Corp. to National, which matures in December 2016.
Total Investment Portfolio Including Cash and Cash Equivalents and Secured Loan
Market Value Outstanding $5,284,264,
Total Fixed-Maturity
Quality Distribution of Long-Term Fixed-Maturity Securities
Total Fixed Income Including Cash and Cash Equivalents
On October 1, 2012, the loan balance increased by $29 million due to the capitalization of unpaid accrued interest.
Total Fixed Income Including Cash and Cash Equivalents and Secured Loan
U.S. Public Finance Insurance
Market Value Outstanding $ 3,102,913
State and Municipal Bonds
31%
MBS 19%
Secured Loan 31%
US Treasury 6%
Money Markets 2%
Corporate Obligations
6%
Investments Held as Trading
3%
Cash and Cash Equivalents
1%
ABS 1%
5
(dollars in millions)
1st 2nd 3rd 4th 2012 Qtr. Qtr. Qtr. Qtr. Year-to-date
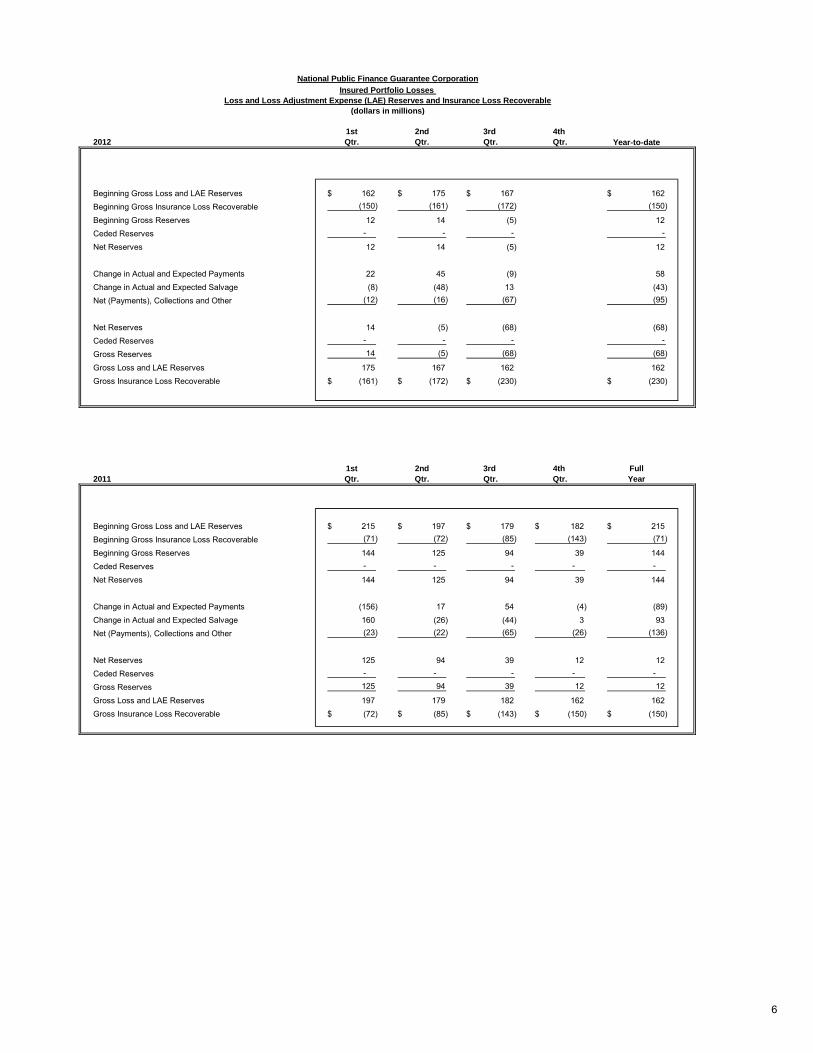
Beginning Gross Loss and LAE Reserves 162$ 175$ 167$ 162$ Beginning Gross Insurance Loss Recoverable (150) (161) (172) (150)
Beginning Gross Reserves 12 14 (5) 12 Ceded Reserves - - - -
Net Reserves 12 14 (5) 12
Change in Actual and Expected Payments 22 45 (9) 58 Change in Actual and Expected Salvage (8) (48) 13 (43) Net (Payments), Collections and Other (12) (16) (67) (95)
Net Reserves 14 (5) (68) (68) Ceded Reserves - - - -
Gross Reserves 14 (5) (68) (68)
Gross Loss and LAE Reserves 175 167 162 162 Gross Insurance Loss Recoverable (161)$ (172)$ (230)$ (230)$
1st 2nd 3rd 4th Full2011 Qtr. Qtr. Qtr. Qtr. Year
Beginning Gross Loss and LAE Reserves 215$ 197$ 179$ 182$ 215$ Beginning Gross Insurance Loss Recoverable (71) (72) (85) (143) (71)
Beginning Gross Reserves 144 125 94 39 144 Ceded Reserves - - - - -
Net Reserves 144 125 94 39 144
Change in Actual and Expected Payments (156) 17 54 (4) (89) Change in Actual and Expected Salvage 160 (26) (44) 3 93 Net (Payments), Collections and Other (23) (22) (65) (26) (136)
Net Reserves 125 94 39 12 12 Ceded Reserves - - - - -
Gross Reserves 125 94 39 12 12
Gross Loss and LAE Reserves 197 179 182 162 162 Gross Insurance Loss Recoverable (72)$ (85)$ (143)$ (150)$ (150)$
National Public Finance Guarantee Corporation
Loss and Loss Adjustment Expense (LAE) Reserves and Insurance Loss RecoverableInsured Portfolio Losses
6
(dollars in millions)
1st 2nd 3rd 4th 2012 Qtr. Qtr. Qtr. Qtr. Year-to-date
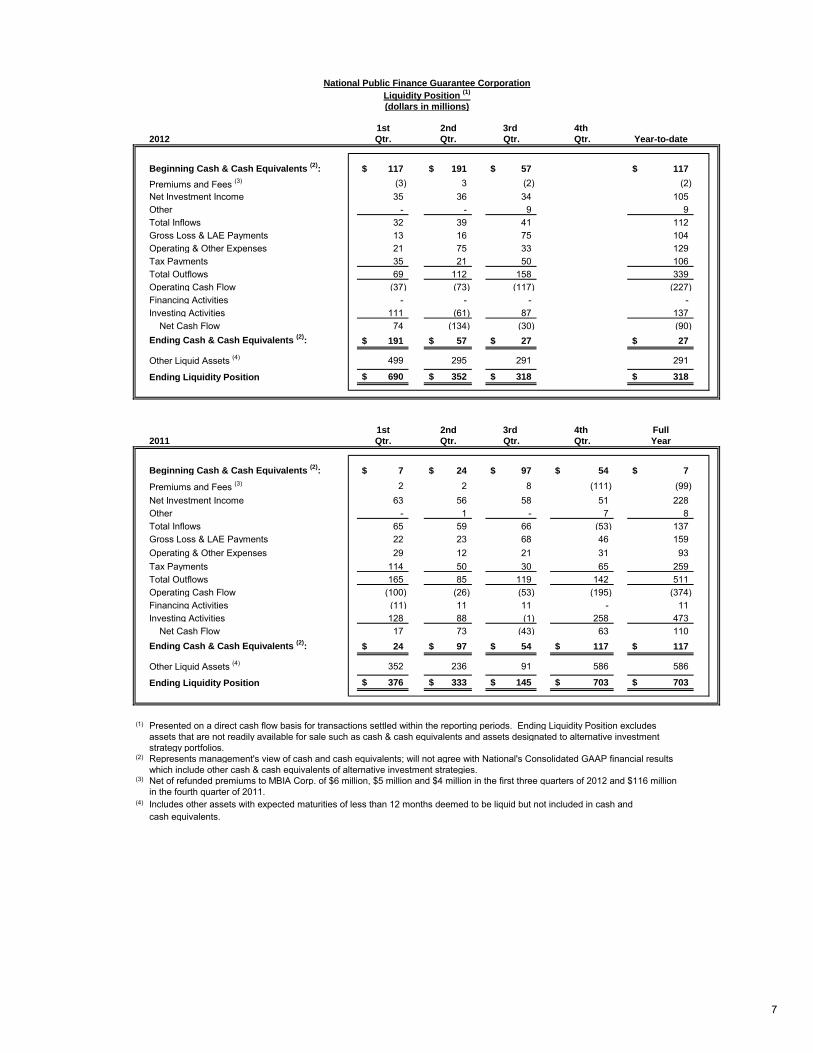
Beginning Cash & Cash Equivalents (2): 117$ 191$ 57$ 117$
Premiums and Fees (3) (3) 3 (2) (2) Net Investment Income 35 36 34 105 Other - - 9 9 Total Inflows 32 39 41 112 Gross Loss & LAE Payments 13 16 75 104 Operating & Other Expenses 21 75 33 129 Tax Payments 35 21 50 106 Total Outflows 69 112 158 339 Operating Cash Flow (37) (73) (117) (227) Financing Activities - - - - Investing Activities 111 (61) 87 137 Net Cash Flow 74 (134) (30) (90) Ending Cash & Cash Equivalents (2): 191$ 57$ 27$ 27$
Other Liquid Assets (4) 499 295 291 291
Ending Liquidity Position 690$ 352$ 318$ 318$
1st 2nd 3rd 4th Full2011 Qtr. Qtr. Qtr. Qtr. Year
Beginning Cash & Cash Equivalents (2): 7$ 24$ 97$ 54$ 7$
Premiums and Fees (3) 2 2 8 (111) (99) Net Investment Income 63 56 58 51 228 Other - 1 - 7 8 Total Inflows 65 59 66 (53) 137 Gross Loss & LAE Payments 22 23 68 46 159 Operating & Other Expenses 29 12 21 31 93 Tax Payments 114 50 30 65 259 Total Outflows 165 85 119 142 511 Operating Cash Flow (100) (26) (53) (195) (374) Financing Activities (11) 11 11 - 11 Investing Activities 128 88 (1) 258 473 Net Cash Flow 17 73 (43) 63 110 Ending Cash & Cash Equivalents (2): 24$ 97$ 54$ 117$ 117$
Other Liquid Assets (4) 352 236 91 586 586
Ending Liquidity Position 376$ 333$ 145$ 703$ 703$
(1)
strategy portfolios.(2)
(3)
in the fourth quarter of 2011.(4)
cash equivalents.Includes other assets with expected maturities of less than 12 months deemed to be liquid but not included in cash and
Represents management's view of cash and cash equivalents; will not agree with National's Consolidated GAAP financial results which include other cash & cash equivalents of alternative investment strategies.
National Public Finance Guarantee CorporationLiquidity Position (1)
Presented on a direct cash flow basis for transactions settled within the reporting periods. Ending Liquidity Position excludesassets that are not readily available for sale such as cash & cash equivalents and assets designated to alternative investment
Net of refunded premiums to MBIA Corp. of $6 million, $5 million and $4 million in the first three quarters of 2012 and $116 million
7
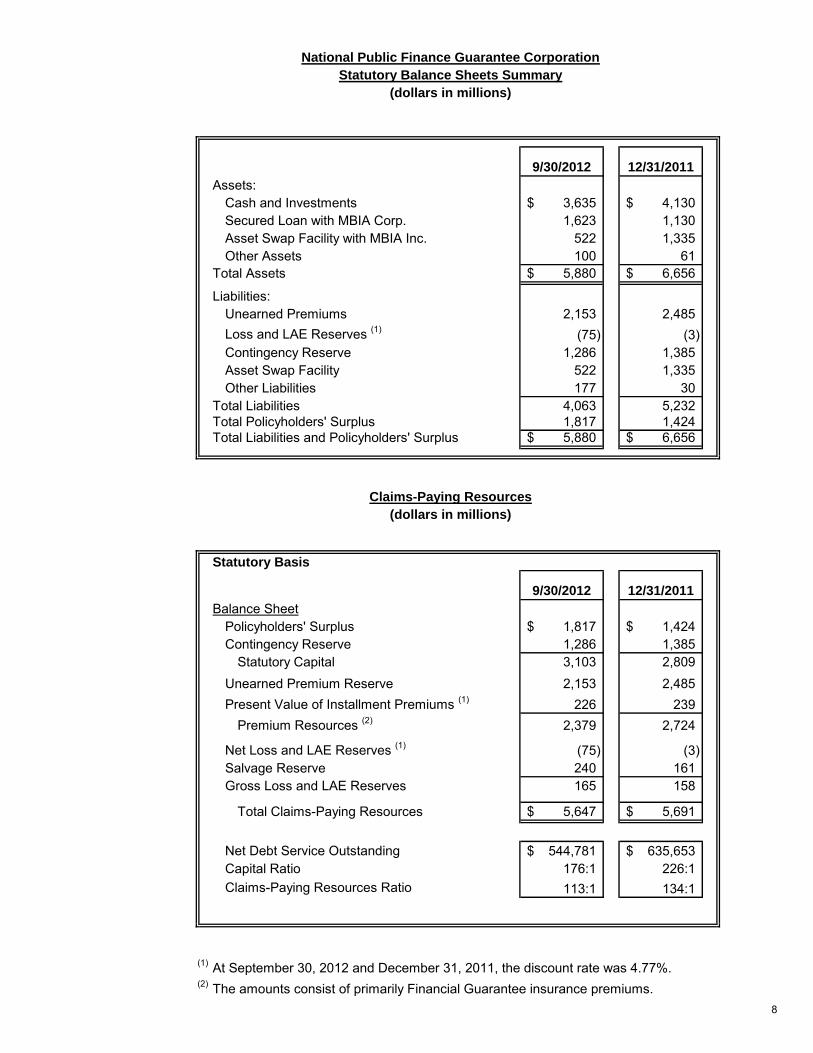
National Public Finance Guarantee CorporationStatutory Balance Sheets Summary
(dollars in millions)
9/30/2012 12/31/2011Assets:
Cash and Investments 3,635$ 4,130$ Secured Loan with MBIA Corp. 1,623 1,130 Asset Swap Facility with MBIA Inc. 522 1,335 Other Assets 100 61
Total Assets 5,880$ 6,656$
Liabilities:Unearned Premiums 2,153 2,485 Loss and LAE Reserves (1) (75) (3) Contingency Reserve 1,286 1,385 Asset Swap Facility 522 1,335 Other Liabilities 177 30
Total Liabilities 4,063 5,232 Total Policyholders' Surplus 1,817 1,424 Total Liabilities and Policyholders' Surplus 5,880$ 6,656$
Claims-Paying Resources(dollars in millions)
Statutory Basis
9/30/2012 12/31/2011Balance Sheet
Policyholders' Surplus 1,817$ 1,424$ Contingency Reserve 1,286 1,385
Statutory Capital 3,103 2,809 Unearned Premium Reserve 2,153 2,485 Present Value of Installment Premiums (1) 226 239
Premium Resources (2) 2,379 2,724
Net Loss and LAE Reserves (1) (75) (3) Salvage Reserve 240 161 Gross Loss and LAE Reserves 165 158
Total Claims-Paying Resources 5,647$ 5,691$
Net Debt Service Outstanding 544,781$ 635,653$ Capital Ratio 176:1 226:1Claims-Paying Resources Ratio 113:1 134:1
(1) At September 30, 2012 and December 31, 2011, the discount rate was 4.77%.(2) The amounts consist of primarily Financial Guarantee insurance premiums.
8
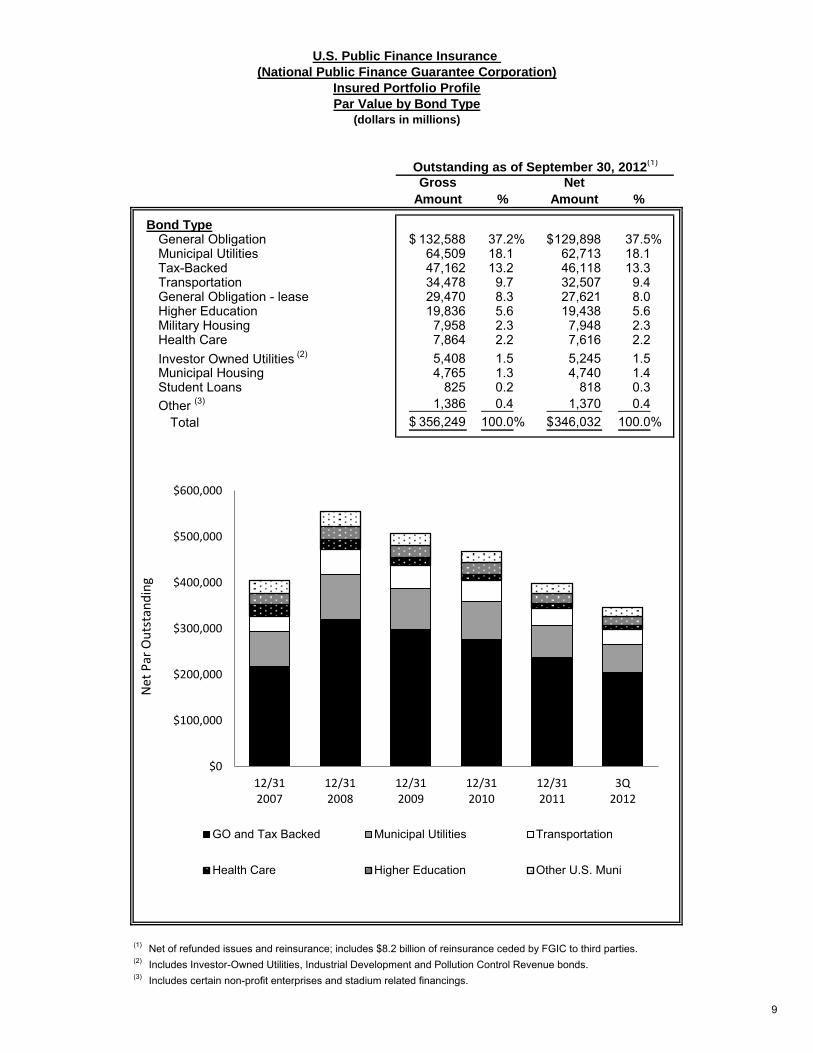
U.S. Public Finance Insurance (National Public Finance Guarantee Corporation)
Insured Portfolio ProfilePar Value by Bond Type
(dollars in millions)
Gross NetAmount % Amount %
Bond TypeGeneral Obligation 132,588$ 37.2% 129,898$ 37.5%Municipal Utilities 64,509 18.1 62,713 18.1Tax-Backed 47,162 13.2 46,118 13.3Transportation 34,478 9.7 32,507 9.4General Obligation - lease 29,470 8.3 27,621 8.0Higher Education 19,836 5.6 19,438 5.6Military Housing 7,958 2.3 7,948 2.3Health Care 7,864 2.2 7,616 2.2Investor Owned Utilities (2) 5,408 1.5 5,245 1.5Municipal Housing 4,765 1.3 4,740 1.4Student Loans 825 0.2 818 0.3Other (3) 1,386 0.4 1,370 0.4
Total 356,249$ 100.0% 346,032$ 100.0%
(1) Net of refunded issues and reinsurance; includes $8.2 billion of reinsurance ceded by FGIC to third parties.(2) Includes Investor-Owned Utilities, Industrial Development and Pollution Control Revenue bonds.(3) Includes certain non-profit enterprises and stadium related financings.
Outstanding as of September 30, 2012(1)
$0
$100,000
$200,000
$300,000
$400,000
$500,000
$600,000
12/312007
12/312008
12/312009
12/312010
12/312011
3Q2012
GO and Tax Backed Municipal Utilities Transportation
Health Care Higher Education Other U.S. Muni
Net
Par
Ou
tsta
nd
ing
9
U.S. Public Finance Insurance (National Public Finance Guarantee Corporation)
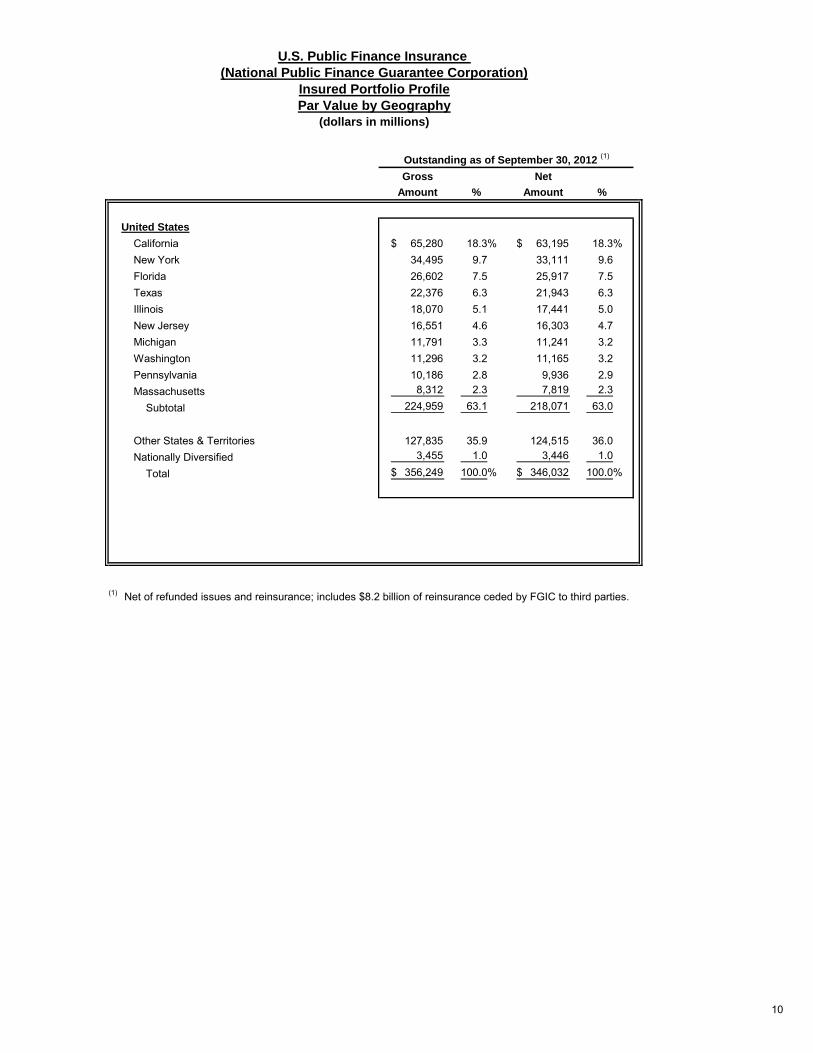
Insured Portfolio ProfilePar Value by Geography
(dollars in millions)
Gross NetAmount % Amount %
United States
California 65,280$ 18.3% 63,195$ 18.3%New York 34,495 9.7 33,111 9.6Florida 26,602 7.5 25,917 7.5Texas 22,376 6.3 21,943 6.3Illinois 18,070 5.1 17,441 5.0New Jersey 16,551 4.6 16,303 4.7Michigan 11,791 3.3 11,241 3.2Washington 11,296 3.2 11,165 3.2Pennsylvania 10,186 2.8 9,936 2.9Massachusetts 8,312 2.3 7,819 2.3
Subtotal 224,959 63.1 218,071 63.0
Other States & Territories 127,835 35.9 124,515 36.0Nationally Diversified 3,455 1.0 3,446 1.0
Total 356,249$ 100.0% 346,032$ 100.0%
(1) Net of refunded issues and reinsurance; includes $8.2 billion of reinsurance ceded by FGIC to third parties.
Outstanding as of September 30, 2012 (1)
10
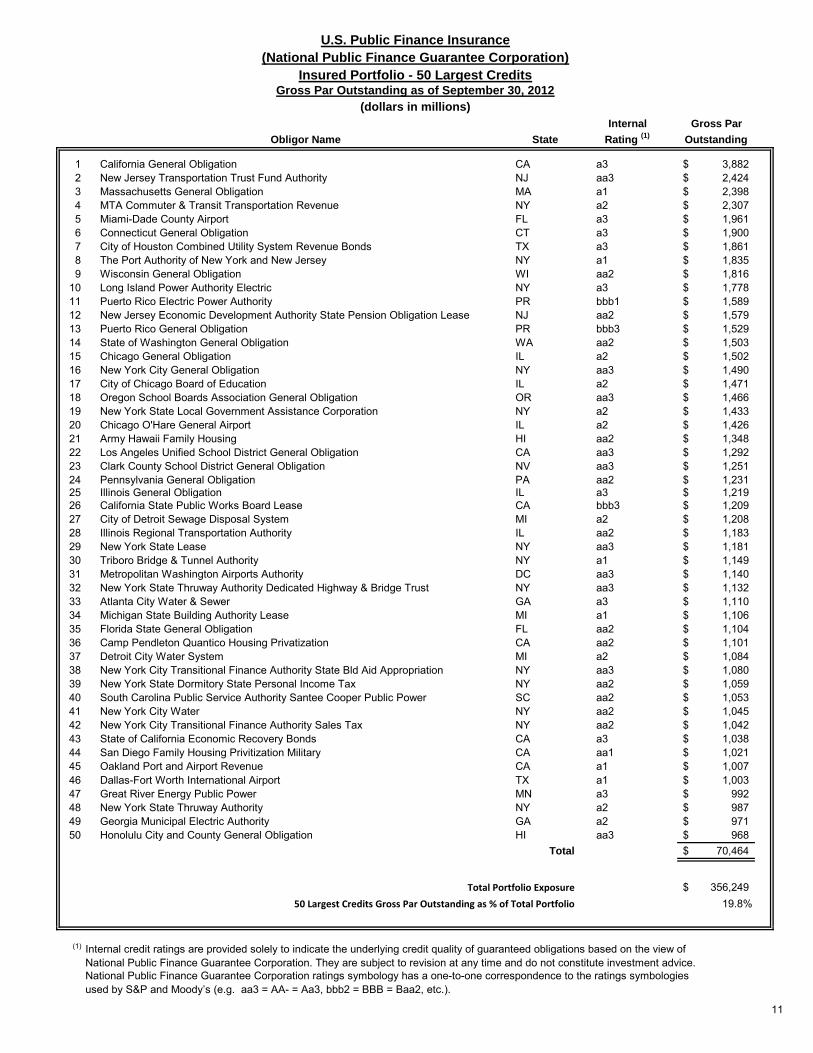
(National Public Finance Guarantee Corporation)Insured Portfolio - 50 Largest Credits
Gross Par Outstanding as of September 30, 2012(dollars in millions)
Internal Gross Par
Obligor Name State Rating (1) Outstanding
1 California General Obligation CA a3 3,882$ 2 New Jersey Transportation Trust Fund Authority NJ aa3 2,424$ 3 Massachusetts General Obligation MA a1 2,398$ 4 MTA Commuter & Transit Transportation Revenue NY a2 2,307$ 5 Miami-Dade County Airport FL a3 1,961$ 6 Connecticut General Obligation CT a3 1,900$ 7 City of Houston Combined Utility System Revenue Bonds TX a3 1,861$ 8 The Port Authority of New York and New Jersey NY a1 1,835$ 9 Wisconsin General Obligation WI aa2 1,816$
10 Long Island Power Authority Electric NY a3 1,778$ 11 Puerto Rico Electric Power Authority PR bbb1 1,589$ 12 New Jersey Economic Development Authority State Pension Obligation Lease NJ aa2 1,579$ 13 Puerto Rico General Obligation PR bbb3 1,529$ 14 State of Washington General Obligation WA aa2 1,503$ 15 Chicago General Obligation IL a2 1,502$ 16 New York City General Obligation NY aa3 1,490$ 17 City of Chicago Board of Education IL a2 1,471$ 18 Oregon School Boards Association General Obligation OR aa3 1,466$ 19 New York State Local Government Assistance Corporation NY a2 1,433$ 20 Chicago O'Hare General Airport IL a2 1,426$ 21 Army Hawaii Family Housing HI aa2 1,348$ 22 Los Angeles Unified School District General Obligation CA aa3 1,292$ 23 Clark County School District General Obligation NV aa3 1,251$ 24 Pennsylvania General Obligation PA aa2 1,231$ 25 Illinois General Obligation IL a3 1,219$ 26 California State Public Works Board Lease CA bbb3 1,209$ 27 City of Detroit Sewage Disposal System MI a2 1,208$ 28 Illinois Regional Transportation Authority IL aa2 1,183$ 29 New York State Lease NY aa3 1,181$ 30 Triboro Bridge & Tunnel Authority NY a1 1,149$ 31 Metropolitan Washington Airports Authority DC aa3 1,140$ 32 New York State Thruway Authority Dedicated Highway & Bridge Trust NY aa3 1,132$ 33 Atlanta City Water & Sewer GA a3 1,110$ 34 Michigan State Building Authority Lease MI a1 1,106$ 35 Florida State General Obligation FL aa2 1,104$ 36 Camp Pendleton Quantico Housing Privatization CA aa2 1,101$ 37 Detroit City Water System MI a2 1,084$ 38 New York City Transitional Finance Authority State Bld Aid Appropriation NY aa3 1,080$ 39 New York State Dormitory State Personal Income Tax NY aa2 1,059$ 40 South Carolina Public Service Authority Santee Cooper Public Power SC aa2 1,053$ 41 New York City Water NY aa2 1,045$ 42 New York City Transitional Finance Authority Sales Tax NY aa2 1,042$ 43 State of California Economic Recovery Bonds CA a3 1,038$ 44 San Diego Family Housing Privitization Military CA aa1 1,021$ 45 Oakland Port and Airport Revenue CA a1 1,007$ 46 Dallas-Fort Worth International Airport TX a1 1,003$ 47 Great River Energy Public Power MN a3 992$ 48 New York State Thruway Authority NY a2 987$ 49 Georgia Municipal Electric Authority GA a2 971$ 50 Honolulu City and County General Obligation HI aa3 968$
Total 70,464$
Total Portfolio Exposure 356,249$ 50 Largest Credits Gross Par Outstanding as % of Total Portfolio 19.8%
(1) Internal credit ratings are provided solely to indicate the underlying credit quality of guaranteed obligations based on the view of National Public Finance Guarantee Corporation. They are subject to revision at any time and do not constitute investment advice. National Public Finance Guarantee Corporation ratings symbology has a one-to-one correspondence to the ratings symbologiesused by S&P and Moody’s (e.g. aa3 = AA- = Aa3, bbb2 = BBB = Baa2, etc.).
U.S. Public Finance Insurance
11
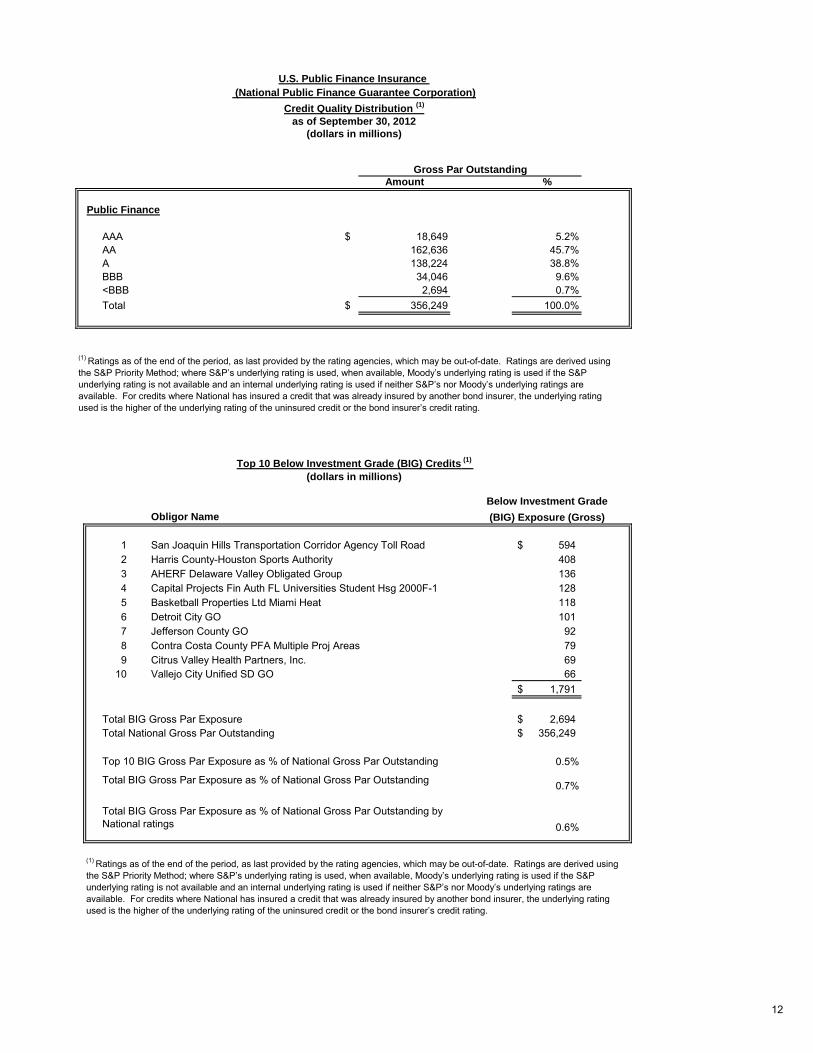
Amount %
Public Finance
AAA $ 18,649 5.2%AA 162,636 45.7%A 138,224 38.8%BBB 34,046 9.6%<BBB 2,694 0.7%Total $ 356,249 100.0%
Below Investment Grade
Obligor Name (BIG) Exposure (Gross)
1 San Joaquin Hills Transportation Corridor Agency Toll Road 594$ 2 Harris County-Houston Sports Authority 408 3 AHERF Delaware Valley Obligated Group 136 4 Capital Projects Fin Auth FL Universities Student Hsg 2000F-1 128 5 Basketball Properties Ltd Miami Heat 118 6 Detroit City GO 101 7 Jefferson County GO 92 8 Contra Costa County PFA Multiple Proj Areas 79 9 Citrus Valley Health Partners, Inc. 69
10 Vallejo City Unified SD GO 66 1,791$
Total BIG Gross Par Exposure 2,694$ Total National Gross Par Outstanding 356,249$
Top 10 BIG Gross Par Exposure as % of National Gross Par Outstanding 0.5%
0.7%
0.6%
U.S. Public Finance Insurance
as of September 30, 2012(dollars in millions)
Credit Quality Distribution (1)
(National Public Finance Guarantee Corporation)
Gross Par Outstanding
(1) Ratings as of the end of the period, as last provided by the rating agencies, which may be out-of-date. Ratings are derived using the S&P Priority Method; where S&P’s underlying rating is used, when available, Moody’s underlying rating is used if the S&P
underlying rating is not available and an internal underlying rating is used if neither S&P’s nor Moody’s underlying ratings are
available. For credits where National has insured a credit that was already insured by another bond insurer, the underlying rating used is the higher of the underlying rating of the uninsured credit or the bond insurer’s credit rating.
Top 10 Below Investment Grade (BIG) Credits (1)
(1) Ratings as of the end of the period, as last provided by the rating agencies, which may be out-of-date. Ratings are derived using the S&P Priority Method; where S&P’s underlying rating is used, when available, Moody’s underlying rating is used if the S&P
underlying rating is not available and an internal underlying rating is used if neither S&P’s nor Moody’s underlying ratings are
available. For credits where National has insured a credit that was already insured by another bond insurer, the underlying rating used is the higher of the underlying rating of the uninsured credit or the bond insurer’s credit rating.
Total BIG Gross Par Exposure as % of National Gross Par Outstanding
Total BIG Gross Par Exposure as % of National Gross Par Outstanding by National ratings
(dollars in millions)
12
Investor Relations Contacts Chris Young Managing Director Chief Financial Officer (914) 765-3121 [email protected]
Nick Sourbis Managing Director Fixed Income Investor Relations (914) 765-3385 [email protected]


![Item-06-AI0000030418€¦ · ^E Á } v µ ] } v _ µ ] o ] v P W u ] Data 1st Qtr 2016 2nd Qtr 2016 3rd Qtr 2016 4th Qtr 2016 1st Qtr 2017 Permits $ Value Permits $ Value Permits](https://img.pdfslide.us/doc/110x75/5fcb107d1e181d01d75aae23/item-06-ai0000030418-e-v-v-o-v-p-w-u-data-1st-qtr-2016-2nd.jpg)