Embed Size (px)
Citation preview

Draft for Discussion & Policy Purposes Only
Operating Budget Stability
Report to Fiscal and Management Control Board
March FY16 YTD Financial Update

Fiscal and Management Control Board
2
Draft for Discussion & Policy Purposes Only
Agenda
• Executive Summary
• March FY16 YTD Performance Against FY16 Budget
• March FY16 YTD Performance Against Same Period Last Year
• Appendix
─ Financial Detail: March FY16 YTD Performance Against FY16 Budget and Recast
─ Financial Detail: March FY16 YTD Performance Against Same Period Last Year
─ Revenue Detail: Own-Source, Fare Collection and Sales Tax
Fiscal and Management Control Board
3
Draft for Discussion & Policy Purposes Only
• Structural deficit is 45% ($78M) below budget and 39% ($62M) below FY15 YTD
• March has maintained a low rate of operating expense growth at -0.4% YTD compared with FY15
─ Operating expense controlled by active management of employee costs (5% below budget) and Materials & Services expenses (15% below budget)
• Own-Source revenues are up 43% ($12.4M) over FY15 YTD
Executive Summary

Fiscal and Management Control Board
4
Draft for Discussion & Policy Purposes Only
Agenda
• Executive Summary
• March FY16 YTD Performance Against FY16 Budget
• March FY16 YTD Performance Against Same Period Last Year
• Appendix
─ Financial Detail: March FY16 YTD Performance Against FY16 Budget and Recast
─ Financial Detail: March FY16 YTD Performance Against Same Period Last Year
─ Revenue Detail: Own-Source, Fare Collection and Sales Tax

Fiscal and Management Control Board
5
Draft for Discussion & Policy Purposes Only
Structural deficit has been reduced by 45.1% ($78.1M) YTD
March FY16 YTD Performance Against FY16 Budget
MARCH FY16 YTD PERFORMANCE AGAINST FY16 BUDGET
($M)FY16 YTDBUDGET
FY16 YTD ACTUAL
$VARIANCE
%VARIANCE
REV
ENU
ES Operating Revenues $498.1 $504.0 $6.0 1.2%Non-Operating Revenues $844.8 $841.5 ($3.2) (0.4%)
Total Revenues $1,342.8 $1,345.6 $2.8 0.2%
EXP
ENS
ES
Wages, Benefits and Payroll Taxes $577.0 $549.4 ($27.7) (4.8%)
Non-Wage $597.9 $558.2 ($39.7) (6.6%)Operating Expenses $1,174.9 $1,107.6 ($67.3) (5.7%)
Debt Service $341.3 $333.3 ($8.1) (2.4%)
Total Expenses $1,516.2 $1,440.8 ($75.4) (5.0%)
Structural Deficit ($173.4) ($95.3) $78.1 (45.1%)
Fare Recovery Ratio 39% 42%Note: March structural deficit higher than year-end deficit due to timing of incurred revenues and expenses; Still on track to hit target FY16 recast

Fiscal and Management Control Board
6
Draft for Discussion & Policy Purposes Only
Structural deficit has been reduced by $78M YTD
March FY16 YTD Performance Against FY16 Budget
Source: MBTA Internal Data. Analysis above excludes revenue from monthly FY16 Additional Assistance payments (forecast at $187M for full FY16).
$0M
$50M
$100M
$150M
$200M
FY16 YTD Budget
(9 months)
$173.4M
Cost control
-$67.3M
Revenue
Expansion
-$2.8M
Debt Service
-$8.1M
FY16 YTD Actual
(9 months)
$95.3M
YTD Improvement of $78M
March FY16 YTD Budget to Actual Structural Deficit
YTD Improvement of $78M

Fiscal and Management Control Board
7
Draft for Discussion & Policy Purposes Only
Revenues have exceeded budget by 0.2% ($2.8M), driven by Own-Source growth
March FY16 YTD Performance Against FY16 Budget
$0M
$100M
$200M
$300M
$400M
$500M
$600M
$700M
Fare Revenue
463 463
Own-Source
Revenue
35 41
Sales Tax
740 741
Local
Assessments
81 81
Other Income
24 20
$0.1M $5.9M $0.8M $0.0M -$4.0M $2.8M$ Variance
0.0% 16.6% 0.1% 0.0% -17.1% 0.2%% Variance
Total Revenues - Budget vs. Actual Comparison
FY16 YTD Budget (9 months)FY16 YTD Actual (9 months)
Source: MBTA Internal Data
Total

Fiscal and Management Control Board
8
Draft for Discussion & Policy Purposes Only
Operating expenses are under budget by 5.7% ($67.3M), due to decreases across the Authority
March FY16 YTD Performance Against FY16 Budget
$0M
$100M
$200M
$300M
$400M
Operating Expense (Excluding Debt Service) Budget vs. Actual Comparison
Wages & OT
385 372
Other
Employee
Costs
193 178
Materials,
Supplies &
Services
203173
Commuter
Rail
285 284
The RIDE &
Local Service
93 87
Financial &
Insurance
16 15
-$12.7M -$15.0M -$30.4M -$1.3M -$6.6M -$1.5M -$67.3M$ Variance
-3.3% -7.8% -14.9% -0.4% -7.0% -9.1% -5.7%% Variance
FY16 YTD Budget (9 months)FY16 YTD Actual (9 months)
Note: Lower energy costs contributed $15.5M of the $67.3M operating expense positive variance against budget ($5.4M CR fuel; $3.4M bus fuel; $6.7M power/utilities).Source: MBTA Internal Data
Total

Fiscal and Management Control Board
9
Draft for Discussion & Policy Purposes Only
Agenda
• Executive Summary
• March FY16 YTD Performance Against FY16 Budget
• March FY16 YTD Performance Against Same Period Last Year
• Appendix
─ Financial Detail: March FY16 YTD Performance Against FY16 Budget and Recast
─ Financial Detail: March FY16 YTD Performance Against Same Period Last Year
─ Revenue Detail: Own-Source, Fare Collection and Sales Tax

Fiscal and Management Control Board
10
Draft for Discussion & Policy Purposes Only
Structural deficit is down 39.3% ($61.6M) YTD from FY15
March FY16 YTD Performance Against Same Period Last Year
MARCH FY16 YTD PERFORMANCE AGAINST SAME PERIOD LAST YEAR
($M)FY15 YTD ACTUAL
FY16 YTD ACTUAL
$VARIANCE
%VARIANCE
REV
ENU
ES Operating Revenues $483.3 $504.0 $20.8 4.3%Non-Operating Revenues $796.0 $841.5 $45.5 5.7%
Total Revenues $1,279.3 $1,345.6 $66.3 5.2%
EXP
ENS
ES
Wages, Benefits and Payroll Taxes $545.1 $549.4 $4.3 0.8%
Non-Wage $567.3 $558.2 ($9.1) (1.6%)Operating Expenses $1,112.4 $1,107.6 ($4.8) (0.4%)
Debt Service $323.7 $333.3 $9.5 2.9%
Total Expenses $1,436.1 $1,440.8 $4.7 0.3%
Structural Deficit ($156.8) ($95.3) $61.6 (39.3%)
Fare Recovery Ratio 41% 42%Note: March structural deficit higher than year-end deficit due to timing of incurred revenues and expenses; MBTA still on track to hit target FY16 recast

Fiscal and Management Control Board
11
Draft for Discussion & Policy Purposes Only
Total revenue has increased 5.2% ($66.3M) YTD
Revenue—March FY16 YTD Performance Against Same Period Last Year
$0M
$200M
$400M
$600M
$800M
Total Revenue - FY16 YTD vs. FY15 YTD
Sales Tax
708 741
Fare Revenue
454 463
Local
Assessments
82 81
Own-Source
29 41
Other Income*
6 20
$8.3M$32.9M -$0.8M $12.4M $13.4M $66.3M $ Change
1.8%4.7% -1.0% 43.1% 218.8% 5.2% % Change
FY15 YTD Actual (9 months)FY16 YTD Actual (9 months)
*GLX Mitigation income from Mass DOTSource: MBTA Internal Data
Total

Fiscal and Management Control Board
12
Draft for Discussion & Policy Purposes Only
Own-Source revenue is up 39.8% ($11.7M) YTD due to advertising and recurring real estate
Revenue—March FY16 YTD Performance Against Same Period Last Year
$0M
$5M
$10M
$15M
Own-Source Revenue - FY16 YTD vs. FY15 YTD
Advertising
11
15
Parking
8
13
Recurring Real Estate
9
13
$3.9M $5.1M $3.3M $12.3M $ Change35.1% 61.4% 35.1% 42.7% % Change
FY15 YTD Actual (9 months)FY16 YTD Actual (9 months)
Note: Parking booked a large snow removal charge in March 2015 causing a large gap between FY15 and FY16Source: MBTA Internal Data
Total

Fiscal and Management Control Board
13
Draft for Discussion & Policy Purposes Only
Operating expense growth near zero over first 9 months
Operating Expense—March FY16 YTD Performance Against Same Period Last Year
$0M
$250M
$500M
$750M
$1,000M
$1,250M
Operating Expense (Excluding Debt Service)
FY15 YTD Actual (9 months)
$1,112M
FY16 YTD Actual (9 months)
$1,108M
Year-on-year growth rate:
-0.4% Year-on-year growth rate:
-0.4%
Source: MBTA Internal Data

Fiscal and Management Control Board
14
Draft for Discussion & Policy Purposes Only
Total Expenses (Including Debt Service) up 0.3% ($4.8M) YTD
Operating Expense—March FY16 YTD Performance Against Same Period Last Year
$0M
$200M
$400M
$600M
Total Expenses (Including Debt Service) - FY16 YTD vs. FY15 YTD
Wages &
Benefits
545 549
Materials &
Services
185 173
Keolis
291 284
The Ride &
Local
Service
77 87
Insurance
and Financial
Svcs.
14 15
Debt Service
324 333
$4.3M -$11.9M -$7.5M $9.7M $0.7M $9.5M $4.8M$ Change
0.8% -6.5% -2.6% 12.6% 5.0% 2.9% 0.3%% Change
FY15 YTD Actual (9 months)FY16 YTD Actual (9 months)
Total
Source: MBTA Internal Data
Fiscal and Management Control Board
15
Draft for Discussion & Policy Purposes Only
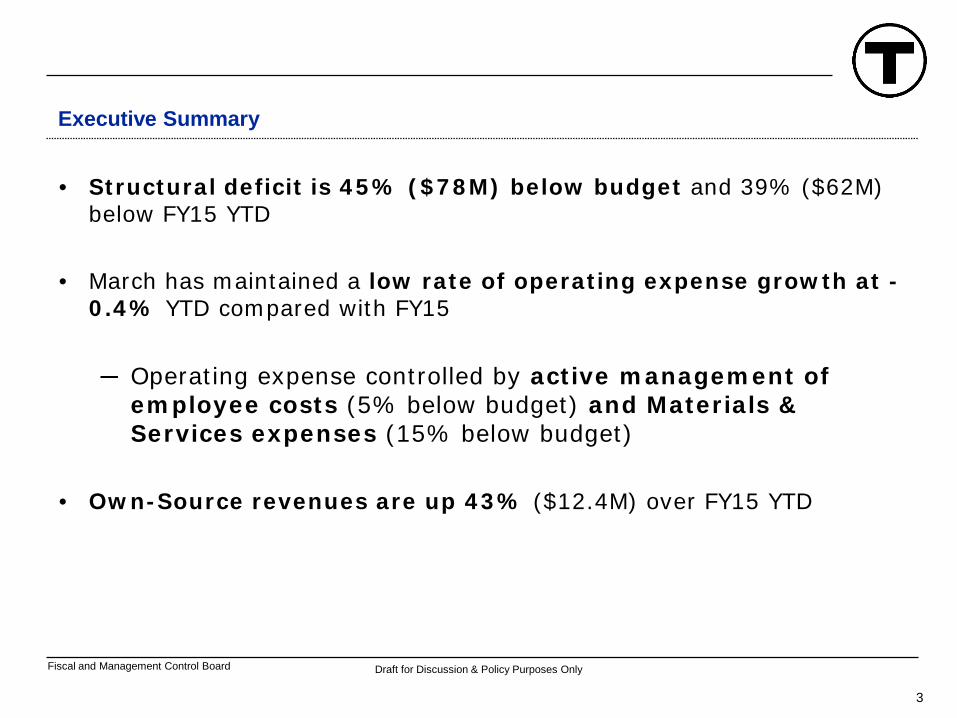
Employee costs up 0.8% ($4.3M) YTD, with wage increases offset by lower overtime
Operating Expense—March FY16 YTD Performance Against Same Period Last Year
Source: MBTA Internal Data
$0M
$100M
$200M
$300M
$400M
Total Employee Costs - FY16 YTD vs. FY15 YTD
Wages
329339
Overtime
42 33
Pension and
Other Fringe
146149
Payroll
Taxes
28 28
$9.9M -$8.5M $2.8M $0.1M $4.3M$ Change
3.0% -20.5% 1.9% 0.5% 0.8%% Change
FY15 YTD Actual (9 months)FY16 YTD Actual (9 months)
Change inemployee costs $4.3M
Wages $9.9M
Overtime ($8.5M)
Fringe expense $2.8M
Payroll taxes $0.1M
Total
Fiscal and Management Control Board
16
Draft for Discussion & Policy Purposes Only
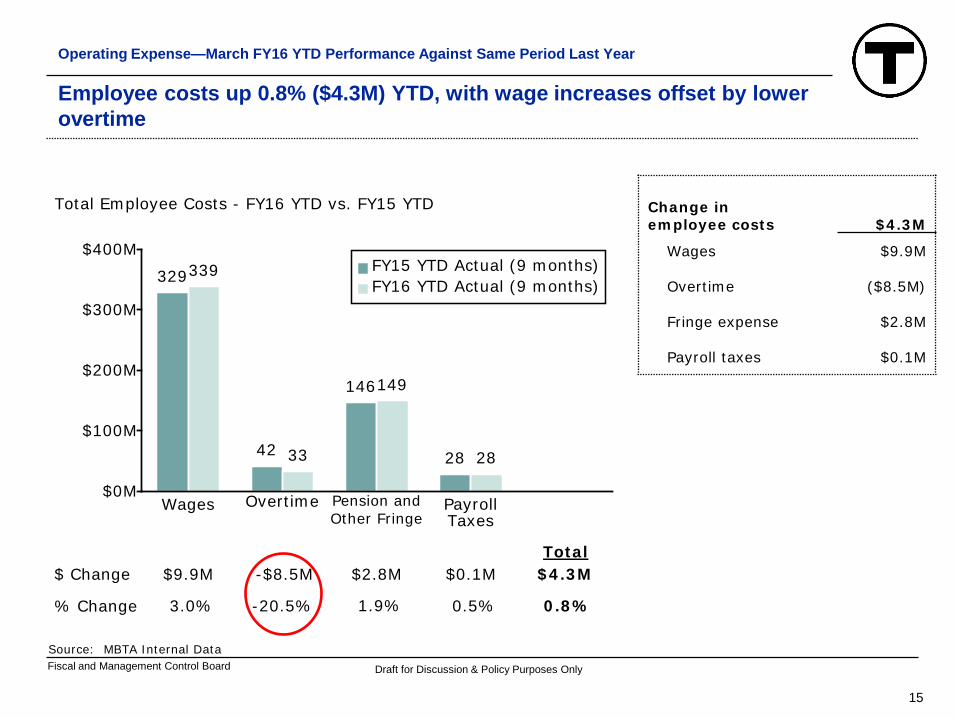
Materials and services costs down 6.5% ($11.9M)
Operating Expense—March FY16 YTD Performance Against Same Period Last Year
$0M
$25M
$50M
$75M
$100M
Materials and Services - FY16 YTD vs. FY15 YTD
Services
110112
Materials &
Supplies
75
61
Insurance
10 10
Financial
Service
Charges
4 4
$2.1M -$14.0M $0.6M $0.1M -$11.3M $ Change
1.9% -18.7% 5.7% 2.3% -5.7% % Change
FY15 YTD Actual (9 months)FY16 YTD Actual (9 months)
Total
Change in Materialsand Services ($11.9M)
Services $2.1MComputer services $2.5 Contract cleaning ($0.8)Engineering $3.2 Utilities ($5.2)Temporary help $1.3 Other services $1.0
Materials and Supplies ($14.0M)
Equipment components ($11.1)Fuel ($1.9)Maint. supplies/other materials ($1.1)
Insurance $0.6M
Financial Service Charges
$0.1M
Source: MBTA Internal Data

Fiscal and Management Control Board
17
Draft for Discussion & Policy Purposes Only
Agenda
• Executive Summary
• March FY16 YTD Performance Against FY16 Budget
• March FY16 YTD Performance Against Same Period Last Year
• Appendix
─ Financial Detail: March FY16 YTD Performance Against FY16 Budget and Recast
─ Financial Detail: March FY16 YTD Performance Against Same Period Last Year
─ Revenue Detail: Own-Source, Fare Collection and Sales Tax

Fiscal and Management Control Board
18
Draft for Discussion & Policy Purposes Only
MBTA remains on track to reach year-end $95M Structural Deficit; Deficit higher than recast in March due to timing of incurred revenues and expenses
March FY16 YTD Performance Against FY16 Budget
MARCH FY16 YTD PERFORMANCE AGAINST FY16 BUDGET
MARCH FY16 YTD PERFORMANCE AGAINST FY16 RECAST
($M)FY16 YTDBUDGET
FY16 YTD ACTUAL
$VARIANCE
%VARIANCE
FY16 YTDRECAST
FY16 YTD ACTUAL
$VARIANCE
%VARIANCE
REV
ENU
ES
Operating Revenues $498.1 $504.0 $6.0 1.2% $500.1 $504.0 $3.9 0.8%
Non-Operating Revenues $844.8 $841.5 ($3.2) (0.4%) $858.4 $841.5 ($16.8) (2.0%)
Total Revenues $1,342.8 $1,345.6 $2.8 0.2% $1,358.5 $1,345.6 ($12.9) (0.9%)
EXP
ENS
ES
Wages, Benefits and Payroll Taxes
$577.0 $549.4 ($27.7) (4.8%) $552.9 $549.4 ($3.6) (0.6%)
Non-Wage $597.9 $558.2 ($39.7) (6.6%) $559.2 $558.2 (1.0) (0.2%)Operating Expenses $1,174.9 $1,107.6 ($67.3) (5.7%) $1,112.1 $1,107.6 ($4.5) (0.4%)
Debt Service $341.3 $333.3 ($8.1) (2.4%) $335.2 $333.3 ($1.9) (0.6%)
Total Expenses $1,516.2 $1,440.8 ($75.4) (5.0%) $1,447.3 $1,440.8 ($6.4) (0.4%)
Structural Deficit ($173.4) ($95.3) $78.1 (45.1%) ($88.8) ($95.3) ($6.5) 7.3%
Fare recovery ratio 39% 42% 41% 42%

Fiscal and Management Control Board
19
Draft for Discussion & Policy Purposes Only
Total Revenues are above budget by 0.2% ($2.8M)
Appendix—Financial Detail: March FY16 YTD Performance Against FY16 Budget and Recast
MARCH FY16 YTD PERFORMANCE AGAINST FY16 BUDGET
MARCH FY16 YTD PERFORMANCE AGAINST FY16 RECAST
($M)FY16 YTDBUDGET
FY16 YTD ACTUAL
$VARIANCE
%VARIANCE
FY16 YTDRECAST
FY16 YTD ACTUAL
$VARIANCE
%VARIANCE
OP
ERA
TIN
G
Fares, all modes $462.7 $462.8 $0.1 0.0% $460.6 $462.8 $2.1 0.5%
Own-Source $35.4 $41.2 $5.9 16.6% $39.5 $41.2 $1.8 4.5%
Operating $498.1 $504.0 $6.0 1.2% $500.1 $504.0 $3.9 0.8%
NO
N-O
PER
ATI
NG
Sales Tax $739.7 $740.5 $0.8 0.1% $733.3 $740.5 $7.2 1.0%
Local Assessment $81.4 $81.4 $0.0 0.0% $101.8 $81.4 ($20.3) (20.0%)
Other $23.6 $19.6 ($4.0) (17.1%) $23.3 $19.6 ($3.7) (15.9%)
Non-Operating $844.8 $841.5 ($3.2) (0.4%) $858.4 $841.5 ($16.8) (2.0%)
Total Revenues $1,342.8 $1,345.6 $2.8 0.2% $1,358.5 $1,345.6 ($12.9) (0.9%)
Fare recovery ratio 39% 42% 41% 42%

Fiscal and Management Control Board
20
Draft for Discussion & Policy Purposes Only
Employee expenses are below budget by 4.8% ($27.7M)
Appendix—Financial Detail: March FY16 YTD Performance Against FY16 Budget and Recast
MARCH FY16 YTD PERFORMANCE AGAINST FY16 BUDGET
MARCH FY16 YTD PERFORMANCE AGAINST FY16 RECAST
($M)FY16 YTDBUDGET
FY16 YTD ACTUAL
$VARIANCE
%VARIANCE
FY16 YTDRECAST
FY16 YTD ACTUAL
$VARIANCE
%VARIANCE
WA
GES
Regular Wages $356.6 $338.8 ($17.8) (5.0%) $338.6 $338.8 $0.1 0.0%
Overtime $27.9 $33.1 $5.2 18.5% $36.8 $33.1 ($3.7) (10.1%)
Wages $384.5 $371.9 ($12.7) (3.3%) $375.4 $371.9 ($3.6) (0.9%)
BEN
EFIT
S A
ND
TAX
ES
Pension* $61.9 $58.5 ($3.3) (5.4%) $58.4 $58.5 $0.1 0.3%
Health $82.8 $74.8 ($8.1) (9.7%) $75.5 $74.8 ($0.7) (0.9%)
Retiree Health
Health & Welfare Fund $9.0 $8.8 ($0.2) (1.7%) $8.7 $8.8 $0.1 1.1%
Other Fringes $8.6 $7.1 ($1.5) (17.4%) $7.2 $7.1 ($0.1) (0.9%)
Payroll Taxes $30.3 $28.3 ($2.0) (6.5%) $27.8 $28.3 $0.5 1.8%
Benefits and taxes $192.5 $177.5 ($15.0) (7.8%) $177.5 $177.5 $0.0 0.0%
Total Wages, Benefits, Taxes $577.0 $549.4 ($27.7) (4.8%) $552.9 $549.4 ($3.6) (0.6%)
*Pension includes Main Fund, Police, Deferred Compensation Supplement, 401(a) MBTA Match
Fiscal and Management Control Board
21
Draft for Discussion & Policy Purposes Only
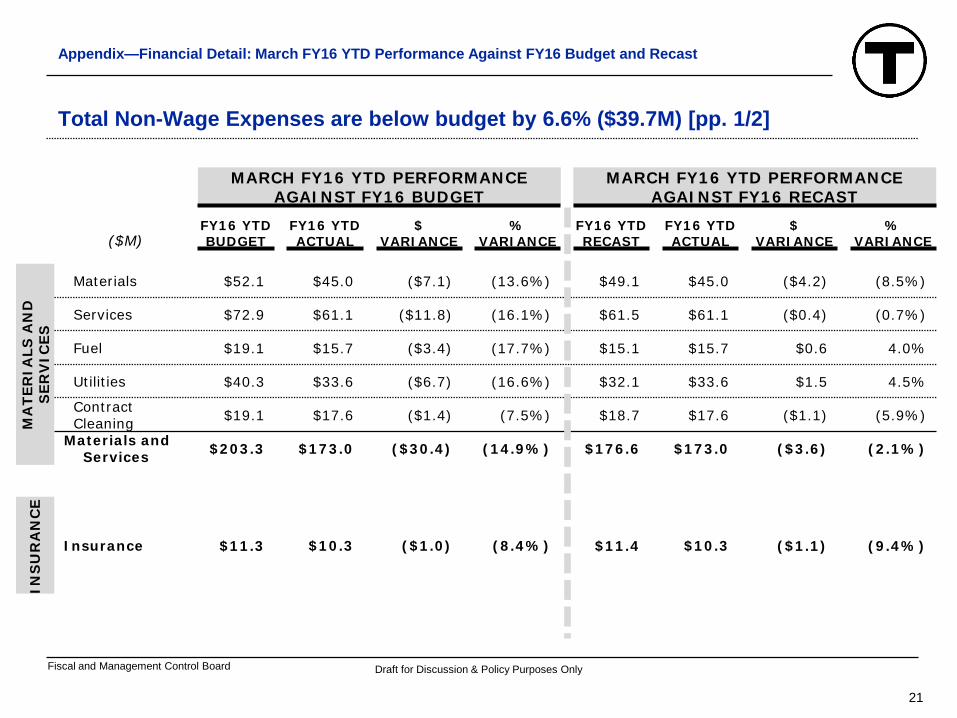
Total Non-Wage Expenses are below budget by 6.6% ($39.7M) [pp. 1/2]
Appendix—Financial Detail: March FY16 YTD Performance Against FY16 Budget and Recast
MARCH FY16 YTD PERFORMANCE AGAINST FY16 BUDGET
MARCH FY16 YTD PERFORMANCE AGAINST FY16 RECAST
($M)FY16 YTDBUDGET
FY16 YTD ACTUAL
$VARIANCE
%VARIANCE
FY16 YTDRECAST
FY16 YTD ACTUAL
$VARIANCE
%VARIANCE
MA
TER
IALS
AN
D
SER
VIC
ES
Materials $52.1 $45.0 ($7.1) (13.6%) $49.1 $45.0 ($4.2) (8.5%)
Services $72.9 $61.1 ($11.8) (16.1%) $61.5 $61.1 ($0.4) (0.7%)
Fuel $19.1 $15.7 ($3.4) (17.7%) $15.1 $15.7 $0.6 4.0%
Utilities $40.3 $33.6 ($6.7) (16.6%) $32.1 $33.6 $1.5 4.5%
Contract Cleaning $19.1 $17.6 ($1.4) (7.5%) $18.7 $17.6 ($1.1) (5.9%)
Materials and Services $203.3 $173.0 ($30.4) (14.9%) $176.6 $173.0 ($3.6) (2.1%)
INS
UR
AN
CE
Insurance $11.3 $10.3 ($1.0) (8.4%) $11.4 $10.3 ($1.1) (9.4%)

Fiscal and Management Control Board
22
Draft for Discussion & Policy Purposes Only
Total Non-Wage Expenses are below budget by 6.6% ($39.7M) [pp. 2/2]
Appendix—Financial Detail: March FY16 YTD Performance Against FY16 Budget and Recast
MARCH FY16 YTD PERFORMANCE AGAINST FY16 BUDGET
MARCH FY16 YTD PERFORMANCE AGAINST FY16 RECAST
($M)FY16 YTDBUDGET
FY16 YTD ACTUAL
$VARIANCE
%VARIANCE
FY16 YTDRECAST
FY16 YTD ACTUAL
$VARIANCE
%VARIANCE
CO
MM
UTE
R
RA
IL
Fixed Price $230.6 $230.6 ($0.0) 0.0% $230.6 $230.6 $0.0 0.0%Extra Work and Services $24.0 $28.1 $4.1 17.0% $24.1 $28.1 $4.0 16.6%
Fuel $30.4 $25.0 ($5.4) (17.6%) $23.8 $25.0 $1.2 5.0%
Commuter Rail $285.0 $283.7 ($1.3) (0.4%) $278.5 $283.7 $5.2 1.9%
LOC
AL
SER
VIC
E THE RIDE $81.7 $75.4 ($6.3) (7.8%) $76.6 $75.4 ($1.2) (1.5%)Ferry $9.8 $9.7 ($0.1) (1.4%) $9.7 $9.7 $0.0 0.0%LSS Other $1.9 $1.8 ($0.1) (4.3%) $1.8 $1.8 ($0.0) (1.2%)
Local Service $93.4 $86.8 ($6.6) (7.0%) $88.0 $86.8 ($1.2) (1.4%)
OTH
ER Financial Service Charges
$4.8 $4.3 ($0.5) (10.6%) $4.6 $4.3 ($0.3) (6.3%)
Non-Wage Expenses: $597.9 $558.2 ($39.7) (6.6%) $559.2 $558.2 ($1.0) (0.2%)

Fiscal and Management Control Board
23
Draft for Discussion & Policy Purposes Only
Debt Service expense is below budget by 2.4% ($8.1M)
Appendix—Financial Detail: March FY16 YTD Performance Against FY16 Budget and Recast
MARCH FY16 YTD PERFORMANCE AGAINST FY16 BUDGET
MARCH FY16 YTD PERFORMANCE AGAINST FY16 RECAST
($M)FY16 YTDBUDGET
FY16 YTD ACTUAL
$VARIANCE
%VARIANCE
FY16 YTDRECAST
FY16 YTD ACTUAL
$VARIANCE
%VARIANCE
DEB
T S
ERV
ICE
Interest $178.6 $171.6 ($7.0) (3.9%) $173.5 $171.6 ($1.9) (1.1%)
Principal $159.3 $158.3 ($1.0) (0.6%) $158.3 $158.3 $0.0 (0.0%)
Lease $3.4 $3.4 ($0.0) (0.8%) $3.4 $3.4 ($0.0) (0.0%)
Debt Service $341.3 $333.3 ($8.1) (2.4%) $335.2 $333.3 ($1.9) (0.6%)

Fiscal and Management Control Board
24
Draft for Discussion & Policy Purposes Only
Agenda
• Executive Summary
• March FY16 YTD Performance Against FY16 Budget
• March FY16 YTD Performance Against Same Period Last Year
• Appendix
─ Financial Detail: March FY16 YTD Performance Against FY16 Budget and Recast
─ Financial Detail: March FY16 YTD Performance Against Same Period Last Year
─ Revenue Detail: Own-Source, Fare Collection and Sales Tax

Fiscal and Management Control Board
25
Draft for Discussion & Policy Purposes Only
Total Revenues are above FY15 YTD by 5.2% ($66.3M)
Appendix—Financial Detail: March FY16 YTD Performance Against Same Period Last Year
MARCH FY16 YTD PERFORMANCE AGAINST SAME PERIOD LAST YEAR
($M)FY15 YTDACTUAL
FY16 YTD ACTUAL
$VARIANCE
%VARIANCE EXPLANATION
OP
ERA
TIN
G
Fares, all modes $454.5 $462.8 $8.3 1.8% • Ridership improvement
Own-source $28.8 $41.2 $12.4 43.1% • Stronger advertising and real estate proceeds
Operating $483.3 $504.0 $20.8 4.3%
NO
N-O
PER
ATI
NG
Sales Tax $707.6 $740.5 $32.9 4.7%
• ~$11M in difference between FY16 and FY15 due to increase in Base Tax Revenue; ~$10M due to timing of booked revenue; timing discrepancy to be corrected in March
Local Assessment $82.3 $81.4 ($0.8) (1.0%) • Higher statutory amount
Other $6.1 $19.6 $13.4 218.8% • Federal preventative maintenance funds• GLX mitigation income
Non-Operating $796.0 $841.5 $45.5 5.7%
Total Revenues $1,279.3 $1,345.6 $66.3 5.2%
Fare recovery ratio 41% 42%

Fiscal and Management Control Board
26
Draft for Discussion & Policy Purposes Only
Total Wage, Benefit and Tax expenses are below FY15 YTD by 0.8% ($4.3M)
Appendix—Financial Detail: March FY16 YTD Performance Against Same Period Last Year
MARCH FY16 YTD PERFORMANCE AGAINST SAME PERIOD LAST YEAR
($M)FY15 YTDACTUAL
FY16 YTD ACTUAL
$VARIANCE
%VARIANCE EXPLANATION
WA
GES
Regular Wages $328.9 $338.8 $9.9 3.0% • Collective bargaining increases
Overtime $41.6 $33.1 ($8.5) (20.5%) • Storm overtime down
Wages $370.5 $371.9 $1.4 0.4%
BEN
EFIT
S A
ND
TAX
ES
Pension* $53.0 $58.5 $5.5 10.4% • Tied to higher wage spending and higher contribution rate
Health $77.5 $74.8 ($2.7) (3.5%) • GIC cost control
Retiree Health • GIC cost control
Health & Welfare Fund $10.9 $8.8 ($2.1) (19.2%) • Higher participation rates
Other Fringes $5.0 $7.1 $2.1 42.9%
Payroll Taxes $28.1 $28.3 $0.1 0.5% • FICA tied to wages
Benefits and taxes $174.6 $177.5 $3.0 1.7%
Total Wages, Benefits and Taxes $545.1 $549.4 $4.3 0.8%
*Pension includes Main Fund, Police, Deferred Compensation Supplement, 401(a) MBTA Match

Fiscal and Management Control Board
27
Draft for Discussion & Policy Purposes Only
Non-Wage Expenses are below FY15 YTD by 1.6% ($9.1M) [pp. 1/2]
Appendix—Financial Detail: March FY16 YTD Performance Against Same Period Last Year
MARCH FY16 YTD PERFORMANCE AGAINST SAME PERIOD LAST YEAR
($M)FY15 YTDACTUAL
FY16 YTD ACTUAL
$VARIANCE
%VARIANCE EXPLANATION
MA
TER
IALS
AN
D
SER
VIC
ES
Materials $57.0 $45.0 ($12.1) (21.1%) • Equipment components and maintenance supplies
Services $53.0 $61.1 $8.1 15.2% • Computer engineering, temporary help, consulting services
Fuel $17.6 $15.7 ($1.9) (10.7%) • Bus fuel savings
Utilities $38.9 $33.6 ($5.3) (13.7%) • Electricity and traction power savingsContract Cleaning $18.4 $17.6 ($0.8) (4.1%) • Contractual
Materials and Services $184.9 $173.0 ($11.9) (6.5%)
INS
UR
AN
CE
Insurance $9.8 $10.3 $0.6 5.7% • Added underground station coverage

Fiscal and Management Control Board
28
Draft for Discussion & Policy Purposes Only
Non-Wage Expenses are below FY15 YTD by 1.6% ($9.1M) [pp. 2/2]
Appendix—Financial Detail: March FY16 YTD Performance Against Same Period Last Year
MARCH FY16 YTD PERFORMANCE AGAINST SAME PERIOD LAST YEAR
($M)FY15 YTDACTUAL
FY16 YTD ACTUAL
$VARIANCE
%VARIANCE EXPLANATION
CO
MM
UTE
R
RA
IL
Fixed Price $216.0 $230.6 $14.5 6.7% • Contractual increasesExtra Work and Services $48.1 $28.1 ($19.9) (41.4%) • Contractual increases
Fuel $27.2 $25.0 ($2.2) (8.0%) • Train fuel pricesCommuter Rail $291.3 $283.7 ($7.5) (2.6%)
LOC
AL
SER
VIC
E THE RIDE $66.1 $75.4 $9.3 14.0% • Contractual increasesFerry $9.5 $9.7 $0.2 2.0% • Contractual increasesLSS Other $1.6 $1.8 $0.2 15.4% • Contractual increases
Local Service $77.2 $86.8 $9.7 12.6%
OTH
ER Financial Service Charges
$4.2 $4.3 $0.1 2.3% • Credit Card fees from higher fare revenue
Non-Wage Expenses: $567.3 $558.2 ($9.1) (1.6%)

Fiscal and Management Control Board
29
Draft for Discussion & Policy Purposes Only
Debt Service Expense is below FY15 YTD by 2.9% ($9.5M)
Appendix—Financial Detail: March FY16 YTD Performance Against Same Period Last Year
MARCH FY16 YTD PERFORMANCE AGAINST SAME PERIOD LAST YEAR
($M)FY15 YTDACTUAL
FY16 YTD ACTUAL
$VARIANCE
%VARIANCE EXPLANATION
DEB
T S
ERV
ICE
Interest $180.1 $171.6 ($8.5) (4.7%) • Contractual per amortization schedule
Principal $139.9 $158.3 $18.3 13.1% • Contractual per amortization schedule
Lease $3.7 $3.4 ($0.3) (7.5%) • Contractual per amortization schedule
Debt Service $323.7 $333.3 $9.5 2.9%

Fiscal and Management Control Board
30
Draft for Discussion & Policy Purposes Only
Agenda
• Executive Summary
• March FY16 YTD Performance Against FY16 Budget
• March FY16 YTD Performance Against Same Period Last Year
• Appendix
─ Financial Detail: March FY16 YTD Performance Against FY16 Budget and Recast
─ Financial Detail: March FY16 YTD Performance Against Same Period Last Year
─ Revenue Detail: Own-Source, Fare Collection and Sales Tax

Fiscal and Management Control Board
31
Draft for Discussion & Policy Purposes Only
Own-Source revenues are above FY15 YTD by 42.7% ($12.3M)
Appendix—Revenue Detail: Own-Source
March FY16 YTD PERFORMANCE AGAINST SAME PERIOD LAST YEAR
($M)FY15 YTDACTUAL
FY16 YTD ACTUAL
$VARIANCE
%VARIANCE EXPLANATION
OW
N-S
OU
RC
E R
EVEN
EUE
Advertising $11.1 $15.0 $3.9 35.1% • Steady static advertising growth, maturity of digital urban panels
Parking $8.3 $13.4 $5.1 61.4% • Decrease in snow removal expense from FY15 due to better weather
Recurring Real Estate (non-parking)
$9.4 $12.9 $3.3 35.1%
Own-Source revenue $28.8 $41.2 $12.4 43.1%

Fiscal and Management Control Board
32
Draft for Discussion & Policy Purposes Only
Recurring Real Estate revenues are above FY15 by 35.1% ($3.3M)
Appendix—Revenue Detail: Own-Source
March FY16 YTD Performance Against Same Period Last Year(9 MONTHS)
($M)FY15 YTDACTUAL
FY16 YTD ACTUAL
$VARIANCE
%VARIANCE EXPLANATION
REC
UR
RIN
G R
EAL
ESTA
TE R
EVEN
EUE Massport
(airport) shuttle $1.5 $1.5 $0.0 1.5% • Consistent with prior year
South Station Intermodal+CR $0.7 $1.3 $0.6 85.7%
Net MRG (Mass Realty Group)Revenue
$7.2 $10.1 $2.9 40.3% • (See Below)
Land Rental $1.6 $2.2 $0.6 37.5% • Renegotiation of contractUtilities $0.8 $0.8 $0.0 0% • Consistent with prior yearTelecom $4.4 $5.7 $1.3 29.5% • Renegotiation of contractConcessions $1.9 $1.7 ($0.2) (10.5%) • Lease expirationsAdvertising $2.3 $2.9 $.6 26.1% • New lease rolloutMRG fees andexpenses ($3.8) ($3.2) $.6 3.3%
Recurring Real Estate Revenue
$9.4 $12.9 $3.3 35.1%

Fiscal and Management Control Board
33
Draft for Discussion & Policy Purposes Only
Fare revenue is up 1.8% ($8.3M) YTD
Appendix—Revenue Detail: Fare Collection
$0M
$50M
$100M
$150M
$200M
$250M
$300M
Fare Revenue - FY16 YTD vs. FY15 YTD
Subway, Bus,
Ferry, RIDE
300 301
Commuter Rail (Unallocated)
154 162
$7.6M$0.7M $8.3M $ Change4.9%0.2% 1.8% % Change
FY15 YTD Actual (9 months)FY16 YTD Actual (9 months)
Note: Chart above shows “unallocated” commuter rail revenue, prior to CTPS allocation for linked trips to other modes. Source: MBTA Internal Data
Total

Fiscal and Management Control Board
34
Draft for Discussion & Policy Purposes Only
Commuter rail revenue is up 5% over FY15, and up 11% from FY14
$0M
$50M
$100M
$150M
$200M
YTD (9 months) Commuter Rail Fare Revenue (Unallocated)
FY14 YTD Actual
(9 months)
$146M
FY15 YTD Actual
(9 months)
$154M
FY16 YTD Actual
(9 months)
$162M
Note: Chart above shows “unallocated” commuter rail revenue, prior to CTPS allocation for linked trips to other modes. Subway, Bus, Ferry, RIDE revenue includes all adjustments to total fare revenueSource: MBTA Internal Data
Commuter Rail Revenue Overview
YTD Commuter Rail Revenue Growth
(9 months)
FY16 / FY15: 5%
FY16 / FY14: 11%
Fiscal and Management Control Board
35
Draft for Discussion & Policy Purposes Only
• Total annual (12 month) unallocated commuter rail revenue:
› FY12: $152M› FY13: $186M› FY14: $196M› FY15: $205M› Mar FY16 TTM: $212M
• If current growth trend continues (5% year-on-year), FY16 commuter rail revenue could reach $215M by fiscal-year end
Commuter Rail Revenue Overview
Commuter rail fare revenue could reach $215M in FY16

Fiscal and Management Control Board
36
Draft for Discussion & Policy Purposes Only
Monthly trend in commuter rail revenue has been positive
$0M
$5M
$10M
$15M
$20MAverage
$17.3M
Dec
14
17.1
Jan1
5
Feb1
5
14.7M
ar15
Apr
15
May
15
15.6
Jun1
5
18.0
Jul1
5
18.4
Aug
15
17.6
Sep
15
18.4
Oct
15
19.2
Nov
15
18.5
Dec
15
17.8
Jan1
6
17.4
Feb1
6
Mar
16
18.1
4.4% 2.0% 0.9% 1.5% 5.2% 3.8% 3.8% 14.0%10.9%
Monthly MBTA Commuter Rail Revenue (Unallocated)
Average
$17.3M16.8
16.316.7 16.7
YTD FY16/FY15 Growth: 5%
Year-over Year Growth
Note: Chart above shows “unallocated” commuter rail revenue, prior to CTPS allocation for linked trips to other modes. Source: MBTA Internal Data
Commuter Rail Revenue Overview

Fiscal and Management Control Board
37
Draft for Discussion & Policy Purposes Only
Commuter rail revenue is up 4.9% for the first 9 months of FY16
0%
5%
10%
15%
Commuter Rail Fare Revenue (Unallocated) Monthly Revenue Growth Rate over FY15
YTD FY16/FY15
Growth: 4.9%
0.9%
5.2%
14.0%
Jul16 Aug16 Sep16 Oct16 Nov16 Dec16 Jan16 Feb16 Mar16
Commuter Rail Revenue (Unallocated) - Monthly Growth Rate
YTD FY16/FY15
Growth: 4.9%4.4%2.0%
1.5%3.8% 3.8%
10.9%
Note: Chart above shows “unallocated” commuter rail revenue, prior to CTPS allocation for linked trips to other modes. Source: MBTA Internal Data

Fiscal and Management Control Board
38
Draft for Discussion & Policy Purposes Only
Subway, Bus, Ferry & RIDE total revenue is level for the first 9 months
$0M
$10M
$20M
$30M
$40M
Average
$32.8M
Dec
14
Jan1
5
Feb1
5
28.6
Mar
1534.5
Apr
15
33.3
May
15
Jun1
5
33.5
Jul1
5
36.2
Aug
15
34.4
Sep
15
36.0
Oct
15
35.8
Nov
15
32.4
Dec
15
Jan1
6
Feb1
6
Mar
16
33.3
0.5% -1.7% 1.0% 1.8% -0.1% 0.8% -2.3% 6.8% -3.7%
Monthly Subway, Bus, Ferry & RIDE Revenue
Average
$32.8M31.2 31.4 31.0 31.5 30.7 30.5
Year-over Year Growth
YTD FY16/FY15 Growth: 0.2%
Note: Includes adjustments to total fare revenueSource: MBTA Internal Data

Fiscal and Management Control Board
39
Draft for Discussion & Policy Purposes Only
Dedicated sales tax up 5.6% over FY15 YTD
$0M
$20M
$40M
$60M
$80M
$100M
Jul
6872
Aug
6266
Sep
6063
Oct
6568
Nov
6064
Dec
6165
Jan
7679
Feb
5658
Mar
5660
Apr
56
May
65
Jun
70
6.1% 5.4% 6.5% 5.4% 5.3% 6.3% 3.8% 4.6% 7.2%Growth %
(month-on-month)
Sales and Use Tax Collections (Exclusive of Meals) dedicated to MBTA*
FY15 FY16
YTD FY16/FY15 Growth: 5.6%
Appendix—Revenue Detail: Sales Tax
*MBTA receives 16% of Sales and Use Tax Collections excluding Meals Tax^Does not include $160M in annual additional dedicated revenueSource: MBTA Internal Data; MA Monthly Revenue Collection