Embed Size (px)
Citation preview

Openreach Charge Code Application
11 November 2014
Violeta Argyropoulou Kevin Spencer
UMSUG113/02
Public
Introduction
Openreach Charge Code Application 2
■ July 2013 – SVG rejected Openreach’s application for 14 UMS Charge Codes
■ September 2014 - Openreach submitted new application for 45 different UMS Charge
Codes for its fibre optic cabinets
■ September 2014 – SVG agreed ELEXON proposed methodology to assess
predictability of consumption of Openreach’s new Charge Codes
■ Purpose of this paper:
oPresent Openreach’s new application;
oPresent SVG agreed approach and criteria to measure the predictability of
consumption for each applied for Charge Code;
oPresent ELEXON’s analysis results; and
oInvite UMSUG Members’ observations and comments.
Background – Openreach’s previous application
Openreach Charge Code Application 3
■ April 2013 – Openreach submitted application for 14 UMS Charge Codes for new
installations of its fibre optic cabinets
■ Openreach derived card-based Charge Codes using half-hourly consumption data of
its existing metered cabinets
■ ELEXON undertook analysis using this sample data and presented results to UMSUG
and SVG
■ July 2013 – SVG rejected application on the basis that:
• Consumption of cabinets with same number of cards (on same Charge Code)
varied significantly;
• Cabinets’ consumption not sufficiently predictable; and
• Criterion for UMS (consumption <500W) not met by some cabinets
therefore there was risk for inaccurate Settlement
Background – What has happened since July 2013?
Openreach Charge Code Application 4
■ Openreach has approached UMSOs individually for local ‘Miscellaneous’ Charge
Codes to be used only in their distribution region (discussions outside the BSC)
■ Four DNOs (representing 11 out of 14 GSP Groups) have agreed to issue regional
Codes based on Openreach’s revised approach
■ UMSOs’ inventory gets updated on a monthly basis detailing changes to Charge
Codes
Openreach’s new application intends to standardise regional approach in single
set of national, SVG-approved Charge Codes
New Openreach application (1)
Openreach Charge Code Application 5
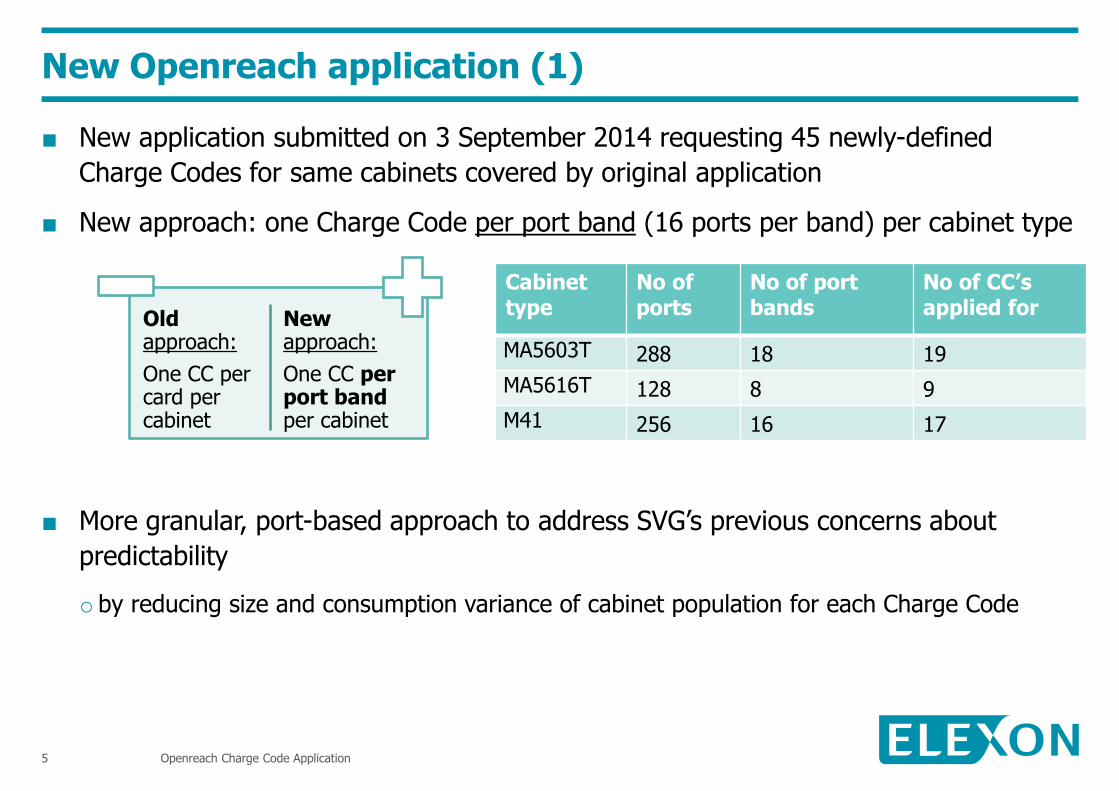
■ New application submitted on 3 September 2014 requesting 45 newly-defined
Charge Codes for same cabinets covered by original application
■ New approach: one Charge Code per port band (16 ports per band) per cabinet type
■ More granular, port-based approach to address SVG’s previous concerns about
predictability
o by reducing size and consumption variance of cabinet population for each Charge Code
Old approach:
One CC per card per cabinet
New approach:
One CC per port band per cabinet
Cabinet type
No of ports
No of port bands
No of CC’s applied for
MA5603T 288 18 19
MA5616T 128 8 9
M41 256 16 17
New Openreach application (2)
Openreach Charge Code Application 6
Source data
■ Snapshot HH consumption data from Openreach’s metered cabinets
■ Full width data covering all distribution regions
■ Agreed snapshot period: 20.30 on 1 August 2014
■ Data sourced directly from Openreach and not BSC Data Collector
■ Additional randomised sample check of Openreach’s data undertaken by ELEXON
using Data Collector data.
oNo discrepancies identified
New Openreach application (3)
Openreach Charge Code Application 7
Additional information provided by Openreach:
■ Undertaking signed at Director level that data provided is accurate and a true
reflection of the load on each cabinet;
■ A Q&A document to cover off questions raised during the previous application; and
■ Data for example cabinets showing that power consumption is driven by the number
of ports being utilised and not by whether customers are actually using the
connection (e.g. to download).
Additional information provided to ELEXON:
■ Evidence from UMSOs that the monthly update of their inventories is a robust and
efficient process.
Approach and criteria for assessing predictability (1)
Openreach Charge Code Application 8
UMS accuracy standards
■ BSC Section S: standards of accuracy for data for UMS no worse than those applied
for metered supplies
■ Statutory Instrument (SI):
oElectrical load of ‘predictable’ nature
oElectrical load < 500W or not practical to meter the equipment
■ National Measurement Office (NMO):
oFurther guidance on SI criteria
oVariation of ±3.5% to measure predictability
oEncourages adopting pragmatic approach to small loads
Approach and criteria for assessing predictability (2)
Openreach Charge Code Application 9
■ More specifically the NMO guidance on UMS regulations states:
The NMO considers that in the context of these Regulations, predictable shall
be assumed to mean a load that can be consistently understood throughout
its usage period, such that billing can be correctly estimated or accurately
calculated based on pre-defined operational profiles or based on event
records. The NMO considers that to maintain settlement accuracy, there
should be a maximum permitted variation of ±3.5% which means the
calculated usage should be equivalent in accuracy to that of a metered
supply.
and goes on to say:
In determining if a load meets this criterion NMO encourage a pragmatic approach to
equipment which will, for the majority of time, require a constant load but may have
small variations in load from time to time that are insignificant in terms of overall kWh
consumption taken on an annual basis.
Predictability - Interpretation from Settlement’s point of view (1)
Openreach Charge Code Application 10
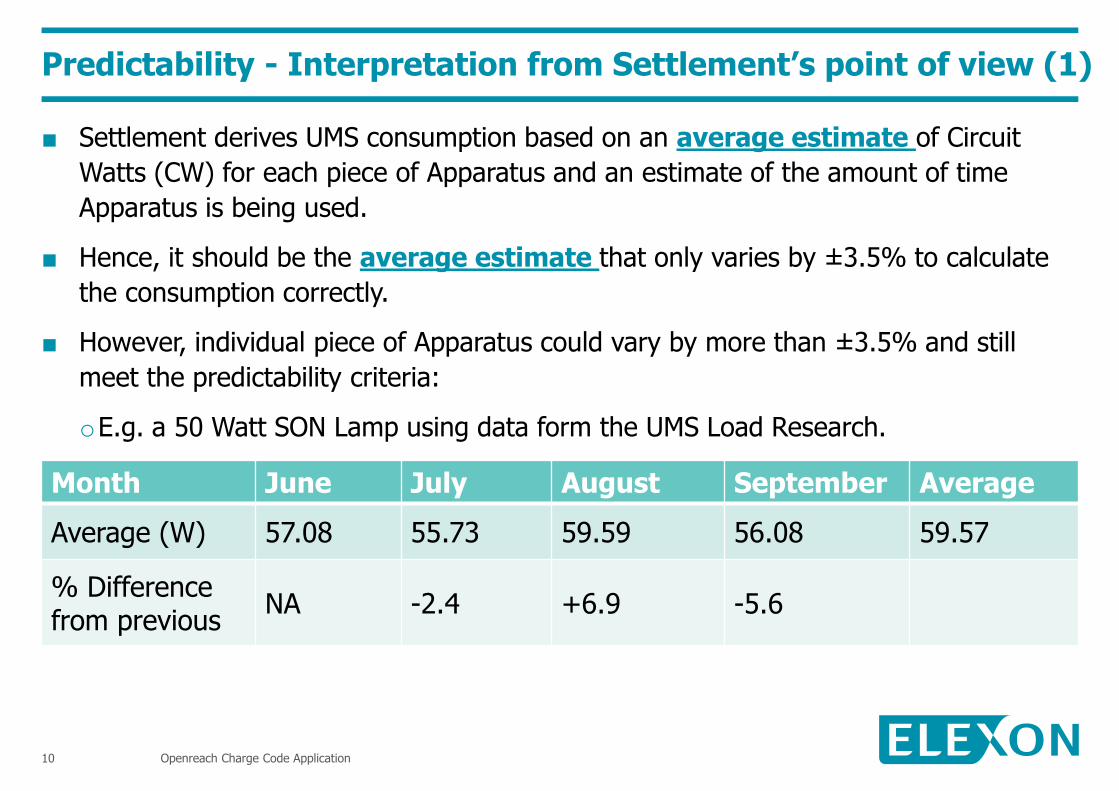
■ Settlement derives UMS consumption based on an average estimate of Circuit
Watts (CW) for each piece of Apparatus and an estimate of the amount of time
Apparatus is being used.
■ Hence, it should be the average estimate that only varies by ±3.5% to calculate
the consumption correctly.
■ However, individual piece of Apparatus could vary by more than ±3.5% and still
meet the predictability criteria:
oE.g. a 50 Watt SON Lamp using data form the UMS Load Research.
Month June July August September Average
Average (W) 57.08 55.73 59.59 56.08 59.57
% Difference from previous
NA -2.4 +6.9 -5.6
Predictability - Interpretation from Settlement’s point of view (2)
Openreach Charge Code Application 11
0
10
20
30
40
50
60
54 56 58 60 62 64 66 68 70 72 74 76 78 80 82 84 More
Fre
qu
en
cy
MPACW
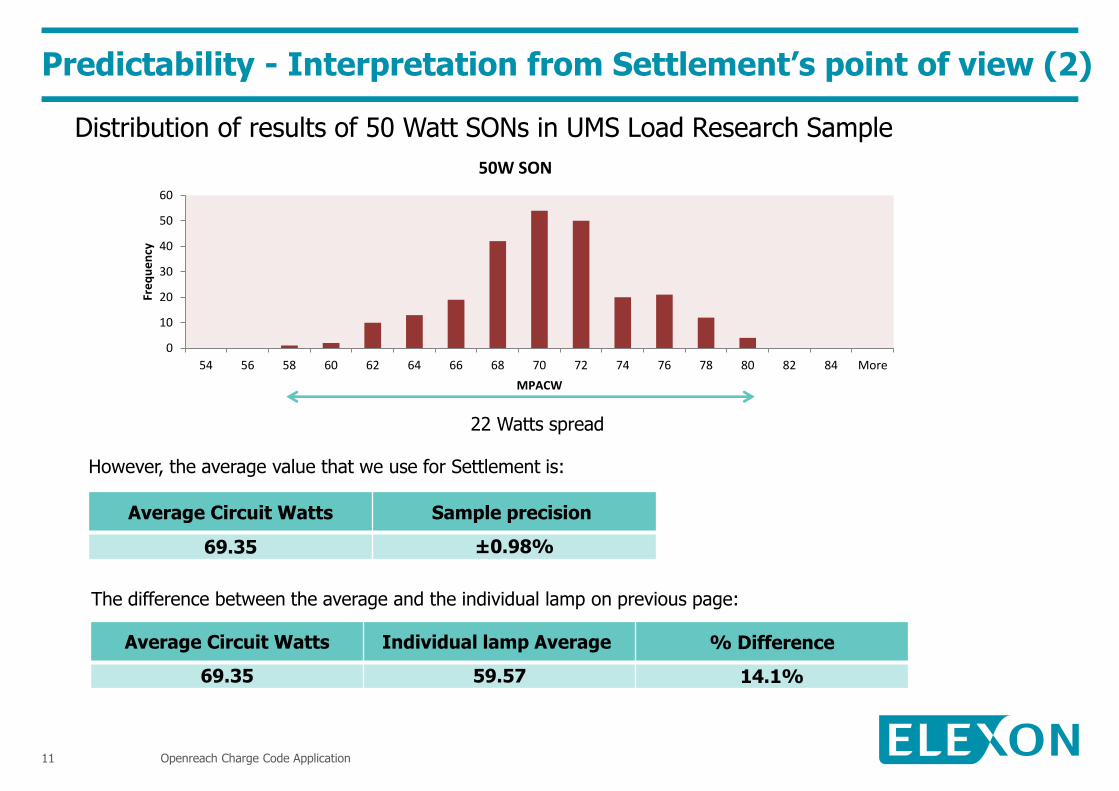
50W SON
Distribution of results of 50 Watt SONs in UMS Load Research Sample
22 Watts spread
However, the average value that we use for Settlement is:
Average Circuit Watts Sample precision
69.35 ±0.98%
The difference between the average and the individual lamp on previous page:
Average Circuit Watts Individual lamp Average % Difference
69.35 59.57 14.1%
Predictability - Interpretation from Settlement’s point of view (3)
Openreach Charge Code Application 12
So, what is important to Settlement in this context is the following:
■ The Average Circuit Watts;
■ The Confidence we have in the Average; and
■ The ability of variations in the average to allow calculation of the Settlement energy.
The SVG agreed criteria for assessing predictability
Openreach Charge Code Application 13
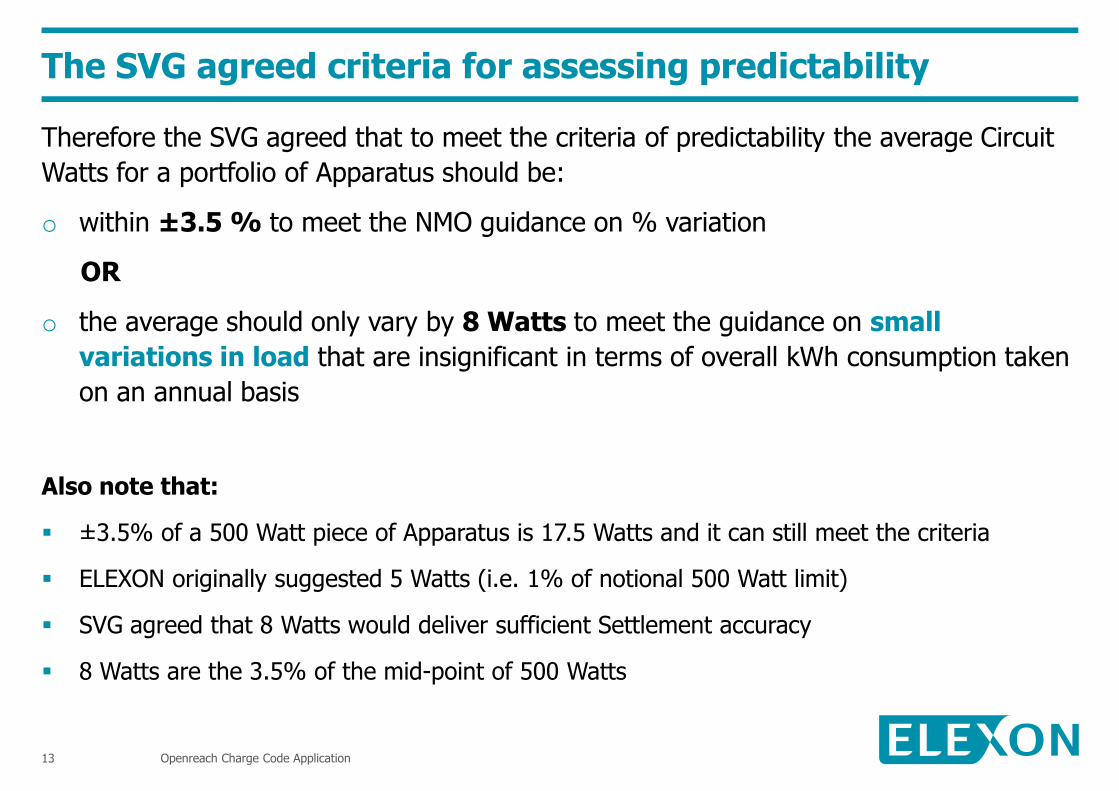
Therefore the SVG agreed that to meet the criteria of predictability the average Circuit
Watts for a portfolio of Apparatus should be:
o within ±3.5 % to meet the NMO guidance on % variation
OR
o the average should only vary by 8 Watts to meet the guidance on small
variations in load that are insignificant in terms of overall kWh consumption taken
on an annual basis
Also note that:
±3.5% of a 500 Watt piece of Apparatus is 17.5 Watts and it can still meet the criteria
ELEXON originally suggested 5 Watts (i.e. 1% of notional 500 Watt limit)
SVG agreed that 8 Watts would deliver sufficient Settlement accuracy
8 Watts are the 3.5% of the mid-point of 500 Watts
The SVG agreed 6-step approach
Openreach Charge Code Application 14
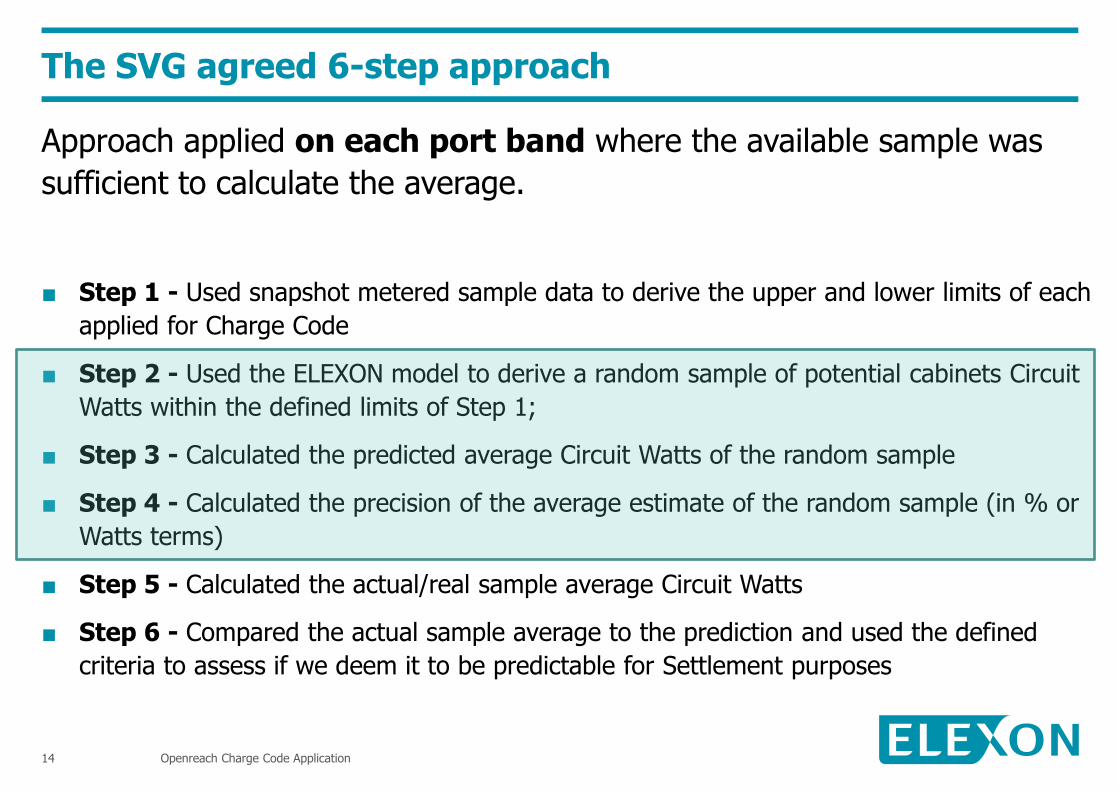
Approach applied on each port band where the available sample was
sufficient to calculate the average.
■ Step 1 - Used snapshot metered sample data to derive the upper and lower limits of each
applied for Charge Code
■ Step 2 - Used the ELEXON model to derive a random sample of potential cabinets Circuit
Watts within the defined limits of Step 1;
■ Step 3 - Calculated the predicted average Circuit Watts of the random sample
■ Step 4 - Calculated the precision of the average estimate of the random sample (in % or
Watts terms)
■ Step 5 - Calculated the actual/real sample average Circuit Watts
■ Step 6 - Compared the actual sample average to the prediction and used the defined
criteria to assess if we deem it to be predictable for Settlement purposes
Using a model to calculate the predictability of the average Circuit Watts (1)
Openreach Charge Code Application 15
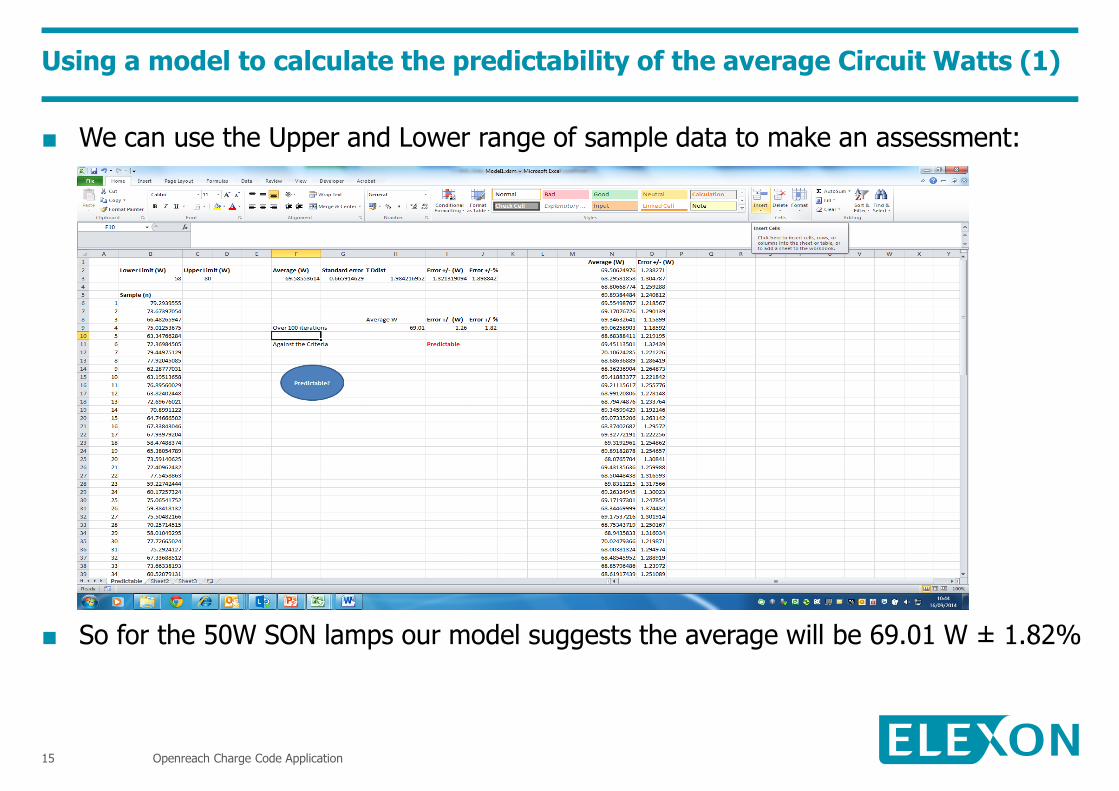
■ We can use the Upper and Lower range of sample data to make an assessment:
■ So for the 50W SON lamps our model suggests the average will be 69.01 W ± 1.82%
Using a model to calculate the predictability of the average Circuit Watts (2)
Openreach Charge Code Application 16
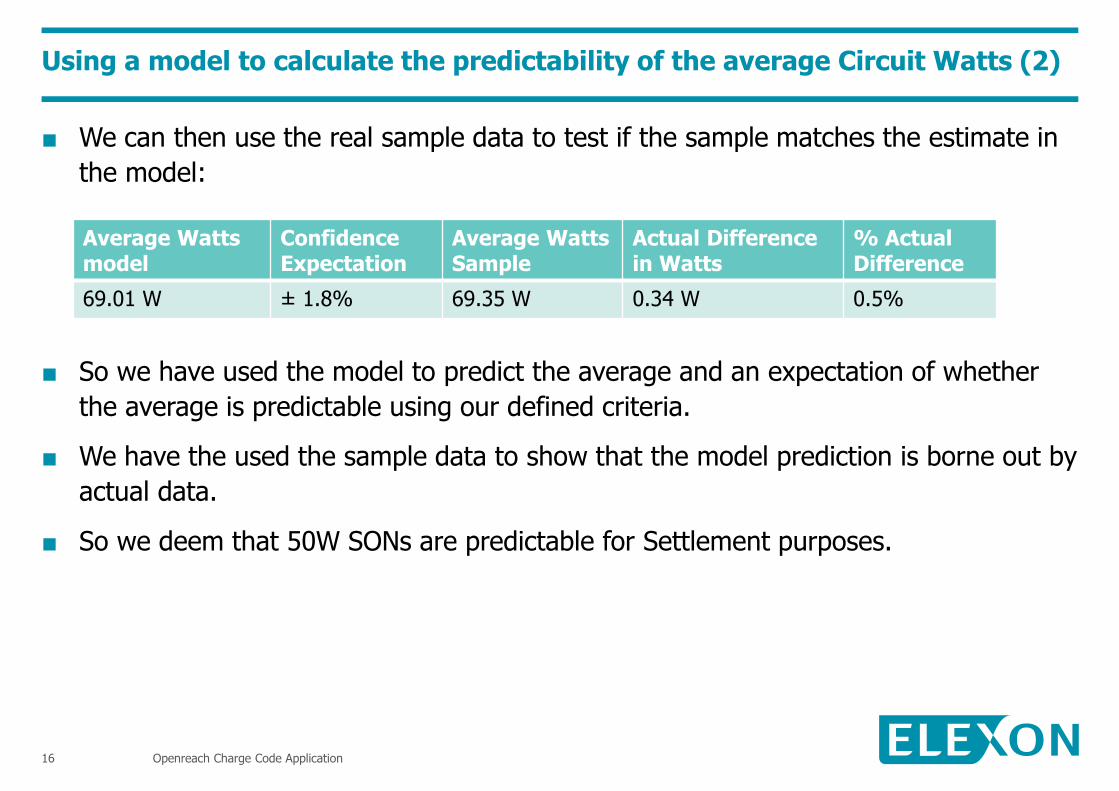
■ We can then use the real sample data to test if the sample matches the estimate in
the model:
■ So we have used the model to predict the average and an expectation of whether
the average is predictable using our defined criteria.
■ We have the used the sample data to show that the model prediction is borne out by
actual data.
■ So we deem that 50W SONs are predictable for Settlement purposes.
Average Watts model
Confidence Expectation
Average Watts Sample
Actual Difference in Watts
% Actual Difference
69.01 W ± 1.8% 69.35 W 0.34 W 0.5%
ELEXON analysis results (1)
Openreach Charge Code Application 17
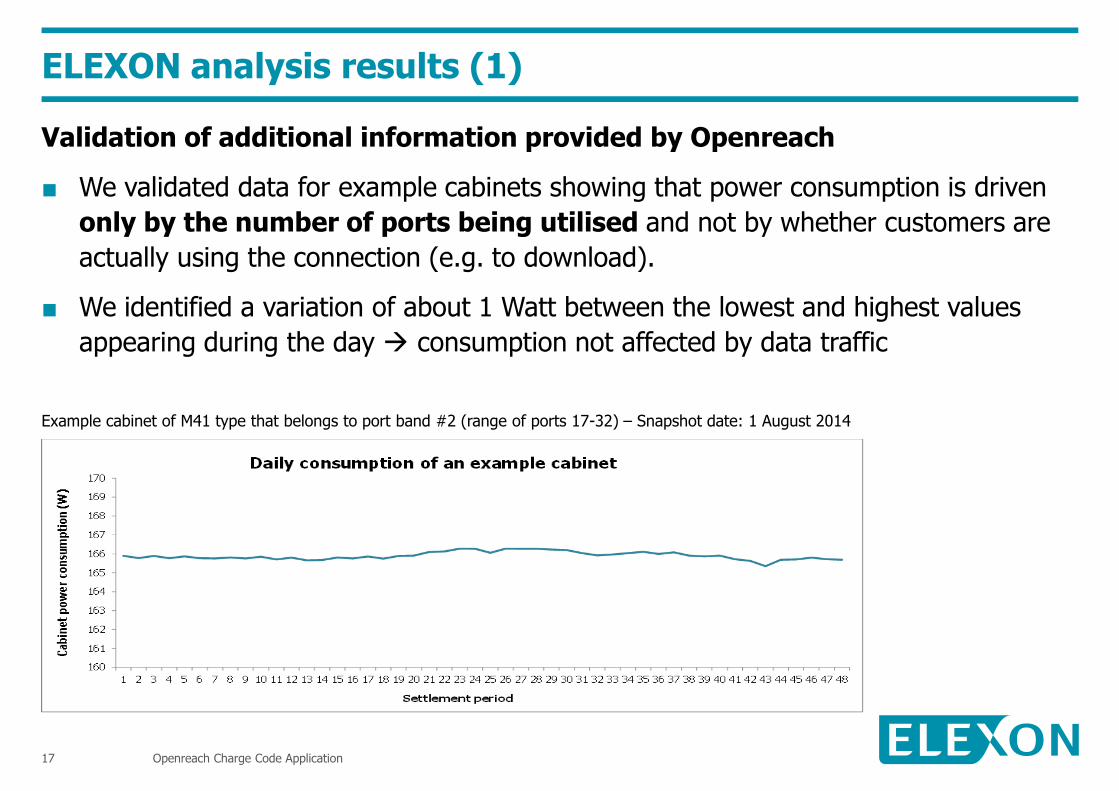
Validation of additional information provided by Openreach
■ We validated data for example cabinets showing that power consumption is driven
only by the number of ports being utilised and not by whether customers are
actually using the connection (e.g. to download).
■ We identified a variation of about 1 Watt between the lowest and highest values
appearing during the day consumption not affected by data traffic
Example cabinet of M41 type that belongs to port band #2 (range of ports 17-32) – Snapshot date: 1 August 2014
ELEXON analysis results (2)
Openreach Charge Code Application 18
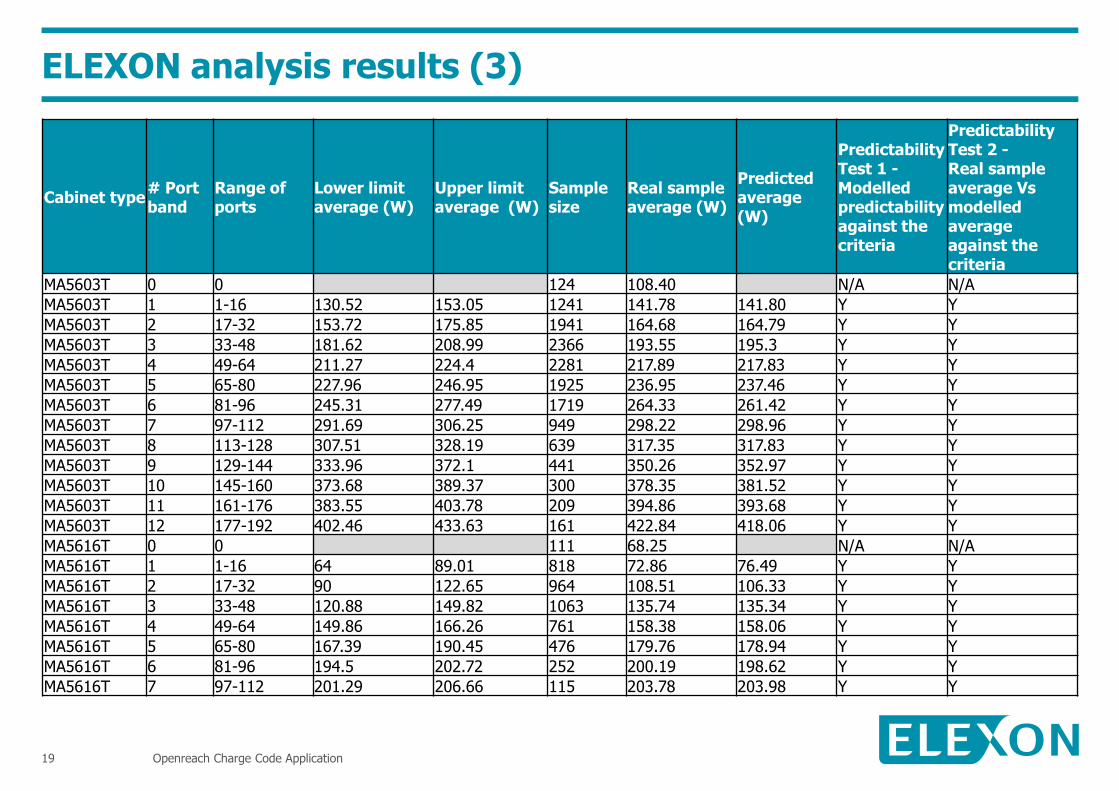
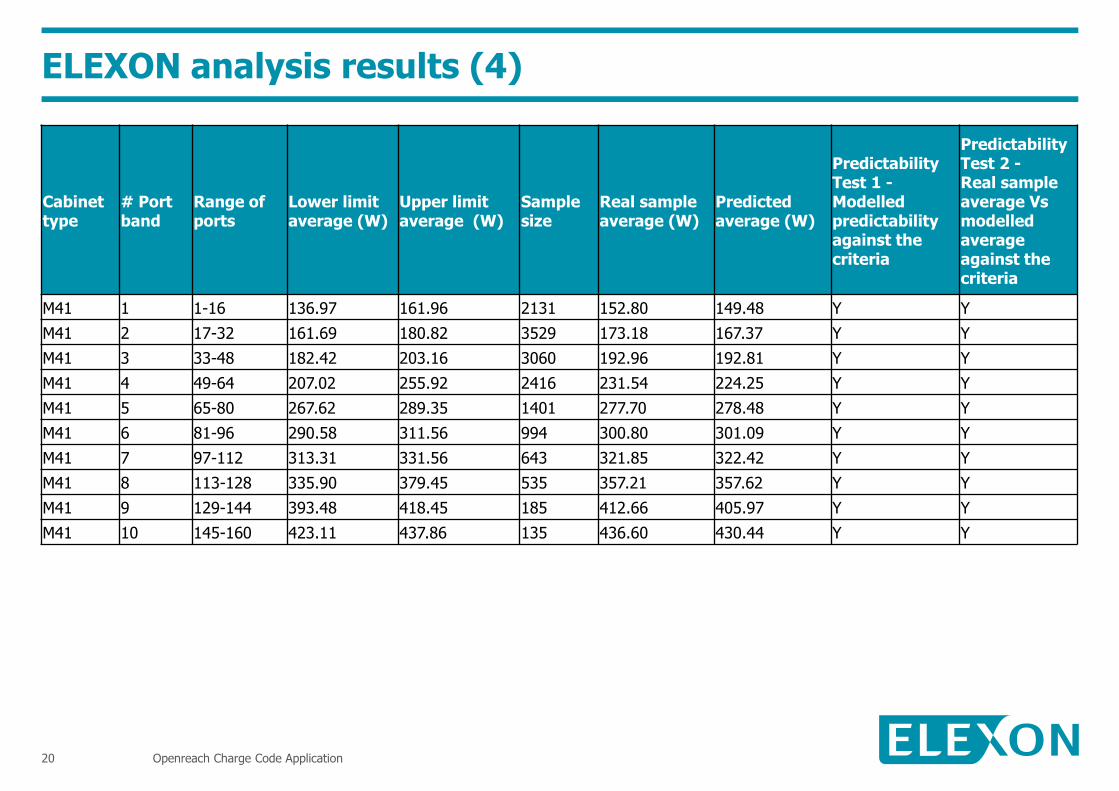
Assessing the predictability of Charge Codes for port bands with more than
100 samples
■ ELEXON followed the SVG-agreed approach
■ We applied two ‘predictability tests’:
I. Percentage and Watts variation of predicted average of random sample (based on the real
sample’s lower and upper limit Circuit Watts) should be within the agreed confidence
intervals of ±3.5% or ±8 Watts
II. Real sample average should be within the range: (predicted average of the random sample)
± (confidence interval)
■ All 29 port bands with more than 100 samples available passed both tests
■ There were another 3 sets of sample data for the initial position (port band 0) which
were simply averaged
■ Real sample average per port band is used to represent the Circuit Watts in the
applied for Charge Codes
ELEXON analysis results (3)
Openreach Charge Code Application 19
Cabinet type # Port band
Range of ports
Lower limit average (W)
Upper limit average (W)
Sample size
Real sample average (W)
Predicted average (W)
Predictability Test 1 - Modelled predictability against the criteria
Predictability Test 2 - Real sample average Vs modelled average against the criteria
MA5603T 0 0 124 108.40 N/A N/A
MA5603T 1 1-16 130.52 153.05 1241 141.78 141.80 Y Y
MA5603T 2 17-32 153.72 175.85 1941 164.68 164.79 Y Y
MA5603T 3 33-48 181.62 208.99 2366 193.55 195.3 Y Y
MA5603T 4 49-64 211.27 224.4 2281 217.89 217.83 Y Y
MA5603T 5 65-80 227.96 246.95 1925 236.95 237.46 Y Y
MA5603T 6 81-96 245.31 277.49 1719 264.33 261.42 Y Y
MA5603T 7 97-112 291.69 306.25 949 298.22 298.96 Y Y
MA5603T 8 113-128 307.51 328.19 639 317.35 317.83 Y Y
MA5603T 9 129-144 333.96 372.1 441 350.26 352.97 Y Y
MA5603T 10 145-160 373.68 389.37 300 378.35 381.52 Y Y
MA5603T 11 161-176 383.55 403.78 209 394.86 393.68 Y Y
MA5603T 12 177-192 402.46 433.63 161 422.84 418.06 Y Y
MA5616T 0 0 111 68.25 N/A N/A
MA5616T 1 1-16 64 89.01 818 72.86 76.49 Y Y
MA5616T 2 17-32 90 122.65 964 108.51 106.33 Y Y
MA5616T 3 33-48 120.88 149.82 1063 135.74 135.34 Y Y
MA5616T 4 49-64 149.86 166.26 761 158.38 158.06 Y Y
MA5616T 5 65-80 167.39 190.45 476 179.76 178.94 Y Y
MA5616T 6 81-96 194.5 202.72 252 200.19 198.62 Y Y
MA5616T 7 97-112 201.29 206.66 115 203.78 203.98 Y Y
ELEXON analysis results (4)
Openreach Charge Code Application 20
Cabinet type
# Port band
Range of ports
Lower limit average (W)
Upper limit average (W)
Sample size
Real sample average (W)
Predicted average (W)
Predictability Test 1 - Modelled predictability against the criteria
Predictability Test 2 - Real sample average Vs modelled average against the criteria
M41 1 1-16 136.97 161.96 2131 152.80 149.48 Y Y
M41 2 17-32 161.69 180.82 3529 173.18 167.37 Y Y
M41 3 33-48 182.42 203.16 3060 192.96 192.81 Y Y
M41 4 49-64 207.02 255.92 2416 231.54 224.25 Y Y
M41 5 65-80 267.62 289.35 1401 277.70 278.48 Y Y
M41 6 81-96 290.58 311.56 994 300.80 301.09 Y Y
M41 7 97-112 313.31 331.56 643 321.85 322.42 Y Y
M41 8 113-128 335.90 379.45 535 357.21 357.62 Y Y
M41 9 129-144 393.48 418.45 185 412.66 405.97 Y Y
M41 10 145-160 423.11 437.86 135 436.60 430.44 Y Y
ELEXON analysis results (5)
Openreach Charge Code Application 21
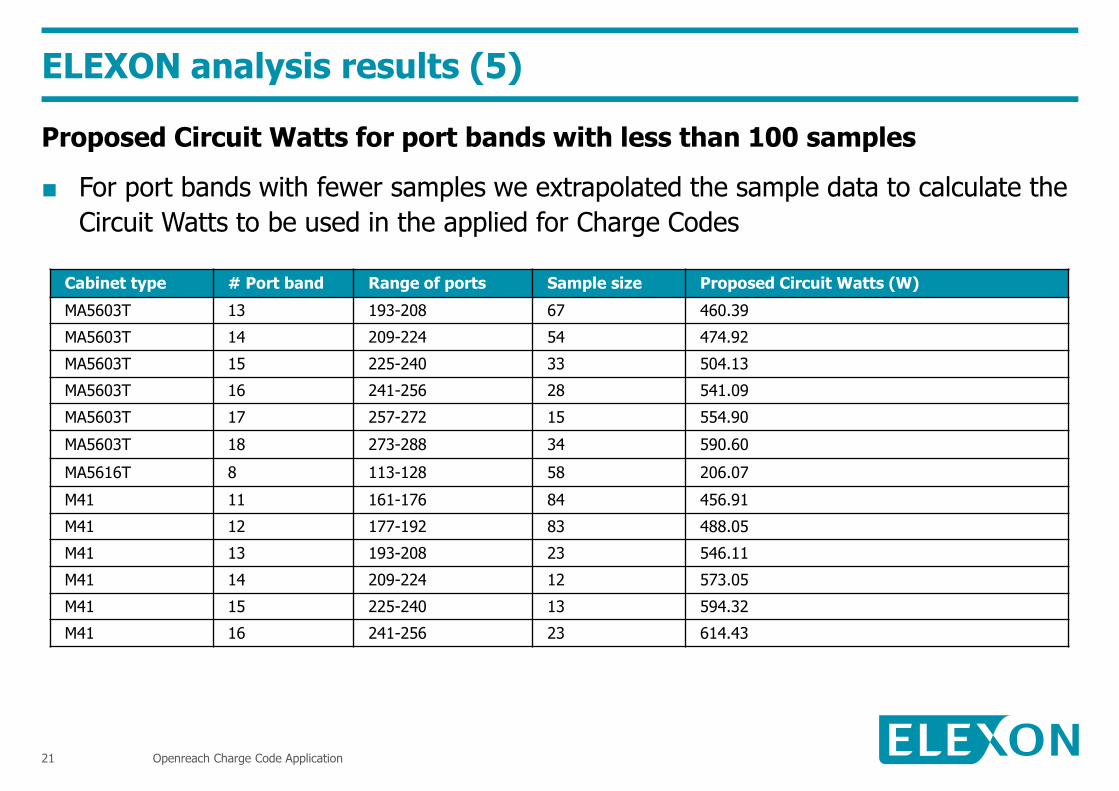
Proposed Circuit Watts for port bands with less than 100 samples
■ For port bands with fewer samples we extrapolated the sample data to calculate the
Circuit Watts to be used in the applied for Charge Codes
Cabinet type # Port band Range of ports Sample size Proposed Circuit Watts (W)
MA5603T 13 193-208 67 460.39
MA5603T 14 209-224 54 474.92
MA5603T 15 225-240 33 504.13
MA5603T 16 241-256 28 541.09
MA5603T 17 257-272 15 554.90
MA5603T 18 273-288 34 590.60
MA5616T 8 113-128 58 206.07
M41 11 161-176 84 456.91
M41 12 177-192 83 488.05
M41 13 193-208 23 546.11
M41 14 209-224 12 573.05
M41 15 225-240 13 594.32
M41 16 241-256 23 614.43
The SVG agreed timeline
Openreach Charge Code Application 22
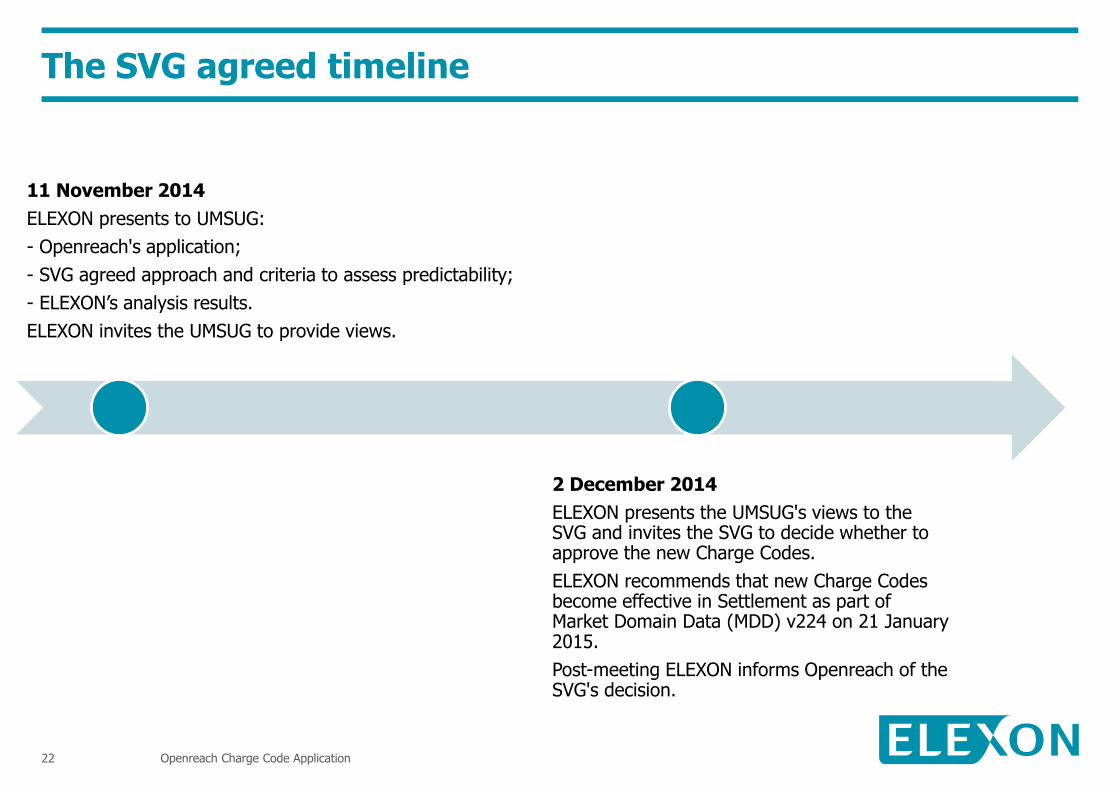
11 November 2014
ELEXON presents to UMSUG:
- Openreach's application;
- SVG agreed approach and criteria to assess predictability;
- ELEXON’s analysis results.
ELEXON invites the UMSUG to provide views.
2 December 2014
ELEXON presents the UMSUG's views to the SVG and invites the SVG to decide whether to approve the new Charge Codes.
ELEXON recommends that new Charge Codes become effective in Settlement as part of Market Domain Data (MDD) v224 on 21 January 2015.
Post-meeting ELEXON informs Openreach of the SVG's decision.
Recommendations
Openreach Charge Code Application 23
We invite you to:
a) NOTE Openreach’s new BSC application for 45 UMS Charge Codes;
b) NOTE the approach and criteria agreed by the SVG for assessing whether the new
Charge Codes deliver sufficient predictability of the equipment’s consumption for
Settlement;
c) NOTE that ELEXON has applied this approach and criteria to the Charge Codes
sought by Openreach, and that all the Charge Codes have passed the SVG’s agreed
measurement of predictability;
d) PROVIDE any observations and comments on the analysis results, for inclusion in
our paper to the SVG; and
e) NOTE that we will invite the SVG to approve the 45 Openreach Charge Codes at its
meeting on 2 December 2014, for use in Settlement from 21 January 2015.