Embed Size (px)
Citation preview
COWASH Training OPENOFFICE CALC 1
Kimmo Koivumäki [email protected] MoWIE / COWASH GIS Expert +251 939 175 931 Addis Ababa
OPENOFFICE CALC FOR WASH FACILITY
DATA COLLECTORS AND -MANAGERS OpenOffice (OO) is a software pack similar to Microsoft (MS) Office. This guide uses OpenOffice Calc (OOC) which is
similar to MS Excel to teach the basic skills needed in COWASH WASH facility database management for mapping
purposes. OO is delivered with the COWASH-training package. It can also be downloaded from the OO-website.
CONTENTS
Requirements for OpenOffice installation .......................................................................................................................... 2
Installing OOC ................................................................................................................................................................. 2
Basics of the OOC................................................................................................................................................................ 3
Managing tools ............................................................................................................................................................... 3
Selecting, copying, pasting and importing data .............................................................................................................. 3
Sorting ............................................................................................................................................................................. 5
Exercise 1 .................................................................................................................................................................... 5
Summing ......................................................................................................................................................................... 7
Terminology and Basics of GIS-Database ........................................................................................................................... 8
Converting the NWI M&E MIS – Excel sheet for GIS-software ........................................................................................... 9
Exercise 2 .................................................................................................................................................................. 10
Creating Comma Separated value (.CSV) -file for Quantum GIS ....................................................................................... 11
Disabling the thousands separator ............................................................................................................................... 12
Pivot table ......................................................................................................................................................................... 13
Exercise 3 .................................................................................................................................................................. 14
Simple pie-chart ................................................................................................................................................................ 15
Exercise 4 .................................................................................................................................................................. 16
Exercise 5 .................................................................................................................................................................. 16
COWASH Training OPENOFFICE CALC 2
Kimmo Koivumäki [email protected] MoWIE / COWASH GIS Expert +251 939 175 931 Addis Ababa
REQUIREMENTS FOR OPENOFFICE INSTALLATION
Requirements are for the newest 4.1.1 version. If your computer’s performance is not good, use the 3.0 version.
Operating system:
Windows (XP, 2003, Vista, 7, 8) o 256 Mbytes RAM (512 MB RAM recommended) o At least 650 Mbytes available disk space for a default install (including a JRE) via download. After
installation and deletion of temporary installation files, Apache OpenOffice will use approximately 440 Mbytes disk space.
o 1024 x 768 or higher resolution with at least 256 colors
GNU/Linux (Linux kernel version 2.6 or higher, glibc2 version 2.5 or higher) o 256 Mbytes RAM (512 MB recommended) o 400 Mbytes available disk space o X-Server with 1024 x 768 or higher resolution with at least 256 colors
Mac OS X (Mac OS X 10.7 (Lion) or higher) o Intel Processor o Free memory of 512 Mbytes RAM o 400 Mbytes available disk space o 1024 x 768 or higher resolution with 16.7 Million colors
Accessibility:
Java o The Java Runtime Environment (JRE) 1.5.x, is the minimum version required to use full Apache
OpenOffice functions that need Java (see Java and Apache OpenOffice.) However, we strongly recommend the last version of Oracle Java 1.6.x, patch level 45, or the latest Oracle Java 7, or, for Linux users, OpenJDK 6, build 27, or OpenJDK 7.
o Installation of GNOME 2.10 or higher
INSTALLING OOC
OO-suite includes several different office software which can be used for example for spreadsheet calculations, word
processing and presentations (i.e. OO Writer is similar to MS Word and OO Impress is similar to MS PowerPoint).
Copy the installation package (either “Apache_OpenOffice_4.1.1_Win_x86_install_en-US” or
“OOo_3.0.0_Win32Intel_install_en-US” depending on the performance of your computer) for example to your
computer’s desktop.
Double click the installation package and follow the instructions.
COWASH Training OPENOFFICE CALC 3
Kimmo Koivumäki [email protected] MoWIE / COWASH GIS Expert +251 939 175 931 Addis Ababa
BASICS OF THE OOC
Most of the basic functions and tools of the OOC are similar to Excel even though the icons and processes might be
little different. First exercises are for getting familiarized with the basic actions and the user interface.
MANAGING TOOLS
Launch the OOC from the Start-menu. If you don’t have the shortcut in Desktop or on the first page of Start-menu,
select Start -> All Programs -> OpenOffice 4.1.1 -> OpenOffice Calc
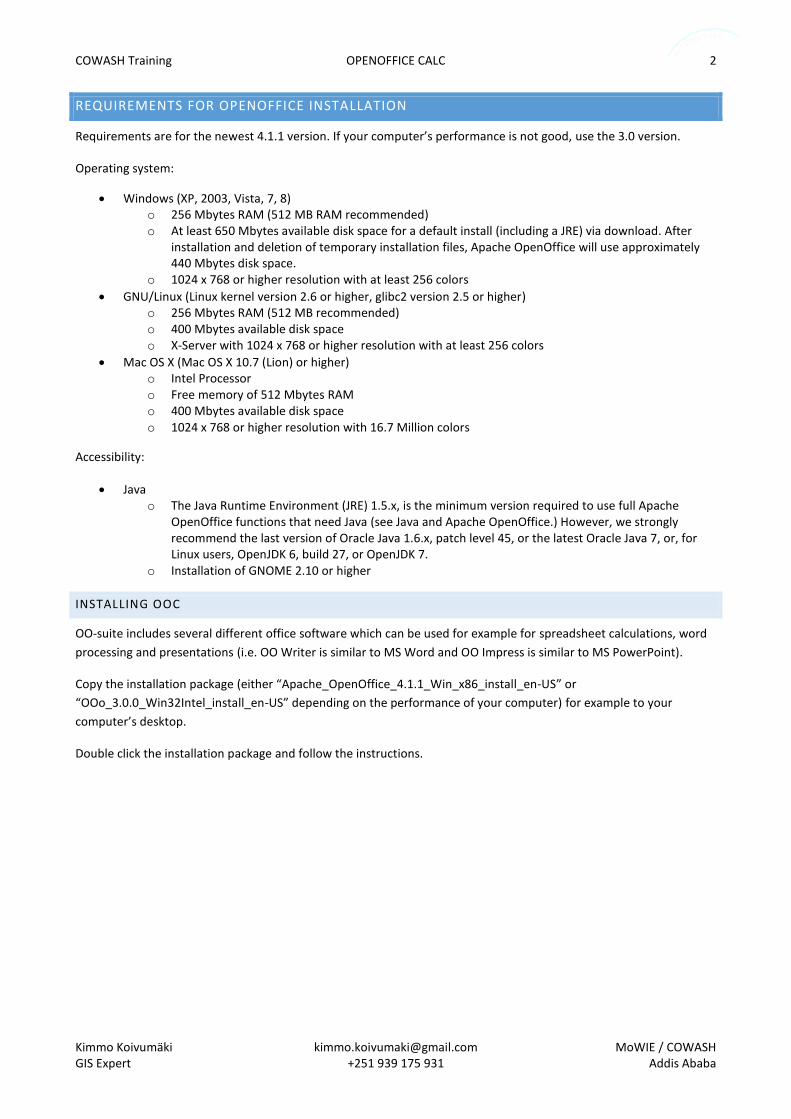
The basic tools needed for our purposes can be found in Formatting- and Standard -toolsets. Also Formula-bar is
needed. Manage the tools from the main toolbar View -> Toolbars. Uncheck all the unnecessary tools (Image 1). We
need the Status Bar and Column & Row Headers visible in the View-menu but you can remove Sidebar (Image 1).
SELECTING, COPYING, PASTING AND IMPORTIN G DATA
You can use Excel-files normally with OOC. Only thing to remember is that if you also need to save the file in Excel-
format after work, you need to change the file type to “.xls” when saving. In this example we are importing data from
text file (.txt).
Let us next import some training data to OOC. Open the “training_data.txt” –text file with Notepad from the Training
OpenOfficeCalc / OOC-Data –folder by double clicking the file. Select all data from the main toolbar Edit -> Select All.
You can also press CTRL and key “A” simultaneously.
Copy the data by clicking on selected (blue) area with right mouse button and by selecting Copy from opening menu.
You can also press CTRL and letter “C” simultaneously.
Next go back to the OOC and click the cell in the top left corner with right mouse button and from the opening menu
select Paste. You can also press CTRL and key “V” simultaneously.
Image 1. Setting the toolbars accordingly to the needs
COWASH Training OPENOFFICE CALC 4
Kimmo Koivumäki [email protected] MoWIE / COWASH GIS Expert +251 939 175 931 Addis Ababa
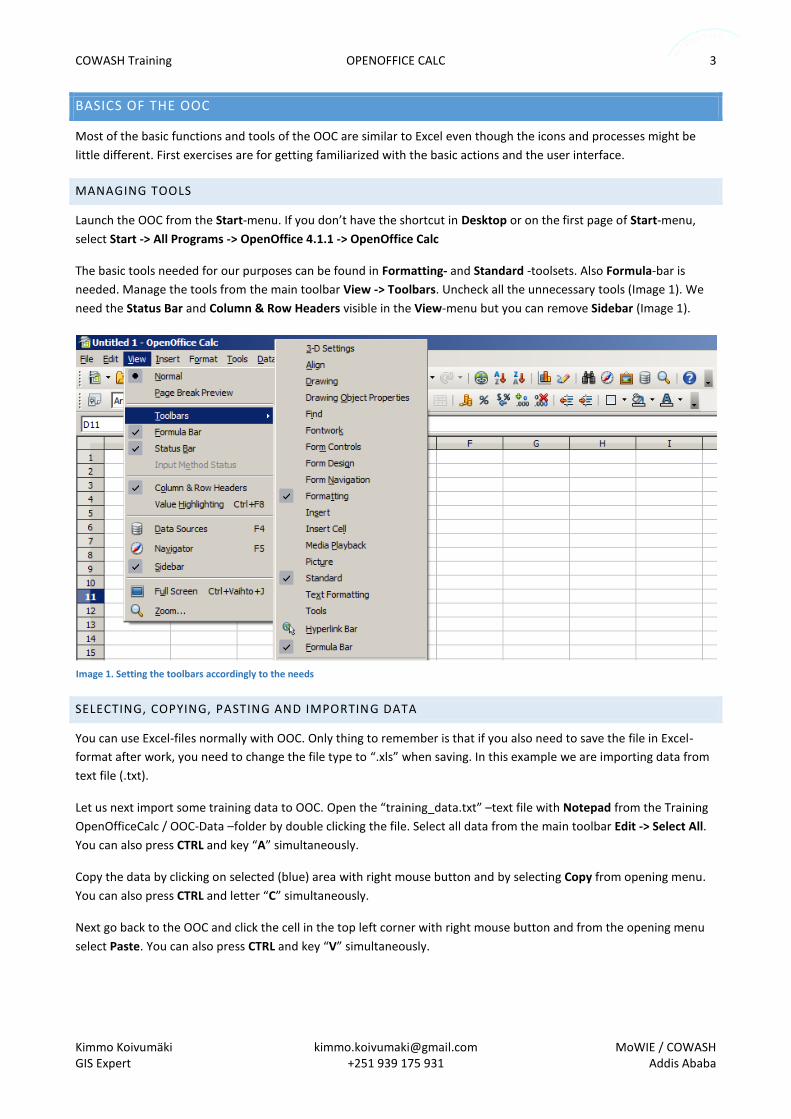
From the opening Text Import-window check that in Separator options –section the Separated by –option is selected
and Tab-checkbox is checked. You can also visually examine the lower window that the data looks correctly organized
like in Image 2.
Then click OK.
Red arrow head on the right side of the cell indicates that all content in the cell doesn’t fit in it. Next adjust the page
so that everything is seen.
Select all by pressing CTRL + A simultaneously. Right click selected area and select Format cells… then select
Alignment-tab and uncheck the Wrap text automatically –checkbox and click OK.
Learning by heart at least following Windows-shortcuts will improve your efficiency with Windows generally
CTRL + A Select all CTRL + V Paste CTRL + Z Undo CTRL + X Cut CTRL + Y Redo CTRL + S Save CTRL + C Copy CTRL + F Find
It is also useful to learn to select multiple items or files with left mouse button by keeping CTRL-button pressed down. You can also select all units between A and B by keeping Shift-key pressed while clicking first A and then B.
Image 2. Settings for importing text-data
COWASH Training OPENOFFICE CALC 5
Kimmo Koivumäki [email protected] MoWIE / COWASH GIS Expert +251 939 175 931 Addis Ababa
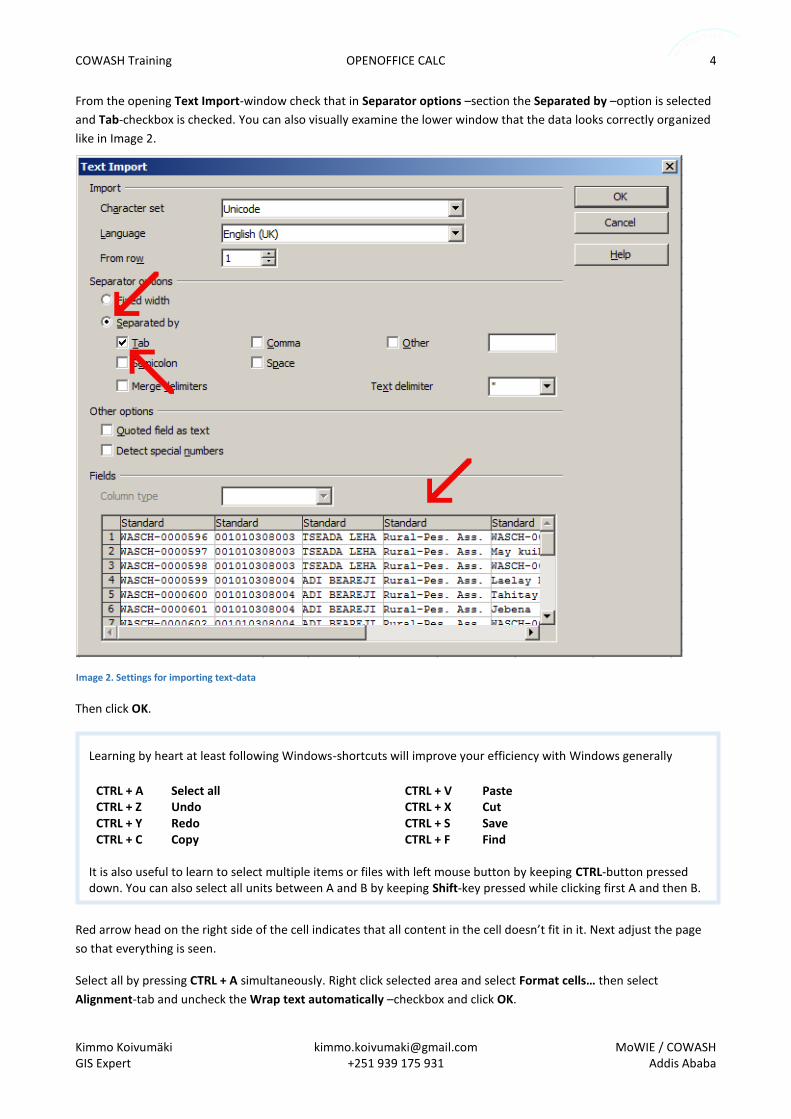
Still when all content is selected double click the small border between the Column Headers (Image 3). This will
automatically show all content of the cells without cell contents being wrapped to several lines.
SORTING
It is often needed to sort the WASH-facility data in numerical or alphabetical order accordingly to different attributes.
In this example we need to see quickly how many different Source Types there are in our training data. This is done
with Sort Ascending and Sort Descending –tools (Image 4).
Sort the data accordingly to the “Source Type” -attribute. Select the column by clicking on the letter (“I”) in Column
Header. Next click Sort Ascending –tool (Image 4) and on the opening window, click Extend selection –button.
IMPORTANT: This selection arranges all the data instead of only selected column (Source Type). In practice you should
always select this option when managing WASH-facility database. Otherwise the database will be messed up.
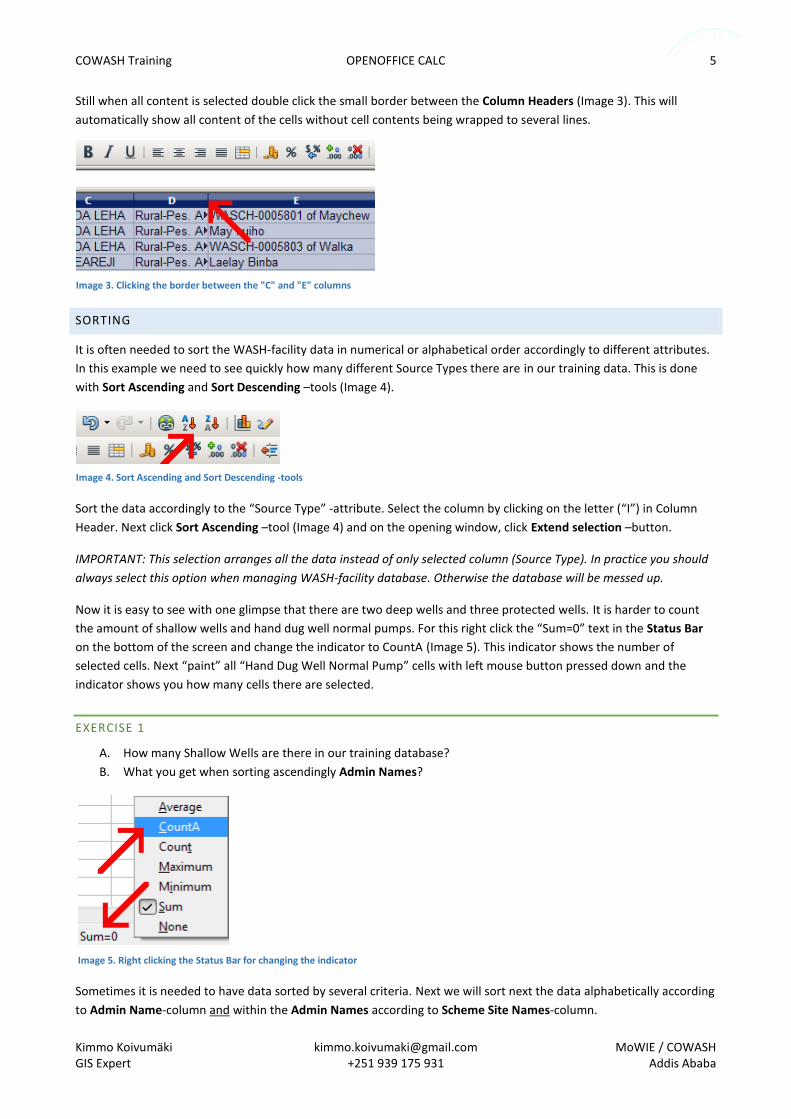
Now it is easy to see with one glimpse that there are two deep wells and three protected wells. It is harder to count
the amount of shallow wells and hand dug well normal pumps. For this right click the “Sum=0” text in the Status Bar
on the bottom of the screen and change the indicator to CountA (Image 5). This indicator shows the number of
selected cells. Next “paint” all “Hand Dug Well Normal Pump” cells with left mouse button pressed down and the
indicator shows you how many cells there are selected.
EXERCISE 1
A. How many Shallow Wells are there in our training database?
B. What you get when sorting ascendingly Admin Names?
Sometimes it is needed to have data sorted by several criteria. Next we will sort next the data alphabetically according
to Admin Name-column and within the Admin Names according to Scheme Site Names-column.
Image 3. Clicking the border between the "C" and "E" columns
Image 4. Sort Ascending and Sort Descending -tools
Image 5. Right clicking the Status Bar for changing the indicator
COWASH Training OPENOFFICE CALC 6
Kimmo Koivumäki [email protected] MoWIE / COWASH GIS Expert +251 939 175 931 Addis Ababa
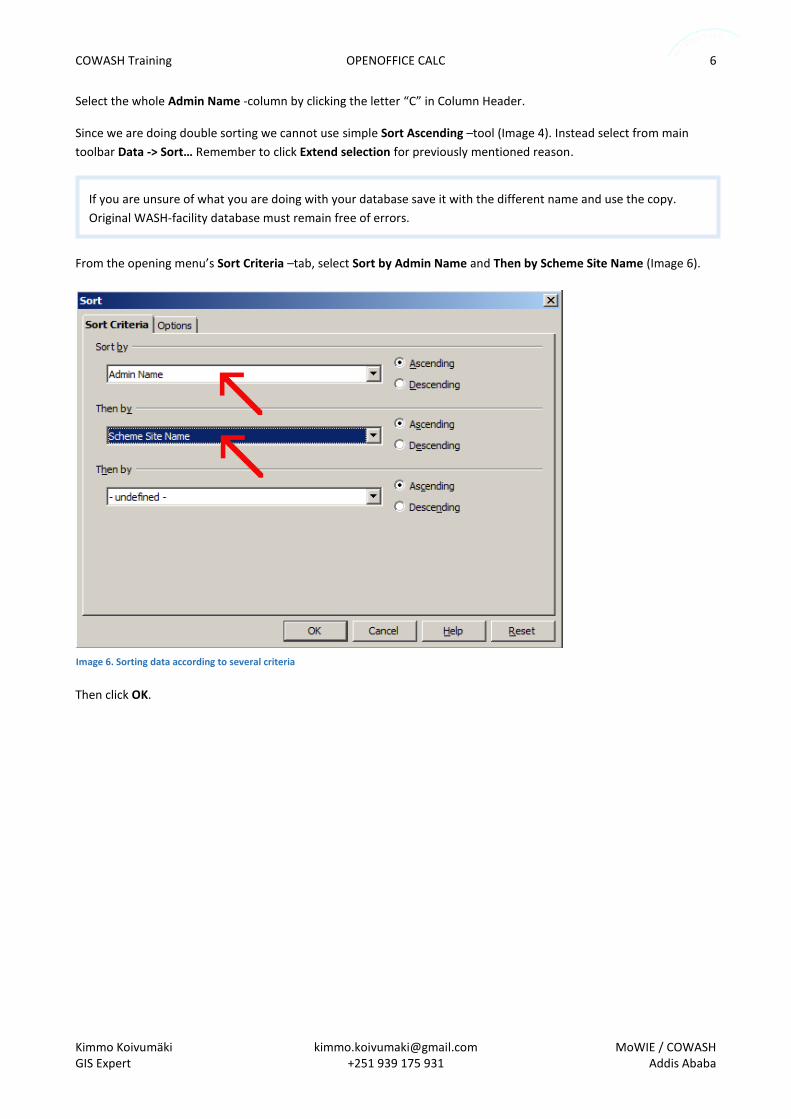
Select the whole Admin Name -column by clicking the letter “C” in Column Header.
Since we are doing double sorting we cannot use simple Sort Ascending –tool (Image 4). Instead select from main
toolbar Data -> Sort… Remember to click Extend selection for previously mentioned reason.
From the opening menu’s Sort Criteria –tab, select Sort by Admin Name and Then by Scheme Site Name (Image 6).
Then click OK.
If you are unsure of what you are doing with your database save it with the different name and use the copy.
Original WASH-facility database must remain free of errors.
Image 6. Sorting data according to several criteria
COWASH Training OPENOFFICE CALC 7
Kimmo Koivumäki [email protected] MoWIE / COWASH GIS Expert +251 939 175 931 Addis Ababa
SUMMING
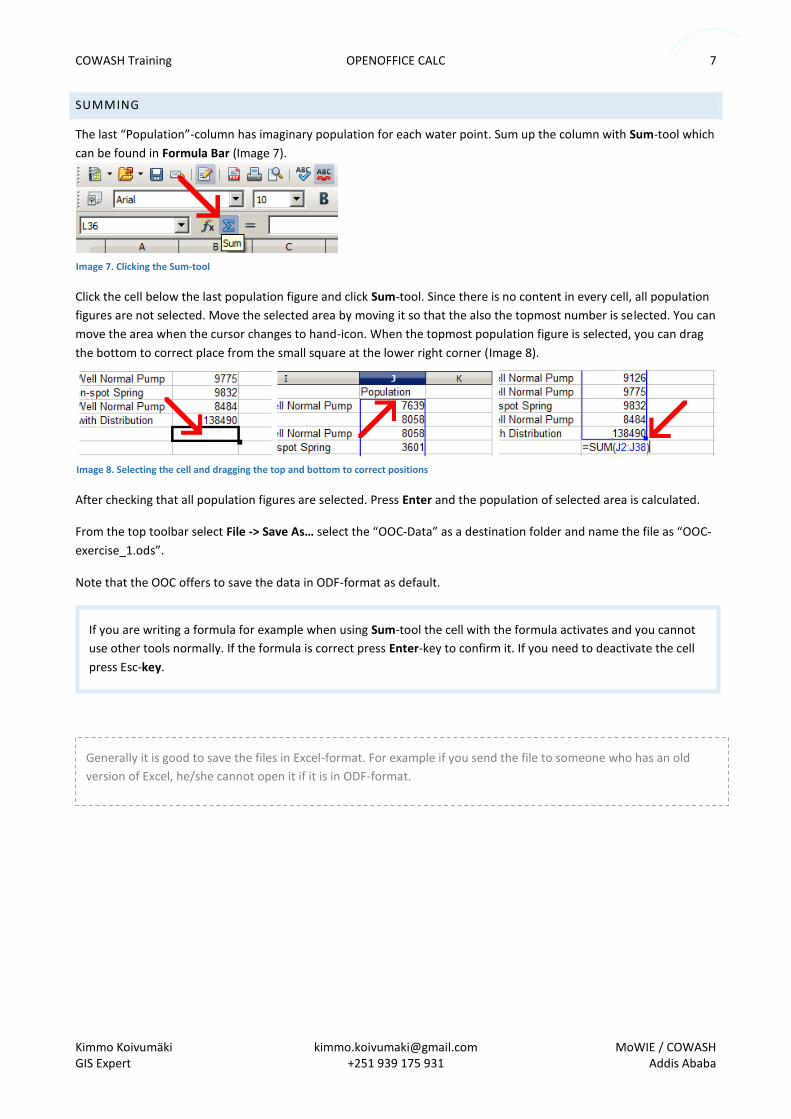
The last “Population”-column has imaginary population for each water point. Sum up the column with Sum-tool which
can be found in Formula Bar (Image 7).
Click the cell below the last population figure and click Sum-tool. Since there is no content in every cell, all population
figures are not selected. Move the selected area by moving it so that the also the topmost number is selected. You can
move the area when the cursor changes to hand-icon. When the topmost population figure is selected, you can drag
the bottom to correct place from the small square at the lower right corner (Image 8).
After checking that all population figures are selected. Press Enter and the population of selected area is calculated.
From the top toolbar select File -> Save As… select the “OOC-Data” as a destination folder and name the file as “OOC-
exercise_1.ods”.
Note that the OOC offers to save the data in ODF-format as default.
If you are writing a formula for example when using Sum-tool the cell with the formula activates and you cannot
use other tools normally. If the formula is correct press Enter-key to confirm it. If you need to deactivate the cell
press Esc-key.
Image 7. Clicking the Sum-tool
Image 8. Selecting the cell and dragging the top and bottom to correct positions
Generally it is good to save the files in Excel-format. For example if you send the file to someone who has an old
version of Excel, he/she cannot open it if it is in ODF-format.
COWASH Training OPENOFFICE CALC 8
Kimmo Koivumäki [email protected] MoWIE / COWASH GIS Expert +251 939 175 931 Addis Ababa
TERMINOLOGY AND BASICS OF GIS-DATABASE
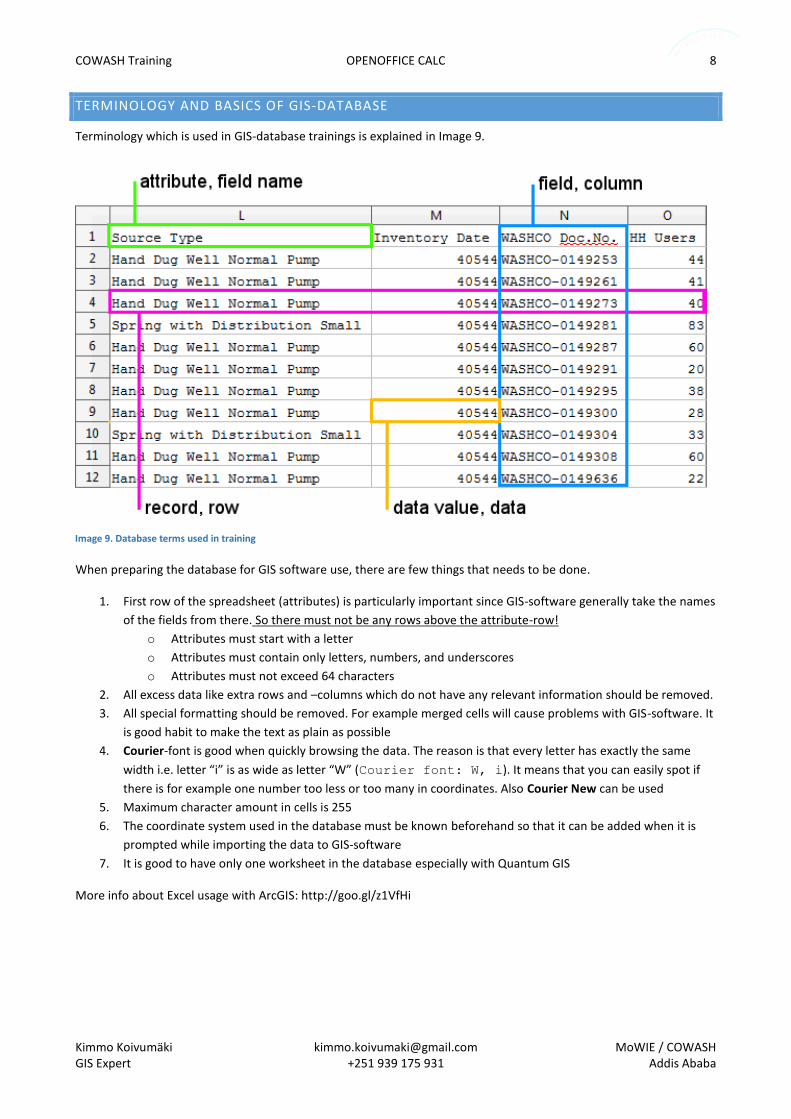
Terminology which is used in GIS-database trainings is explained in Image 9.
When preparing the database for GIS software use, there are few things that needs to be done.
1. First row of the spreadsheet (attributes) is particularly important since GIS-software generally take the names
of the fields from there. So there must not be any rows above the attribute-row!
o Attributes must start with a letter
o Attributes must contain only letters, numbers, and underscores
o Attributes must not exceed 64 characters
2. All excess data like extra rows and –columns which do not have any relevant information should be removed.
3. All special formatting should be removed. For example merged cells will cause problems with GIS-software. It
is good habit to make the text as plain as possible
4. Courier-font is good when quickly browsing the data. The reason is that every letter has exactly the same
width i.e. letter “i” is as wide as letter “W” (Courier font: W, i). It means that you can easily spot if
there is for example one number too less or too many in coordinates. Also Courier New can be used
5. Maximum character amount in cells is 255
6. The coordinate system used in the database must be known beforehand so that it can be added when it is
prompted while importing the data to GIS-software
7. It is good to have only one worksheet in the database especially with Quantum GIS
More info about Excel usage with ArcGIS: http://goo.gl/z1VfHi
Image 9. Database terms used in training
COWASH Training OPENOFFICE CALC 9
Kimmo Koivumäki [email protected] MoWIE / COWASH GIS Expert +251 939 175 931 Addis Ababa
CONVERTING THE NWI M&E MIS – EXCEL SHEET FOR GIS-SOFTWARE
Open Yilmana Densa woreda’s “Water – Schemes Baseline.xls” –file from OOC-Data-folder. This file has been
downloaded from NWI M&E MIS. For opening the file you can just drag it on OOC window from the OOC-Data-folder.
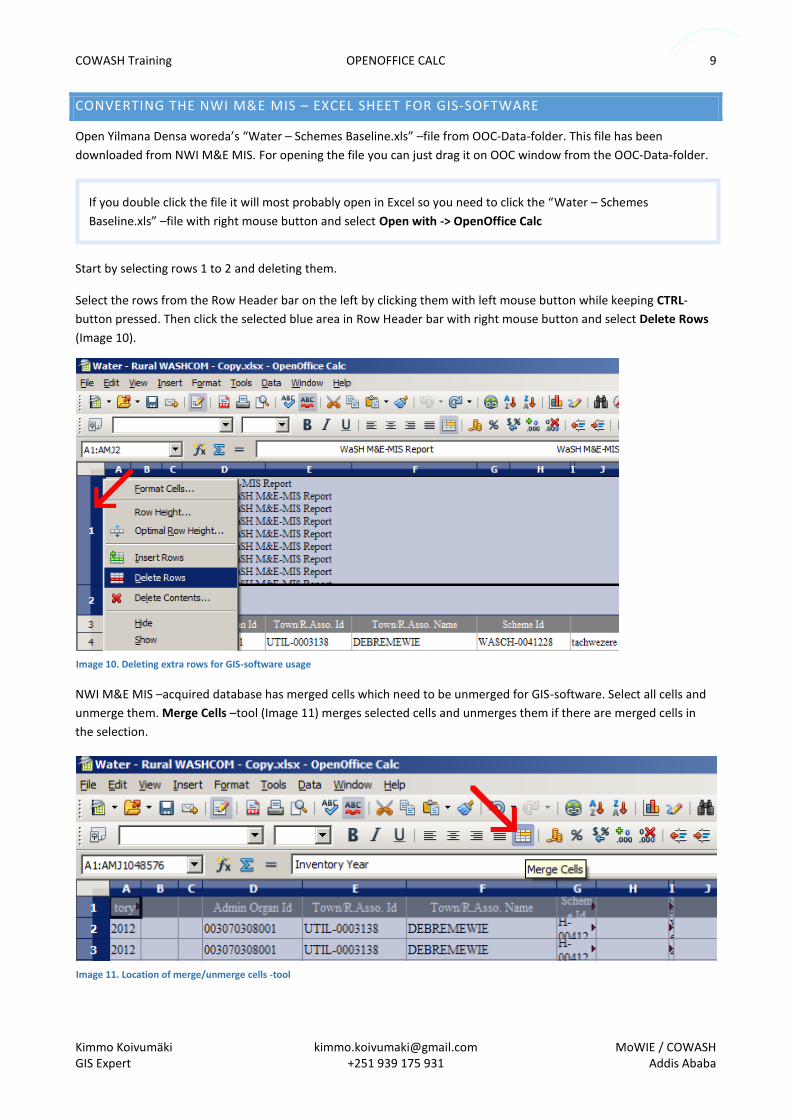
Start by selecting rows 1 to 2 and deleting them.
Select the rows from the Row Header bar on the left by clicking them with left mouse button while keeping CTRL-
button pressed. Then click the selected blue area in Row Header bar with right mouse button and select Delete Rows
(Image 10).
NWI M&E MIS –acquired database has merged cells which need to be unmerged for GIS-software. Select all cells and
unmerge them. Merge Cells –tool (Image 11) merges selected cells and unmerges them if there are merged cells in
the selection.
If you double click the file it will most probably open in Excel so you need to click the “Water – Schemes
Baseline.xls” –file with right mouse button and select Open with -> OpenOffice Calc
Image 10. Deleting extra rows for GIS-software usage
Image 11. Location of merge/unmerge cells -tool
COWASH Training OPENOFFICE CALC 10
Kimmo Koivumäki [email protected] MoWIE / COWASH GIS Expert +251 939 175 931 Addis Ababa
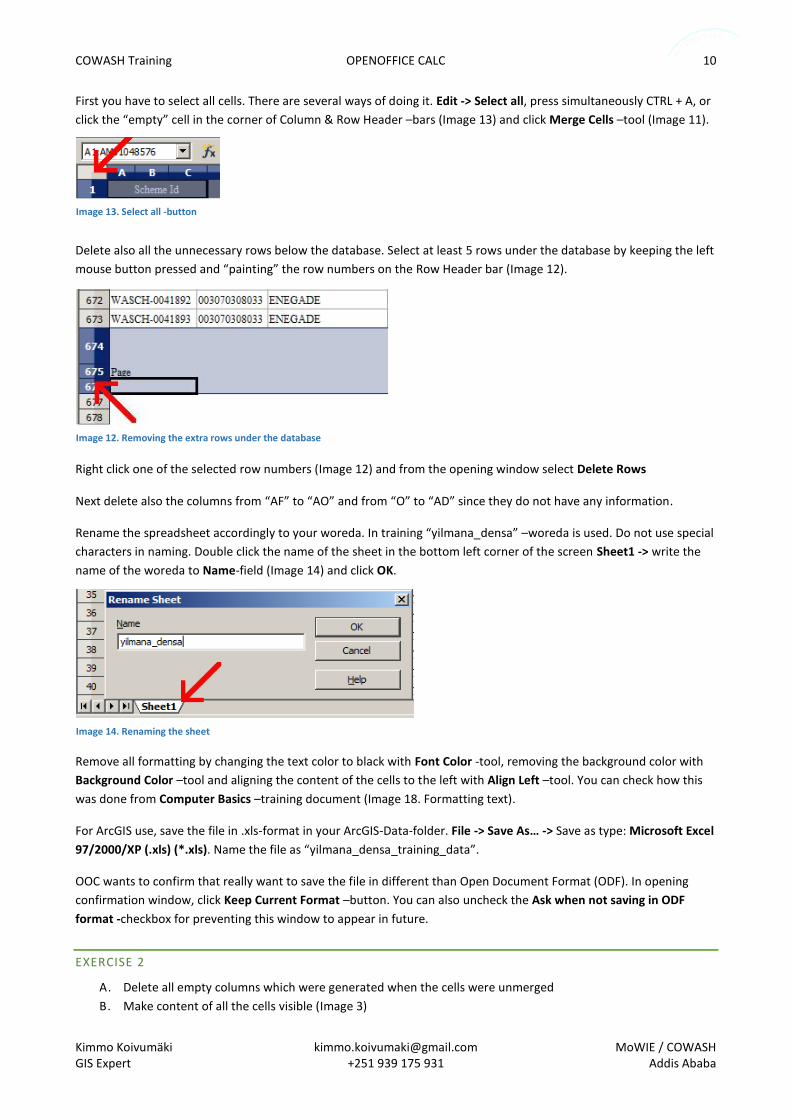
First you have to select all cells. There are several ways of doing it. Edit -> Select all, press simultaneously CTRL + A, or
click the “empty” cell in the corner of Column & Row Header –bars (Image 13) and click Merge Cells –tool (Image 11).
Delete also all the unnecessary rows below the database. Select at least 5 rows under the database by keeping the left
mouse button pressed and “painting” the row numbers on the Row Header bar (Image 12).
Right click one of the selected row numbers (Image 12) and from the opening window select Delete Rows
Next delete also the columns from “AF” to “AO” and from “O” to “AD” since they do not have any information.
Rename the spreadsheet accordingly to your woreda. In training “yilmana_densa” –woreda is used. Do not use special
characters in naming. Double click the name of the sheet in the bottom left corner of the screen Sheet1 -> write the
name of the woreda to Name-field (Image 14) and click OK.
Remove all formatting by changing the text color to black with Font Color -tool, removing the background color with
Background Color –tool and aligning the content of the cells to the left with Align Left –tool. You can check how this
was done from Computer Basics –training document (Image 18. Formatting text).
For ArcGIS use, save the file in .xls-format in your ArcGIS-Data-folder. File -> Save As… -> Save as type: Microsoft Excel
97/2000/XP (.xls) (*.xls). Name the file as “yilmana_densa_training_data”.
OOC wants to confirm that really want to save the file in different than Open Document Format (ODF). In opening
confirmation window, click Keep Current Format –button. You can also uncheck the Ask when not saving in ODF
format -checkbox for preventing this window to appear in future.
EXERCISE 2
A. Delete all empty columns which were generated when the cells were unmerged
B. Make content of all the cells visible (Image 3)
Image 12. Removing the extra rows under the database
Image 14. Renaming the sheet
Image 13. Select all -button
COWASH Training OPENOFFICE CALC 11
Kimmo Koivumäki [email protected] MoWIE / COWASH GIS Expert +251 939 175 931 Addis Ababa
CREATING COMMA SEPARATED VALUE (.CSV) -FILE FOR QUANTUM GIS
CSV is a file type where simple tabular data (numbers and text) is saved in plain-text form. You can import
spreadsheet databases to QGIS when they are in .csv-format.
Open the yilmana_densa_training_data.xls –file which was generated in previous exercise. Right-click the file and
select Open with -> OpenOffice Calc
Save the file in .csv-format.
File -> Save As… -> Save as type: Text CSV (.csv) (*.csv). Click Ok.
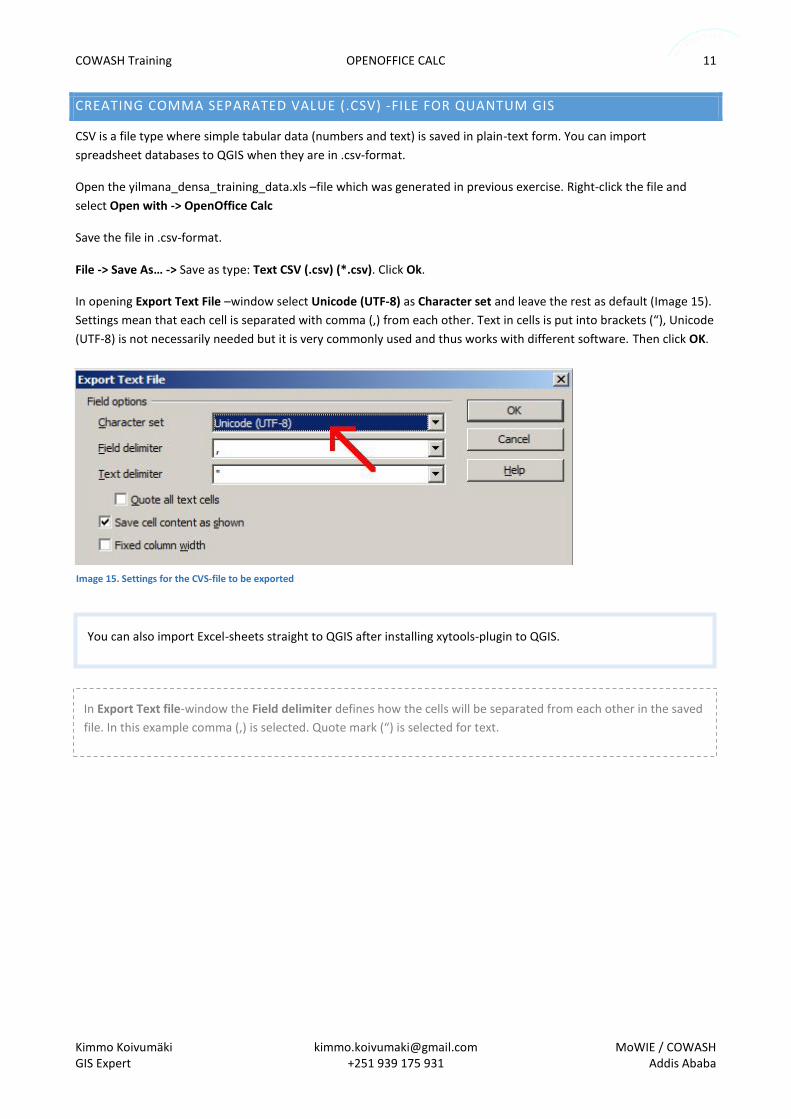
In opening Export Text File –window select Unicode (UTF-8) as Character set and leave the rest as default (Image 15).
Settings mean that each cell is separated with comma (,) from each other. Text in cells is put into brackets (“), Unicode
(UTF-8) is not necessarily needed but it is very commonly used and thus works with different software. Then click OK.
In Export Text file-window the Field delimiter defines how the cells will be separated from each other in the saved
file. In this example comma (,) is selected. Quote mark (“) is selected for text.
Image 15. Settings for the CVS-file to be exported
You can also import Excel-sheets straight to QGIS after installing xytools-plugin to QGIS.
COWASH Training OPENOFFICE CALC 12
Kimmo Koivumäki [email protected] MoWIE / COWASH GIS Expert +251 939 175 931 Addis Ababa
DISABLING THE THOUSANDS SEPARATOR
As a principle, the spreadsheet database should be reduced from all formatting to work well in GIS-software. For
example using thousand separator can cause problems.
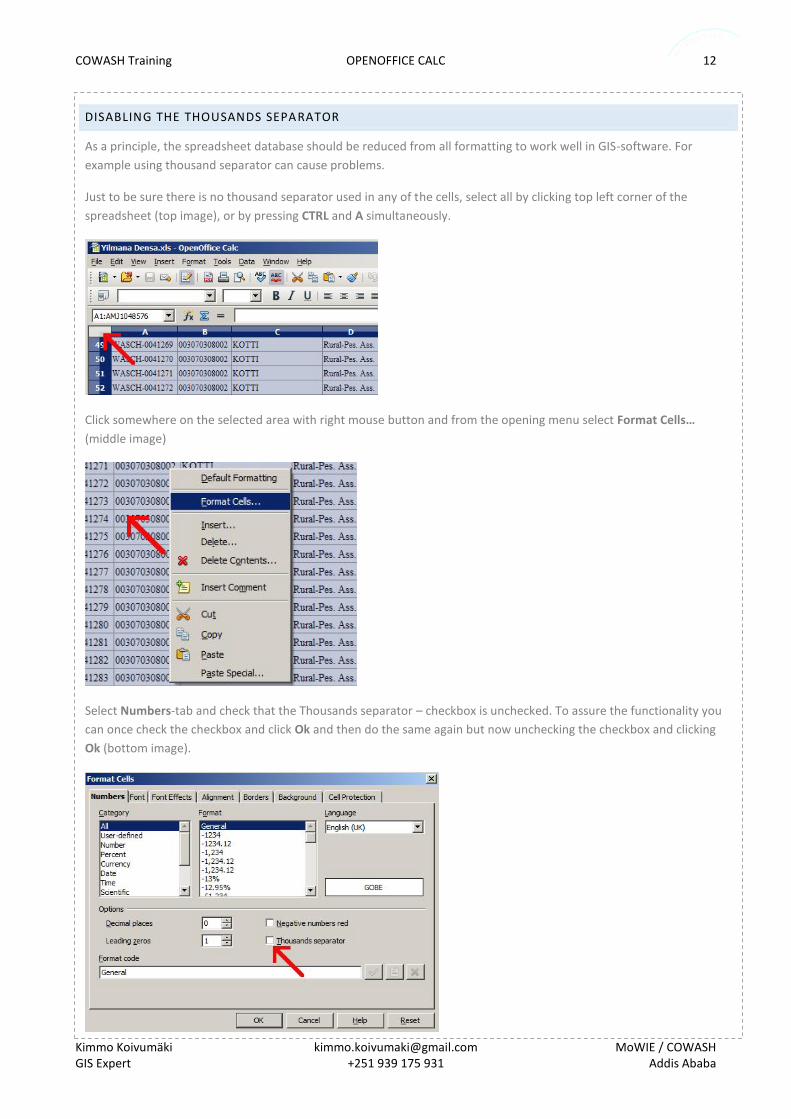
Just to be sure there is no thousand separator used in any of the cells, select all by clicking top left corner of the
spreadsheet (top image), or by pressing CTRL and A simultaneously.
Click somewhere on the selected area with right mouse button and from the opening menu select Format Cells…
(middle image)
Select Numbers-tab and check that the Thousands separator – checkbox is unchecked. To assure the functionality you
can once check the checkbox and click Ok and then do the same again but now unchecking the checkbox and clicking
Ok (bottom image).
COWASH Training OPENOFFICE CALC 13
Kimmo Koivumäki [email protected] MoWIE / COWASH GIS Expert +251 939 175 931 Addis Ababa
PIVOT TABLE
Pivot table is a tool for comparing and extracting information from large amount of data without using formulas. In
this exercise we will check how many of the Yilmana Densa woreda’s water points are functional.
Open the Water – Rural WASHCOM.xls –file from the OOC-Data-folder. It is another Yilmana Densa-woreda file
downloaded from NWI M&E MIS. Database has been prepared for GIS-software like we did in section “Converting the
NWI M&E MIS – Excel Sheet for GIS-software”. Right click the file and select Open with -> OpenOffice Calc.
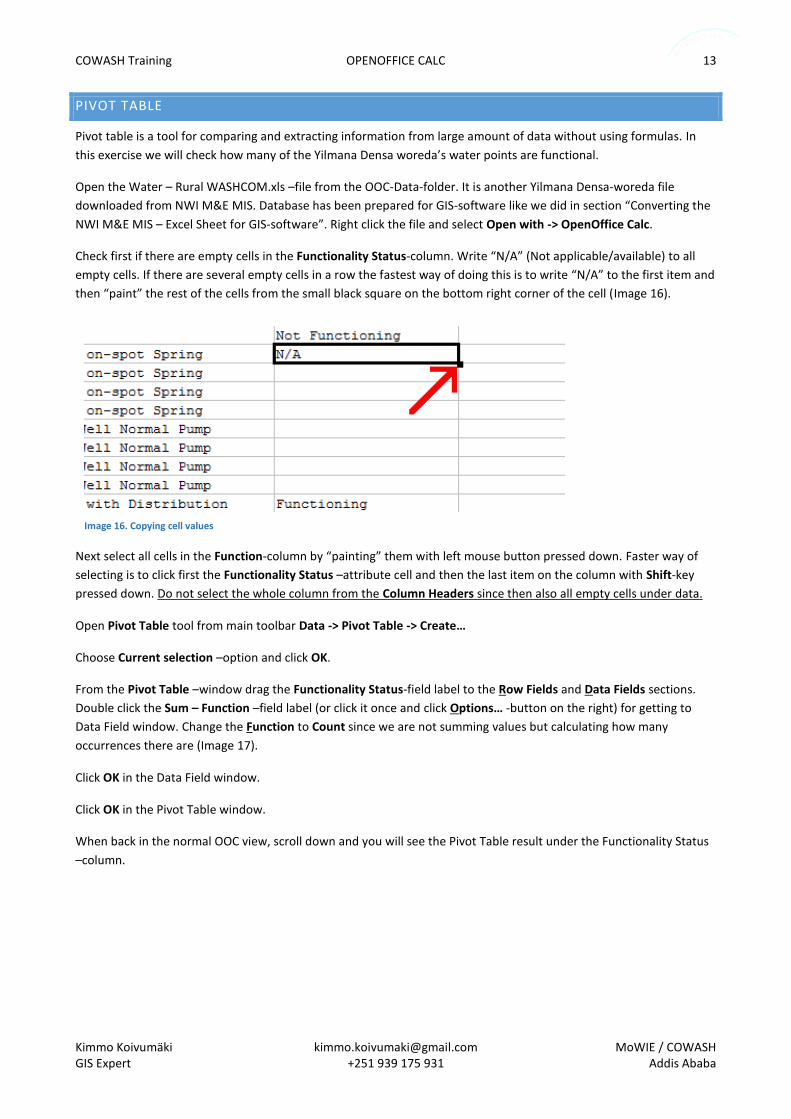
Check first if there are empty cells in the Functionality Status-column. Write “N/A” (Not applicable/available) to all
empty cells. If there are several empty cells in a row the fastest way of doing this is to write “N/A” to the first item and
then “paint” the rest of the cells from the small black square on the bottom right corner of the cell (Image 16).
Next select all cells in the Function-column by “painting” them with left mouse button pressed down. Faster way of
selecting is to click first the Functionality Status –attribute cell and then the last item on the column with Shift-key
pressed down. Do not select the whole column from the Column Headers since then also all empty cells under data.
Open Pivot Table tool from main toolbar Data -> Pivot Table -> Create…
Choose Current selection –option and click OK.
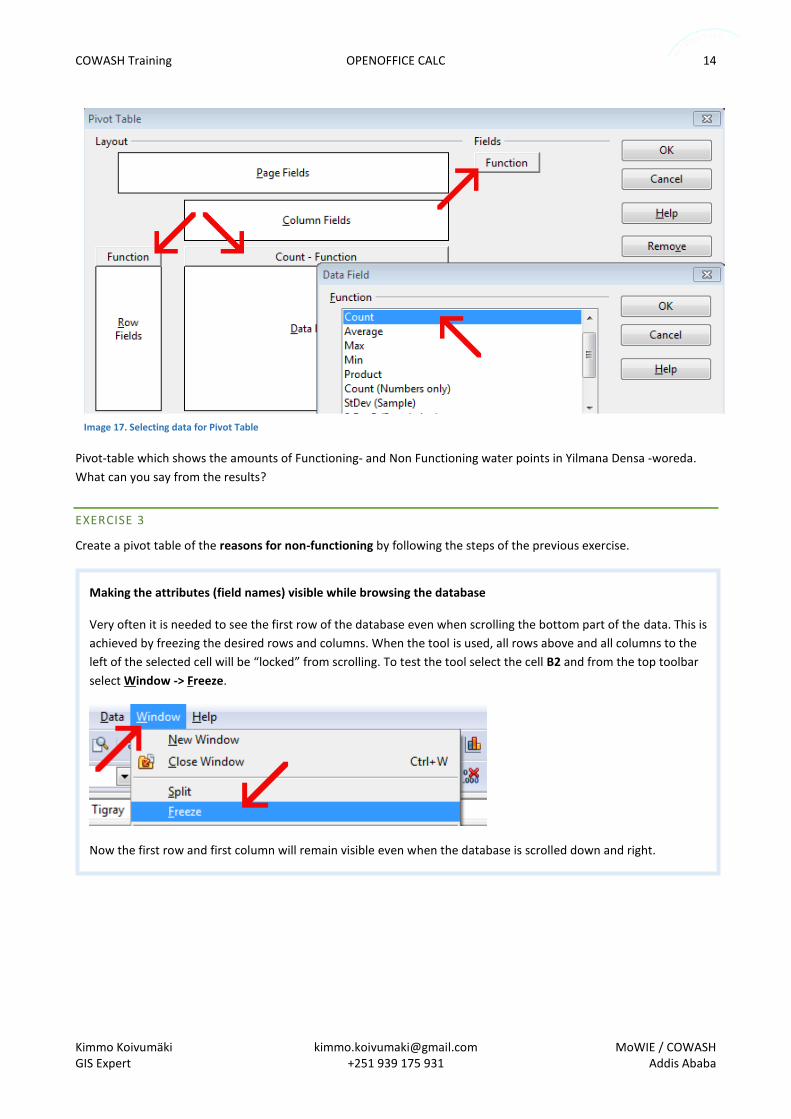
From the Pivot Table –window drag the Functionality Status-field label to the Row Fields and Data Fields sections.
Double click the Sum – Function –field label (or click it once and click Options… -button on the right) for getting to
Data Field window. Change the Function to Count since we are not summing values but calculating how many
occurrences there are (Image 17).
Click OK in the Data Field window.
Click OK in the Pivot Table window.
When back in the normal OOC view, scroll down and you will see the Pivot Table result under the Functionality Status
–column.
Image 16. Copying cell values
COWASH Training OPENOFFICE CALC 14
Kimmo Koivumäki [email protected] MoWIE / COWASH GIS Expert +251 939 175 931 Addis Ababa
Pivot-table which shows the amounts of Functioning- and Non Functioning water points in Yilmana Densa -woreda.
What can you say from the results?
EXERCISE 3
Create a pivot table of the reasons for non-functioning by following the steps of the previous exercise.
Image 17. Selecting data for Pivot Table
Making the attributes (field names) visible while browsing the database
Very often it is needed to see the first row of the database even when scrolling the bottom part of the data. This is
achieved by freezing the desired rows and columns. When the tool is used, all rows above and all columns to the
left of the selected cell will be “locked” from scrolling. To test the tool select the cell B2 and from the top toolbar
select Window -> Freeze.
Now the first row and first column will remain visible even when the database is scrolled down and right.
COWASH Training OPENOFFICE CALC 15
Kimmo Koivumäki [email protected] MoWIE / COWASH GIS Expert +251 939 175 931 Addis Ababa
SIMPLE PIE-CHART
Next let’s observe the results of the pivot table in a pie chart. To position the chart clearly create another sheet by
right-clicking the empty area in the bottom bar on the right side of the existing sheet(s) and selecting Insert Sheet…
from the opening menu. Give for example a name “Charts” into Name-field and click OK. Go to the new sheet by
clicking it active from the bottom bar.
From the Standard toolbar, select Chart-tool (Image 18).
Chart Wizard launches. In the first page select Pie-option from the Choose a chart type –section and click Next >>-
button.
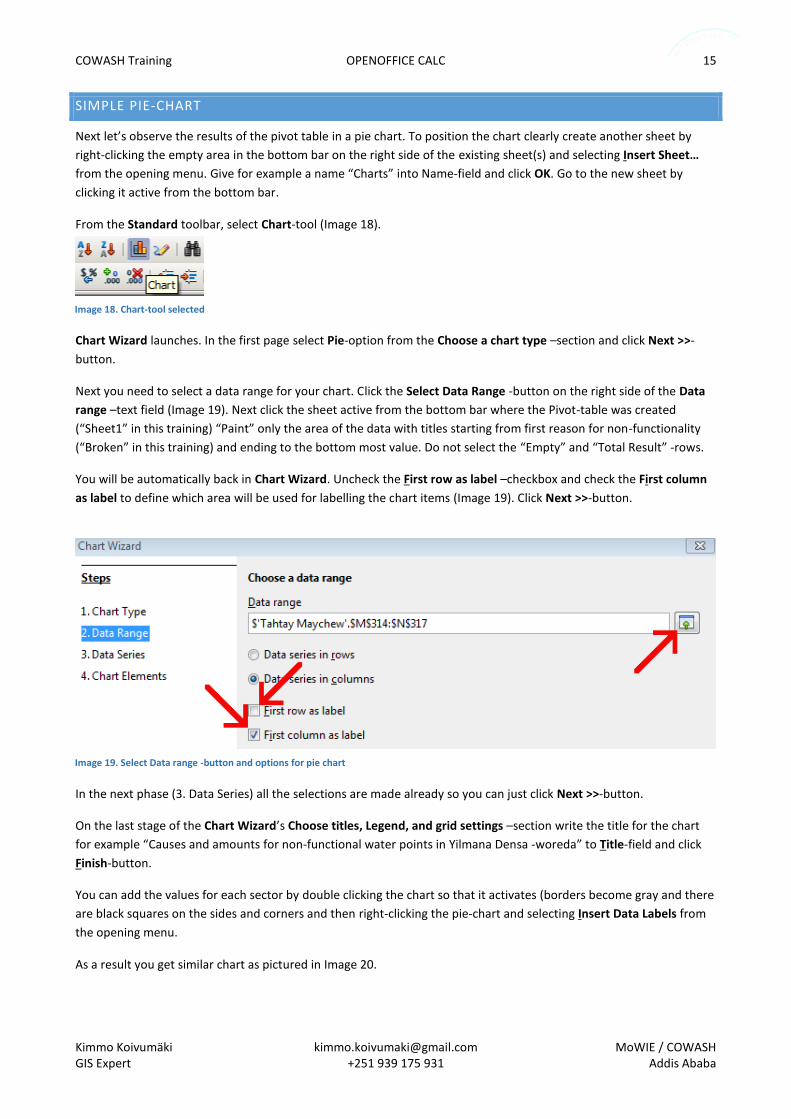
Next you need to select a data range for your chart. Click the Select Data Range -button on the right side of the Data
range –text field (Image 19). Next click the sheet active from the bottom bar where the Pivot-table was created
(“Sheet1” in this training) “Paint” only the area of the data with titles starting from first reason for non-functionality
(“Broken” in this training) and ending to the bottom most value. Do not select the “Empty” and “Total Result” -rows.
You will be automatically back in Chart Wizard. Uncheck the First row as label –checkbox and check the First column
as label to define which area will be used for labelling the chart items (Image 19). Click Next >>-button.
In the next phase (3. Data Series) all the selections are made already so you can just click Next >>-button.
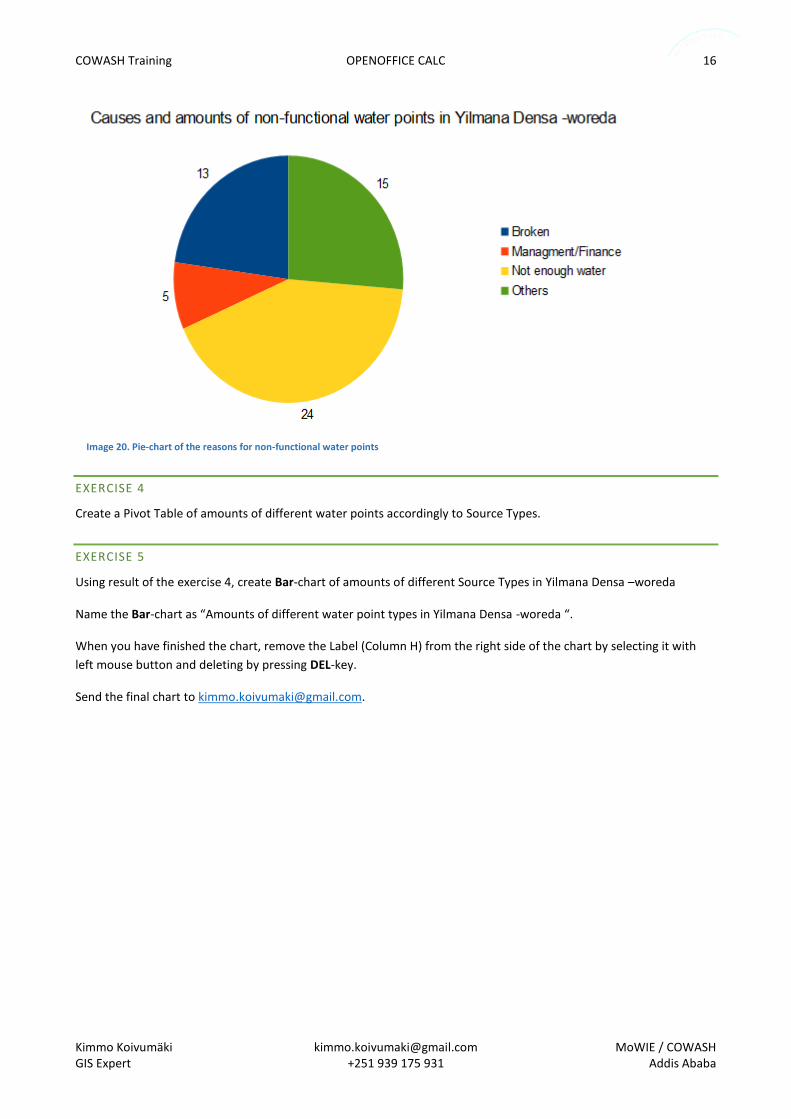
On the last stage of the Chart Wizard’s Choose titles, Legend, and grid settings –section write the title for the chart
for example “Causes and amounts for non-functional water points in Yilmana Densa -woreda” to Title-field and click
Finish-button.
You can add the values for each sector by double clicking the chart so that it activates (borders become gray and there
are black squares on the sides and corners and then right-clicking the pie-chart and selecting Insert Data Labels from
the opening menu.
As a result you get similar chart as pictured in Image 20.
Image 18. Chart-tool selected
Image 19. Select Data range -button and options for pie chart
COWASH Training OPENOFFICE CALC 16
Kimmo Koivumäki [email protected] MoWIE / COWASH GIS Expert +251 939 175 931 Addis Ababa
EXERCISE 4
Create a Pivot Table of amounts of different water points accordingly to Source Types.
EXERCISE 5
Using result of the exercise 4, create Bar-chart of amounts of different Source Types in Yilmana Densa –woreda
Name the Bar-chart as “Amounts of different water point types in Yilmana Densa -woreda “.
When you have finished the chart, remove the Label (Column H) from the right side of the chart by selecting it with
left mouse button and deleting by pressing DEL-key.
Send the final chart to [email protected].
Image 20. Pie-chart of the reasons for non-functional water points