Embed Size (px)
Citation preview

Prepared for: Prepared by:
Infrastructure Consortium for Africa (ICA)
C/O African Development Bank
15 Avenue de Ghana
BP 323, 1002 Tunis Belvédère
Tunisia
www.icafrica.org
www.afdb.org
Steer Davies Gleeve
28 – 32 Upper Ground
London
SE1 9PD
www.steerdaviesgleave.com
Opening Up Aviation Services in Africa
Phase I Review Report Liberalization Policies & Implementation, Demand & Supply Dynamics, Hubs, Fares/Taxes/Fees & Charges


Opening up Aviation Services in Africa
Contents
CONTENTS
EXECUTIVE SUMMARY ...................................................................................... I
Introduction ........................................................................................... i
Africa: a demographic and economic overview ............................................... ii
Overview of air transport policy in selected African States ................................. ii
Aviation in Africa: supply & demand ............................................................. v
Other barriers to the development of aviation in Africa ................................... vii
Proposed Phase 2 actions ........................................................................ xiii
1 INTRODUCTION ..................................................................................... 1
Context ................................................................................................ 1
This study .............................................................................................. 1
This document ........................................................................................ 2
2 METHODOLOGY ..................................................................................... 5
Introduction ........................................................................................... 5
Literature Review .................................................................................... 5
Review of African countries’ aviation policies .................................................. 5
Schedule and passenger movement analysis .................................................... 5
Stakeholder consultation ........................................................................... 6
3 AFRICA: A DEMOGRAPHIC AND ECONOMIC OVERVIEW ...................................... 9
Summary ............................................................................................... 9
Introduction ........................................................................................... 9
Africa overview ....................................................................................... 9
City rankings ........................................................................................ 11
4 OVERVIEW OF AIR TRANSPORT POLICY IN SELECTED AFRICAN STATES ............... 13
Summary ............................................................................................. 13
Introduction ......................................................................................... 14
Legal frameworks in place ....................................................................... 14
Policy in practice: stakeholder comments .................................................... 18
5 AVIATION IN AFRICA: SUPPLY & DEMAND .................................................... 21
Summary ............................................................................................. 21
Introduction ......................................................................................... 22
Air services .......................................................................................... 24
Connectivity ........................................................................................ 33

Opening up Aviation Services in Africa
Contents
Hubs .................................................................................................. 35
Fifth Freedom Rights .............................................................................. 43
Fleet .................................................................................................. 44
6 OTHER BARRIERS TO THE DEVELOPMENT OF AVIATION IN AFRICA..................... 49
Summary ............................................................................................. 49
Introduction ......................................................................................... 50
Fares ................................................................................................. 50
Taxes, fees and charges .......................................................................... 53
Aviation safety in Africa .......................................................................... 56
Infrastructure ....................................................................................... 63
Availability of finance ............................................................................. 64
7 PROPOSED PHASE 2 ACTIONS ................................................................... 69
Summary ............................................................................................. 69
Introduction ......................................................................................... 70
Barriers to expanding aviation services in Africa ............................................ 70
Opportunities for addressing the barriers to aviation ....................................... 72
Proposals for action ............................................................................... 73
FIGURES
Figure E.1 African cities: GDP, population and departing seats .................. ii
Figure E.2 Traffic (departing seats) at top 20 airports, by carrier ............... v
Figure E.3 Connecting journeys at key African airports ........................... vi
Figure E.4 Fifth Freedom routes in operation in Africa, 2012 ................... vii
Figure E.5 Fares analysis: price per km (USD) vs distance ...................... viii
Figure E.6 ICAO level of USOAP implementation..................................... x
Figure 3.1 African cities: GDP, population and departing seats ................ 11
Figure 4.1 Weighted Air Liberalisation Index for selected States ............... 17
Figure 5.1 Map of Africa showing OAG regions ..................................... 23
Figure 5.2 Traffic (departing seats) by route type at top 20 airports in Africa
by size (seats), sept 2012-aug 2013) .................................... 24
Figure 5.3 Share of capacity (departing seats) by route type at top 20 airports
in africa by size (seats), sept 2012 – Aug 2013 ........................ 26
Figure 5.4 Traffic (departing seats) by carrier type at top 20 airports in Africa
by size (seats), sep 2012 – Aug 2013 .................................... 27

Opening up Aviation Services in Africa
Contents
Figure 5.5 Point to point and triangular routing at the Top 10 airports
(Northern and Southern regions) ........................................ 29
Figure 5.6 Point to point and triangular routing at the Top 10 airports (Eastern
and Western & Central regions) ......................................... 30
Figure 5.7 Traffic growth 2005 -2012 (summer and winter), South Africa .... 31
Figure 5.8 Traffic growth 2005 -2012 (summer and winter), Nigeria ........... 31
Figure 5.9 Traffic growth 2005 -2012 (summer and winter), Kenya ............ 32
Figure 5.10 Traffic growth 2005 -2012 (summer and winter), Ghana ............ 32
Figure 5.11 Connectivity of Journeys originating at African airports, Sep 2012 –
Aug 2013 ..................................................................... 33
Figure 5.12 Total journeys and the proportion of journeys connecting at larger
(by journeys) airports, by region (Sept 2012 – Aug 2013) ........... 36
Figure 5.13 Top 20 indirect domestic and intra-regional journeys, Sept 2012 –
Aug 2013 (excluding JNB connections) ................................. 37
Figure 5.14 Top 20 indirect Intra-African Journeys plus top 3 hubbing on other
Continent, Sept 2012 – Aug 2013 (Excluding JNB connections). ... 38
Figure 5.15 Top 20 indirect intercontinental Journeys, Sept 2012 – Aug 2013 . 40
Figure 5.16 Top 22 intercontinental journeys, excl. domestic connections,
Middle East – Middle East connections and leisure routes, Sept 2012
– Aug 2013 ................................................................... 42
Figure 5.17 Fifth Freedom routes in operation in Africa, 2012 ................... 44
Figure 6.1 Fares analysis: price per km (USD) vs distance ....................... 51
Figure 6.2 Taxes, fees and charges at selected African and non-African
airports ....................................................................... 55
Figure 6.3 Number of accidents and Rate (2012) .................................. 57
Figure 6.4 ICAO Level of USOAP implementation .................................. 58
Figure 6.5 Aircraft Lease Companies in Africa ..................................... 65
Figure 7.1 African Aviation Root cause analysis .................................... 71
TABLES
Table E.1 Air liberalisation index and number of ASAs for selected African
and non-African States ..................................................... iii
Table 3.1 Africa: key country overview ............................................. 10
Table 4.1 Air Liberalisation Index and number of ASAs for selected African
and non-African States .................................................... 16
Table 5.1 Airport three-letter code key ............................................ 24

Opening up Aviation Services in Africa
Contents
Table 5.2 Airport three-letter code key ............................................ 34
Table 5.3 Proportion of direct journeys with origin Africa, by region (Sept
2012 – Aug 2013) ............................................................ 35
Table 5.4 Airport three-letter code key ............................................ 37
Table 5.5 Airport three-letter code key ............................................ 39
Table 5.6 Airport three-letter code key ............................................ 40
Table 5.7 Airport three-letter code key ............................................ 42
Table 5.8 African Aircraft Fleet ...................................................... 45
Table 5.9 Relative Fleet sizes by order/operating Status ....................... 45
Table 5.10 Split of Aircraft Fleets by manufacturer ............................... 46
Table 5.11 African Airline Fleet Sizes ................................................ 47
Table 6.1 Africa Accidents summary, 2012 and 2013 ............................ 57
Table 6.2 ICAO implementation plans .............................................. 59
Table 6.3 African airlines: IOSA registry ............................................ 60
APPENDICES
A COUNTRY PROFILES
B BIBLIOGRAPHY

Opening up Aviation Services in Africa
i
Executive Summary
Introduction
1. The World Bank’s Africa Infrastructure Country Diagnostics (AICD) study1 provides
analysis of infrastructure gaps, including for aviation, where lack of airline
competition and the development of regional airport hubs are noted as important
constraints The Programme for Infrastructure Development in Africa (PIDA), a
continent wide programme, builds on this analysis and has identified a number of
priority projects (PIDA Priority Action Plan -PAP)2 which, if implemented would
help interconnect, integrate and transform the continent. These include a number
of projects that relate to the aviation sector.
2. A recent study commissioned by the Infrastructure Consortium for Africa (ICA)
Transport Sector Platform3 highlighted both the potential for private sector
participation in Africa, as well as a number of issues that constrain or discourage
involvement.
3. This study aims to build on this foundation work and assist African stakeholders in
addressing the next steps in promoting efficient African aviation services. The
overall objective is to contribute to addressing the barriers to the expansion of
effective aviation services across Africa through analysis and targeted
interventions in support of relevant PIDA - PAP projects. Specifically, the study
assesses the Yamoussoukro Decision implementation, and West Africa Air Transport
and Central Africa Air Transport Hubs.
4. The study is divided into two phases:
I Phase 1: Review and Analysis; and
I Phase 2: Detailed study.
5. Phase 1 included analysis and consultation activities in order to review recent
developments, assess the current situation and identify key issues under the two
main areas of work:
I Assistance to implement more fully the Yamoussoukro Decision and address the
associated barriers to developing the African airline industry; and
I Review the case and scope for establishing regional aviation hubs in Western
and possibly Central Africa.
6. The output of Phase 1 is this document, the Review Report, which will identify the
focus for the Phase 2, which may highlight specific areas for action under one or
both of the two main areas of work (Yamoussoukro and regional hubs)
1 Africa infrastructure Country Diagnostics(AICD) study- Africa’s Infrastructure: A Time for Transformation; World
Bank et al
2 Programme for Infrastructure Development in Africa – Priority Action Plan www.au-pida.org
3 Assessment of the potential for private participation in the maritime and air transport sectors in Africa, Steer
Davies Gleave, 2012

Opening up Aviation Services in Africa
ii
Africa: a demographic and economic overview
7. Africa’s population is growing rapidly. The current high population growth rate
began in the second half of the 20th century, when the number of people on the
continent almost quadrupled from 230 million to 811 million. By 2010 this number
reached one billion and if current demographic trends persist, Africa’s population
will be 1.4 billion in 2025 and 1.9 billion by 2050.
8. The size and rate of expansion of a country or city’s population, its wealth and
trade activity are all indicators of the level of aviation activity that might be
expected. Cities with a large population and GDP and high airline capacity (seats)
may indicate a potential location for a viable hub. Our review of population, GDP
and departing seats for the top 18 African cities by PPP-adjusted GDP (2008 data)
found that Nairobi and Addis Ababa, two existing hubs in Eastern Africa, display a
relatively high level of departing seats compared to population levels. Lagos in
West Africa has a relatively high population and number of departing seats
however does not operate as a hub to the same extent that, say, Lomé in Togo
does, despite Lomé having very low levels of departing seats and population. See
the Figure E.1 below.
FIGURE E.1 AFRICAN CITIES: GDP, POPULATION AND DEPARTING SEATS
Source: OAG, PwC Global city rankings 2008, Steer Davies Gleave analysis
Overview of air transport policy in selected African States
Legal frameworks in place
9. In order to understand the legal framework and the level of liberalisation on
paper, a number of key African States were selected for a desktop review of their
aviation policies and legislative context, in order to provide an overall impression
of the level of liberalisation of air services in the States considered.
10. The Air Services Agreement Projector (ASAP) is an analytical tool devised by the
World Trade Organisation (WTO) that analyses bilateral Air Services Agreements
(ASAs) in order to assess their level of liberalisation. The WTO has devised indices
that give an indication of the level of liberalisation of any given ASA and of the air
transport policy of a particular State. The Weighted Air Liberalization Index (WALI)
0
20
40
60
80
100
120
140
160
-
5
10
15
20
25
30
PP
P-a
dj
GD
P (
US
D,
$b
n)
Po
pu
lati
on
/De
p.S
ea
ts (
mil
lio
n)
Population Departing Seats PPP-adj GDP (USDbn, 2008)

Opening up Aviation Services in Africa
iii
is a synthetic measure of the level of liberalisation of the air transport policy of a
given Signatory. It is calculated as an average of the indices of all the air service
agreements concluded by that Signatory, weighted by the respective traffic they
cover and ranges between zero for the most restrictive, and fifty, for the most
open. The Standard WALI for selected African states is shown in Table E.1, along
with the number of bilateral ASAs for each State. We have also included a number
of non-African states as a comparator.
TABLE E.1 AIR LIBERALISATION INDEX AND NUMBER OF ASAS FOR SELECTED
AFRICAN AND NON-AFRICAN STATES
Source: World Trade Organisation, Steer Davies Gleave analysis
11. The higher the WALI index, the more open a State's ASAs are. Whilst the non-
African countries show more liberalised ASAs, there is not a significant gap
between them and the more open African countries, such as Nigeria, Ghana and
Ethiopia. It must be noted that, as a multilateral agreement, the Common
Aviation Area in Europe is not included in the analysis. If it were, the scores for
the UK and France would be significantly higher.
Relevant international aviation treaties
12. Two key treaties/decisions in Africa relating to liberalisation in the aviation
market are the Yamoussoukro Decision and the ECOWAS Treaty.
13. The objective of the Yamoussoukro Decision (YD) is defined under Article 2, Scope
of Application, as the gradual liberalisation of scheduled and non-scheduled intra-
African air transport services. The Abuja Treaty, which formally entered into
force on 12 May 1994, is recognised as the legal basis for the YD. Of the 54 African
states, 44 have signed and formally ratified the Abuja Treaty and as a result
Standard weighting
closed <-----------------> open
Egypt 7 41
South Africa 11.6 54
Nigeria 12.4 20
Ghana 12.2 26
Zambia 10.4 13
Senegal 9.6 21
Ivory Coast 6.8 22
Ethiopia 11.6 18
Kenya 7.7 27
Tanzania 11.4 23
Dem Rep Congo 8.7 12
France 13.6 63
UK 14.3 96
Turkey 11.3 52
Argentina 16.1 33
Indonesia 14.3 26
SignatoryNumber of Bilateral
ASAs
Opening up Aviation Services in Africa
iv
became parties to the YD. The other 10 states (Djibouti, Equatorial Guinea,
Eritrea, Gabon, Madagascar, Mauritania, Morocco, Somalia, South Africa, and
Swaziland) cannot be considered parties.
14. In theory, therefore, signatory States should have a liberalised air transport
market in operation both within and between them. In practice, however, this is
not the case. All sources confirmed that Yamoussoukro had not been
implemented, or had only been partly implemented, and indeed whilst we are
aware that Yamoussoukro is cited on occasion in bilateral ASAs, it is not, in
practice, taken into account during negotiations for air traffic rights .
15. The 1975 Treaty establishing the Economic Community of West African States
(ECOWAS) States (revised in 1993) includes a chapter on co-operation in transport,
communications and tourism. We understand that the Fifth Freedom rights granted
to airlines as part of this treaty has led to a high concentration of triangular and
multi-stop flights being operated in Western and Central Africa compared to the
rest of the continent.
Stakeholder comments
16. Stakeholders commented on three key components of the Air Services Agreements:
ownership, Fifth Freedom rights and designations of carriers by States.
Ownership issues
17. Issues of ownership are the most significant concern for African States and airlines,
particularly fastjet, which is deemed a Tanzanian carrier under Tanzanian law but
is not majority owned by African nationals. Under the YD, the carrier must be
effectively controlled by the nationals of one, or in the case of multinational
airlines, several, state parties. This issue became important immediately when
fastjet attempted to launch operations to other countries, for example, South
Africa. Whilst under Tanzanian law fastjet is a Tanzanian carrier, other countries
do not accept the designation because, under their own national legislation,
designation requires ownership (or majority ownership) by Tanzanian nationals.
Fastjet has therefore formed local partnerships in each country, such as South
Africa, taking minority equity stakes, to obtain the route rights it seeks to operate.
18. It should be noted that this issue would not be resolved even if the YD were fully
implemented, since YD includes a requirement for ownership by the relevant
country's nationals.
19. The EAC commented that, in their current drafting of region-wide air transport
liberalisation legislation, the only outstanding issue is that of ownership. African
carriers have significant concerns about well-financed non-African airlines, such as
those based in the Gulf, entering and dominating African markets, should
ownership restrictions be relaxed.
Fifth Freedom rights
20. The YD allows the multilateral exchange of up to Fifth Freedom air traffic rights
between any African YD party state using a simple notification procedure. However
a number of stakeholders, including Kenya Airways, reported issues concerning the
granting of Fifth Freedom rights. They theorised that other major sub-Saharan
African airlines (such as South African Airways, Rwanda Air and Ethiopian Airways)
would experience similar issues.

Opening up Aviation Services in Africa
v
Designations of carriers by States
21. Under the YD there is no limit on the number of carriers a State Party can
designate, as long as the carriers meet the eligibility requirements. This seems to
give rise to the possibility of State A refusing to designate a carrier wishing to
commence operations to State B, say in a situation where there is protectionist
behaviour towards a state carrier that has already been designated.
22. This demonstrates that, even if the YD were fully implemented, its provisions do
not really constitute an Open Skies arrangement, relying very much on
governmental involvement and enthusiasm to foster freedom of access for eligible
airlines. The evidence shows that such enthusiasm is often absent.
Aviation in Africa: supply & demand
Air Services
23. The continent’s 20 biggest airports account for nearly 60% of total traffic in Africa
over September 2012 – August 2013. With 22.4 million departing seats over the
period, Johannesburg airport is the largest in Africa and approximately 60% larger
than the next largest airport, Cairo. Cape Town and Durban in South Africa also
figure in the top 10, which includes Lagos, Nairobi, Casablanca, Addis Ababa,
Abuja and Algiers. The mix of domestic, intra-regional, inter-regional and
intercontinental traffic varies greatly.
24. Some interesting variations between airports are observed in the balance of local
and reciprocal carriers operating the different types of route. For example, 86% of
international capacity at Addis Ababa is provided by Ethiopian carriers compared
to 3% for Ghanaian carriers at Accra, while at Johannesburg South African carriers
offer a larger proportion of the regional capacity (70%) than reciprocal carriers do;
just over half (53%) of the intra-African capacity; and only a small proportion (15%)
of intercontinental capacity. See Figure E.2 below.
FIGURE E.2 TRAFFIC (DEPARTING SEATS) AT TOP 20 AIRPORTS, BY CARRIER
Source: OAG (Sep 2012-Aug 2013), Steer Davies Gleave analysis. Airport code key below.
0 5 10 15 20 25
JNB
CAI
CPT
LOS
NBO
CMN
ADD
DUR
ABV
ALG
TUN
ACC
DAR
KRT
LAD
TIP
MRU
RAK
DKR
SSH
Annual Seats (millions)
National Regional Other African Non-African
Opening up Aviation Services in Africa
vi
Airport Airport name Airport Airport name
JNB Johannesburg O.R. Tambo Int TUN Tunis
CAI Cairo ACC Accra
CPT Cape Town DAR Dar Es Salaam
LOS Lagos KRT Khartoum
NBO Nairobi Jomo Kenyatta Int Apt LAD Luanda
CMN Casablanca Mohammed V Apt TIP Tripoli
ADD Addis Ababa MRU Mauritius
DUR Durban King Shaka Int Apt RAK Marrakech
ABV Abuja DKR Dakar
ALG Algiers SSH Sharm El-Sheikh
25. Differences are also noted in the extent to which triangular routings are utilised in
the four African regions. Triangular routings are found to be more prevalent in
Western & Central Africa, reflecting the low levels of traffic, the lack of a
dominant airline with a central hub, and the existence of Firth Freedom traffic
rights (granted to airlines in the region under the ECOWAS treaty).
Gaps in connectivity
26. Analysis of travellers’ itineraries demonstrates the low level of connectivity at
several important African airports including Entebbe, Accra and Lagos, where a
high proportion of indirect journeys (via other airports) are undertaken. The low
level of inter-regional connectivity across the continent is also revealed, with as
few as 31% of journeys between Northern and Southern Africa found to be direct.
Hubs
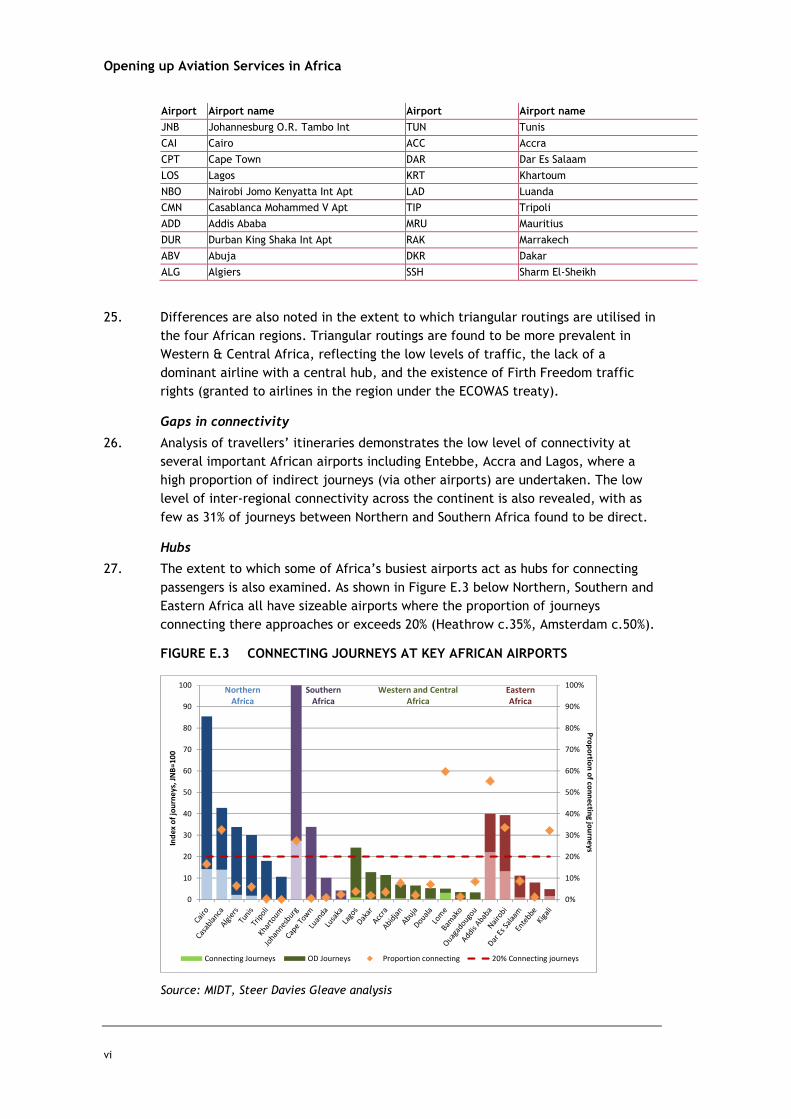
27. The extent to which some of Africa’s busiest airports act as hubs for connecting
passengers is also examined. As shown in Figure E.3 below Northern, Southern and
Eastern Africa all have sizeable airports where the proportion of journeys
connecting there approaches or exceeds 20% (Heathrow c.35%, Amsterdam c.50%).
FIGURE E.3 CONNECTING JOURNEYS AT KEY AFRICAN AIRPORTS
Source: MIDT, Steer Davies Gleave analysis
0%
10%
20%
30%
40%
50%
60%
70%
80%
90%
100%
0
10
20
30
40
50
60
70
80
90
100
Pro
po
rtion
of co
nn
ectin
g jo
urn
ey
sInd
ex
of
jou
rne
ys,
JN
B=
10
0
Connecting Journeys OD Journeys Proportion connecting 20% Connecting journeys
Northern
Africa
Southern
Africa
Western and Central
Africa
Eastern
Africa

Opening up Aviation Services in Africa
vii
28. Cairo, Casablanca, Johannesburg, Addis Ababa and Nairobi all act as hubs. Lomé is
the only airport in Western & Central Africa that might be characterised as a hub
with 60% of journeys making onward connections. Lomé, however, is small
compared with busier airports in the region, like Lagos, and considerably smaller
than hubs in other regions.
Fifth Freedom Rights
29. The figure below shows the air routes operated under Fifth Freedom rights across
Africa (Sept 12 – Aug 13, twice or more a week frequencies, more than 50k two-
way seats annually). The colours used signify the number of airlines operating a
particular Fifth Freedom route. The map shows that Fifth Freedom rights are
exercised widely in Western & Central Africa.
FIGURE E.4 FIFTH FREEDOM ROUTES IN OPERATION IN AFRICA, 2012
Source: MIDT, OAG, Steer Davies Gleave analysis
Fleet
30. Africa’s low level of connectivity is further revealed in the relatively small size of
the African airlines’ fleets. Despite representing 15% of the world’s population,
African airlines operate only 5.5% of the world’s commercial passenger and
freighter aircraft, thereby having the lowest level of aircraft per capita of any
world region. The average age of these fleets is found to be the oldest of any
world region (17 years vs 13 years for the global average), and their aircraft mix
tends to involve smaller than average aircraft.
Other barriers to the development of aviation in Africa
31. There are a number of other barriers to the development of aviation in Africa
beyond those already discussed (population, wealth, legislation and policy).

Opening up Aviation Services in Africa
viii
Fares
32. A number of stakeholders (including fastjet, the EAC, EAC-CASSOA, Arik Air and
Kenya Airways) commented that the level of aviation ticket fares in Africa is higher
than seen in other, more liberalised markets, such as the European Union.
33. We have analysed fares from several national and international routes taking in
account both direct and stop-over (to a maximum of three) flights. The
comparison has been undertaken for 26 routes, using publicly available fares data
on kayak.co.uk.
34. For the routes analysed, the average intra-European fare price per km is
approximately a third lower than the average intra-African fare. There are a
number of drivers of this difference:
I High levels of taxes, fees and charges in African States, investigated in more
detail in the following section, Taxes, fees and charges;
I Higher operational costs in Africa; and
I Increased competition as a result of market liberalisation resulting in lower
ticket prices in Europe.
FIGURE E.5 FARES ANALYSIS: PRICE PER KM (USD) VS DISTANCE
Source: kayak.co.uk, Steer Davies Gleave analysis
Operating costs
35. Both stakeholders and the literature consulted have commented on the high
operational costs that airlines face in Africa.
36. Fastjet confirmed that fuel prices are approximately 20-30% higher in Africa than
other parts of the world, and estimated lease costs to be about 20% higher than in
Europe. Arik Air also stated that financing for aircraft leases was more expensive
in Africa than other parts of the world, particularly in Nigeria, due to the
continent or country risk applied by the banks. The high operating costs for
0.16
0.14
0.12
0.11
0.13
0.32
0.150.15
0.12
0.13
0.09
0.10
0.080.08
0.14
0.13
0.09
0.06
0.05
0.06
0.11
0.09
0.08
0.05
0.08
0.10
0.12
0.06
0.14
0.11
0.07
0.13
0.10
0.15
0.080.08
0.07
0.08
0.21
0.08
0.00
0.05
0.10
0.15
0.20
0.25
0.30
0.35
0 1000 2000 3000 4000 5000 6000 7000 8000 9000 10000
Pri
ce p
er
km
(U
SD
)
Distance (km)
Within Africa Intercontinental from Africa Europe
Kigali - Nairobi
London - Berlin
Frankfurt - Naples
Paris -Marrakesh
Nairobi - Accra Lagos - Paris
Lagos - Istanbul
Kigali - Istanbul
Helsinki - Athens
Kigali - Paris
Nairobi - Paris

Opening up Aviation Services in Africa
ix
airlines in Africa are also acknowledged by the Economist, Reuters, Financial
Times (Mango Aviation Services quote), CAPA and ICAO.
Competition
37. The absence of any serious competition between carriers on many African routes is
keeping fares high. Arik Air stated that on some West African routes, loadings of
only 50% were required for profit, due to the high fares that they are able to
charge.
38. The EAC stated that the region's dependence on bilateral Air Service Agreements
(ASAs) meant that the aviation market was still artificially restricted, and that
local operators were protected regardless of their performance.
39. In cases where competition has been introduced, it has resulted in lower fares. On
the Johannesburg-Lusaka route (for which South African Airways had been the only
carrier for over 10 years), designating the South African low-cost carrier, Kulula,
as the Zambian carrier reduced fares by 33-38 percent and increased passengers by
38 percent .
40. Fastjet entered the Southern African market in 2012 with a low fares policy. The
impact of these low fares on the domestic market has been to increase the size of
the market (by 20%, according to some sources including the EAC). Interestingly,
fastjet confirmed that 38% of their passengers in their first year of operation in
Tanzania are first time flyers.
Taxes, Fees and Charges
41. Aviation is seen by many African governments as a high revenue industry; aviation
tax collection is inexpensive and convenient for Governments to raise funds. Most
of the service providers are monopoly providers and without proper regulatory
oversight of them coupled with lack of transparency and consultation has resulted
in the setting of high Taxes, Fees and Charges (TFCs). The effect of this is market
distortion, damage to the commercial viability of carriers, limitation to growth,
and diverted finance.
42. Taxes, fares and charges (passenger) at 15 African airports and at 5 other airports
around the world, have been analysed for comparison purposes. Looking at the
departure tax for regional international flights only (i.e. excluding the security,
service, safety and other charges), the average of the African airports reviewed is
30% higher when compared to non-African airports reviewed. Total TFCs at African
airports are 8% higher on average than non-African counterparts. This difference
becomes more pronounced when living conditions and the economy are factored
into account.
43. Concern over high TFCs at African airports and the potential for more airports to
reduce TFCs for regional (i.e. intra -African) flights was noted by a number of
stakeholders including EAC, EAC-CASSOA and fastjet. The EAC commented that up
to 60% of the ticket price is taxes and that tackling the problem of high TFCs
would be their next focus, if they succeeded with their current attempts to
liberalise the air transport market. The EAC considered that Governments are
open to this discussion and that they are considering double tax treaties between
States for departure tax.

Opening up Aviation Services in Africa
x
Aviation safety in Africa
44. Safety oversight and consumer confidence in aviation safety in Africa has long been
an issue for African airlines. According to a World Bank study, the high accident
rate in Sub-Saharan Africa is primarily a result of poor safety standards and lax
supervision.
45. The accident rate is the International Civil Aviation Organization’s (ICAO) primary
indicator of aggregate safety in the global air transport sector. In Africa in 2012,
the accident rate (no. of accidents per million departures) is, at 5.3, the highest
among all the UN regions. At 3% of all scheduled commercial departures, Africa
accounts for the lowest percentage of global traffic volumes, but the highest
accident rate.
46. ICAO also audits the implementation of its Standard Recommended Practices and
Procedures through its Universal Safety Oversight Audit Programme (USOAP). The
aggregate USOAP effective implementation level for Africa is 44% compared to the
World average of 61%. Figure E.6 compares the level of implementation of 12
selected African countries to the global average.
FIGURE E.6 ICAO LEVEL OF USOAP IMPLEMENTATION
Source: ICAO Safety Audit Information, Steer Davies Gleave analysis
European Aviation Safety Agency (EASA) activities in Africa
47. Under its mandate for international cooperation, EASA assists States that want to
adopt European regulation and/or international safety standards. Its international
cooperation for technical activity is focused on supporting the EU Civil Aviation
Cooperation projects and the International Cooperation Forum (IFC), working with
CAAs and regional organisations to promote air safety.
710
7 7 7 9 7 7 8 7 6 7
6
10
5 6 4
77 5
75
4
8
7
10
9 76
98
7
7
6
2
7
7
9
96
3
67
5
7
6
1
7
7
10
9
9
7
9
7
9
8
4
4
9
5
10
5
4
4
8
8
3
2
4
2
65
9
7
6
6
7
4
2
4
3
4
46
8
8
8
6
6
7
5
6
3
1
9
0
10
20
30
40
50
60
70
80
Level of implementation
Aerodromes
Air Navigation Services
Accident investigation
Airworthiness
Operations
Licensing
Organization
Legislation

Opening up Aviation Services in Africa
xi
Abuja Declaration on aviation safety in Africa
48. The 2012 Abuja Declaration4 on aviation safety in Africa includes a Plan of Action
and High Level Safety Targets for African Union states. AFCAC has been directed to
establish effective monitoring and reporting mechanisms for the Declaration, other
resolutions and regional initiatives.
Stakeholder comments
49. Aviation safety in Africa is a central concern for stakeholders, although they noted
that the situation had been improving.
50. Airlines recognise the paramount importance of safe operations, with some airlines
consulted seeing the need to contract their maintenance operations to renowned
European firms rather than undertaking it themselves or using a local provider.
The increased expense was considered worth it to ensure a link to the respected
"brand" and associated safety standards of these established European companies.
51. We understand that the EAC and East Africa Commission Civil Aviation Safety and
Security Oversight Agency’s (CASSOA) progress in harmonising aviation safety
regulations is the most developed of all African Regional Economic Communities.
The EAC noted compliance with safety regulations as an issue. CASSOA is not an
enforcement agency, but exists to standardise and harmonise aviation regulations
and revisions across the EAC States. CASSOA adheres to ICAO standards, and ICAO
Annexes 1-19 (excluding Annex 9) have been harmonised, including all security
Annexes. The CAAs of EAC Member States are major shareholders.
Infrastructure
52. The availability and quality of aviation infrastructure varies across Africa. In the
North, East, and South, established hubs such as Cairo, Addis Abba, Nairobi and
Johannesburg, provide airlines with sufficient infrastructure to develop their
operations from these airports. In Western Africa, whilst some airports (Lagos,
Lomé) do provide important connectivity, infrastructure issues prevent their
development into fully operational hubs.
53. UKTI reports that there is considerable concern about the financial viability of the
development of the Nigerian aviation sector, given the inadequate financial
position of the federal and state agencies and the high debt profile of local airlines
operators. Safety and security continues to be primary concern at all Nigerian
airports. However the Nigerian Government are making efforts to develop Lagos as
an international hub in competition with Accra in Ghana, and is implementing a
transformational programme that includes airport remodelling and reconstruction.
54. The majority of stakeholders consulted concluded that Lagos, Nigeria, is the most
appropriate location for an aviation hub in West Africa, due to the size of the
economy, population of Nigeria and level of intercontinental traffic as compared
to the other options, Accra (Ghana) and Lomé (Togo). However safety issues and
the lack of infrastructure do not make it an immediately attractive choice, and
stakeholders acknowledged the attraction of alternatives such as Accra or Lomé
for airlines wishing to hub in West Africa.
4 Abuja Declaration on Aviation Safety in Africa, African Union, July 2012

Opening up Aviation Services in Africa
xii
Availability of finance
55. Airlines require access to finance both for working capital and, particularly, to
obtain aircraft. With some exceptions, the banking system in much of sub-Saharan
Africa is not well capitalised and national banks are not in a strong position to
provide the long-term financing required for aircraft purchase or long-term
aircraft leases. The small size of most African airlines and the many difficulties in
developing and operating airlines in many African countries mean that many
financial institutions are unwilling to invest in African airlines or, where they do
invest, charge higher rates than would be charged to airlines in other parts of the
world.
Aircraft leasing
56. Airfinance Journal reports that the number of African airlines using operating or
finance leases is still relatively low, at around 40%. However it is growing as
lessors have shown an increasing willingness to lend to African carriers.
Export Credit Agencies
57. As commercial debt has become increasingly difficult for airlines to access, the use
of export credit agencies (ECAs), balance sheet funding and in some cases
manufacturer provided finance (particularly through leases) has become more
common.
58. While commercial banks are generally prepared to offer airlines ECA financing, the
standard ECA product guarantees only 85% of the total transaction. This leaves
15% of the financing exposed, which banks are often unwilling to provide alone.
Development banks are therefore increasingly being used as a method of bridging
this funding gap. Set against this are new rules and legislation brought in by the
2011 Aircraft Sector Understanding (ASU) which requires each ECA to classify its
buyers/borrowers into one of eight risk categories, based on their senior unsecured
credit ratings.
59. The new ASU raises the export credit premium for all buyers/borrowers, whether
airline or lessor. However, the ASU drafters added requirements to reduce this
risk. Export credit for higher risk airlines comes with more strings attached which
will naturally supress the availability or at the very least raise the cost of finance
to weaker African carriers. The ASU also creates greater incentives to adopt the
Cape Town Convention, described below.
Cape Town Convention
60. The Convention on International Interests in Mobile Equipment and its related
Aircraft Protocol, collectively called the Cape Town Convention, came into force
for aircraft in April 2006. It creates an international registry of security interests
in aircraft and spells out creditor rights, thereby eliminating much of the
uncertainty about how creditors might fare in a local jurisdiction after an air
carrier's default or insolvency. The airlines of any country that adopts the Cape
Town Convention, making it the law of their own land, qualify for a discount of up
to 10% on their export credit premium.
61. Although the Cape Town Convention therefore appears to provide strong incentives
for improvement in local law to the benefit of aircraft lessors and financiers,
thereby helping to lower lease cost rates, our discussions with stakeholders have

Opening up Aviation Services in Africa
xiii
raised doubts as to its effectiveness in practice. Even in countries where the
Convention is in force, it is still necessary for a lessor suffering a default to get a
local court to endorse its seizure of the aircraft asset. Therefore the Cape Town
Convention, while a helpful measure, does not circumvent the need for a strong
legal system to underpin ownership rights.
Costs of aircraft finance
62. Our discussions with stakeholders on issues relating to costs of aircraft finance led
us to understand that there was an appreciation in the industry that it took longer
to reach financial close on an aircraft leasing deal than it would in developed
nations and that this ultimately added to the cost of the transaction. It was the
strength of local law, and the attitude of local Courts, which determined the
effective level of security available to lessors, rather than the country’s adherence
to the Cape Town Convention itself.
63. In developed nations, dry lease monthly rental rates tend to be below 1% of the
aircraft’s market value and we understand the larger and more successful African
carriers such as Kenyan Airways, Ethiopian Airlines and South African Airways are
able to negotiate similar lease rates. However for carriers in less developed
aviation markets, or those perceived to be higher risk, the target monthly lease
rate would typically be 1.25% to 1.5% of the aircraft’s market value with the
potential to go as high as 2%. In addition, deposits would tend to be higher in
African countries, with an additional two- to three months’ payment being held to
cover any potential default risk.
Proposed Phase 2 actions
64. In order to gain an understanding of the limitations to the expansion of aviation
services in Africa, we have undertaken a "root cause" analysis of the difficulties
faced by the industry. We have chosen to start from the perspective of air
transport users, taking the view that it is the difficulties faced by these end-users
which limit the benefits that aviation in Africa can deliver to society. On that
basis, we have defined the fundamental problem faced by the industry in Africa
as:
I 'The lack of convenient, safe and affordable air travel'.
65. Our analysis identifies three main causes for the lack of convenient, safe and
affordable air travel:
I An inadequate supply of airline flights and seats;
I High airline fares; and
I Low levels of safety.
Opportunities for addressing the barriers to aviation
66. The review of the problems faced by aviation in Africa leads to the identification
of potential areas where these may be addressed. These can be categorised into a
number of different areas, including:
I Legal and administrative changes;
I Infrastructure enhancements;
I Taxation changes; and

Opening up Aviation Services in Africa
xiv
I Aircraft financing.
Proposals for action
67. There is a broad list of potential opportunities for addressing barriers to growing
Africa's aviation industry and this needs to be refined into a more focused list of
actions that could be taken forward in Phase 2 of this Study. It should be clear
that not all of the potential opportunities may be deliverable and that, in any
case, only a few can practically be taken forward within the scope of the Study.
68. We propose to undertake this refinement following feedback from the client and
other stakeholders. We suggest some ideas below for practical steps which might
be taken forward within the Study to help realise some of the opportunities set out
above. These include:
I An analysis of the costs of African airlines: In comparison with airlines in other
parts of the world, to identify which elements of airline costs may be
inappropriately high (e.g. fuel costs, airport and navigation charges, taxation
costs, staff or other operating costs, leasing or aircraft financing charges). This
would help to focus attention on the cost areas which most urgently need
addressing.
I Growth implications: An analysis of the potential impact on the growth of
aviation of the reduction of administrative barriers or of reductions in airline
costs.
I Working with Regional Economic Communities: By helping to develop common
standards and procedures for aviation, following and possibly going beyond the
model being implemented by the EAC.
I Reviewing infrastructure constraints at airports which are credible candidates
to act as hubs in West Africa: By identifying targeted interventions for which
funding might be provided, potentially with some conditionality on introducing
more liberal access to markets (i.e. more effective implementation of
Yamoussoukro).
69. We consider that the appropriate approach is likely to include development of
analysis demonstrating the benefits removing or reducing barriers to aviation,
holding structured discussions with key stakeholders, including national and supra-
national authorities, and working with these and other stakeholders to define
approaches to work towards implementing the measures needed to achieve this.
Opening up Aviation Services in Africa
1
1 Introduction
Context
1.1 The World Bank’s Africa Infrastructure Country Diagnostics (AICD) study5 provides
analysis of infrastructure gaps, including for aviation, where lack of airline
competition and the development of regional airport hubs are noted as important
constraints The Programme for Infrastructure Development in Africa (PIDA), a
continent wide programme, builds on this analysis and has identified a number of
priority projects (PIDA Priority Action Plan -PAP)6 which, if implemented would
help interconnect, integrate and transform the continent. These include a number
of projects that relate to the aviation sector.
1.2 A recent study commissioned by the Infrastructure Consortium for Africa (ICA)
Transport Sector Platform7 highlighted both the potential for private sector
participation in Africa, as well as a number of issues that constrain or discourage
involvement. One of the conclusions reached during stakeholder discussions on the
study’s findings is that a close alignment between further work and PIDA/PAP
should be encouraged to facilitate infrastructure investment/development.
1.3 This study aims to build on this foundation work and assist African stakeholders in
addressing the next steps in promoting efficient African aviation services.
This study
1.4 This study’s overall objective is to contribute to addressing the barriers to the
expansion of effective aviation services across Africa through analysis and targeted
interventions in support of relevant PIDA – PAP projects. Specifically, the study
assessed the Yamoussoukro Decision implementation, and West Africa Air
Transport and Central Africa Air Transport Hubs.
1.5 The Yamoussoukro Declaration of 1998 (formalised as the Yamoussoukro Decision
(YD) of the following year and given legal force under the 1991 Abuja Treaty)
attempts to liberalise airline route access in intra-African aviation and has only
been partially successful.
1.6 While there is support for liberalisation of aviation market access through the YD,
in practice only partial implementation has been achieved to date across the
continent. Market access for airlines is often restricted to promoting national
carriers, resulting in inefficient services, low seat utilisation and high air fares.
Where the YD has been implemented, this has generally been under the auspices
of the regional economic organisations such as the West African Economic and
Monetary Union (WAEMU) and the Central African Economic and Monetary Union
(CEMAC), but only within the territories of the region, not between different
regions. Even within these economic regions, YD implementation has only been
5 Africa infrastructure Country Diagnostics(AICD) study- Africa’s Infrastructure: A Time for Transformation; World
Bank et al
6 Programme for Infrastructure Development in Africa – Priority Action Plan www.au-pida.org
7 Assessment of the potential for private participation in the maritime and air transport sectors in Africa, Steer
Davies Gleave, 2012

Opening up Aviation Services in Africa
2
partial, with bureaucratic hurdles still in place for airlines wishing to operate new
international routes.
1.7 While major regional hubs exist in South Africa (Johannesburg), North Africa
(Cairo, Casablanca) and East Africa (Nairobi and Addis Ababa), none of the major
airports in West or Central Africa (such as Lagos, Abuja, Accra, Abidjan or
Kinshasa) fulfil this role, which requires the airport to be a convenient point for
connections using airline services with allow passengers to travel to airport
destinations which themselves are not directly connected.
1.8 This study seeks to assist in addressing the issues discussed above and offer
potential solutions to support the relevant PIDA PAP aviation projects.
1.9 The study is divided into two phases:
I Phase 1: Review and Analysis; and
I Phase 2: Detailed study.
1.10 Phase 1 included analysis and consultation activities in order to review recent
developments, assess the current situation and identify key issues under the two
main areas of work:
I Assistance to implement more fully the Yamoussoukro Decision and address the
associated barriers to developing the African airline industry; and
I Review the case and scope for establishing regional aviation hubs in Western
and possibly Central Africa.
1.11 The output of Phase 1 is this document, the Review Report, which will identify the
focus for the Phase 2, which may identify specific areas for action under one or
both of the two main areas of work (Yamoussoukro and regional hubs).
This document
1.12 This Draft Review Report is a project deliverable from Steer Davies Gleave for the
study to assist in the opening up of Aviation Services in Africa.
1.13 This Draft Review Report includes a summary of our findings from Phase 1 of the
study, identifies options for a focus for Phase 2 and outlines the actions that could
be taken during Phase 2. This report includes examples of successes and failures
in African aviation, with analysis and drivers for these events. These examples
form the basis of the range of potential actions for Phase 2. This report will serve
as a basis for discussion during a meeting with the ICA project team which will be
held via telephone conference.
1.14 The rest of this document is structured as follows:
I Chapter 2: provides an overview of our methodology, including a list of
stakeholders consulted to date;
I Chapter 3: provides a brief overview of the African demographic and economic
situation in the context of aviation development;
I Chapter 4: provides an overview of the bilateral air services agreements in
Africa, the status of implementation of the Yamoussoukro Decision, and a
discussion of the key issues surrounding the granting of air transport rights in
Africa;

Opening up Aviation Services in Africa
3
I Chapter 5: provides an overview of the air transport market in Africa, using
flights and passenger movements data and an analysis of the aircraft fleet in
operation in Africa;
I Chapter 6: includes an overview of other barriers to the development of the
aviation market in Africa, including fares, taxes fees and charges, safety,
infrastructure and the availability of finance; and
I Chapter 7: summarises the potential actions (proposed by stakeholders or
project team) along with an assessment of each and short list of proposals for
Phase 2 activities, based on this assessment.
1.15 We also provide two appendices:
I Appendix A: Air Services Agreements and aviation policy: State by State
analysis for 12 selected States; and
I Appendix B: Bibliography.


Opening up Aviation Services in Africa
5
2 Methodology
Introduction
2.1 During Phase I of the Study, we reviewed the available literature, the aviation
policies of key African countries, provided an analysis of flight operations and
passenger flows to/from and within Africa over the year to August 2013, and
consulted with stakeholders including airlines, airports, national and international
aviation authorities and financiers.
2.2 Our approach to each of these areas is outlined below.
Literature Review
2.3 We built up a bibliography at the start of the project, which was extended through
discussions with ICA members and other stakeholders during the course of the
study. The reports reviewed include publications by the International Civil
Aviation Organisation (ICAO), the World Bank (including Charles Schlumberger’s
key study8), African Union, the Economic Community Of West African States
(ECOWAS), the International Finance Corporation (IFC), and Africa Infrastructure
Country Diagnostics (AICD).
2.4 Sources for news and industry updates include the Economist (Gulliver), the
Financial Times, Reuters, Airwise, CAPA Centre for Aviation, Inspiratia and other
industry newsletters.
2.5 A full Bibliography of the source documents used throughout this study is provided
as Appendix B.
Review of African countries’ aviation policies
2.6 We reviewed the aviation policies and legislation of a number of key African States
in order to understand their legal framework and the level of airline and air route
liberalisation in practice. The analysis included an overview of the state of the
market (whether market access is regulated/limited), restrictions to airline
ownership, and key bilateral Air Service Agreements and their restrictions.
Schedule and passenger movement analysis
2.7 We reviewed both flight schedules and passenger booking data in order to
understand the air services currently operated in Africa (we used the Official
Airline Guide (OAG) database and Market Intelligence Data Tapes (MIDT) data for
passenger journeys to/from/via Africa covering September 2012-August 2013).
2.8 We analysed the OAG database, which contains airlines, frequencies and seat
capacities of scheduled services across the globe. We have used this data to set
out the types of domestic, short-haul (intra-regional) international, inter-regional
international and intercontinental services operated by African and other airlines
across the continent. As part of this analysis we have examined the application of
"triangular" routings which are generally used by airlines when point to point
demand is insufficient and in the absence of a suitable hubbing opportunity. 8 Open Skies for Africa, World Bank, 2010

Opening up Aviation Services in Africa
6
2.9 We have also analysed MIDT, which contains passenger booking data collected by
Computer Reservations Systems (CRS) and contains passengers' full itineraries
including origin, transfer points and final destination, as well as the airlines used,
their capacity and seat load factor. While not all bookings pass through CRSs, in
particular bookings made on some low cost and other carriers' own websites, it is
likely that in Africa a large majority of bookings do use the CRS channels,
especially those involving multiple flight sectors.
2.10 In order to understand the gaps in connectivity, we used MIDT to analyse the end-
to-end journeys made by passengers, which identified where passengers have to
use connecting services (often via inconvenient connection points) in order to
complete their journeys, or, alternatively, make use of triangular routeings, which
are extensively used by airlines in Africa to link airports with relatively low density
passenger flows.
Stakeholder consultation
2.11 We undertook an extensive stakeholder programme: the stakeholders were
suggested by the project team and augmented by the ICA Steering Group, and
additional suggestions were made during the course of the interview programme.
2.12 In each case an introductory email and telephone contact was made inviting
participation in the study. If this was agreed a draft agenda of key themes for the
discussion was shared with the stakeholder. Most of the interviews took place by
telephone with a smaller number on a face to face basis.
2.13 We found that international aviation bodies and airlines tended to express the
most interest in participating. National regulatory bodies and other government
organisations were, in general, not as responsive. We note this experience mirrors
that general frustrations expressed by delegates (particularly African airlines) at
the 2012 Aviation Outlook Africa Conference, in the “…lack of Government
policymakers in attendance and their lack of interest in understanding of
promoting an industry that is vital to a nation’s health”9.
2.14 Through our attendance of the Modern Airports Africa in Nairobi (19/20 November
2013), we were able to hold face-to-face meetings with six stakeholders which
proved useful for the study, and which has also led to us identifying a number of
additional contacts.
2.15 The full list of stakeholders interviewed to date is as follows:
Airlines
I Fastjet, 14 November;
I Kenya Airways, 20 November; and
I Arik Air, 29 November.
Airports and Aviation Authorities
I Kenya Airports Authority, 18 November;
I Ghana Airports Company Limited, 20 November; and
I Wilson Airport (KAA).
9 Why Africa keeps stalling on take off, Athena Aviation, 2013

Opening up Aviation Services in Africa
7
International Organisations
I East Africa Commission, 19 November;
I East Africa Commission Civil Aviation Safety and Security Oversight Agency, 19
November;
I ECOWAS, 23 December; and
I IATA, written response only, 22 November.
Financing and leasing organisations
I World Bank, 1 November
I Dubai Aerospace, 27 November; and
I African Frontier Capital, 6 November.
2.16 UEOMA have provided written consent for an interview which is yet to be
scheduled.


Opening up Aviation Services in Africa
9
3 Africa: a demographic and economic overview
Summary
Africa’s population is growing rapidly. The current high population growth rate
began in the second half of the 20th century, when the number of people on the
continent almost quadrupled from 230 million to 811 million. By 2010 this number
reached one billion and if current demographic trends persist, Africa’s population
will be 1.4 billion in 2025 and 1.9 billion by 2050.
In this chapter we provide an overview of some of the major African States in
terms of population, wealth, trade and aviation activity. The size and rate of
expansion of a country’s population, its wealth and trade activity are all indicators
of the level of aviation activity that might be expected in that country.
We also review population, GDP and departing seats for the top 18 African cities
by PPP-adjusted GDP (2008 data). Cities with a high population, GDP and seats
may indicate a potential location for a viable hub. We find that Nairobi and Addis
Ababa, two existing hubs in Eastern Africa, display a relatively high level of
departing seats compared to population levels. Lagos in West Africa has a
relatively high population and number of departing seats however does not
operate as a hub to the same extent that, say, Lomé in Togo does, despite Lomé
having very low levels of departing seats and population.
Introduction
3.1 In this chapter we provide a brief overview of the current demographic and
economic situation in Africa: population, economic growth, trade and propensity
to fly.
3.2 Whilst making definitive statements about the state of a market is difficult, these
factors provide a high level insight into the maturity and attractiveness of a
country or region for aviation activity and investment. Any judgement about the
likelihood of success for a hub, or local market for aviation transport is uncertain
without supporting qualitative information and further context (such as an
understanding of the safety regime or willingness of the government to facilitate
aviation growth). However a number of insights can be drawn based on the
consistent appearance of specific nations within the top and bottom of the metrics
described in this report.
3.3 An overview of other factors affecting aviation in Africa, such as safety, fares,
taxes and market liberalisation is provided in chapters 4 and 5.
Africa overview
3.4 Table 3.1 provides an overview of some of the major African States in terms of
population, wealth, trade and aviation activity. The size and rate of expansion of
a country’s population, its wealth and trade activity are all indicators of the level
of aviation activity that might be expected in that country.

Opening up Aviation Services in Africa
10
3.5 Africa’s population is growing rapidly. The current high population growth rate
began in the second half of the 20th century, when the number of people on the
continent almost quadrupled from 230 million to 811 million. By 2010 this number
reached one billion and if current demographic trends persist, Africa’s population
will be 1.4 billion in 2025 and 1.9 billion by 2050.
3.6 With 169 million people in 2012, Nigeria is, by a significant margin, the most
populous country in Africa. Nigeria’s high average annual growth rate of
approximately +2.8% (over 2008-2012) has also been a significant driver of Africa’s
overall high population growth. The rate of population expansion in Nigeria is
expected to continue, with +2.7% average annual growth rate expected until 2025.
3.7 Of particular note in Table 3.1 are those countries with high population, wealth
and/or growth indicators but low or lower than average levels of aviation activity,
for example Nigeria and Angola.
TABLE 3.1 AFRICA: KEY COUNTRY OVERVIEW
Source: World Bank, World Trade Organisation, OAG, Steer Davies Gleave analysis
CountryPopulation,
m, 2012
Population
Growth 2012-
2025
GNI PPP per
capita, 2012
Trade (Imports and
Exports, to World,
Rank in group,
2012)
Departing
Seats
Propensity to
fly
Nigeria 168.8 2.7% 14.3 2 19,868,437 0.12
Ethiopia 91.7 2.4% 12.4 11 8,064,722 0.09
Congo, Dem. Rep. 65.7 2.6% 5.6 13 1,937,127 0.03
South Africa 51.2 0.5% 218.6 1 44,753,564 0.87
Tanzania 47.8 2.9% 33.3 9 6,862,870 0.14
Kenya 43.2 2.5% 40.8 7 11,887,386 0.28
Algeria 38.5 1.5% - 3 9,598,299 0.25
Sudan 37.2 2.3% 54.6 12 4,113,009 0.11
Uganda 36.3 3.2% 31.4 17 1,917,299 0.05
Morocco 32.5 1.1% 156.2 5 13,075,251 0.40
Ghana 25.4 1.9% 76.5 6 4,780,841 0.19
Mozambique 25.2 2.4% 40.5 15 2,855,014 0.11
Madagascar 22.3 2.8% 42.6 22 2,027,181 0.09
Cameroon 21.7 2.4% 106.9 14 2,744,682 0.13
Angola 20.8 3.0% 263.7 4 5,473,978 0.26
Côte d'Ivoire 19.8 2.2% 98.8 8 2,053,828 0.10
Niger 17.2 4.0% 37.9 23 770,191 0.04
Burkina Faso 16.5 2.8% 91.7 20 1,161,835 0.07
Mali 14.9 3.2% 78.1 21 1,168,170 0.08
Zambia 14.1 3.3% 115.1 10 2,364,270 0.17
Senegal 13.7 2.7% 139.9 16 2,501,899 0.18
Zimbabwe 13.7 2.4% - 18 2,908,258 0.21
Chad 12.4 3.0% 106.0 19 301,541 0.02
Rwanda 11.5 2.6% - 25 1,838,274 0.16
Guinea 11.5 2.4% 85.6 24 608,079 0.05
Togo 6.6 2.4% 138.5 26 775,990 0.12

Opening up Aviation Services in Africa
11
City rankings
3.8 Figure 3.1 shows population, GDP and departing seats for the top 18 African cities
by PPP-adjusted GDP (2008 data). Cities with a high population, GDP and seats
may indicate a potential location for a viable hub.
3.9 Nairobi and Addis Ababa, two existing hubs in Eastern Africa, display a relatively
high level of departing seats compared to population levels. Lagos in West Africa
has a relatively high population and number of departing seats however does not
operate as a hub to the same extent that, say, Lomé in Togo does, despite Lomé
having very low levels of departing seats and population (for a full analysis of hubs
in West Africa, see chapter 5).
FIGURE 3.1 AFRICAN CITIES: GDP, POPULATION AND DEPARTING SEATS
Source: OAG, PwC Global city rankings 2008, Steer Davies Gleave analysis
0
20
40
60
80
100
120
140
160
-
5
10
15
20
25
30
PP
P-a
dj
GD
P (
US
D,
$b
n)
Po
pu
lati
on
/De
p.S
ea
ts (
mil
lio
n)
Population Departing Seats PPP-adj GDP (USDbn, 2008)

Opening up Aviation Services in Africa
13
4 Overview of air transport policy in selected African
States
Summary
Level of liberalisation
In order to understand the legal framework and the level of liberalisation on
paper, we undertook a desktop review of the aviation policies and legislative
context for 11 key African States, along with a number of non-African states as a
comparator. We found that Nigeria, Ghana, Ethiopia and Tanzania were relatively
more “open” than other African states such as Egypt Ivory Coast, Kenya and the
Democratic Republic of Congo.
Key treaties
Two key treaties/decisions in Africa relating to liberalisation in the aviation
market are the Yamoussoukro Decision and the ECOWAS Treaty. The objective of
the Yamoussoukro Decision (YD) is the gradual liberalisation of scheduled and non-
scheduled intra-African air transport services. The Abuja Treaty (1994) is
recognised as the legal basis for the YD. Of the 54 African states, 44 have signed
and formally ratified the Abuja Treaty and as a result became parties to the YD.
In theory, therefore, signatory States should have a liberalised air transport
market in operation both within and between them. In practice, however, this is
not the case. All sources confirmed that Yamoussoukro had not been
implemented, or had only been partly implemented, and indeed whilst we are
aware that Yamoussoukro is cited on occasion in bilateral ASAs, it is not, in
practice, taken into account during negotiations for air traffic rights.
We understand that the Fifth Freedom rights granted to airlines as part of the 1975
Treaty establishing the Economic Community of West African States (ECOWAS)
States (revised in 1993) has led to a high concentration of triangular and multi-stop
flights being operated in Western and Central Africa compared to the rest of the
continent.
Stakeholder issues
We provide an overview of stakeholders’ comments on three key components of
the Air Services Agreements: airline ownership, Fifth Freedom rights and
designations of carriers by States. We understand that issues of airline ownership
are the most significant concern for African States and airlines, particularly
fastjet, which is deemed a Tanzanian carrier under Tanzanian law but is not
majority owned by African nationals. A number of stakeholders, including Kenya
Airways, reported issues concerning the granting of Fifth Freedom rights. Under
the YD there is no limit on the number of carriers a State Party can designate, as
long as the carriers meet the eligibility requirements, although in practice often
only a single carrier is designated by each country.
Opening up Aviation Services in Africa
14
Introduction
4.1 In order to understand the aviation policy applied by African States and regions,
we have:
I Undertaken a desktop review of the legal frameworks in place, including an
overview of the bilateral Air Services Agreements in place in Africa and some
key international aviation treaties; and
I Examined policy implementation in practice through an overview of stakeholder
comments on air transport policy in Africa, its impact and the key issues.
Legal frameworks in place
4.2 In order to understand the legal framework and the level of liberalisation on
paper, our desktop research included a review of the aviation policies and
legislative context for a number of key African States. For each State, the analysis
included an overview of the following areas:
I Air carriers in operation;
I The bodies that regulate aviation, and the laws under which they do this;
I Whether market access is regulated/limited, for each of domestic and
international services;
I The procedures that exist to obtain rights to operate particular routes;
I The principal pieces of legislation that govern air safety, and where
responsibility for this administration lies;
I The level of passenger charges on aviation, and the organisations that charge
them;
I Restrictions to airline ownership; and
I Key bilaterals and their restrictions.
4.3 The following States were including in the analysis: Egypt, South Africa, Nigeria,
Ghana, Zambia, Senegal, Ivory Coast, Ethiopia, Kenya, Tanzania, and Democratic
Republic of Congo.
4.4 We include below an overall impression of the level of liberalisation of air services
in the States considered. The full analysis for each State can be found in Appendix
A.
4.5 The Air Services Agreement Projector (ASAP) is an analytical tool devised by the
World Trade Organisation that analyses bilateral Air Services Agreements (ASAs) in
order to assess their level of liberalisation. The summary below has been
developed using this tool.
4.6 The ASAP tool relies on the ICAO database of ASAs and WTO Trade Policy Review
Secretariat Reports. In the passenger data analysed (see Chapter 5), we have seen
more Fifth Freedom routes than implied by the ASA analysis (for example, Kenya),
indicating that this source may be incomplete. We note also, however, that it is
possible that a country can permit another to exercise traffic rights informally,
outside an ASA. It may also happen that an airline exercises traffic rights which
are not conferred by an ASA or informally and the other state(s) in question
permit(s) this without making objection (for most of the 1990s there was no
bilateral at all in existence between France and the US, and yet French and US

Opening up Aviation Services in Africa
15
airlines continued to operate 3rd and 4th freedom services between the two
countries in significant numbers, on an informal basis). Despite these potential
limitations we nevertheless consider the ASAP a helpful tool in analysing and
understanding the level of liberalisation in any given aviation market.
4.7 The WTO has devised indices that give an indication of the level of liberalisation of
any given ASA and of the air transport policy of a particular State, ranging between
zero for the most restrictive, and fifty, for the most open.
4.8 The Weighted Air Liberalization Index (WALI) is a synthetic measure of the level of
liberalisation of the air transport policy of a given Signatory. It is calculated as an
average of the indices of all the air service agreements concluded by that
Signatory, weighted by the respective traffic they cover and ranges between zero
for the most restrictive, and fifty, for the most open.
4.9 Four different weighting systems have been devised to accommodate different
geographical and economic situations:
I Standard: gives equal weighting to various market access features (standard);
I Fifth Freedom: gives more weighting to Fifth Freedom10 traffic rights;
I Ownership: gives more weighting to liberal withholding/ownership provisions;
and
I Designation: gives more weighting to multiple designations of carriers by states.
4.10 The Standard WALI for selected African states is shown in Table 4.1, along with the
number of bilateral ASAs for each State. We have also included a number of non-
African states as a comparator. The higher the WALI index, the more open a
State’s ASAs are. Whilst the non-African countries show more liberalised ASAs,
there is not a significant gap between them and the more open African countries,
such as Nigeria, Ghana and Ethiopia. It must be noted that, as a multilateral
agreement, the Common Aviation Area in Europe is not included in the analysis
below. If it were, the scores for the UK and France would be significantly higher
(i.e. their markets would score as more open), as the European air transport
market is liberalised under this agreement (although some restrictions, such as
ownership restrictions, remain).
10 Fifth Freedom of The Air - the right or privilege, in respect of scheduled international air services, granted by
one State to another State to put down and to take on, in the territory of the first State, traffic coming from or
destined to a third State (also known as a Fifth Freedom Right).

Opening up Aviation Services in Africa
16
TABLE 4.1 AIR LIBERALISATION INDEX AND NUMBER OF ASAS FOR SELECTED
AFRICAN AND NON-AFRICAN STATES
Source: World Trade Organisation, Steer Davies Gleave analysis
4.11 For each of the countries listed in Table 4.1, the figure below charts the weighted
Air Liberalisation Index against each of the three other weighting systems (Fifth
Freedom, Ownership and Designation).
4.12 For all the States shown in Figure 4.1, the Fifth Freedom weighting results in the
(relative) highest level of liberalisation in the air transport market, and the
ownership weighting the lowest.
Standard weighting
closed <-----------------> open
Egypt 7 41
South Africa 11.6 54
Nigeria 12.4 20
Ghana 12.2 26
Zambia 10.4 13
Senegal 9.6 21
Ivory Coast 6.8 22
Ethiopia 11.6 18
Kenya 7.7 27
Tanzania 11.4 23
Dem Rep Congo 8.7 12
France 13.6 63
UK 14.3 96
Turkey 11.3 52
Argentina 16.1 33
Indonesia 14.3 26
SignatoryNumber of Bilateral
ASAs

Opening up Aviation Services in Africa
17
FIGURE 4.1 WEIGHTED AIR LIBERALISATION INDEX FOR SELECTED STATES
Source: World Trade Organisation, Steer Davies Gleave analysis
Relevant international aviation treaties
4.13 Two key treaties/decisions in Africa relating to liberalisation in the aviation
market are the Yamoussoukro Decision and the ECOWAS Treaty. Each of these is
described below.
4.14 The 2012 Abuja Declaration relates to aviation safety in Africa and is described
further in Chapter 6.
Yamoussoukro Decision
4.15 The objective of the Yamoussoukro Decision (YD) is defined under Article 2, Scope
of Application, as the gradual liberalisation of scheduled and non-scheduled intra-
African air transport services. The main elements are the granting to all state
parties to the decision the free exercise of first, second, third, fourth, and Fifth
Freedom rights on both scheduled and non-scheduled passenger and freight (cargo
and mail) air services performed by an eligible airline11.
4.16 The Abuja Treaty, which formally entered into force on 12 May 1994, is recognised
as the legal basis for the YD. Of the 54 African states, 44 have signed and formally
ratified the Abuja Treaty and as a result became parties to the YD. The other 10
states (Djibouti, Equatorial Guinea, Eritrea, Gabon, Madagascar, Mauritania,
Morocco, Somalia, South Africa, and Swaziland) cannot be considered parties.
4.17 In theory, therefore, signatory States should have a liberalised air transport
market in operation both within and between them. In practice, however, this is
not the case. All sources confirmed that Yamoussoukro had not been
implemented, or had only been partly implemented, and indeed whilst we are
11 Open Skies For Africa, Charles E Schlumberger, 2010
0
5
10
15
20
25
We
igh
ted
Air
Tra
nsp
ort
Lib
era
lisa
tio
n
ind
ex
Fifth Freedom weighting Ownership weighting Designation weighting
African States non-African States

Opening up Aviation Services in Africa
18
aware that Yamoussoukro is cited on occasion in bilateral ASAs, it is not, in
practice, taken into account during negotiations for air traffic rights12.
ECOWAS Treaty
4.18 The 1975 Treaty establishing the Economic Community of West African States
(ECOWAS) States (revised in 1993) includes a chapter on co-operation in transport,
communications and tourism (Chapter VIII)13. Parts (f) and (g) of Article 32 are
particularly relevant to this study:
I f) encourage co-operation in flight-scheduling, leasing of aircraft and granting
and joint use of Fifth Freedom rights to airlines of the region; and
I g) promote the development of regional air transportation services and
endeavour to bring about the merger of national airlines in order to promote
their efficiency and profitability.
4.19 We understand that the Fifth Freedom rights granted to airlines as part of this
treaty has led to a high concentration of triangular and multi-stop flights being
operated in Western and Central Africa compared to the rest of the continent. For
further evidence see chapter 5.
Policy in practice: stakeholder comments
4.20 In this section we provide an overview of stakeholders’ comments on three key
components of the Air Services Agreements (in line with the three Weighted Air
Liberalization Index (WALI) options available on the Air Services Agreement
Projector):
I Ownership restrictions;
I Fifth Freedom rights; and
I Designations of carriers by states.
Ownership.
4.21 From our stakeholder conversations, we understand that issues of ownership are
the most significant concern for African States and airlines.
4.22 Under the YD, the carrier must be legally established in accordance with the
regulations applicable in the relevant state party and have its headquarters,
central administration, and principal place of business physically located in that
same country. It must also be effectively controlled by the nationals of one, or in
the case of multinational airlines, several, state parties14.
4.23 States retain their sovereign rights on the granting of traffic rights, in accordance
with international treaties, including the International Air Transport Agreement,
whilst being required to apply the provisions of the YD for intra-African market
ASAs. It is also required of States to ensure that designated carriers meet the
eligibility criteria and maintain responsibility for safety and security oversight over
their designated airlines15.
12 Fastjet, interview 14 November 2013
13 Treaty of ECOWAS, signed July 24, 1993. http://www.comm.ecowas.int/
14 Open Skies For Africa, Charles E Schlumberger, 2010
15 Africa’s Strategy for market access and catalyst for air transport growth, ICAO working paper, ATCONF, 2013
Opening up Aviation Services in Africa
19
Fastjet
4.24 For fastjet, an airline based in Tanzania but owned by a UK-based PLC, the
ownership issue is directly relevant. Fastjet is not majority owned by African
nationals, but under Tanzanian Law, if an airline is registered in Tanzania and
regulated by national authority it is deemed to be a Tanzanian carrier. The
nationality/ ownership issue became important immediately when fastjet
attempted to launch operations to other countries, for example, South Africa.
Whilst under Tanzanian law fastjet is a Tanzanian carrier, other countries do not
accept the designation because, under their own national legislation, designation
requires ownership (or majority ownership) by Tanzanian nationals.
4.25 It should be noted that this issue would not be resolved even if the YD were fully
implemented, since YD includes a requirement for ownership by the relevant
country’s nationals. In practice different countries have reacted to this legislative
requirement for ownership (if it exists in their national legislation) in different
ways. Some countries (e.g. Zimbabwe) have stated that they will change the
language in the legislation, others (e.g. South Africa) insist on following the
legislation to the letter.
4.26 Fastjet has therefore formed local partnerships in each country, such as South
Africa, taking minority equity stakes, to obtain the route rights it seeks to operate.
For example, in order to complete its attempted take-over of failed South African
LCC 1time from its liquidators, it will need to comply with current South African
foreign ownership laws (which limit foreign ownership of a South African airline to
25%)16.
East African Community
4.27 The East African Community (EAC) is currently drafting region-wide air transport
liberalisation legislation. During interviews the EAC confirmed that the only
outstanding (‘burning’) issue is that of ownership (i.e. the level of national
ownership in a State’s designated carrier). African carriers have significant
concerns about well-financed non-African airlines, such as those based in the Gulf,
entering and dominating African markets, should ownership restrictions be
relaxed. Negotiations within the EAC may lead to a compromise on the ownership
issue (which may involve interim arrangements and/or lower ownership threshold
levels).
ICAO
4.28 ICAO, in its 2009 Africa Regional Report, indicated that it would like to see airline
ownership rules be gradually but progressively relaxed with a view to freeing State
owned airlines from political interference over their management17.
Fifth Freedom rights
4.29 The YD allows the multilateral exchange of up to Fifth Freedom air traffic rights
between any African YD party state using a simple notification procedure.
However this (along with other facets of the Yamoussoukro Decision) is not the
16 CAPA Yearbook 2013 – Africa, CAPA, 2013
17 ICAO AFI Enhanced Regional Cooperation, ICAO,2009

Opening up Aviation Services in Africa
20
case in practice. A number of stakeholders, including Kenya Airways, reported
issues concerning the granting of Fifth Freedom rights.
4.30 Kenya Airways noted that Fifth Freedom rights are very important for airlines to
service countries with low population/propensity to fly, in order to ensure
profitability. Kenya Airways have five routes in Africa where they have Fifth
Freedom rights (further details were confidential and not shared with the project
team). They theorised that other major sub-Saharan African airlines (such as
South African Airways, Rwanda Air and Ethiopian Airways) would experience similar
issues.
4.31 In a 2013 working paper, ICAO18 notes that some airlines have been using sixth
freedom right operations (i.e. transporting passengers between State A and State B
via the carrier’s home state) to overcome Fifth Freedom market access
restrictions, as well as to foster the development of traffic to/from their base hub
location.
4.32 In a range of policy recommendations for Africa, Africa Infrastructure Country
Diagnostic (AICD) comment that the increased fifth- and sixth-freedom operations
conducted by Ethiopian, Kenyan, and South African airlines, demonstrate the
potential for better, more sustainable, and possibly more cost-effective services19.
4.33 For further information on Fifth Freedom routes in operation in Africa, see Chapter
6.
Designations of carriers by states
4.34 Under the YD there is no limit on the number of carriers a State Party can
designate, as long as the carriers meet the eligibility requirements. The Decision
simply states that each State Party "shall have the right to designate at least one
airline…". This seems to give rise to the possibility of State A refusing to designate
a carrier wishing to commence operations to State B, say in a situation where
there is protectionist behaviour towards a state carrier that has already been
designated.
4.35 This demonstrates that, even if the YD were fully implemented, its provisions do
not really constitute an Open Skies arrangement, relying very much on
governmental involvement and enthusiasm to foster freedom of access for eligible
airlines. The evidence shows that such enthusiasm is often absent.
4.36 Separately, the Decision does contain some limited grounds upon which State B
could refuse authorisation to a carrier designated by State A - for instance if State
B is convinced that the carrier designated by State A does not meet the eligibility
criteria . However, the Decision does not allow State B to refuse the request
simply on the basis that State A has already designated one carrier (i.e. State A is
trying to designate multiple carriers). The question of course is the extent to
which State B is nevertheless able to do so through other means / delay tactics
and so forth. Designation issues were not raised by stakeholders interviewed as
being a particular issue for operations in Africa.
18 Africa’s Strategy for market access and catalyst for air transport growth, ICAO working paper, ATCONF, 2013
19 An Unsteady Course - Growth and Challenges in Africa’s Air Transport Industry, AICD, 2009

Opening up Aviation Services in Africa
21
5 Aviation in Africa: supply & demand
Summary
Air Services
We reviewed the types of route and the types of carrier operating from the
continent’s 20 biggest airports, which account for nearly 60% of total traffic in
Africa over September 2012 – August 2013. The analysis shows that the mix of
domestic, intra-regional, inter-regional and intercontinental traffic varies greatly
between even the largest airports, revealing implicit geographical and market
attributes, as well as pointing to the strategies of the airlines using them.
Interesting variations between airports are also observed in the balance of local
(national) and reciprocal carriers operating the different types of route (domestic,
inter-regional etc.). Differences are also noted in the extent to which triangular
routings are utilised in the four African regions (Northern, Southern, Eastern and
Western & Central). Triangular routings are found to be more prevalent in Western
& Central Africa, reflecting the low levels of traffic, the lack of a dominant airline
with a central hub, and the existence of Fifth Freedom traffic rights.
Gaps in connectivity and hubs
Our analysis of travellers’ itineraries demonstrates the low level of connectivity at
several important African airports, including Entebbe, Accra and Lagos (where a
high proportion of indirect journeys are undertaken to/from the airports), but also
Cairo and Johannesburg (where the proportion of indirect journeys may be lower,
but the large traffic volumes suggest that these airports might be able to support
direct markets and improved connectivity).
The low level of inter-regional connectivity across the continent is also
highlighted, with as little as 31% of journeys between Northern and Southern Africa
found to be direct in the period considered (Sept 2012 – Aug 2013).
The extent to which some of Africa’s busiest airports act as hubs for connecting
passengers is also examined. As expected, Cairo, Casablanca, Johannesburg, Addis
Ababa and Nairobi all act as hubs, with high proportions (and volumes) of
connecting passengers. A similar hub in Western & Central Africa is notably
absent. Lomé is the only airport in the region that could be characterised as a
hub, however it is small compared to busier airports, such as Lagos.
Fleet
Africa’s low level of connectivity is further reflected in the relatively small size of
African airlines’ fleets. Despite representing 15% of the world’s population,
African airlines operate only 5.5% of the world’s commercial passenger and
freighter aircraft, thereby having the lowest level of aircraft per capita of any
world region. The average age of these fleets is found to be the oldest of any
world region (17 years vs 13 years for the global average), and their aircraft mix
tends to involve smaller than average aircraft.

Opening up Aviation Services in Africa
22
Introduction
5.1 This section provides an overview of the desktop analysis undertaken to develop a
detailed picture of air services currently operated in Africa, based on data from
the world schedule database OAG and Market Intelligence Data Tapes (MIDT).
5.2 The OAG database holds a comprehensive list of scheduled and freighter flights
across the world, providing details of carrier, origin and destination, routeing,
aircraft flight times and days of operation, as well as seat and/or cargo capacity.
5.3 MIDT records itineraries booked through global distribution systems (GDS),
capturing passengers’ origin, destination and routing. This data gives a measure of
the level of demand in the market, as well as the connectivity of existing
networks. MIDT does not capture bookings made directly on airlines’ own
reservation systems and as a result will not account for most low-cost carrier
demand, as well as part of the demand using other carriers. However, low levels
of LCC operations in Africa in combination with relatively low internet and
electronic payment system penetration across Africa will limit this unaccounted
demand. Further, the more complex itineraries which are used to reveal network
connectivity are more likely to be reserved through GDS.
5.4 We have reviewed the MIDT data and found that it appears to represent the large
majority of passenger journeys in Africa, and is generally consistent with the
information in OAG, so that passenger numbers in MIDT and seats in OAG can
reasonably be compared.
5.5 Our analysis sets out the types of domestic, short-haul (intra-regional)
international, inter-regional (intra-African) international and intercontinental
services operated by African and other airlines across the continent. It also
examines the end-to-end journeys made by passengers and identifies where
passengers have to make use of connecting services, highlighting where there are
gaps in connectivity.
5.6 We have identified which airports act as effective hubs, both in terms of absolute
numbers of connecting passengers and relative to the airport’s overall size. In
addition, we have identified where Fifth Freedom rights appear to be available to
carriers operating between airports outside their home countries.
Terminology
5.7 OAG categorises African countries into one of four regions: Northern, Southern,
Eastern and Western & Central. The regions are mapped in Figure 5.1 below. We
have relied on this segmentation in our analysis.

Opening up Aviation Services in Africa
23
FIGURE 5.1 MAP OF AFRICA SHOWING OAG REGIONS
Source: OAG, Steer Davies Gleave analysis
5.8 We term routes:
I Domestic: e.g. Cape Town-Johannesburg.
I Regional: short-haul international routes within a region, e.g. Nairobi-Kigali.
I Intra-African: international routes between regions, e.g. Cairo-Lagos.
I Intercontinental: e.g. Addis Ababa-Dubai.
5.9 We term carriers:
I National: all carriers registered in the departure and/or arrival country, not
just flag carriers. E.g. Comair in South Africa.
I Regional: all carriers registered in the same region as the departure or arrival
country. E.g. Kenya Airways from the perspective of Kigali.
I Other African: all carriers registered in regions other than that of the departure
or arrival country. E.g. Egyptair from the perspective of Lagos.
I Non-African: e.g. Emirates.

Opening up Aviation Services in Africa
24
Air services
5.10 Using the OAG data, we have reviewed:
I Total traffic by airport (Air Transport Movements (ATMS) and seats), split by
domestic, regional, intra-African and intercontinental flights;
I Total traffic by airport (as above), with each of the flight regions split into
point-to-point and triangular routings; and
I Domestic, regional, intra-African and intercontinental traffic by airport, split by
airline type (national, regional, other African, non-African).
Types of route
5.11 The figure below shows the split of traffic origin/destination for the top 20
airports in Africa (by number of seats, September 2012 – August 2013).
FIGURE 5.2 TRAFFIC (DEPARTING SEATS) BY ROUTE TYPE AT TOP 20
AIRPORTS IN AFRICA BY SIZE (SEATS), SEPT 2012-AUG 2013)
5.12 Source: OAG, Steer Davies Gleave analysis, key in Table 5.1
TABLE 5.1 AIRPORT THREE-LETTER CODE KEY
Airport Airport name Country Region
JNB Johannesburg O.R. Tambo Int South Africa Africa : Southern Africa
CAI Cairo Egypt Africa : North Africa
CPT Cape Town South Africa Africa : Southern Africa
LOS Lagos Nigeria Africa : Central/Western Africa
NBO Nairobi Jomo Kenyatta Int Apt Kenya Africa : Eastern Africa
CMN Casablanca Mohammed V Apt Morocco Africa : North Africa
ADD Addis Ababa Ethiopia Africa : Eastern Africa
0 5 10 15 20 25
JNB
CAI
CPT
LOS
NBO
CMN
ADD
DUR
ABV
ALG
TUN
ACC
DAR
KRT
LAD
TIP
MRU
RAK
DKR
SSH
Annual Seats (millions)
Domestic Regional Intra-African Intercontinental

Opening up Aviation Services in Africa
25
Airport Airport name Country Region
DUR Durban King Shaka Int Apt South Africa Africa : Southern Africa
ABV Abuja Nigeria Africa : Central/Western Africa
ALG Algiers Algeria Africa : North Africa
TUN Tunis Tunisia Africa : North Africa
ACC Accra Ghana Africa : Central/Western Africa
DAR Dar Es Salaam Tanzania Africa : Eastern Africa
KRT Khartoum Sudan Africa : North Africa
LAD Luanda Angola Africa : Southern Africa
TIP Tripoli Libya Africa : North Africa
MRU Mauritius Mauritius Africa : Eastern Africa
RAK Marrakech Morocco Africa : North Africa
DKR Dakar Senegal Africa : Central/Western Africa
SSH Sharm El-Sheikh Egypt Africa : North Africa
5.13 Together, the top 20 airports by number of seats over September 2012 – August
2013 account for nearly 60% of total traffic in Africa. With 22.4 million departing
seats over the period, Johannesburg airport is the largest in Africa and
approximately 60% larger than the next largest airport, Cairo. Cape Town and
Durban in South Africa also figure in the top 10, which includes Lagos, Nairobi,
Casablanca, Addis Ababa, Abuja and Algiers.
5.14 The mix of traffic at the continent’s largest airports varies greatly. Figure 5.3
below shows the proportion of each airport’s capacity (departing seats, Sept 2012-
Aug 2013) by type of route.

Opening up Aviation Services in Africa
26
FIGURE 5.3 SHARE OF CAPACITY (DEPARTING SEATS) BY ROUTE TYPE AT TOP
20 AIRPORTS IN AFRICA BY SIZE (SEATS), SEPT 2012 – AUG 2013
Source: OAG, Steer Davies Gleave analysis, key in Table 5.1
5.15 The variations observed in part reveal the different geographical and market
attributes of the destinations. For example:
I Johannesburg - at the south of continent dominated by a developed domestic
market
I Cairo - close to Europe and the Middle East dominated by intercontinental
routes
I Marrakesh and Sharm el Sheikh - attracting large amounts of leisure traffic from
Europe and the Middle East, but lacking almost any regional and intra-African
connections
I Cape Town, Durban and Abuja - capacity is dominated by domestic routes, with
a limited share of international traffic. Johannesburg and Lagos airports acting
as the main international entry/exit points for South Africa and Nigeria
respectively.
5.16 Having accounted for such attributes the traffic mix also reveals the relative
importance of the airports in regional and intra-African networks and points to the
market strategies of airlines using them. For example:
I Ethiopian’s strong regional and intra-African network using its Addis Ababa hub;
I Similarly, Kenya Airways regional and intra-African presence focussing on
Nairobi; and
I South African and BA/Comair’s relatively extensive regional and intra-African
operations centred on Johannesburg.
Types of carrier
5.17 The figure below shows the split of traffic carriers for the same top 20 airports in
Africa (by number of seats, September 2012 – August 2013).
0% 10% 20% 30% 40% 50% 60% 70% 80% 90% 100%
JNB
CAI
CPT
LOS
NBO
CMN
ADD
DUR
ABV
ALG
TUN
ACC
DAR
KRT
LAD
TIP
MRU
RAK
DKR
SSH
Proportion of total traffic (seats, %)
Domestic Regional Intra-African Intercontinental

Opening up Aviation Services in Africa
27
FIGURE 5.4 TRAFFIC (DEPARTING SEATS) BY CARRIER TYPE AT TOP 20
AIRPORTS IN AFRICA BY SIZE (SEATS), SEP 2012 – AUG 2013
Source: OAG, Steer Davies Gleave analysis, key in Table 5.1
5.18 In general, national carriers provide all domestic capacity and approximately half
of the international capacity, with the other half provided by the reciprocal
national carriers.
5.19 Again, some interesting variability is revealed between airports, for example 86%
of international capacity at Addis Ababa is provided by Ethiopian carriers
compared to 3% for Ghanaian carriers at Accra.
5.20 Interesting variability can also be observed between different types of route at a
given airport. For example at Johannesburg, South African carriers offer:
I a larger proportion of the regional capacity (70%) than reciprocal carriers do;
I just over half (53%) of the intra-African capacity;
I only a small proportion (15%) of intercontinental capacity.
Triangular routings
5.21 “Triangular routings”, where an aircraft flies to multiple airports rather than
making a simple out and return journey, are generally used by airlines where
overall levels of traffic are low, as more markets can be served using the same
capacity. Triangular routings are particularly convenient for airlines where the
airline holds Fifth Freedom rights to carry passengers to airports on the route
which are outside the airline’s home country, although they can also be economic
even in the absence of such rights.
5.22 We have split the OAG data to show the traffic by region type that is point-to-
point, or that involves a triangular routing. Figure 5.5 and Figure 5.6 overleaf
show the proportional traffic at the main airports (top 10 by seats available) for
each African region (Northern, Southern, Eastern and Western & Central Africa, as
applied by OAG to the schedule data). In the figures, the darker shade of each
0 5 10 15 20 25
JNB
CAI
CPT
LOS
NBO
CMN
ADD
DUR
ABV
ALG
TUN
ACC
DAR
KRT
LAD
TIP
MRU
RAK
DKR
SSH
Annual Seats (millions)
National Regional Other African Non-African

Opening up Aviation Services in Africa
28
colour shows the point to point flights and the lighter shade the triangular
routings.
5.23 The following observations can be made:
I Of the largest 10 airports in the Northern region, all but two have close to or
greater than 50% of their traffic to inter-Continental destinations (Europe and
the Middle East, primarily);
I The largest airports in the South are dominated by South African airports and
have a significant proportion of domestic flights. Maputo in Mozambique and
Luanda in Angola report nearly 15% of flights on a triangular domestic only
route;
I The proportions of triangular routes from the Eastern and Western & Central
regions are high and significantly greater than those in the Northern and
Southern regions. Of particular note in the Western & Central region are Accra
(26% regional triangular routes, 7% intra-African triangular routes), Dakar (33%,
8%), Abidjan (61%, 2%), and Brazzaville (26%, 11%). In the Eastern region, Kigali
has a high proportion of triangular routing (59%, 3%) as does Addis Ababa (10%,
16%) and Mombasa (23%, 0%).
5.24 The prevalence of triangular routings in West and Central Africa reflects the low
levels of traffic, the lack of a dominant airline with a central hub, and the
existence of Fifth Freedom traffic rights.
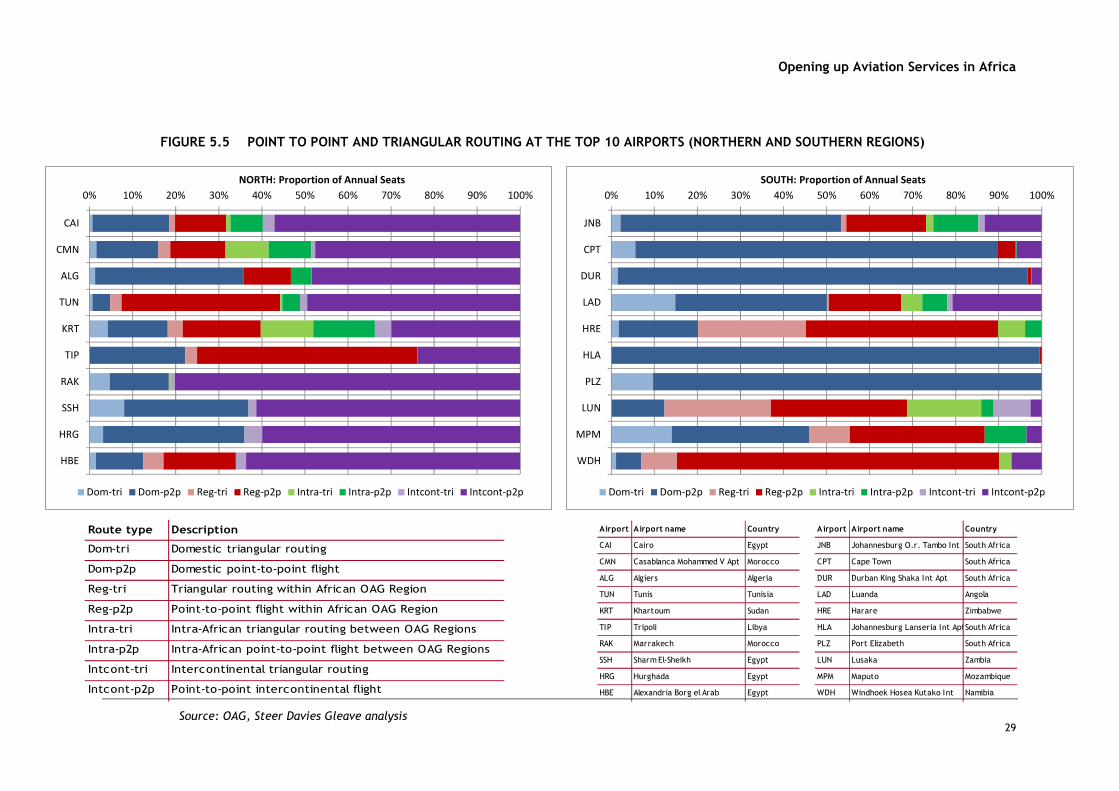
Opening up Aviation Services in Africa
29
FIGURE 5.5 POINT TO POINT AND TRIANGULAR ROUTING AT THE TOP 10 AIRPORTS (NORTHERN AND SOUTHERN REGIONS)
0% 10% 20% 30% 40% 50% 60% 70% 80% 90% 100%
CAI
CMN
ALG
TUN
KRT
TIP
RAK
SSH
HRG
HBE
NORTH: Proportion of Annual Seats
Dom-tri Dom-p2p Reg-tri Reg-p2p Intra-tri Intra-p2p Intcont-tri Intcont-p2p
0% 10% 20% 30% 40% 50% 60% 70% 80% 90% 100%
JNB
CPT
DUR
LAD
HRE
HLA
PLZ
LUN
MPM
WDH
SOUTH: Proportion of Annual Seats
Dom-tri Dom-p2p Reg-tri Reg-p2p Intra-tri Intra-p2p Intcont-tri Intcont-p2p
Airport Airport name Country Airport Airport name Country
CAI Cairo Egypt JNB Johannesburg O.r. Tambo Int South Africa
CMN Casablanca Mohammed V Apt Morocco CPT Cape Town South Africa
ALG Algiers Algeria DUR Durban King Shaka Int Apt South Africa
TUN Tunis Tunisia LAD Luanda Angola
KRT Khartoum Sudan HRE Harare Zimbabwe
TIP Tripoli Libya HLA Johannesburg Lanseria Int AptSouth Africa
RAK Marrakech Morocco PLZ Port Elizabeth South Africa
SSH Sharm El-Sheikh Egypt LUN Lusaka Zambia
HRG Hurghada Egypt MPM Maputo Mozambique
HBE Alexandria Borg el Arab Egypt WDH Windhoek Hosea Kutako Int Namibia
Route type Description
Dom-tri Domestic triangular routing
Dom-p2p Domestic point-to-point flight
Reg-tri Triangular routing within African OAG Region
Reg-p2p Point-to-point flight within African OAG Region
Intra-tri Intra-African triangular routing between OAG Regions
Intra-p2p Intra-African point-to-point flight between OAG Regions
Intcont-tri Intercontinental triangular routing
Intcont-p2p Point-to-point intercontinental flight
Source: OAG, Steer Davies Gleave analysis
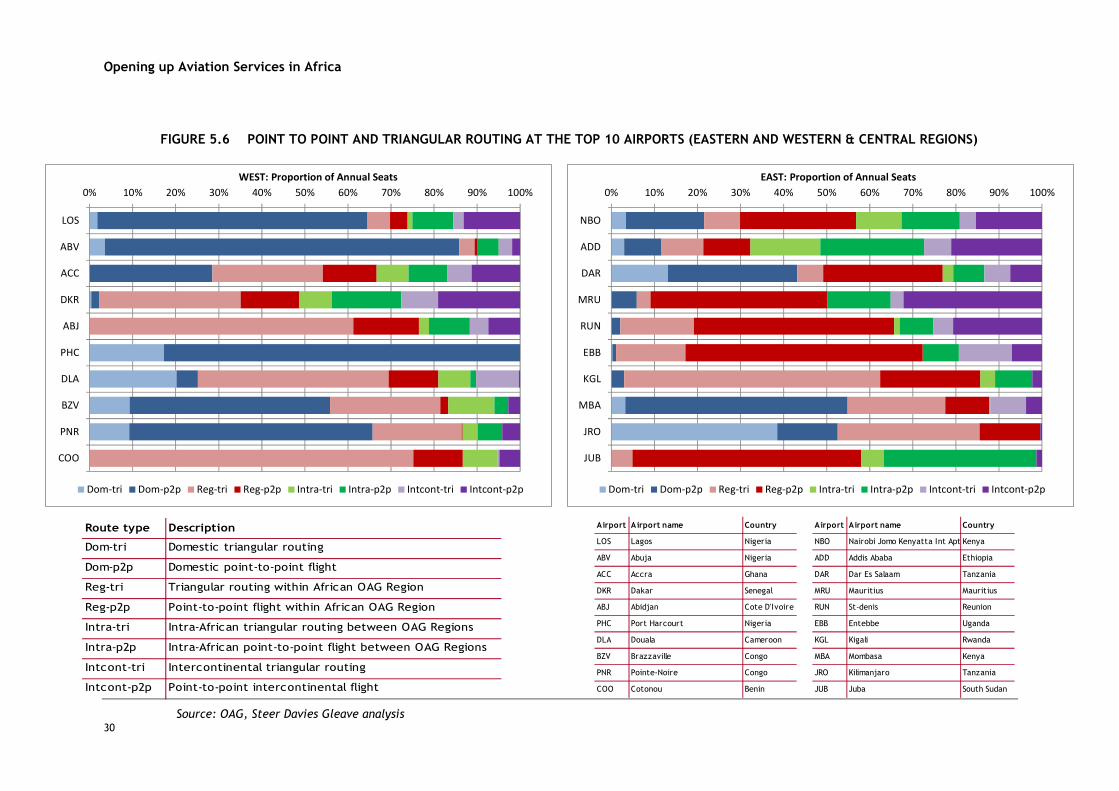
Opening up Aviation Services in Africa
30
FIGURE 5.6 POINT TO POINT AND TRIANGULAR ROUTING AT THE TOP 10 AIRPORTS (EASTERN AND WESTERN & CENTRAL REGIONS)
0% 10% 20% 30% 40% 50% 60% 70% 80% 90% 100%
LOS
ABV
ACC
DKR
ABJ
PHC
DLA
BZV
PNR
COO
WEST: Proportion of Annual Seats
Dom-tri Dom-p2p Reg-tri Reg-p2p Intra-tri Intra-p2p Intcont-tri Intcont-p2p
0% 10% 20% 30% 40% 50% 60% 70% 80% 90% 100%
NBO
ADD
DAR
MRU
RUN
EBB
KGL
MBA
JRO
JUB
EAST: Proportion of Annual Seats
Dom-tri Dom-p2p Reg-tri Reg-p2p Intra-tri Intra-p2p Intcont-tri Intcont-p2p
Airport Airport name Country Airport Airport name Country
LOS Lagos Nigeria NBO Nairobi Jomo Kenyatta Int Apt Kenya
ABV Abuja Nigeria ADD Addis Ababa Ethiopia
ACC Accra Ghana DAR Dar Es Salaam Tanzania
DKR Dakar Senegal MRU Mauritius Mauritius
ABJ Abidjan Cote D'Ivoire RUN St-denis Reunion
PHC Port Harcourt Nigeria EBB Entebbe Uganda
DLA Douala Cameroon KGL Kigali Rwanda
BZV Brazzaville Congo MBA Mombasa Kenya
PNR Pointe-Noire Congo JRO Kilimanjaro Tanzania
COO Cotonou Benin JUB Juba South Sudan
Route type Description
Dom-tri Domestic triangular routing
Dom-p2p Domestic point-to-point flight
Reg-tri Triangular routing within African OAG Region
Reg-p2p Point-to-point flight within African OAG Region
Intra-tri Intra-African triangular routing between OAG Regions
Intra-p2p Intra-African point-to-point flight between OAG Regions
Intcont-tri Intercontinental triangular routing
Intcont-p2p Point-to-point intercontinental flight
Source: OAG, Steer Davies Gleave analysis

Opening up Aviation Services in Africa
31
Evolution of air services
5.25 We have also analysed historical OAG data going back to 2006 in order to observe
changes in the split of traffic (between domestic, regional, intra-African and
intercontinental) over the period. A number of contrasting growth patterns are
compared in the figures below.
FIGURE 5.7 TRAFFIC GROWTH 2005 -2012 (SUMMER AND WINTER), SOUTH
AFRICA
Source: OAG, Steer Davies Gleave analysis
FIGURE 5.8 TRAFFIC GROWTH 2005 -2012 (SUMMER AND WINTER), NIGERIA
Source: OAG, Steer Davies Gleave analysis
0.0
10.0
20.0
30.0
40.0
50.0
60.0
70.0
80.0
S/W05 S/W06 S/W07 S/W08 S/W09 S/W10 S/W11 S/W12
Se
ats
(m
illi
on
)
Domestic Regional IntraAfrican Intercontinental
0.0
5.0
10.0
15.0
20.0
25.0
30.0
35.0
40.0
S/W05 S/W06 S/W07 S/W08 S/W09 S/W10 S/W11 S/W12
Se
ats
(m
illi
on
)
Domestic Regional IntraAfrican Intercontinental

Opening up Aviation Services in Africa
32
FIGURE 5.9 TRAFFIC GROWTH 2005 -2012 (SUMMER AND WINTER), KENYA
Source: OAG, Steer Davies Gleave analysis
FIGURE 5.10 TRAFFIC GROWTH 2005 -2012 (SUMMER AND WINTER), GHANA
Source: OAG, Steer Davies Gleave analysis
5.26 All countries shown report domestic traffic as the most significant driver of overall
traffic throughout the period excepting Ghana, where domestic traffic has
increased significantly over the latter part of the period to 2012 (notably it tripled
in 2011). South Africa’s traffic in particular is dominated by domestic journeys,
and little growth has been seen in regional, intra-African and intercontinental
flights over the period. Ghana and Kenya report significant proportions of regional
traffic compared to Nigeria and South Africa, and, at nearly 30% in S/W 2012,
0.0
1.0
2.0
3.0
4.0
5.0
6.0
7.0
8.0
9.0
10.0
S/W05 S/W06 S/W07 S/W08 S/W09 S/W10 S/W11 S/W12
Se
ats
(m
illi
on
)
Domestic Regional IntraAfrican Intercontinental
0.0
0.5
1.0
1.5
2.0
2.5
3.0
3.5
4.0
4.5
S/W05 S/W06 S/W07 S/W08 S/W09 S/W10 S/W11 S/W12
Se
ats
(m
illi
on
)
Domestic Regional IntraAfrican Intercontinental

Opening up Aviation Services in Africa
33
Kenya has the most significant proportion of inter-regional traffic of the four
States shown.
Connectivity
5.27 ICAO notes that there is no single definition of air transport “connectivity”.
However, connectivity is a property of a network and can be defined in such a way
as to constitute an indicator of the network´s concentration. Therefore,
connectivity is the ability of a network to move a passenger from one point to
another with the lowest possible number of connections and without an increase in
fare, focusing on, from a commercial perspective, minimum connecting times with
maximum facilitation ultimately resulting in benefits to air transport
Gaps in connectivity
5.28 Figure 5.11 below shows the proportion of journeys originating at African airports
that are indirect (i.e. passengers are required to connect at least once in order to
reach their final destination) against the volume of journeys originating at those
airports. Highlighted are the most significant of these airports, where particularly
high proportions and/or large volumes of originating journeys are indirect.
5.29 Note that the chart does not indicate connectivity through the airports shown – the
airports are considered in terms of the types of journey (direct or indirect)
required to reach the airport as a final destination (or true origin) of the journey.
FIGURE 5.11 CONNECTIVITY OF JOURNEYS ORIGINATING AT AFRICAN
AIRPORTS, SEP 2012 – AUG 2013
Source: MIDT, Steer Davies Gleave analysis, key in Table 5.2
JNB
CAI
CPT
LOS
NBO
ACC
DKR
KRT
DAR
EBB
0%
10%
20%
30%
40%
50%
60%
70%
80%
0 1,000,000 2,000,000 3,000,000 4,000,000 5,000,000
% I
nd
ire
ct
Total journeys originating at airport
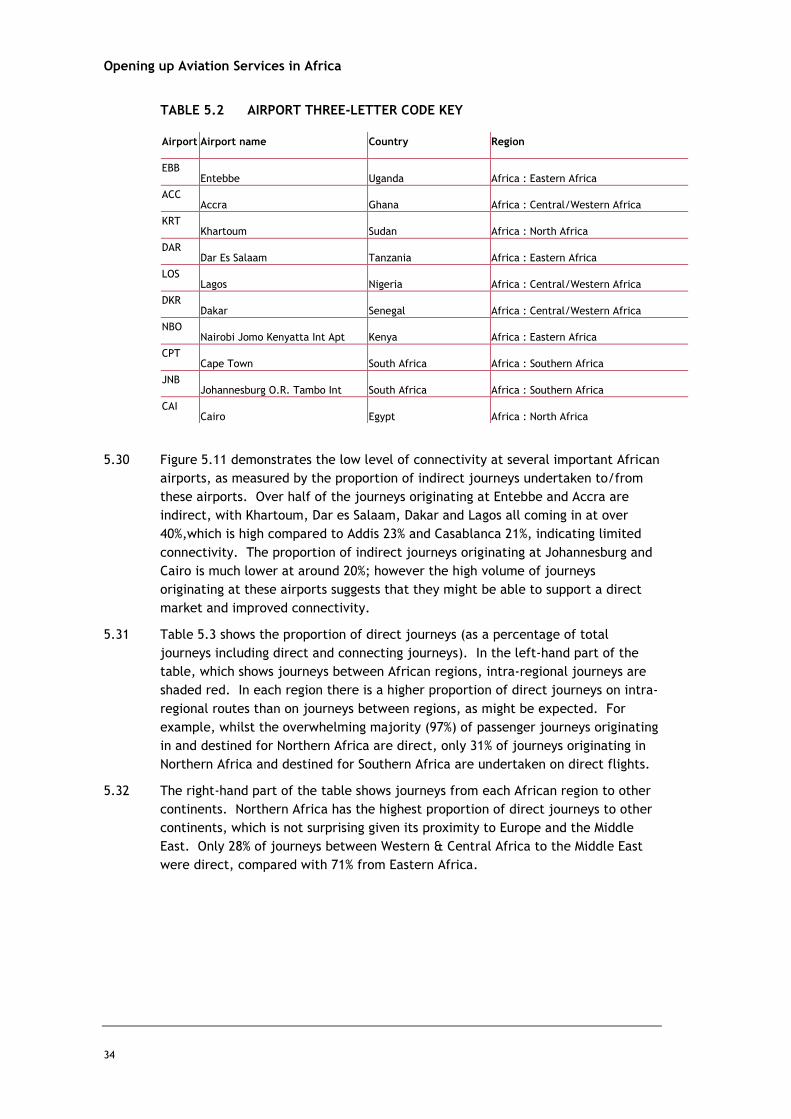
Opening up Aviation Services in Africa
34
TABLE 5.2 AIRPORT THREE-LETTER CODE KEY
Airport Airport name Country Region
EBB Entebbe Uganda Africa : Eastern Africa
ACC Accra Ghana Africa : Central/Western Africa
KRT Khartoum Sudan Africa : North Africa
DAR Dar Es Salaam Tanzania Africa : Eastern Africa
LOS Lagos Nigeria Africa : Central/Western Africa
DKR Dakar Senegal Africa : Central/Western Africa
NBO Nairobi Jomo Kenyatta Int Apt Kenya Africa : Eastern Africa
CPT Cape Town South Africa Africa : Southern Africa
JNB Johannesburg O.R. Tambo Int South Africa Africa : Southern Africa
CAI Cairo Egypt Africa : North Africa
5.30 Figure 5.11 demonstrates the low level of connectivity at several important African
airports, as measured by the proportion of indirect journeys undertaken to/from
these airports. Over half of the journeys originating at Entebbe and Accra are
indirect, with Khartoum, Dar es Salaam, Dakar and Lagos all coming in at over
40%,which is high compared to Addis 23% and Casablanca 21%, indicating limited
connectivity. The proportion of indirect journeys originating at Johannesburg and
Cairo is much lower at around 20%; however the high volume of journeys
originating at these airports suggests that they might be able to support a direct
market and improved connectivity.
5.31 Table 5.3 shows the proportion of direct journeys (as a percentage of total
journeys including direct and connecting journeys). In the left-hand part of the
table, which shows journeys between African regions, intra-regional journeys are
shaded red. In each region there is a higher proportion of direct journeys on intra-
regional routes than on journeys between regions, as might be expected. For
example, whilst the overwhelming majority (97%) of passenger journeys originating
in and destined for Northern Africa are direct, only 31% of journeys originating in
Northern Africa and destined for Southern Africa are undertaken on direct flights.
5.32 The right-hand part of the table shows journeys from each African region to other
continents. Northern Africa has the highest proportion of direct journeys to other
continents, which is not surprising given its proximity to Europe and the Middle
East. Only 28% of journeys between Western & Central Africa to the Middle East
were direct, compared with 71% from Eastern Africa.

Opening up Aviation Services in Africa
35
TABLE 5.3 PROPORTION OF DIRECT JOURNEYS WITH ORIGIN AFRICA, BY
REGION (SEPT 2012 – AUG 2013)
Origin/
Dest.
N. Af S. Af W&C
Af
E. Af Europe Middle
East
Asia North
America
Latin
America
North
America
Australia
N. Af 97% 31% 82% 77% 83% 81% 22% 38% 1% 38% 0%
S. Af 31% 95% 69% 70% 33% 59% 16% 10% 48% 10% 26%
W&C Af 80% 67% 89% 71% 44% 28% 0% 18% 12% 18% 0%
E. Af 79% 70% 71% 94% 39% 71% 36% 8% 5% 8% 19%
Source: MIDT, Steer Davies Gleave analysis
Hubs
5.33 A hub airport is one used by large numbers of passengers as a transfer point for
connecting journeys between other airports. Hubs are often, though not
necessarily, characterised by the presence of a dominant airline making large
numbers of flights to different destinations, thereby facilitating improved
passenger connectivity.
Level of hub activity
5.34 Figure 5.12 shows the extent to which some of the continent’s busiest airports act
as hubs for connecting passengers. Northern, Southern and Eastern Africa all have
sizeable airports where the proportion of journeys connecting there approaches or
exceeds 20% (which is low compared to large global hubs such as Heathrow c.35%
and Amsterdam c.50%). Cairo, Casablanca, Johannesburg, Addis Ababa and Nairobi
all act as hubs.

Opening up Aviation Services in Africa
36
FIGURE 5.12 TOTAL JOURNEYS AND THE PROPORTION OF JOURNEYS
CONNECTING AT LARGER (BY JOURNEYS) AIRPORTS, BY REGION (SEPT 2012 –
AUG 2013)
Source: MIDT, Steer Davies Gleave analysis
5.35 Notably, Addis Ababa has a very high proportion of connecting journeys (55%),
reflecting Ethiopian’s market strategy. The impact of this strategy, through
Ethiopian’s control of ASKY, is also observed at Lomé, the only airport in Western
and Central Africa that might be characterised as a hub with 60% of journeys
making onward connections. Lomé, however, is small compared with busier
airports in the region, such as Lagos, and considerably smaller than hubs in other
regions.
5.36 Kigali is similar to Lomé. Here Rwandair’s strategy has led to over 30% of journeys
connecting through the airport. But like Lomé again, the overall volume of
journeys is small compared to that using other hubs.
Popular routings: how passengers complete their journeys
5.37 This section examines how passengers reach their final destinations where direct
services are not in place, by looking at the busiest routings on domestic and
regional journeys, inter-regional/intra-African journeys, and intercontinental
journeys.
0%
10%
20%
30%
40%
50%
60%
70%
80%
90%
100%
0
10
20
30
40
50
60
70
80
90
100
Pro
po
rtion
of co
nn
ectin
g jo
urn
ey
sInd
ex
of
jou
rne
ys,
JN
B=
10
0
Connecting Journeys OD Journeys Proportion connecting 20% Connecting journeys
Northern
Africa
Southern
Africa
Western and Central
Africa
Eastern
Africa

Opening up Aviation Services in Africa
37
FIGURE 5.13 TOP 20 INDIRECT DOMESTIC AND INTRA-REGIONAL JOURNEYS,
SEPT 2012 – AUG 2013 (EXCLUDING JNB CONNECTIONS)
Source: MIDT, Steer Davies Gleave analysis, key in Table 5.4
TABLE 5.4 AIRPORT THREE-LETTER CODE KEY
Route Origin/Destination Connection hub Destination/Origin
RRG-MRU-RUN Rodrigues Island, Mauritius Mauritius, Mauritius St-denis, Reunion
DAR-NBO-EBB Dar Es Salaam, Tanzania Nairobi, Kenya Entebbe, Uganda
ACC-LFW-DLA Accra, Ghana Lomé, Togo Douala, Cameroon
ABJ-LFW-LOS Abidjan, Cote D'Ivoire Lomé, Togo Lagos, Nigeria
BVC-SID-RAI Boa Vista Island, Cape Verde Sal Island, Cape Verde Praia, Cape Verde
KIS-NBO-MBA Kisumu, Kenya Nairobi, Kenya Mombasa, Kenya
EBB-NBO-MBA Entebbe, Uganda Nairobi, Kenya Mombasa, Kenya
TLE-FTU-TNR Toliara, Madagascar Tolanaro, Madagascar Antananarivo, Madagascar
DIE-NOS-TNR Antsiranana, Madagascar Nosy-Be, Madagascar Antananarivo, Madagascar
BKZ-MWZ-DAR Bukoba, Tanzania Mwanza, Tanzania Dar Es Salaam, Tanzania
ABJ-LFW-DLA Abidjan, Cote D'Ivoire Lomé, Togo Douala, Cameroon
CZL-ALG-ORN Constantine, Algeria Algiers, Algeria Oran Es Senia Apt, Algeria
ACC-LFW-LBV Accra, Ghana Lomé, Togo Libreville, Gabon
ACC-LFW-CKY Accra, Ghana Lomé, Togo Conakry, Guinea
- 2,000 4,000 6,000 8,000 10,000
RRG-MRU-RUN
DAR-NBO-EBB
ACC-LFW-DLA
ABJ-LFW-LOS
BVC-SID-RAI
KIS-NBO-MBA
EBB-NBO-MBA
TLE-FTU-TNR
DIE-NOS-TNR
BKZ-MWZ-DAR
ABJ-LFW-DLA
CZL-ALG-ORN
ACC-LFW-LBV
ACC-LFW-CKY
ACC-LFW-BKO
JRO-DAR-ZNZ
ACC-ABJ-DKR
RAK-CMN-TUN
ABV-LOS-DKR
BJM-NBO-DAR
Two-way annual journeys
No direct alternatives Direct alternatives
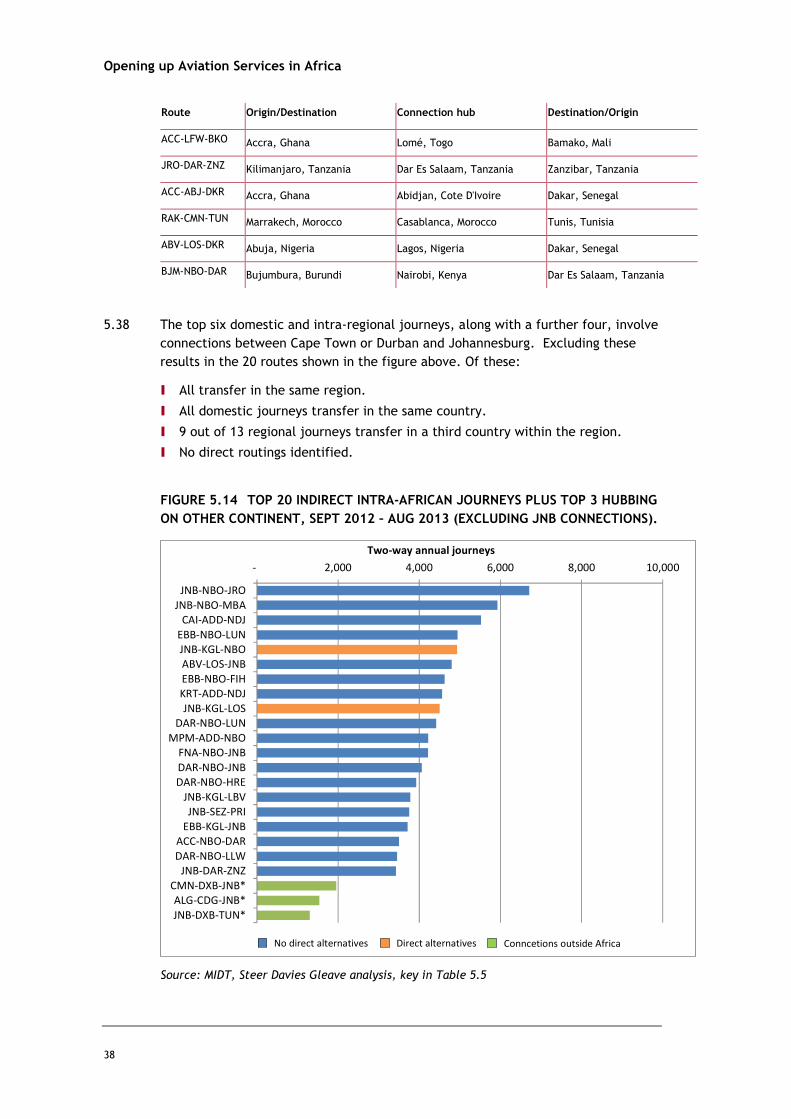
Opening up Aviation Services in Africa
38
Route Origin/Destination Connection hub Destination/Origin
ACC-LFW-BKO Accra, Ghana Lomé, Togo Bamako, Mali
JRO-DAR-ZNZ Kilimanjaro, Tanzania Dar Es Salaam, Tanzania Zanzibar, Tanzania
ACC-ABJ-DKR Accra, Ghana Abidjan, Cote D'Ivoire Dakar, Senegal
RAK-CMN-TUN Marrakech, Morocco Casablanca, Morocco Tunis, Tunisia
ABV-LOS-DKR Abuja, Nigeria Lagos, Nigeria Dakar, Senegal
BJM-NBO-DAR Bujumbura, Burundi Nairobi, Kenya Dar Es Salaam, Tanzania
5.38 The top six domestic and intra-regional journeys, along with a further four, involve
connections between Cape Town or Durban and Johannesburg. Excluding these
results in the 20 routes shown in the figure above. Of these:
I All transfer in the same region.
I All domestic journeys transfer in the same country.
I 9 out of 13 regional journeys transfer in a third country within the region.
I No direct routings identified.
FIGURE 5.14 TOP 20 INDIRECT INTRA-AFRICAN JOURNEYS PLUS TOP 3 HUBBING
ON OTHER CONTINENT, SEPT 2012 – AUG 2013 (EXCLUDING JNB CONNECTIONS).
Source: MIDT, Steer Davies Gleave analysis, key in Table 5.5
- 2,000 4,000 6,000 8,000 10,000
JNB-NBO-JRO
JNB-NBO-MBA
CAI-ADD-NDJ
EBB-NBO-LUN
JNB-KGL-NBO
ABV-LOS-JNB
EBB-NBO-FIH
KRT-ADD-NDJ
JNB-KGL-LOS
DAR-NBO-LUN
MPM-ADD-NBO
FNA-NBO-JNB
DAR-NBO-JNB
DAR-NBO-HRE
JNB-KGL-LBV
JNB-SEZ-PRI
EBB-KGL-JNB
ACC-NBO-DAR
DAR-NBO-LLW
JNB-DAR-ZNZ
CMN-DXB-JNB*
ALG-CDG-JNB*
JNB-DXB-TUN*
Two-way annual journeys
No direct alternatives Direct alternatives Conncetions outside Africa