Embed Size (px)
Citation preview
CONCEPTS OF BIOLOGY
Chapter 19 POPULATION AND COMMUNITY ECOLOGYPowerPoint Image Slideshow

FIGURE 19.1
Asian carp jump out of the water in response to electrofishing. The Asian carp in the inset photograph were harvested from the Little Calumet River in Illinois in May, 2010, using rotenone, a toxin often used as an insecticide, in an effort to learn more about the population of the species. (credit main image: modification of work by USGS; credit inset: modification of work by Lt. David French, USCG)
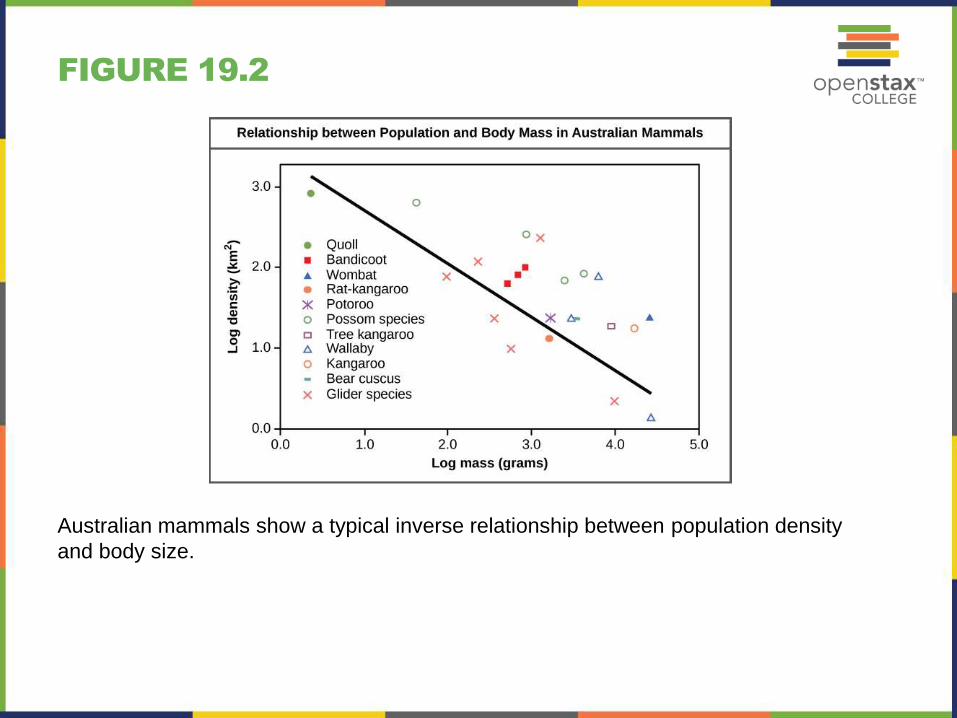
FIGURE 19.2
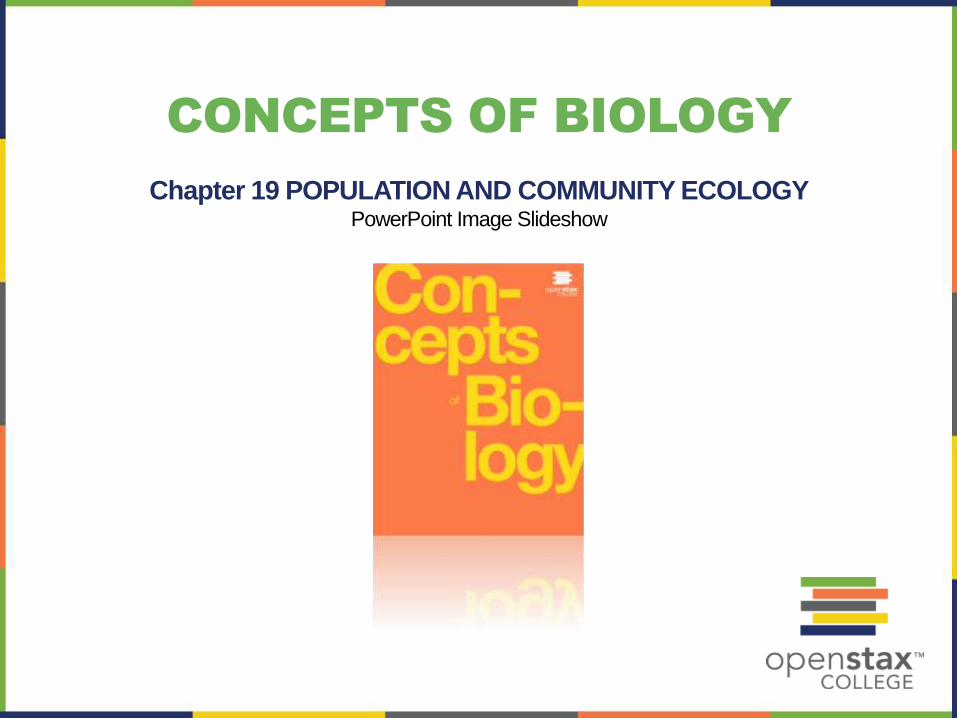
Australian mammals show a typical inverse relationship between population density
and body size.
FIGURE 19.3
Species may have a random, clumped, or uniform distribution. Plants such as (a) dandelions with wind-dispersed seeds tend to be randomly distributed. Animals such as (b) elephants that travel in groups exhibit a clumped distribution. Territorial birds such as (c) penguins tend to have a uniform distribution. (credit a: modification of work by Rosendahl; credit b: modification of work by Rebecca Wood; credit c: modification of work by Ben Tubby)
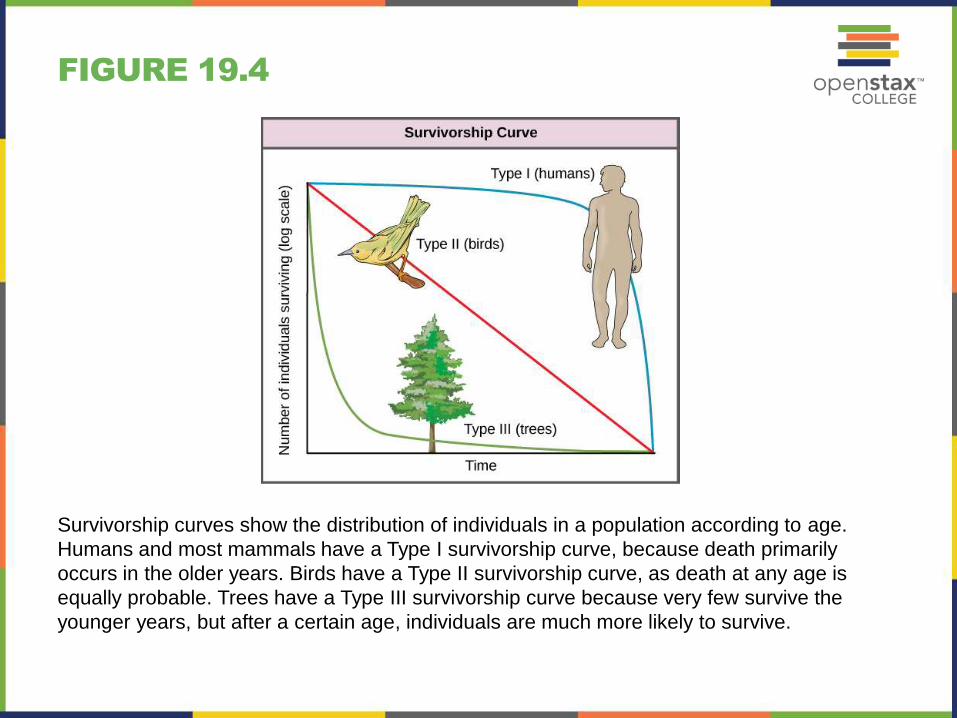
FIGURE 19.4
Survivorship curves show the distribution of individuals in a population according to age.
Humans and most mammals have a Type I survivorship curve, because death primarily
occurs in the older years. Birds have a Type II survivorship curve, as death at any age is
equally probable. Trees have a Type III survivorship curve because very few survive the
younger years, but after a certain age, individuals are much more likely to survive.

FIGURE 19.5
When resources are unlimited, populations exhibit (a) exponential growth, shown in a J-shaped
curve. When resources are limited, populations exhibit (b) logistic growth. In logistic growth,
population expansion decreases as resources become scarce, and it levels off when the
carrying capacity of the environment is reached. The logistic growth curve is S-shaped.
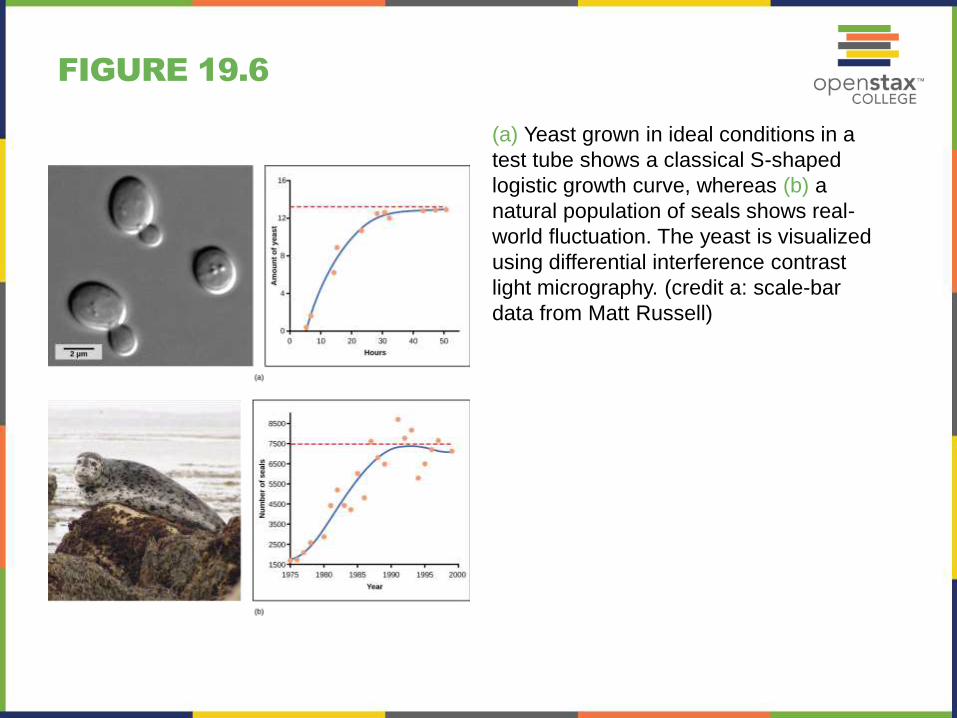
FIGURE 19.6
(a) Yeast grown in ideal conditions in a
test tube shows a classical S-shaped
logistic growth curve, whereas (b) a
natural population of seals shows real-
world fluctuation. The yeast is visualized
using differential interference contrast
light micrography. (credit a: scale-bar
data from Matt Russell)
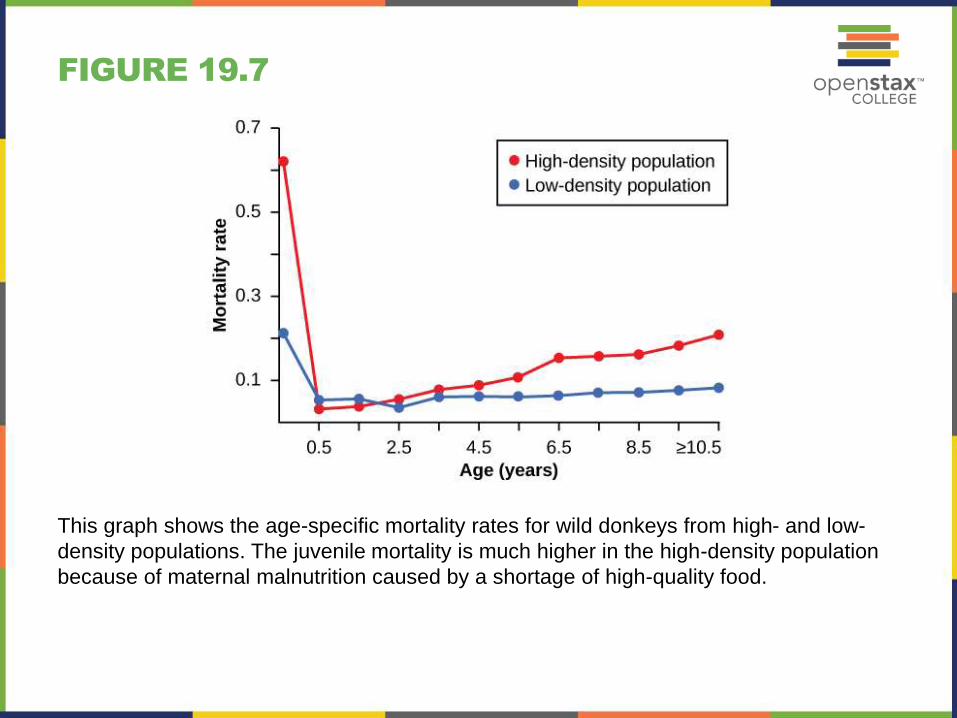
FIGURE 19.7
This graph shows the age-specific mortality rates for wild donkeys from high- and low-
density populations. The juvenile mortality is much higher in the high-density population
because of maternal malnutrition caused by a shortage of high-quality food.

FIGURE 19.8
The three images include: (a) 1916 mural of a mammoth herd from the American Museum of Natural History, (b) the only stuffed mammoth in the world is in the Museum of Zoology located in St. Petersburg, Russia, and (c) a one-month-old baby mammoth, named Lyuba, discovered in Siberia in 2007. (credit a: modification of work by Charles R. Knight; credit b: modification of work by “Tanapon”/Flickr; credit c: modification of work by Matt Howry)
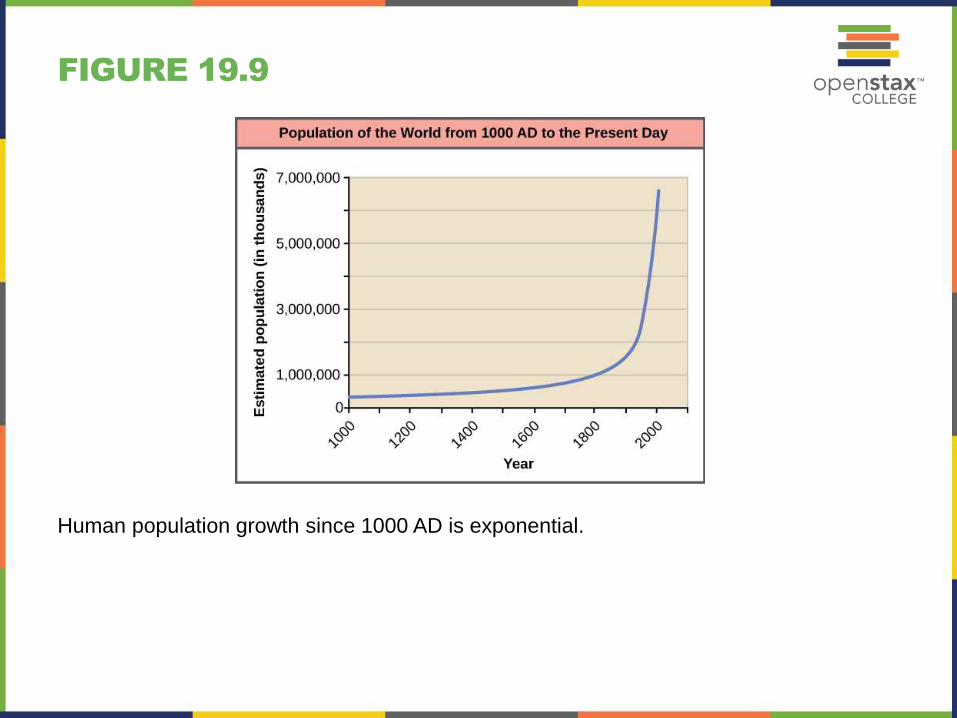
FIGURE 19.9
Human population growth since 1000 AD is exponential.
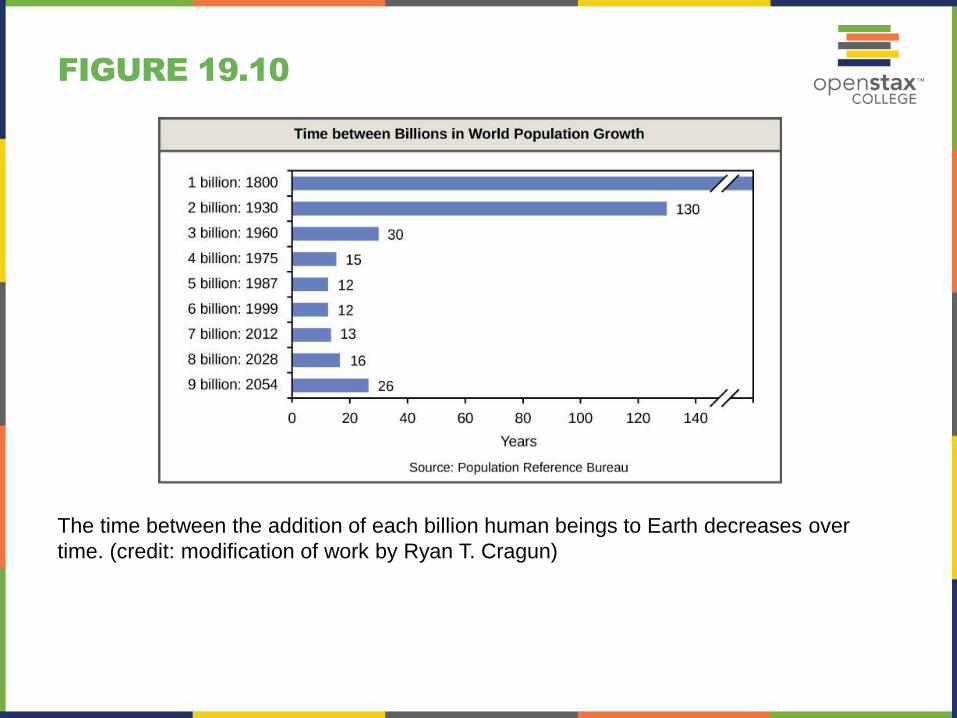
FIGURE 19.10
The time between the addition of each billion human beings to Earth decreases over
time. (credit: modification of work by Ryan T. Cragun)
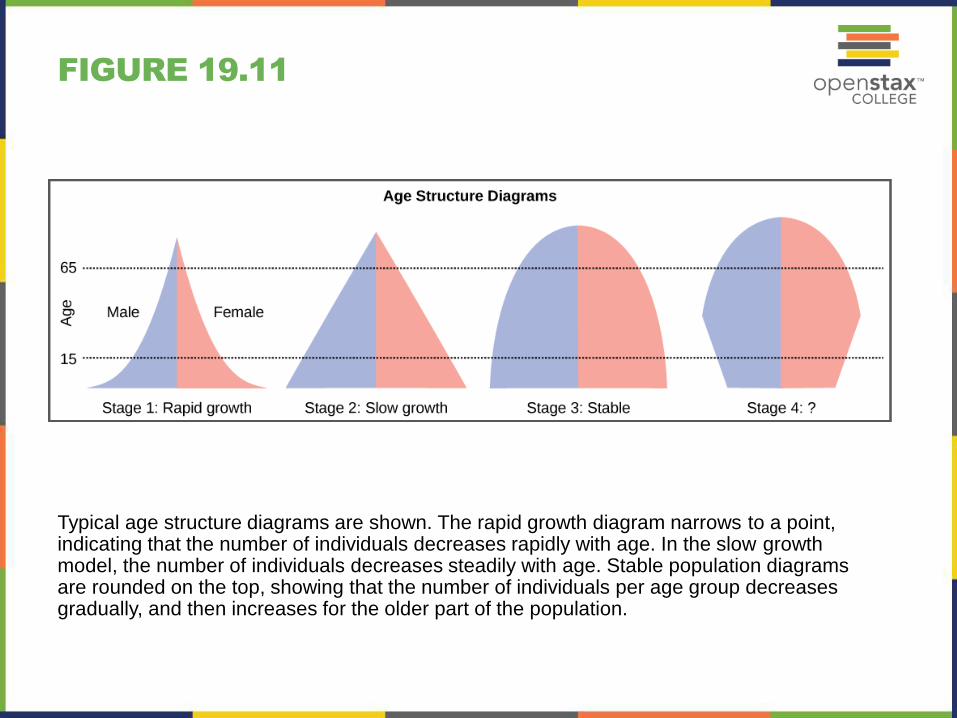
FIGURE 19.11
Typical age structure diagrams are shown. The rapid growth diagram narrows to a point, indicating that the number of individuals decreases rapidly with age. In the slow growth model, the number of individuals decreases steadily with age. Stable population diagrams are rounded on the top, showing that the number of individuals per age group decreases gradually, and then increases for the older part of the population.
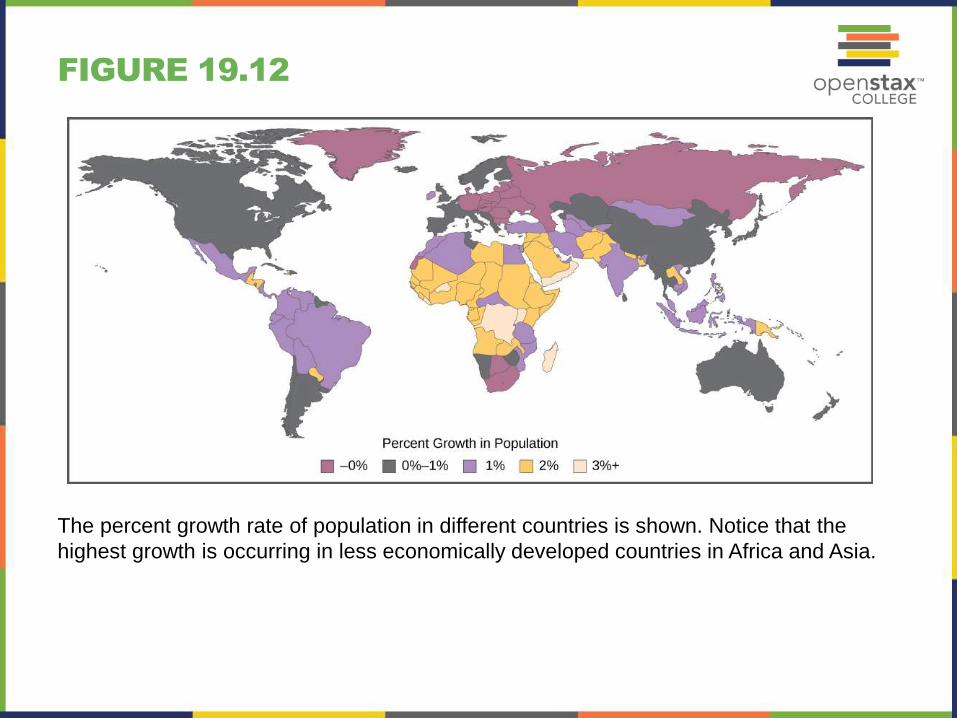
FIGURE 19.12
The percent growth rate of population in different countries is shown. Notice that the
highest growth is occurring in less economically developed countries in Africa and Asia.
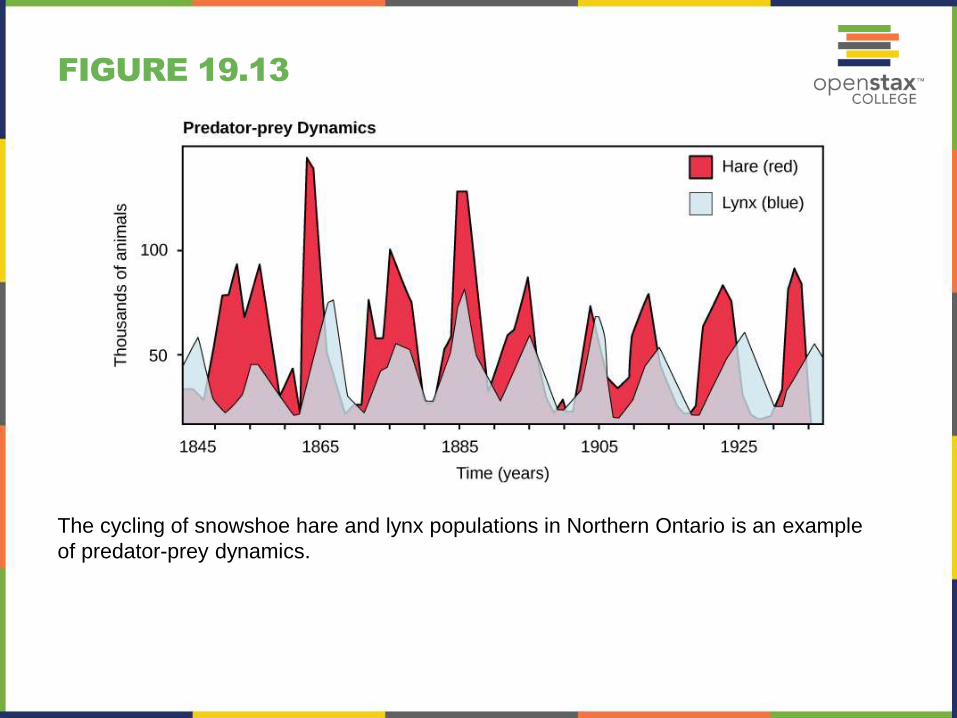
FIGURE 19.13
The cycling of snowshoe hare and lynx populations in Northern Ontario is an example
of predator-prey dynamics.
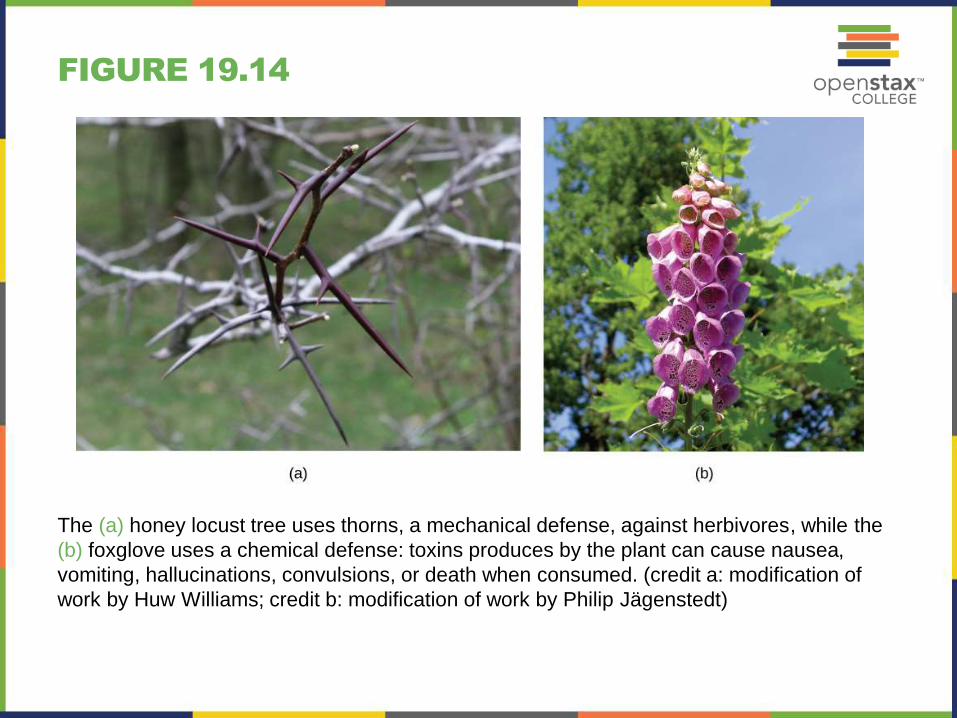
FIGURE 19.14
The (a) honey locust tree uses thorns, a mechanical defense, against herbivores, while the
(b) foxglove uses a chemical defense: toxins produces by the plant can cause nausea,
vomiting, hallucinations, convulsions, or death when consumed. (credit a: modification of
work by Huw Williams; credit b: modification of work by Philip Jägenstedt)
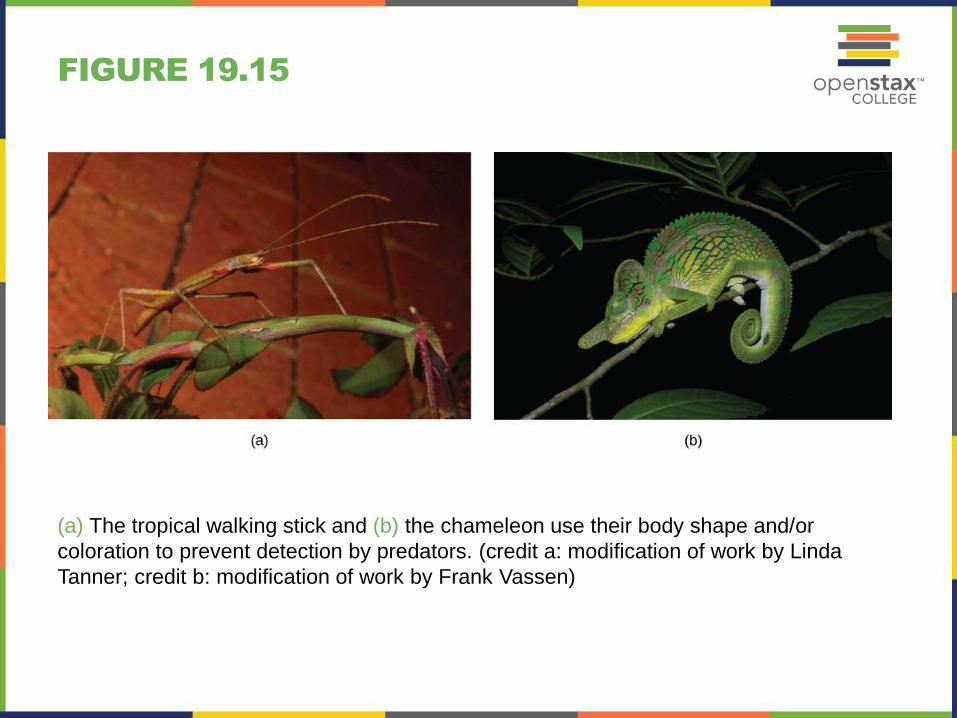
FIGURE 19.15
(a) The tropical walking stick and (b) the chameleon use their body shape and/or
coloration to prevent detection by predators. (credit a: modification of work by Linda
Tanner; credit b: modification of work by Frank Vassen)
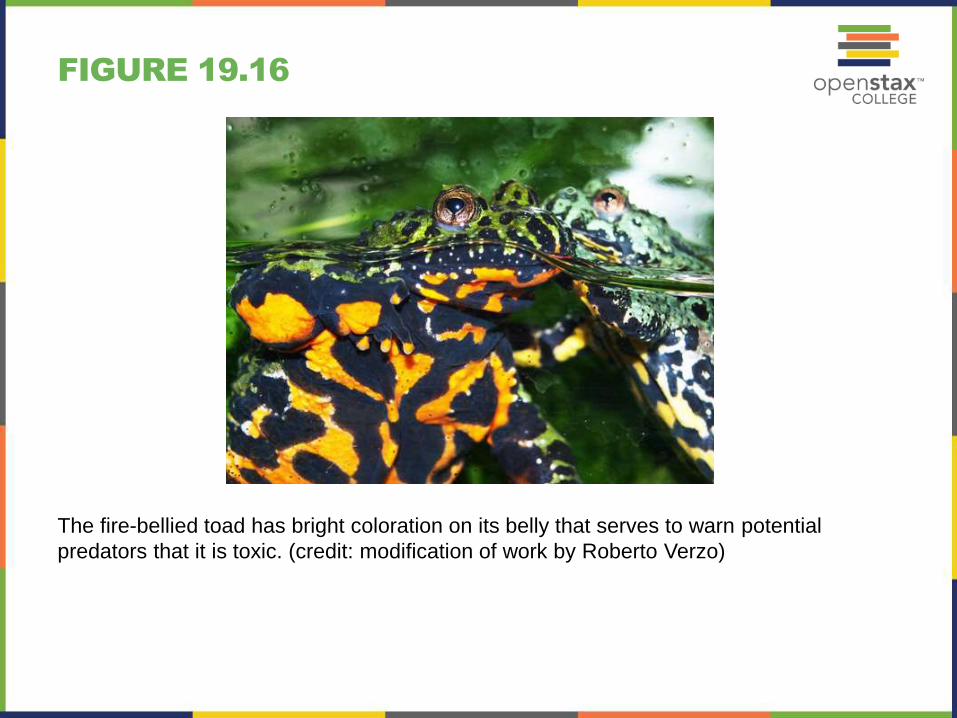
FIGURE 19.16
The fire-bellied toad has bright coloration on its belly that serves to warn potential
predators that it is toxic. (credit: modification of work by Roberto Verzo)
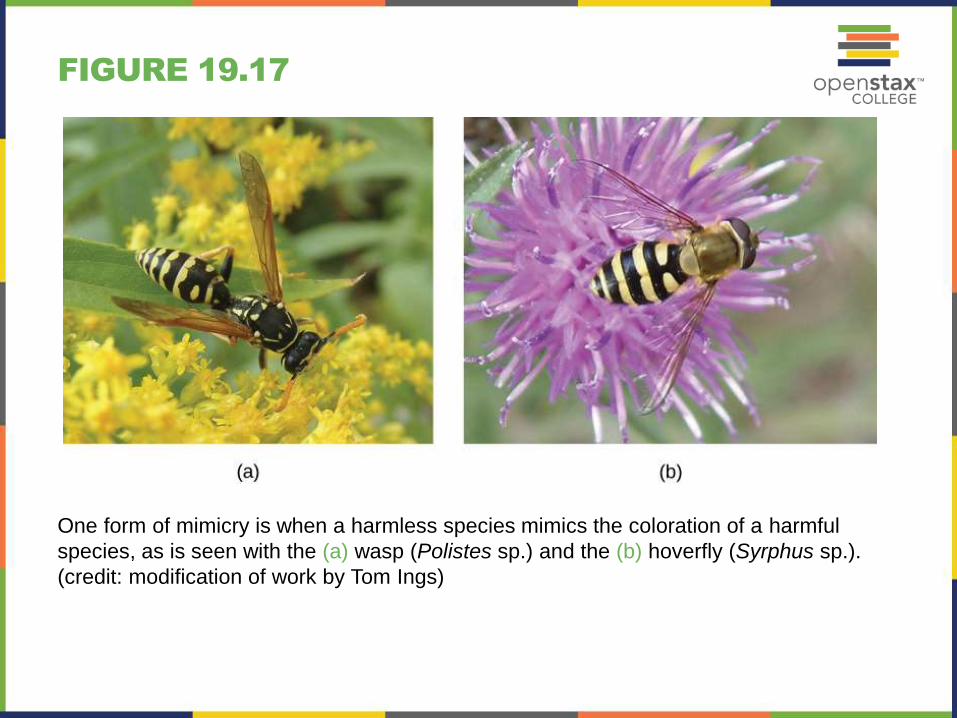
FIGURE 19.17
One form of mimicry is when a harmless species mimics the coloration of a harmful
species, as is seen with the (a) wasp (Polistes sp.) and the (b) hoverfly (Syrphus sp.).
(credit: modification of work by Tom Ings)
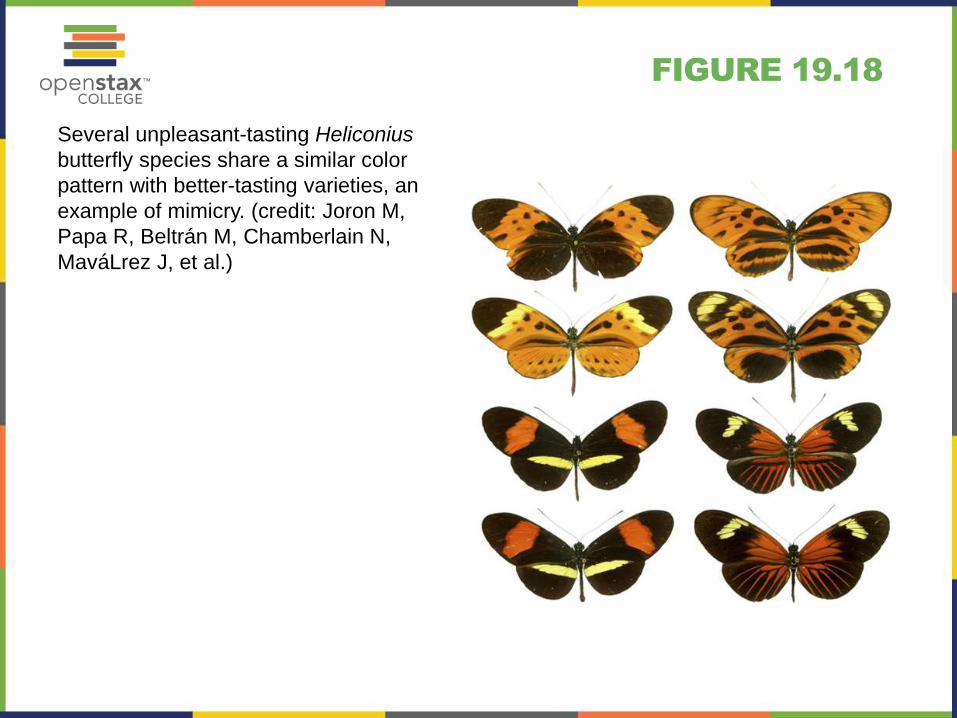
FIGURE 19.18
Several unpleasant-tasting Heliconius
butterfly species share a similar color
pattern with better-tasting varieties, an
example of mimicry. (credit: Joron M,
Papa R, Beltrán M, Chamberlain N,
MaváLrez J, et al.)
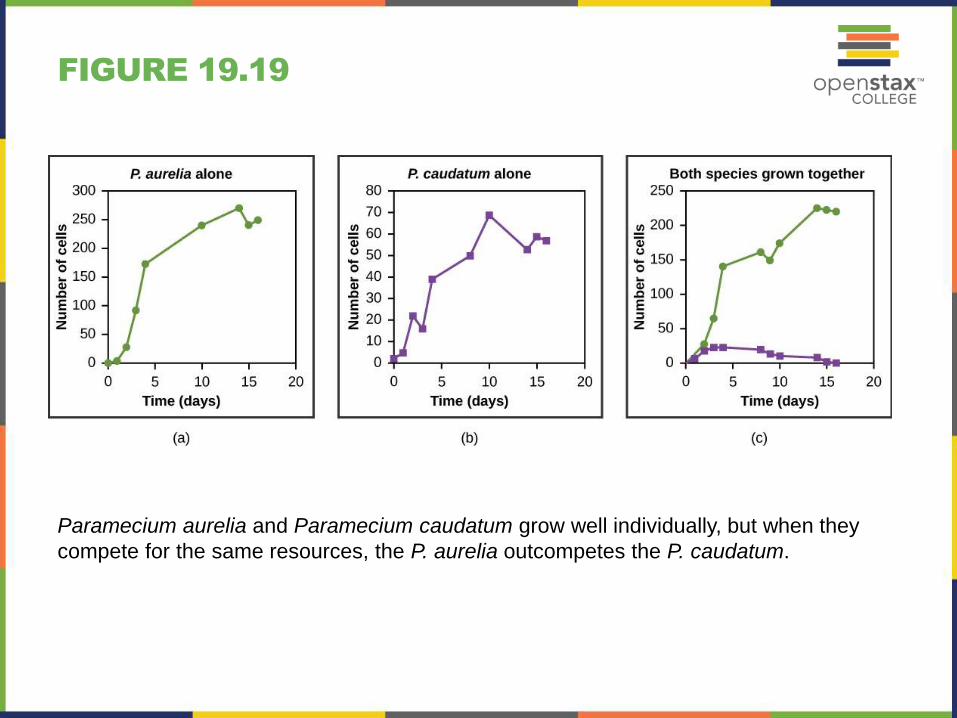
FIGURE 19.19
Paramecium aurelia and Paramecium caudatum grow well individually, but when they
compete for the same resources, the P. aurelia outcompetes the P. caudatum.
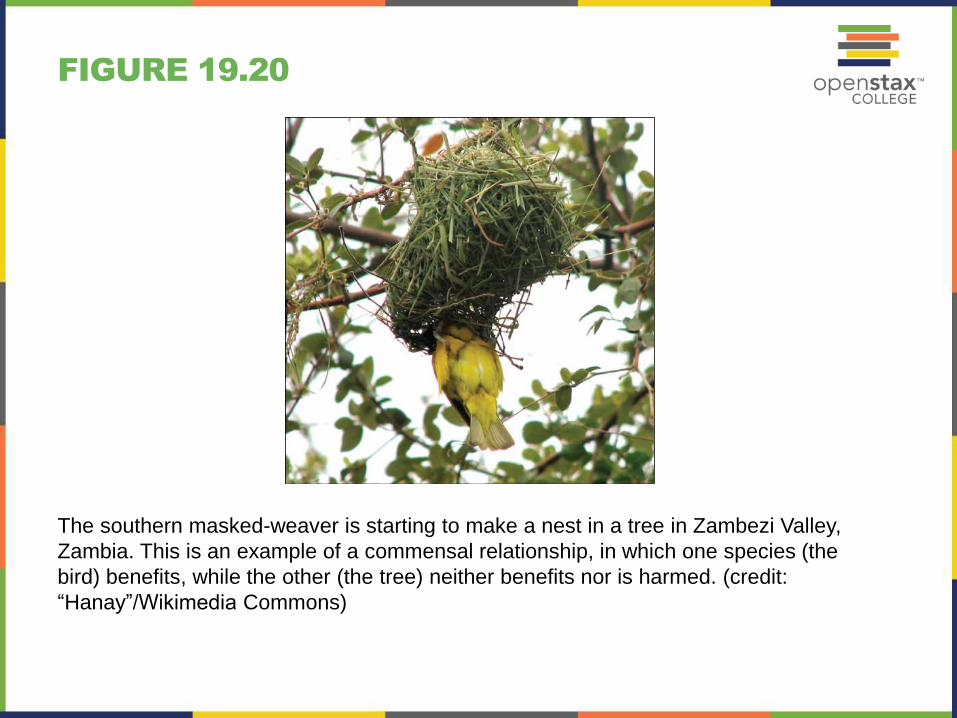
FIGURE 19.20
The southern masked-weaver is starting to make a nest in a tree in Zambezi Valley,
Zambia. This is an example of a commensal relationship, in which one species (the
bird) benefits, while the other (the tree) neither benefits nor is harmed. (credit:
“Hanay”/Wikimedia Commons)
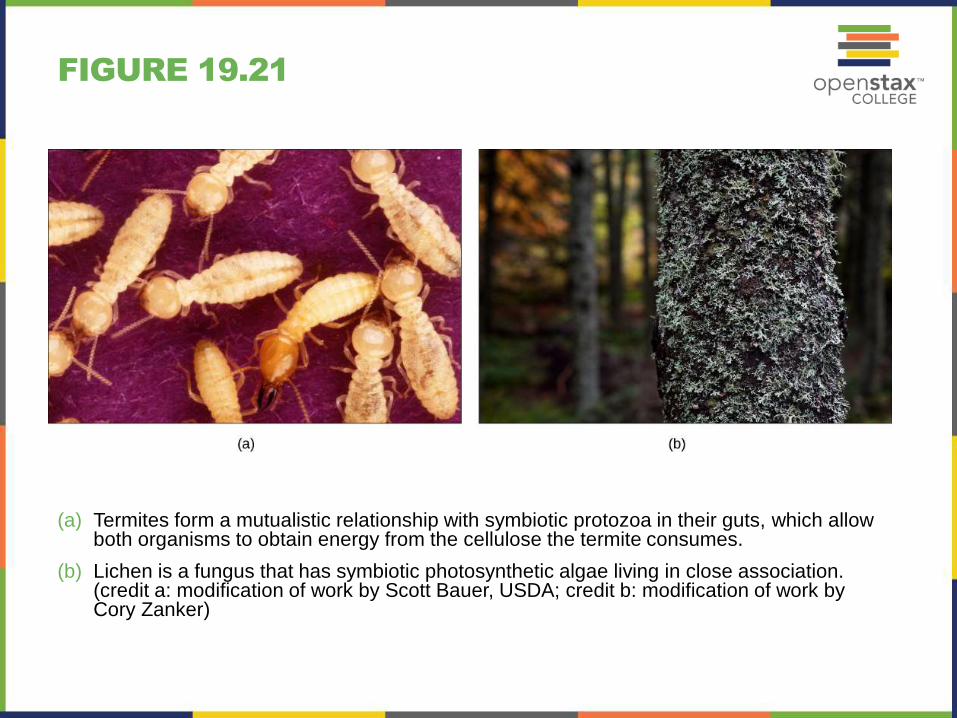
FIGURE 19.21
(a) Termites form a mutualistic relationship with symbiotic protozoa in their guts, which allow both organisms to obtain energy from the cellulose the termite consumes.
(b) Lichen is a fungus that has symbiotic photosynthetic algae living in close association. (credit a: modification of work by Scott Bauer, USDA; credit b: modification of work by Cory Zanker)
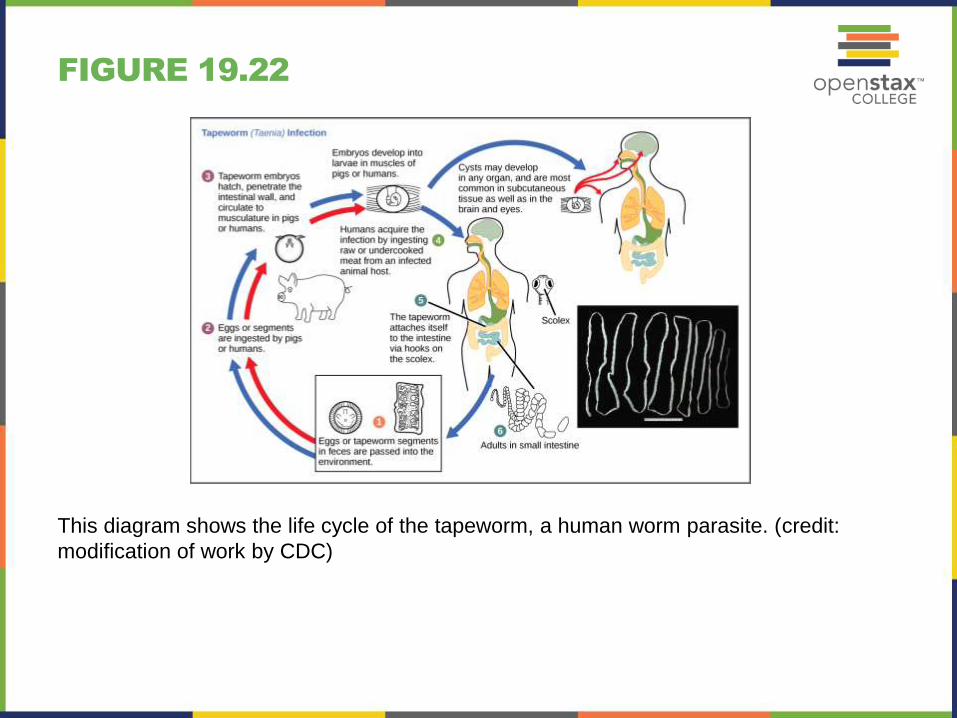
FIGURE 19.22
This diagram shows the life cycle of the tapeworm, a human worm parasite. (credit:
modification of work by CDC)
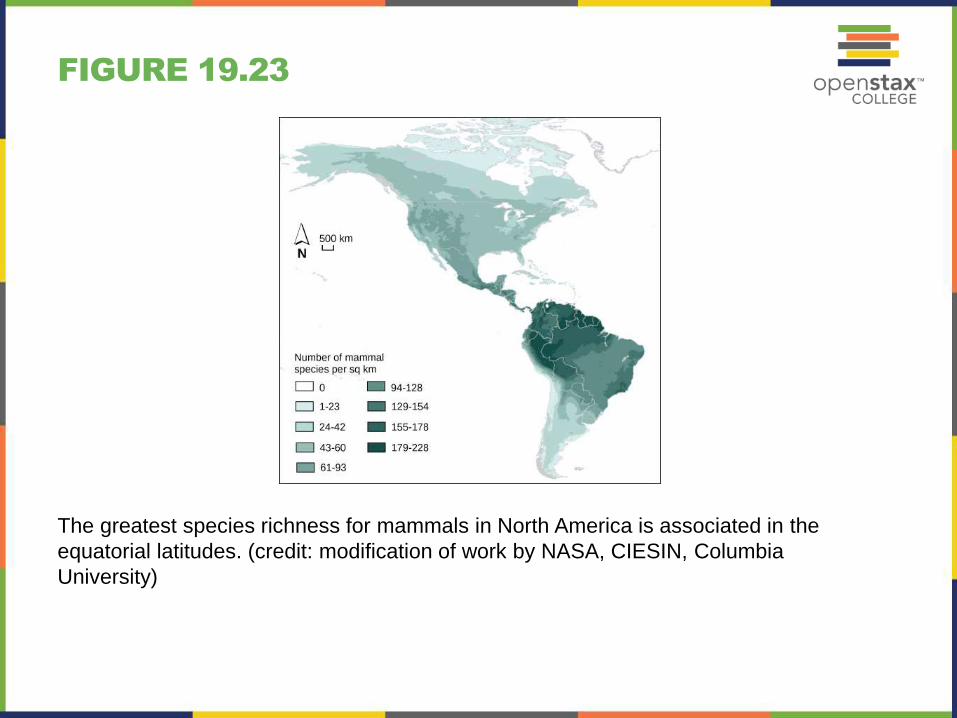
FIGURE 19.23
The greatest species richness for mammals in North America is associated in the
equatorial latitudes. (credit: modification of work by NASA, CIESIN, Columbia
University)
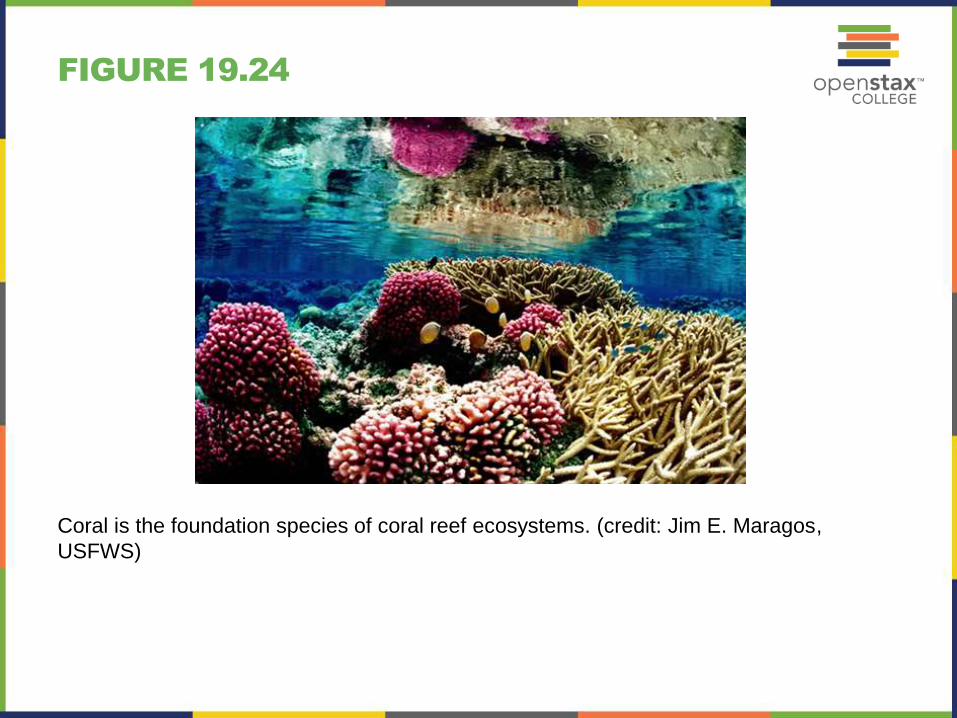
FIGURE 19.24
Coral is the foundation species of coral reef ecosystems. (credit: Jim E. Maragos,
USFWS)
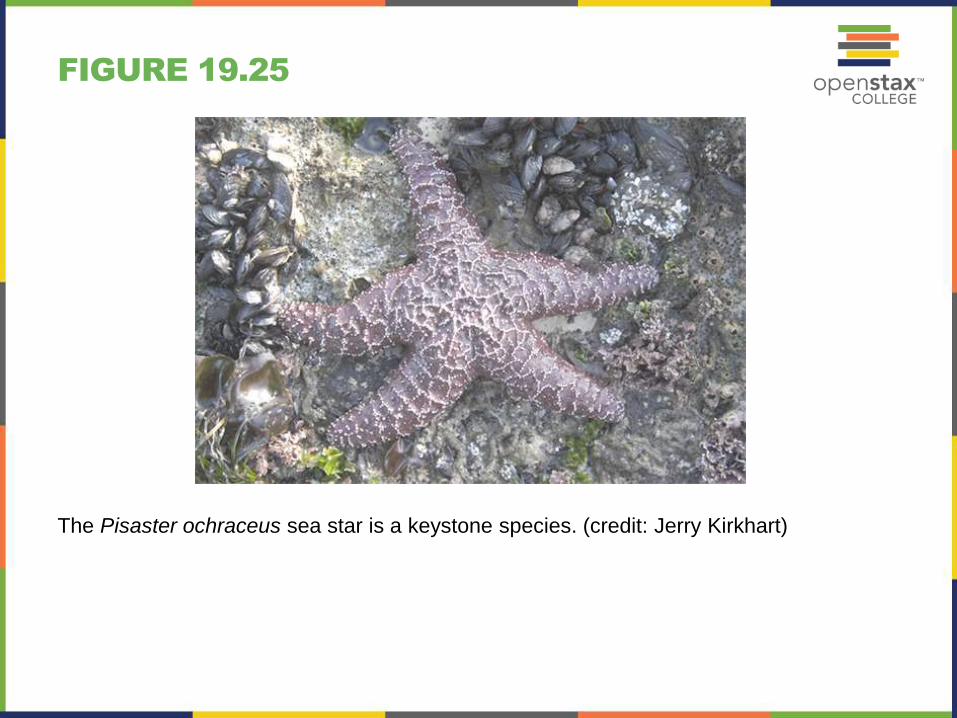
FIGURE 19.25
The Pisaster ochraceus sea star is a keystone species. (credit: Jerry Kirkhart)
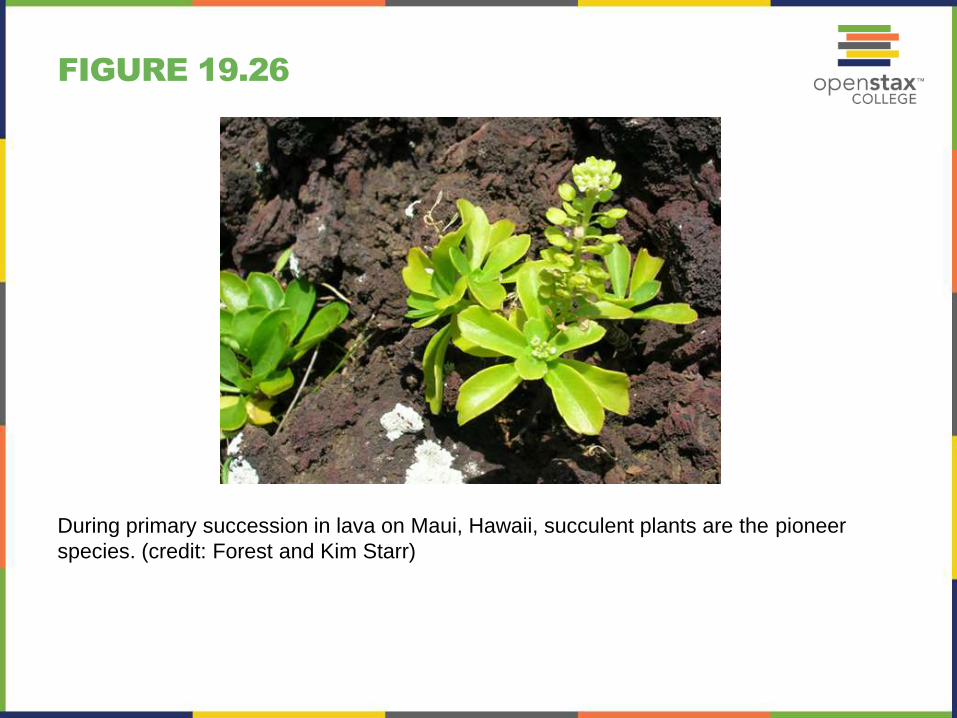
FIGURE 19.26
During primary succession in lava on Maui, Hawaii, succulent plants are the pioneer
species. (credit: Forest and Kim Starr)
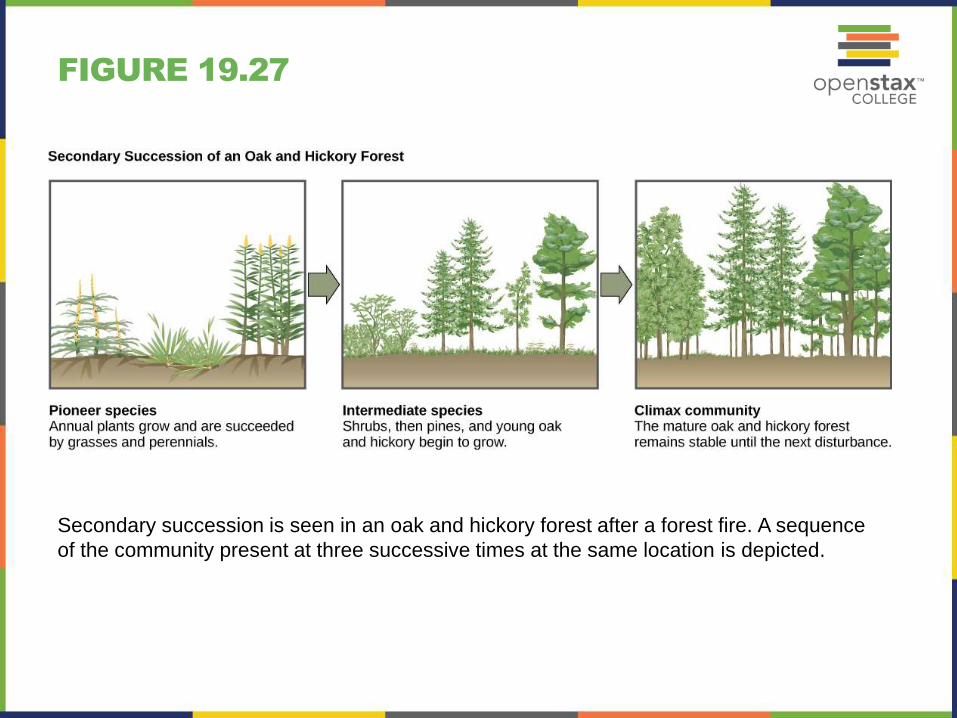
FIGURE 19.27
Secondary succession is seen in an oak and hickory forest after a forest fire. A sequence
of the community present at three successive times at the same location is depicted.

This PowerPoint file is copyright 2011-2013, Rice University. All
Rights Reserved.