Embed Size (px)
Citation preview

1Baik S, et al. BMJ Open 2020;10:e034844. doi:10.1136/bmjopen-2019-034844
Open access
Association between tendon ruptures and use of fluoroquinolone, and other oral antibiotics: a 10- year retrospective study of 1 million US senior Medicare beneficiaries
Seo Baik , Jason Lau, Vojtech Huser, Clement J McDonald
To cite: Baik S, Lau J, Huser V, et al. Association between tendon ruptures and use of fluoroquinolone, and other oral antibiotics: a 10- year retrospective study of 1 million US senior Medicare beneficiaries. BMJ Open 2020;10:e034844. doi:10.1136/bmjopen-2019-034844
► Prepublication history and additional materials for this paper is available online. To view these files, please visit the journal online (http:// dx. doi. org/ 10. 1136/ bmjopen- 2019- 034844).
Received 08 October 2019Revised 30 October 2020Accepted 04 November 2020
Lister Hill National Center for Biomedical Communications, National Library of Medicine, Bethesda, Maryland, USA
Correspondence toDr Clement J McDonald; ClemMcDonald@ mail. nih. gov
Original research
© Author(s) (or their employer(s)) 2020. Re- use permitted under CC BY- NC. No commercial re- use. See rights and permissions. Published by BMJ.
ABSTRACTObjectives To assess the association of fluoroquinolone use with tendon ruptures compared with no fluoroquinolone and that of the four most commonly prescribed non- fluoroquinolone antibiotics in the USA.Design Retrospective observational study.Setting US seniors enrolled in the federal old- age, survivor’s insurance programme.Participants 1 009 925 Medicare fee- for- service beneficiaries and their inpatient, outpatient, prescription drug records were used.Interventions Seven oral antibiotics, fluoroquinolones (ciprofloxacin, levofloxacin, moxifloxacin) and amoxicillin, amoxicillin- clavulanate, azithromycin and cephalexin.Primary and secondary outcome measures All tendon ruptures combined, and three types of tendon ruptures by anatomic site, Achilles tendon rupture, rupture of rotator cuff and other tendon ruptures occurred in 2007–2016.Results Of three fluoroquinolones, only levofloxacin exhibited a significant increased risk of tendon ruptures—16% (HR=1.16; 95% CI 1.06 to 1.28), and 120% (HR=2.20; 95% CI 1.50 to 3.24) for rotator cuff and Achilles tendon rupture, respectively, in the ≤30 days window. Ciprofloxacin (HR=0.96; 95% CI 0.89 to 1.03) and moxifloxacin (HR=0.59; 95% CI 0.37 to 0.93) exhibited no increased risk of tendon ruptures combined.Among the non- fluoroquinolone antibiotics, cephalexin exhibited increased risk of combined tendon ruptures (HR=1.31; 95% CI 1.22 to 1.41) and modest to large risks across all anatomic rupture sites (HRs 1.19–1.93) at ≤30 days window. Notably, the risk of levofloxacin never exceeded the risk of the non- fluoroquinolone, cephalexin in any comparison.Conclusions In our study, fluoroquinolones as a class were not associated with the increased risk of tendon ruptures. Neither ciprofloxacin nor moxifloxacin exhibited any risk for tendon ruptures. Levofloxacin did exhibit significant increased risk. Cephalexin with no reported effect on metalloprotease activity had an equal or greater risk than levofloxacin; so we question whether metalloprotease activity has any relevance to observed associations with tendon rupture. Confounding by indication bias may be more relevant and should be given more consideration as explanation for significant associations in observational studies of tendon rupture.
INTRODUCTIONFluoroquinolones (FQ) are among the most widely prescribed antibiotics in the outpa-tient setting1 2 due to their broad spectrum treatment of bacteria found in respiratory, urinary, joint, and skin infections. Several observational studies have reported the asso-ciation between the use of FQs and tendi-nitis and tendon rupture (TR), especially of the Achilles tendon3–12 and the US Food and Drug Administration (FDA) issued black box warnings to FQ antibiotics beginning in 2008.13 The warning was updated in 2016 to recommend using alternative antibiotics when possible.14 15 The fact that FQs upreg-ulate the production of metalloproteinase
Strengths and limitations of this study
► We conducted a large (more than 1 million US senior subjects) retrospective study of outpatient prescrip-tion drug records to assess the association between the use of fluoroquinolones and the occurrence of tendon ruptures compared with the most commonly used non- fluoroquinolone oral antibiotics.
► Our study included all oral fluoroquinolones (cip-rofloxacin, levofloxacin, moxifloxacin) prescribed in the USA and the four most commonly pre-scribed non- fluoroquinolone antibiotics: amoxicillin, amoxicillin- clavulanate, azithromycin and cephalex-in as controls.
► In addition to reporting the risk of any tendon rup-ture, we also reported the risk of three types of tendon ruptures by anatomic site (1) Achilles ten-don rupture, (2) rupture of rotator cuff and (3) ten-don ruptures on other anatomic sites as separate outcomes.
► This study is possibly only applicable to US se-nior, aged 65 or more, Medicare fee- for- service beneficiaries.
► We had no options to verify claims diagnoses via chart review.
on October 15, 2021 by guest. P
rotected by copyright.http://bm
jopen.bmj.com
/B
MJ O
pen: first published as 10.1136/bmjopen-2019-034844 on 21 D
ecember 2020. D
ownloaded from

2 Baik S, et al. BMJ Open 2020;10:e034844. doi:10.1136/bmjopen-2019-034844
Open access
enzymes with collagenase activity that could weaken tendons is taken as a mechanism to explain this reported risk.16–18
Studies that reported association between FQ use and TR used one or more other antibiotics as controls. One study compared the FQ rupture rates with patients using azithromycin (AZT), the most frequently used oral antibi-otic in the USA. Only two focused principally on TR risk among the elderly. None compared TR rates of FQs with those of cephalexin (LEX)—the third most commonly prescribed oral antibiotic in the USA.
The Virtual Research Data Center (VRDC) of Center for Medicare and Medicaid Services (CMS)19 carries more than 10 years of Medicare claims, which include information about the usage of prescription drugs and encounter diagnoses (including TRs). It also carries information about 42 major chronic conditions, demo-graphic characteristic and vital status. We conducted a large observational study using the VRDC to assess the association of FQ antibiotics with TR compared with that of the four most commonly prescribed non- FQ antibiotics in the USA. Here, we report the results of that analysis.
METHODSPatient and public involvementNeither patients nor the public were involved in the design of the study.
Study populationWe derived our study population from a 20% random sample of Medicare prescription drug coverage (part D) enrollees who first enrolled in the Medicare under old age and survivors insurance within a month of age 65 (779–781 month old) and on or after 1 January 2007, the first full year of part D prescriptions availability. We included claim data through 31 December 2016, the end of VRDC claim data available to us. All of the VRDC data are deidentified and researchers must perform all of their analysis within the VRDC computer systems, and can only pull statistical results from it.19 This study was declared not human subject research by the Office of Human Research Protection at the National Institutes of Health and by the CMS’s Privacy Board.
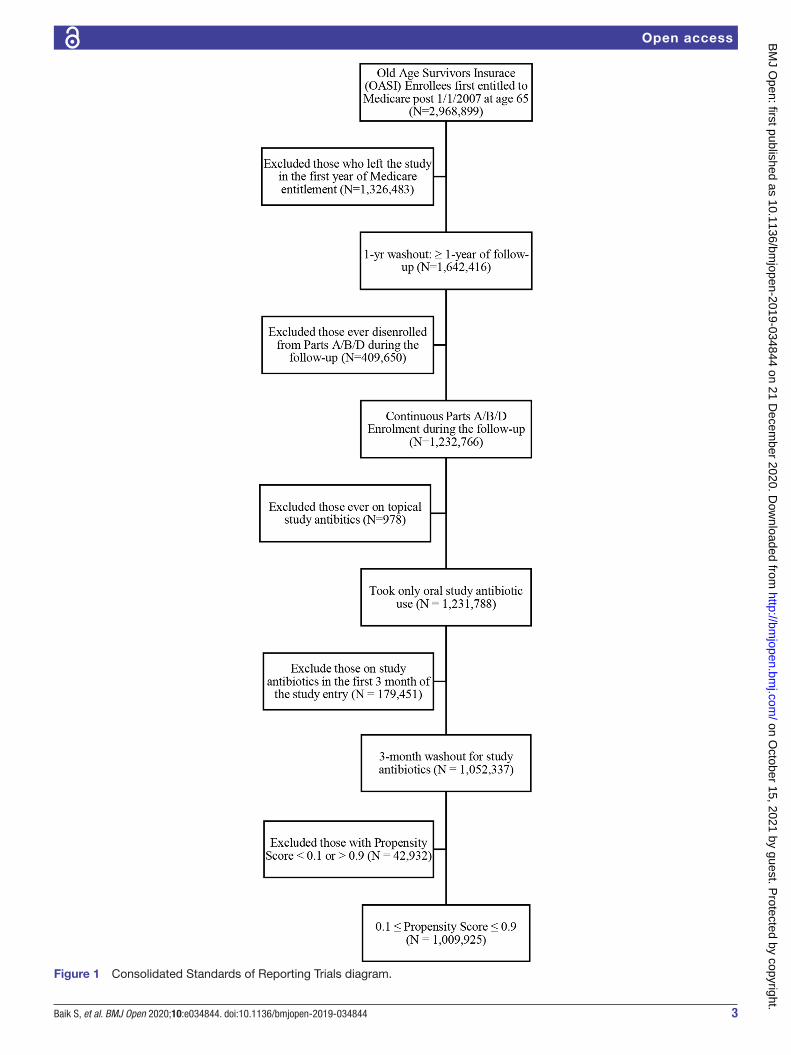
We required subjects to be continuously enrolled in hospital insurance (part A) and medical insurance (part B) to assure we had full outpatient and inpatient claims data, which are not available for nearly 20% of subjects with part D only.20 To obtain a cohort of patients with new TR, we excluded individuals with TRs recorded in the first year of their Medicare entitlement.21 In order to assure sufficient follow- up, we excluded individuals with less than 1- year follow- up. Moreover, to obtain incident (or new) drug user cohort, we excluded individuals who were prescribed any study antibiotics during their first 3 months after part D enrolment, while ignoring the data during the same time window for individuals not taking
study antibiotics. By doing so, we minimise survivor bias from prevalent users (figure 1).
Primary outcomeWe identified patients with TR based on International Classification of Diseases (ICD)-9- CM codes of 726.13, 727.60–727.69, and ICD-10- CM codes of M66.2, M66.3, M66.8, M66.9 and M75.1. We combined all TRs and reported them as one outcome, and report three types of TRs by anatomic site (1) Achilles TR, (2) rupture of rotator cuff and (3) TRs on other anatomic sites as sepa-rate outcomes. We focused on Achilles TR because it was the sole focus of many prior studies and on rotator cuff TR because it is the predominant TR of the elderly. We lumped the remaining as ‘other TRs’.
Study antibioticsWe included a total of seven study antibiotics prescribed in the USA including all three oral FQs (moxiflox-acin (MXF), ciprofloxacin (CIP), levofloxacin (LVX), the active stereoisomer of ofloxacin, and the four most frequently prescribed non- FQ oral antibiotics amoxicillin (AMX), amoxicillin clavulanate (AMC), AZT and LEX as controls. CIP and the four non- FQ, study antibiotics were the five most frequently used US oral antibiotics in 2011.
Statistical analysisWe analysed each of the four TR outcomes in separate Fine- Gray competing risk regression analyses with death as the competing risk.22 23 Individuals became eligible for ‘the study’ at their Medicare enrolment but prescription data did not become available until their part D enrol-ment. We followed them from their entry in part D (while accounting for left truncation24) until their first diagnosis of TR, death, switch to a capitated plan, disenrolment from Medicare or 31 December 2016—whichever came first. In each regression analysis, we included the seven antibiotics whose effects on TR were our primary interest. We adjusted HR of each study antibiotic for concurrent use of the other study antibiotics. We also adjusted for calendar year of individual’s part D entry, to account for secular trends, and their sociodemographic characteris-tics of gender, race, rural residency (yes/no) and income status. We inferred individual’s income level from the monthly indicators of dual eligibility and Low Income Subsidy (LIS) status, which separate subjects into three groups; (1) dual whose income is below 135% Federal Poverty Line (FPL); (2) non- dual LIS whose income is between 135% and 150% FPL; and (3) non- dual no LIS whose income is above 150% FPL, respectively. We used this variable in the analysis as a surrogate for economic status.25 We also included the 42 chronic conditions within the Medicare Master Beneficiary Summary File26 that had >1% prevalence as measures of overall health. We assumed that patients were on a given study drug from the prescription dispensing date to the end of days of supply. We did not distinguish between different brands of a study drugs. Following the approach of prior studies,3–5
on October 15, 2021 by guest. P
rotected by copyright.http://bm
jopen.bmj.com
/B
MJ O
pen: first published as 10.1136/bmjopen-2019-034844 on 21 D
ecember 2020. D
ownloaded from
3Baik S, et al. BMJ Open 2020;10:e034844. doi:10.1136/bmjopen-2019-034844
Open access
Figure 1 Consolidated Standards of Reporting Trials diagram.
on October 15, 2021 by guest. P
rotected by copyright.http://bm
jopen.bmj.com
/B
MJ O
pen: first published as 10.1136/bmjopen-2019-034844 on 21 D
ecember 2020. D
ownloaded from

4 Baik S, et al. BMJ Open 2020;10:e034844. doi:10.1136/bmjopen-2019-034844
Open access
we separated subjects by temporal exposure within each study drug, including groups for never exposed, exposed within 30 days, 31–60 days, and >60 days of the index (or TR event) time. Thus, by this approach, we could detect the presumed short- term action of the FQ’s on tendons and avoid the risk of non- differential misclassification that can occur with too simple (yes/no) drug exposure measures.27 In order to minimise the immortal time bias, we treated all drug usage measures and all sociodemo-graphic characteristics, except gender, race and rural residency, as time- varying covariates.28 29 In order to miti-gate selection bias towards use of any study antibiotics, we employed a propensity score (PS) approach.30 31 We first derived a PS of taking any of study antibiotics as a func-tion of individual’s characteristics at the time of the first antibiotic use after part D entry from a multiple logistic regression. We used the median days to the first study antibiotic use in patients taking study antibiotics as the cut- off time for individuals not taking study antibiotics. We performed our analyses with an inverse propensity score weight (IPSW) excluding individuals with the PS below 0.1 and above 0.9, to mitigate poorer performance in the presence of a strong treatment- selection process.32 In post- hoc analyses, we also compared the risk of TR of each study antibiotics to that of every other study antibi-otic on a pairwise basis.
RESULTSStudy population and secular trendFrom our 20% sample of part D enrollees, 1 009 925 indi-viduals satisfied all our selection criteria including the washout of individuals with any antibiotic use in their first 3 months of part D enrolment (figure 1). Follow- up began with an individual’s enrolment in part D programme (median (IQR) 0 (0–122) days from the Medicare entitle-ment). We followed them for a median of 3.6 years (total 4 030 897 patient years) until their first diagnosis of TR (3.5%), death (4.6%), switch to a capitated plan (12.6%), disenrolment from Medicare (<1%) or study end on 31 December 2016 (79.3%), whichever came first. Patients had their first post enrolment claim with a diagnosis of TR at a median age of 68.5 (IQR 67.2–70.4). The propor-tions of non- Hispanic white, female and rural residents were 80.7%, 57.0% and 22.6% respectively. About a fifth of individuals received federal/state subsidies, that is, Medicaid coverage on top of Medicare (dual 16.1%) or assistance in paying their part D premium and coinsur-ance/copayment (non- dual LIS 2.7%). Among the 42 Medicare chronic conditions, hypertension (67.3%), hyperlipidaemia (68.4%), cataract (46.4%), rheumatoid arthritis/osteoarthritis (36.6%), anaemia (30.4%), isch-aemic heart disease (26.2%) and chronic kidney disease (17.9%) were the seven most prevalent (table 1).
Of the 328 654 (33.0%) patients who ever took an FQ, 71.5%, 47.5% and 4.5% had taken CIP, LVX and MXF, respectively. Of 576 885 (57.1%) of patients who ever took a non- FQ antibiotic, the figures were 53.6%, 44.9%,
33.9% and 31.1% for AZM, AMX, LEX and AMC, respec-tively. Patients who took one or more study antibiotics took a median (IQR) of 3.0 (1.0–6.0) study antibiotic prescriptions and took a median (IQR) 2.0 (1.0–3.0) different study antibiotics during the observation period. About 2.5% patients who took one or more study antibi-otics took one or more such antibiotics at the same time.
Secular trends in study antibiotics usage existed (see online supplemental figure 1). MXF usage declined precipitously from 5.0% in 2007 to almost zero in 2016—overweighting the MXF statistics for early entrants into Medicare and yielding a longer mean follow- up time. CIP use hit a peak, and LVX, a nadir, in 2011. The use of AMX, AMC and LEX trended slowly upward (see online supplemental figure 1). The mode (median) of supply durations for each antibiotics was short—10 (7) for AMX, 10 (10) for AMC, 5 (5) for AZM, 10 (7) for LEX, 7 (7) for CIP, 10 (7) for LVX, 10 (11) for MXF. About 35% of indi-viduals were never exposed to any of the study antibiotics during the study period.
Unadjusted figures for TR prevalence across each of the seven study antibiotic users and the no study antibi-otic users ranged from a high of 5.2% for MXF to a low of 2.9% for no antibiotic (table 1). Except for MXF, the unadjusted prevalence of TRs associated with each non- FQ antibiotic was greater than or equal to that of each FQ antibiotic. The TR rates per 1000 patient years followed the same pattern, with the non- FQ antibiotics topping the rates of all FQs except MXF (with the highest rate), possibly due to overweighting of MXF usage in the early years of the study. Patients who ever took an FQ had the highest unadjusted rate of death per 1000 person years. LVX’s death rate was nearly twice the rate of each non- FQ antibiotics. The size of the associations with conditions like diabetes, chronic renal failure and heart failure paral-leled the magnitude of the death rates and was generally higher with FQs than non- FQ antibiotics (table 1).
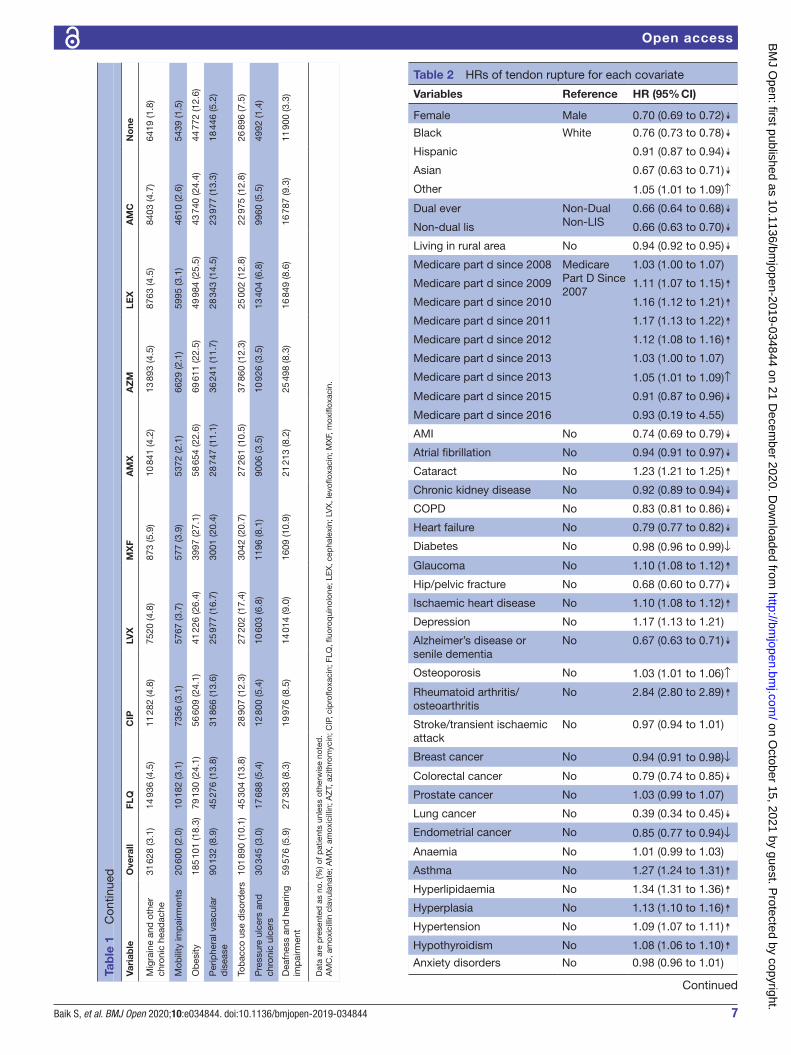
Primary analysisTable 2 presents HRs for all non- antibiotic covariates in our Fine- Gray competing risk regression with IPSW. For simplicity sake, in table 2, we report the HRs of all anatomic types of TRs taken together. Being a female (vs male), African- American, Hispanic, and Asian (vs white), being dual or non- dual LIS (vs non- dual no LIS) and living in a rural area were all associated with a reduced risk of TR. These risk reductions were 24% or more for all but Hispanics and rural residency covariates, and the reductions were similar across all anatomic sites. In general, life- threatening chronic conditions, such as Acute Myocardial Infarction (AMI), Chronic Obstructive Pulmonary Disease (COPD), heart failure and colorectal/lung/endometrial cancers were associated with a lower risk of TR in a range of 15%–60% below control possibly due to constrained physical activity and/or shortened life span. Notably, diabetes and chronic renal disease, previ-ously reported as risk factors for TR,33 34 exhibited no increased TR risk. Mobility impairments had reduced risk
on October 15, 2021 by guest. P
rotected by copyright.http://bm
jopen.bmj.com
/B
MJ O
pen: first published as 10.1136/bmjopen-2019-034844 on 21 D
ecember 2020. D
ownloaded from

5Baik S, et al. BMJ Open 2020;10:e034844. doi:10.1136/bmjopen-2019-034844
Open access
Tab
le 1
O
utco
me,
med
ical
/med
icat
ion
use,
dis
ease
s an
d p
atie
nt c
hara
cter
istic
s b
y ty
pe
of a
ntib
iotic
s
Vari
able
Ove
rall
FLQ
CIP
LVX
MX
FA
MX
AZ
MLE
XA
MC
No
ne
N1
009
925
328
654
234
994
155
991
14 7
2825
9 12
530
8 98
519
5 73
117
9 61
635
6 36
4
Tend
on r
uptu
re34
880
(3.5
)12
517
(3.8
)88
11 (3
.7)
5904
(3.8
)77
0 (5
.2)
9636
(3.7
)12
448
(4.0
)80
19 (4
.1)
6622
(3.7
)10
169
(2.9
)
Dea
th46
468
(4.6
)23
249
(7.1
)14
821
(6.3
)14
610
(9.4
)21
36 (1
4.5)
9632
(3.7
)14
608
(4.7
)11
394
(5.8
)99
51 (5
.5)
13 6
45 (3
.8)
Cen
sore
d a
t H
MO
en
try
127
162
(12.
6)27
573
(8.4
)19
847
(8.4
)11
142
(7.1
)15
71 (1
0.7)
21 2
15 (8
.2)
26 1
40 (8
.5)
14 8
87 (7
.6)
12 6
74 (7
.1)
65 8
86 (1
8.5)
Cen
sore
d a
t d
isen
rolm
ent
145
(0.0
)25
(0.0
)13
(0.0
)13
(0.0
)2
(0.0
)19
(0.0
)27
(0.0
)23
(0.0
)16
(0.0
)85
(0.0
)
Cen
sore
d a
t 31
D
ecem
ber
201
680
1 27
0 (7
9.3)
265
290
(80.
7)19
1 50
2 (8
1.5)
124
322
(79.
7)10
249
(69.
6)21
8 62
3 (8
4.4)
255
762
(82.
8)16
1 40
8 (8
2.5)
150
353
(83.
7)26
6 57
9 (7
4.8)
Year
s of
follo
w- u
p,
med
ian
(tota
l)3.
6 (4
030
89
7)4.
6 (1
620
894
)4.
8 (1
190
308
)4.
8 (7
89 8
49)
6.0
(87
397)
4.5
(1 2
74 3
57)
4.6
(1 5
29 3
70)
4.8
(1 0
00 4
59)
4.6
(890
340
)2.
5 (1
067
731
)
Tend
on r
uptu
re, 1
000
per
son
year
s8.
657.
727.
407.
478.
817.
568.
148.
027.
449.
52
Dea
th, 1
000
per
son
year
s11
.53
14.3
412
.45
18.5
024
.44
7.56
9.55
11.3
911
.18
12.7
8
Fem
ale
575
885
(57.
0)19
7 91
5 (6
0.2)
146
745
(62.
4)89
682
(57.
5)87
47 (5
9.4)
151
383
(58.
4)19
4 10
1 (6
2.8)
113
308
(57.
9)10
4 74
9 (5
8.3)
191
069
(53.
6)
Whi
te81
4 93
3 (8
0.7)
274
785
(83.
6)19
6 04
8 (8
3.4)
131
725
(84.
4)12
464
(84.
6)21
5 10
1 (8
3.0)
259
657
(84.
0)16
7 82
5 (8
5.7)
153
723
(85.
6)27
1 90
6 (7
6.3)
Bla
ck75
930
(7.5
)20
017
(6.1
)14
286
(6.1
)88
93 (5
.7)
956
(6.5
)15
622
(6.0
)17
296
(5.6
)96
25 (4
.9)
9199
(5.1
)35
023
(9.8
)
His
pan
ic56
582
(5.6
)17
044
(5.2
)12
607
(5.4
)79
43 (5
.1)
628
(4.3
)12
494
(4.8
)14
805
(4.8
)89
76 (4
.6)
7802
(4.3
)24
391
(6.8
)
Asi
an26
336
(2.6
)73
16 (2
.2)
5362
(2.3
)31
44 (2
.0)
356
(2.4
)76
24 (2
.9)
7945
(2.6
)35
39 (1
.8)
3440
(1.9
)10
437
(2.9
)
Oth
er36
144
(3.6
)94
92 (2
.9)
6691
(2.8
)42
86 (2
.7)
324
(2.2
)82
84 (3
.2)
9282
(3.0
)57
66 (2
.9)
5452
(3.0
)14
607
(4.1
)
Eve
r d
ual
162
988
(16.
1)54
055
(16.
4)38
277
(16.
3)28
156
(18.
0)29
08 (1
9.7)
35 3
05 (1
3.6)
44 9
40 (1
4.5)
30 9
62 (1
5.8)
25 2
55 (1
4.1)
66 9
86 (1
8.8)
Non
- dua
l LIS
26 9
55 (2
.7)
7648
(2.3
)54
59 (2
.3)
3746
(2.4
)38
5 (2
.6)
5224
(2.0
)68
28 (2
.2)
4191
(2.1
)38
18 (2
.1)
12 5
95 (3
.5)
Non
- dua
l No
LIS
819
982
(81.
2)26
6 95
1 (8
1.2)
191
258
(81.
4)12
4 08
9 (7
9.5)
11 4
35 (7
7.6)
218
596
(84.
4)25
7 21
7 (8
3.2)
160
578
(82.
0)15
0 54
3 (8
3.8)
276
783
(77.
7)
Livi
ng in
rur
al a
rea
228
199
(22.
6)78
581
(23.
9)56
385
(24.
0)38
847
(24.
9)28
01 (1
9.0)
58 8
05 (2
2.7)
72 2
82 (2
3.4)
49 9
77 (2
5.5)
42 2
88 (2
3.5)
77 0
87 (2
1.6)
Day
s on
Rx,
med
ian
(IQR
)N
/AN
/A10
.0 (7
.0–2
0.0)
10.0
(7.0
–17.
0)10
.0 (7
.0–1
2.0)
10.0
(7.0
–20.
0)5.
0 (5
.0–1
1.0)
10.0
(7.0
–16.
0)10
.0 (1
0.0–
20.0
)N
/A
Hos
pita
lisat
ion
349
959
(29.
5)19
8 84
6 (4
5.4)
142
538
(45.
3)11
3 82
9 (5
2.5)
14 0
02 (6
0.3)
132
304
(38.
8)15
6 18
5 (3
7.9)
119
209
(45.
9)10
3 51
5 (4
2.5)
51 5
25 (1
4.4)
Out
pat
ient
vis
its p
er
year
, med
ian
(IQR
)19
.6 (1
1.1–
33.0
)27
.1 (1
7.2–
42.7
)27
.3 (1
7.5–
42.9
)30
.1 (1
9.0–
47.8
)34
.0 (2
1.7–
53.7
)23
.6 (1
4.5–
37.5
)24
.6 (1
5.5–
38.8
)27
.5 (1
7.2–
43.2
)26
.6 (1
6.7–
42.2
)12
.3 (6
.0–2
1.8)
AM
I21
222
(2.1
)99
99 (3
.0)
6810
(2.9
)58
62 (3
.8)
698
(4.7
)64
74 (2
.5)
8079
(2.6
)62
15 (3
.2)
5292
(2.9
)50
12 (1
.4)
Atr
ial fi
bril
latio
n71
635
(7.1
)31
752
(9.7
)21
757
(9.3
)17
731
(11.
4)20
28 (1
3.8)
23 9
74 (9
.3)
26 1
82 (8
.5)
21 9
35 (1
1.2)
18 7
64 (1
0.4)
16 3
14 (4
.6)
Cat
arac
t46
8 60
8 (4
6.4)
183
870
(55.
9)13
4 19
6 (5
7.1)
88 5
74 (5
6.8)
9216
(62.
6)14
4 45
5 (5
5.7)
174
897
(56.
6)11
2 02
0 (5
7.2)
101
079
(56.
3)12
4 93
1 (3
5.1)
Chr
onic
kid
ney
dis
ease
180
441
(17.
9)86
021
(26.
2)62
323
(26.
5)46
121
(29.
6)46
51 (3
1.6)
53 7
13 (2
0.7)
65 5
77 (2
1.2)
50 3
61 (2
5.7)
43 1
82 (2
4.0)
42 9
16 (1
2.0)
CO
PD
130
840
(13.
0)71
913
(21.
9)43
961
(18.
7)48
430
(31.
0)61
06 (4
1.5)
40 1
09 (1
5.5)
66 5
36 (2
1.5)
37 4
13 (1
9.1)
37 5
79 (2
0.9)
22 7
39 (6
.4)
Hea
rtfa
ilure
103
010
(10.
2)51
814
(15.
8)34
870
(14.
8)31
377
(20.
1)37
76 (2
5.6)
32 7
92 (1
2.7)
41 6
47 (1
3.5)
31 5
85 (1
6.1)
27 2
23 (1
5.2)
21 9
07 (6
.1)
Dia
bet
es28
4 91
9 (2
8.2)
113
424
(34.
5)81
175
(34.
5)57
697
(37.
0)59
42 (4
0.3)
81 1
55 (3
1.3)
98 1
76 (3
1.8)
67 5
48 (3
4.5)
59 9
84 (3
3.4)
81 4
48 (2
2.9)
Gla
ucom
a15
0 83
9 (1
4.9)
56 9
90 (1
7.3)
41 9
84 (1
7.9)
26 6
03 (1
7.1)
2930
(19.
9)45
597
(17.
6)54
726
(17.
7)33
936
(17.
3)31
065
(17.
3)42
355
(11.
9)
Con
tinue
d
on October 15, 2021 by guest. P
rotected by copyright.http://bm
jopen.bmj.com
/B
MJ O
pen: first published as 10.1136/bmjopen-2019-034844 on 21 D
ecember 2020. D
ownloaded from

6 Baik S, et al. BMJ Open 2020;10:e034844. doi:10.1136/bmjopen-2019-034844
Open access
Vari
able
Ove
rall
FLQ
CIP
LVX
MX
FA
MX
AZ
MLE
XA
MC
No
ne
Hip
/pel
vic
frac
ture
7982
(0.8
)40
86 (1
.2)
3000
(1.3
)22
89 (1
.5)
274
(1.9
)26
73 (1
.0)
3005
(1.0
)25
15 (1
.3)
1914
(1.1
)16
89 (0
.5)
Isch
aem
iche
art
dis
ease
264
648
(26.
2)11
7 41
6 (3
5.7)
82 1
82 (3
5.0)
63 6
59 (4
0.8)
6956
(47.
2)83
682
(32.
3)10
1 99
9 (3
3.0)
70 6
12 (3
6.1)
63 3
63 (3
5.3)
63 3
72 (1
7.8)
Dep
ress
ion
210
714
(20.
9)94
554
(28.
8)68
625
(29.
2)49
277
(31.
6)52
98 (3
6.0)
65 6
42 (2
5.3)
83 2
53 (2
6.9)
56 7
47 (2
9.0)
51 1
50 (2
8.5)
49 3
20 (1
3.8)
Alz
heim
er’s
dis
ease
or
seni
le d
emen
tia39
132
(3.9
)19
796
(6.0
)14
309
(6.1
)11
030
(7.1
)12
06 (8
.2)
11 1
40 (4
.3)
13 8
09 (4
.5)
11 8
46 (6
.1)
9309
(5.2
)94
00 (2
.6)
Ost
eop
oros
is10
6 96
6 (1
0.6)
47 0
33 (1
4.3)
35 2
17 (1
5.0)
22 9
18 (1
4.7)
2738
(18.
6)34
610
(13.
4)44
016
(14.
2)26
996
(13.
8)24
393
(13.
6)25
216
(7.1
)
Rhe
umat
oid
art
hriti
s/os
teoa
rthr
itis
369
584
(36.
6)16
0 09
1 (4
8.7)
117
018
(49.
8)80
115
(51.
4)82
59 (5
6.1)
126
702
(48.
9)14
8 65
3 (4
8.1)
101
310
(51.
8)88
017
(49.
0)81
855
(23.
0)
Str
oke/
tra
nsie
nt
isch
aem
ic a
ttac
k58
886
(5.8
)27
702
(8.4
)19
843
(8.4
)15
051
(9.6
)16
70 (1
1.3)
17 8
29 (6
.9)
22 0
38 (7
.1)
16 6
84 (8
.5)
14 2
45 (7
.9)
14 2
62 (4
.0)
Bre
ast
canc
er45
316
(4.5
)19
362
(5.9
)14
344
(6.1
)94
42 (6
.1)
984
(6.7
)13
451
(5.2
)17
676
(5.7
)12
543
(6.4
)10
156
(5.7
)11
042
(3.1
)
Col
orec
tal c
ance
r15
905
(1.6
)74
87 (2
.3)
5421
(2.3
)40
48 (2
.6)
390
(2.6
)43
04 (1
.7)
5170
(1.7
)40
85 (2
.1)
3605
(2.0
)41
04 (1
.2)
Pro
stat
e ca
ncer
37 0
38 (3
.7)
19 7
05 (6
.0)
15 5
77 (6
.6)
9232
(5.9
)64
3 (4
.4)
10 9
67 (4
.2)
11 7
33 (3
.8)
9252
(4.7
)80
70 (4
.5)
8333
(2.3
)
Lung
can
cer
14 9
46 (1
.5)
8965
(2.7
)51
44 (2
.2)
6356
(4.1
)90
5 (6
.1)
3859
(1.5
)66
33 (2
.1)
3977
(2.0
)42
67 (2
.4)
2733
(0.8
)
End
omet
rial c
ance
r73
96 (0
.7)
3447
(1.0
)26
70 (1
.1)
1635
(1.0
)16
0 (1
.1)
2095
(0.8
)26
37 (0
.9)
1957
(1.0
)16
04 (0
.9)
1847
(0.5
)
Ana
emia
307
310
(30.
4)14
0 60
6 (4
2.8)
100
819
(42.
9)74
308
(47.
6)79
80
(54.
2)99
190
(38.
3)11
8 32
7 (3
8.3)
81 9
67 (4
1.9)
72 5
87 (4
0.4)
71 0
98 (2
0.0)
Ast
hma
86 1
20 (8
.5)
46 3
50 (1
4.1)
29 3
27 (1
2.5)
30 1
52 (1
9.3)
4091
(27.
8)27
632
(10.
7)46
823
(15.
2)24
426
(12.
5)25
465
(14.
2)13
802
(3.9
)
Hyp
erlip
idae
mia
691
148
(68.
4)25
7 08
6 (7
8.2)
185
199
(78.
8)12
3 82
8 (7
9.4)
12 1
62 (8
2.6)
199
236
(76.
9)23
9 41
4 (7
7.5)
152
879
(78.
1)14
0 36
4 (7
8.1)
201
258
(56.
5)
Hyp
erp
lasi
a12
2 01
0 (1
2.1)
59 8
09 (1
8.2)
45 5
17 (1
9.4)
28 6
16 (1
8.3)
2587
(17.
6)39
031
(15.
1)42
070
(13.
6)31
606
(16.
1)28
398
(15.
8)27
336
(7.7
)
Hyp
erte
nsio
n67
9 28
7 (6
7.3)
253
601
(77.
2)18
1 23
1 (7
7.1)
124
646
(79.
9)12
218
(83.
0)19
2 68
6 (7
4.4)
230
409
(74.
6)15
0 99
5 (7
7.1)
136
292
(75.
9)20
1 77
7 (5
6.6)
Hyp
othy
roid
ism
197
447
(19.
6)81
468
(24.
8)59
450
(25.
3)40
372
(25.
9)41
98 (2
8.5)
59 8
93 (2
3.1)
76 5
82 (2
4.8)
47 9
73 (2
4.5)
44 2
49 (2
4.6)
50 2
80 (1
4.1)
Anx
iety
dis
ord
ers
148
983
(14.
8)70
688
(21.
5)51
377
(21.
9)37
563
(24.
1)40
32 (2
7.4)
48 8
59 (1
8.9)
62 4
18 (2
0.2)
41 6
55 (2
1.3)
37 5
88 (2
0.9)
31 7
09 (8
.9)
Bip
olar
dis
ord
er17
882
(1.8
)83
68 (2
.5)
6104
(2.6
)45
33 (2
.9)
468
(3.2
)54
42 (2
.1)
6658
(2.2
)51
47 (2
.6)
4227
(2.4
)42
42 (1
.2)
Maj
or d
epre
ssiv
e af
fect
ive
dis
ord
er15
3 18
2 (1
5.2)
71 7
32 (2
1.8)
52 1
01 (2
2.2)
38 0
55 (2
4.4)
4148
(28.
2)48
846
(18.
9)61
872
(20.
0)43
416
(22.
2)38
642
(21.
5)33
660
(9.4
)
Sch
izop
hren
ia a
nd
othe
r p
sych
otic
d
isor
der
s
16 7
64 (1
.7)
8591
(2.6
)61
76 (2
.6)
4934
(3.2
)54
8 (3
.7)
4421
(1.7
)55
97 (1
.8)
5101
(2.6
)38
11 (2
.1)
4300
(1.2
)
Ep
ilep
sy16
155
(1.6
)75
43 (2
.3)
5383
(2.3
)42
69 (2
.7)
415
(2.8
)43
10 (1
.7)
5488
(1.8
)45
10 (2
.3)
3621
(2.0
)41
91 (1
.2)
Fib
rom
yalg
ia, c
hron
ic
pai
n an
d fa
tigue
166
279
(16.
5)78
877
(24.
0)57
494
(24.
5)41
843
(26.
8)44
10 (2
9.9)
56 1
52 (2
1.7)
70 6
67 (2
2.9)
48 4
22 (2
4.7)
43 3
79 (2
4.2)
33 8
43 (9
.5)
Vira
l hep
atiti
s (g
ener
al)
11 9
69 (1
.2)
4659
(1.4
)31
88 (1
.4)
2523
(1.6
)28
7 (1
.9)
3156
(1.2
)37
32 (1
.2)
2712
(1.4
)23
48 (1
.3)
3735
(1.0
)
Live
r d
isea
se c
irrho
sis
and
oth
er li
ver
cond
ition
s
62 6
75 (6
.2)
31 9
30 (9
.7)
23 2
84 (9
.9)
17 3
86 (1
1.1)
1919
(13.
0)19
624
(7.6
)24
544
(7.9
)17
393
(8.9
)15
958
(8.9
)13
350
(3.7
)
Leuk
aem
ias
and
ly
mp
hom
as13
906
(1.4
)72
28 (2
.2)
4822
(2.1
)45
36 (2
.9)
551
(3.7
)43
85 (1
.7)
5905
(1.9
)40
25 (2
.1)
3969
(2.2
)27
58 (0
.8)
Tab
le 1
C
ontin
ued
Con
tinue
d
on October 15, 2021 by guest. P
rotected by copyright.http://bm
jopen.bmj.com
/B
MJ O
pen: first published as 10.1136/bmjopen-2019-034844 on 21 D
ecember 2020. D
ownloaded from
7Baik S, et al. BMJ Open 2020;10:e034844. doi:10.1136/bmjopen-2019-034844
Open access
Vari
able
Ove
rall
FLQ
CIP
LVX
MX
FA
MX
AZ
MLE
XA
MC
No
ne
Mig
rain
e an
d o
ther
ch
roni
c he
adac
he31
628
(3.1
)14
936
(4.5
)11
282
(4.8
)75
20 (4
.8)
873
(5.9
)10
841
(4.2
)13
893
(4.5
)87
63 (4
.5)
8403
(4.7
)64
19 (1
.8)
Mob
ility
imp
airm
ents
20 6
00 (2
.0)
10 1
82 (3
.1)
7356
(3.1
)57
67 (3
.7)
577
(3.9
)53
72 (2
.1)
6629
(2.1
)59
95 (3
.1)
4610
(2.6
)54
39 (1
.5)
Ob
esity
185
101
(18.
3)79
130
(24.
1)56
609
(24.
1)41
226
(26.
4)39
97 (2
7.1)
58 6
54 (2
2.6)
69 6
11 (2
2.5)
49 9
84 (2
5.5)
43 7
40 (2
4.4)
44 7
72 (1
2.6)
Per
iphe
ral v
ascu
lar
dis
ease
90 1
32 (8
.9)
45 2
76 (1
3.8)
31 8
66 (1
3.6)
25 9
77 (1
6.7)
3001
(20.
4)28
747
(11.
1)36
241
(11.
7)28
343
(14.
5)23
977
(13.
3)18
446
(5.2
)
Tob
acco
use
dis
ord
ers
101
890
(10.
1)45
304
(13.
8)28
907
(12.
3)27
202
(17.
4)30
42 (2
0.7)
27 2
61 (1
0.5)
37 8
60 (1
2.3)
25 0
02 (1
2.8)
22 9
75 (1
2.8)
26 8
96 (7
.5)
Pre
ssur
e ul
cers
and
ch
roni
c ul
cers
30 3
45 (3
.0)
17 6
88 (5
.4)
12 8
00 (5
.4)
10 6
03 (6
.8)
1196
(8.1
)90
06 (3
.5)
10 9
26 (3
.5)
13 4
04 (6
.8)
9960
(5.5
)49
92 (1
.4)
Dea
fnes
s an
d h
earin
g im
pai
rmen
t59
576
(5.9
)27
383
(8.3
)19
976
(8.5
)14
014
(9.0
)16
09 (1
0.9)
21 2
13 (8
.2)
25 4
98 (8
.3)
16 8
49 (8
.6)
16 7
87 (9
.3)
11 9
00 (3
.3)
Dat
a ar
e p
rese
nted
as
no. (
%) o
f pat
ient
s un
less
oth
erw
ise
note
d.
AM
C, a
mox
icill
in c
lavu
lana
te; A
MX
, am
oxic
illin
; AZ
T, a
zith
rom
ycin
; CIP
, cip
roflo
xaci
n; F
LQ, fl
uoro
qui
nolo
ne; L
EX
, cep
hale
xin;
LV
X, l
evofl
oxac
in; M
XF,
mox
iflox
acin
.
Tab
le 1
C
ontin
ued
Table 2 HRs of tendon rupture for each covariate
Variables Reference HR (95% CI)
Female Male 0.70 (0.69 to 0.72)↡Black White 0.76 (0.73 to 0.78)↡Hispanic 0.91 (0.87 to 0.94)↡Asian 0.67 (0.63 to 0.71)↡Other 1.05 (1.01 to 1.09)↑
Dual ever Non- Dual Non- LIS
0.66 (0.64 to 0.68)↡Non- dual lis 0.66 (0.63 to 0.70)↡Living in rural area No 0.94 (0.92 to 0.95)↡Medicare part d since 2008 Medicare
Part D Since 2007
1.03 (1.00 to 1.07)
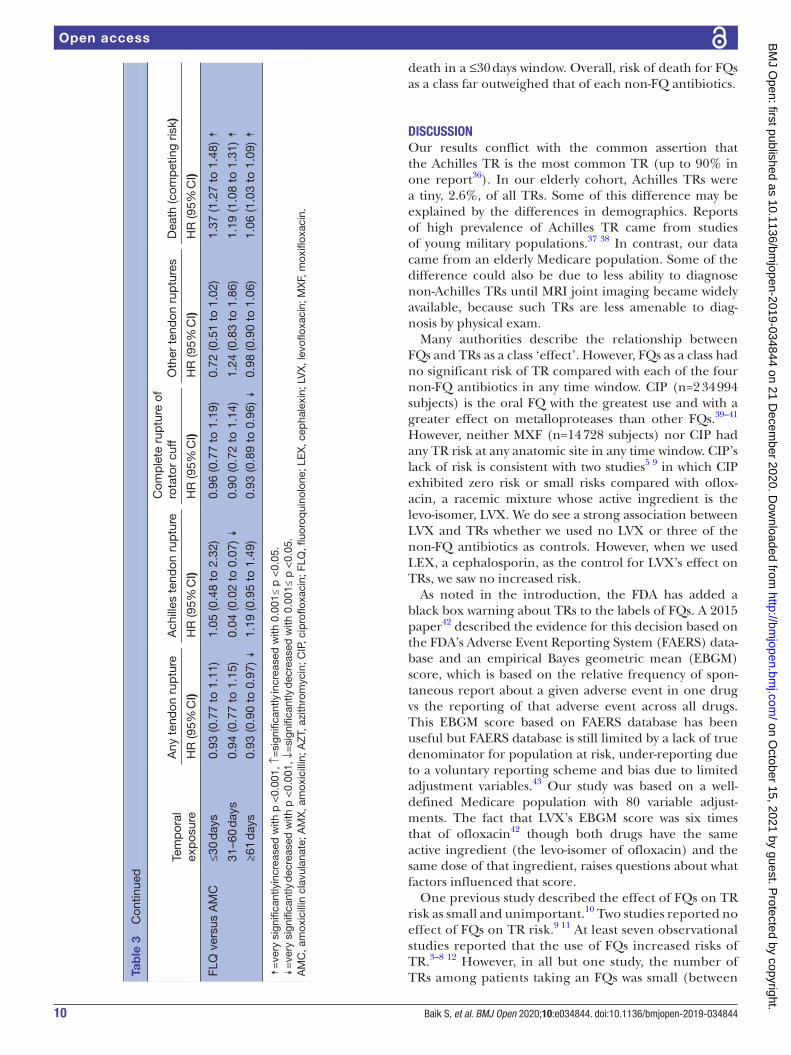
Medicare part d since 2009 1.11 (1.07 to 1.15)↟Medicare part d since 2010 1.16 (1.12 to 1.21)↟Medicare part d since 2011 1.17 (1.13 to 1.22)↟Medicare part d since 2012 1.12 (1.08 to 1.16)↟Medicare part d since 2013 1.03 (1.00 to 1.07)
Medicare part d since 2013 1.05 (1.01 to 1.09)↑
Medicare part d since 2015 0.91 (0.87 to 0.96)↡Medicare part d since 2016 0.93 (0.19 to 4.55)
AMI No 0.74 (0.69 to 0.79)↡Atrial fibrillation No 0.94 (0.91 to 0.97)↡Cataract No 1.23 (1.21 to 1.25)↟Chronic kidney disease No 0.92 (0.89 to 0.94)↡COPD No 0.83 (0.81 to 0.86)↡Heart failure No 0.79 (0.77 to 0.82)↡Diabetes No 0.98 (0.96 to 0.99)↓
Glaucoma No 1.10 (1.08 to 1.12)↟Hip/pelvic fracture No 0.68 (0.60 to 0.77)↡Ischaemic heart disease No 1.10 (1.08 to 1.12)↟Depression No 1.17 (1.13 to 1.21)
Alzheimer’s disease or senile dementia
No 0.67 (0.63 to 0.71)↡
Osteoporosis No 1.03 (1.01 to 1.06)↑
Rheumatoid arthritis/osteoarthritis
No 2.84 (2.80 to 2.89)↟
Stroke/transient ischaemic attack
No 0.97 (0.94 to 1.01)
Breast cancer No 0.94 (0.91 to 0.98)↓
Colorectal cancer No 0.79 (0.74 to 0.85)↡Prostate cancer No 1.03 (0.99 to 1.07)
Lung cancer No 0.39 (0.34 to 0.45)↡Endometrial cancer No 0.85 (0.77 to 0.94)↓
Anaemia No 1.01 (0.99 to 1.03)
Asthma No 1.27 (1.24 to 1.31)↟Hyperlipidaemia No 1.34 (1.31 to 1.36)↟Hyperplasia No 1.13 (1.10 to 1.16)↟Hypertension No 1.09 (1.07 to 1.11)↟Hypothyroidism No 1.08 (1.06 to 1.10)↟Anxiety disorders No 0.98 (0.96 to 1.01)
Continued
on October 15, 2021 by guest. P
rotected by copyright.http://bm
jopen.bmj.com
/B
MJ O
pen: first published as 10.1136/bmjopen-2019-034844 on 21 D
ecember 2020. D
ownloaded from
8 Baik S, et al. BMJ Open 2020;10:e034844. doi:10.1136/bmjopen-2019-034844
Open access
of TR similar to that of the severe life- threatening condi-tions, likely due to reduced activity. Most conditions with low life threats such as cataract, glaucoma, depression, asthma, hyperlipidaemia, hypertension, prostatic hyper-plasia, migraine/other chronic headache, and deafness/hearing impairment exhibited risks of 8% to 34% above controls probably for reasons related to longer life spans and less inhibited activity. Ischaemic heart did not fit the mould of sicker equals lower TR risk. Patients with rheu-matoid arthritis/osteoarthritis were a special case and had TR risk of 184% above control possibly due to joint and associated tendon inflammation with these disorders. Fibromyalgia/chronic pain and fatigue also exhibited a 39% increased risk of TR possibly also due to an inflam-matory component.
The Achilles tendon carries the full force of the extra weight carried by obese patients and obesity was associ-ated with a significant (13%) increase in Achilles TR ruptures while its effect on other TR classes was signifi-cant but minuscule (2%–3%) (data not shown).
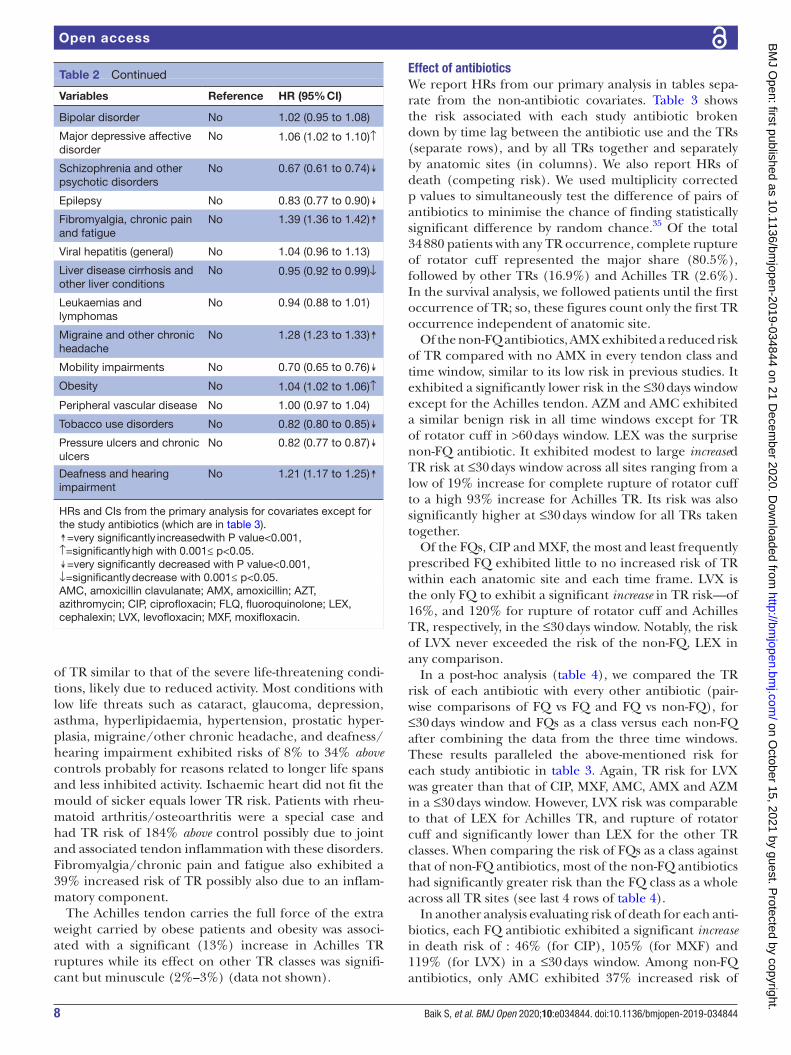
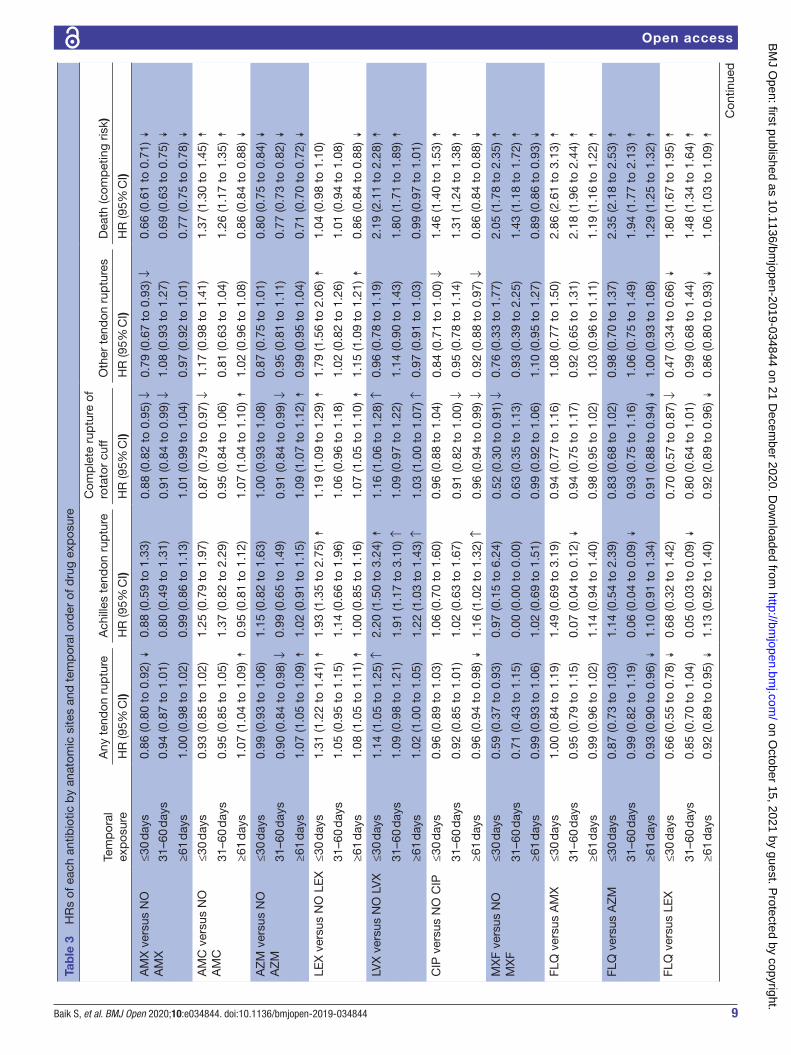
Effect of antibioticsWe report HRs from our primary analysis in tables sepa-rate from the non- antibiotic covariates. Table 3 shows the risk associated with each study antibiotic broken down by time lag between the antibiotic use and the TRs (separate rows), and by all TRs together and separately by anatomic sites (in columns). We also report HRs of death (competing risk). We used multiplicity corrected p values to simultaneously test the difference of pairs of antibiotics to minimise the chance of finding statistically significant difference by random chance.35 Of the total 34 880 patients with any TR occurrence, complete rupture of rotator cuff represented the major share (80.5%), followed by other TRs (16.9%) and Achilles TR (2.6%). In the survival analysis, we followed patients until the first occurrence of TR; so, these figures count only the first TR occurrence independent of anatomic site.
Of the non- FQ antibiotics, AMX exhibited a reduced risk of TR compared with no AMX in every tendon class and time window, similar to its low risk in previous studies. It exhibited a significantly lower risk in the ≤30 days window except for the Achilles tendon. AZM and AMC exhibited a similar benign risk in all time windows except for TR of rotator cuff in >60 days window. LEX was the surprise non- FQ antibiotic. It exhibited modest to large increased TR risk at ≤30 days window across all sites ranging from a low of 19% increase for complete rupture of rotator cuff to a high 93% increase for Achilles TR. Its risk was also significantly higher at ≤30 days window for all TRs taken together.
Of the FQs, CIP and MXF, the most and least frequently prescribed FQ exhibited little to no increased risk of TR within each anatomic site and each time frame. LVX is the only FQ to exhibit a significant increase in TR risk—of 16%, and 120% for rupture of rotator cuff and Achilles TR, respectively, in the ≤30 days window. Notably, the risk of LVX never exceeded the risk of the non- FQ, LEX in any comparison.
In a post- hoc analysis (table 4), we compared the TR risk of each antibiotic with every other antibiotic (pair-wise comparisons of FQ vs FQ and FQ vs non- FQ), for ≤30 days window and FQs as a class versus each non- FQ after combining the data from the three time windows. These results paralleled the above- mentioned risk for each study antibiotic in table 3. Again, TR risk for LVX was greater than that of CIP, MXF, AMC, AMX and AZM in a ≤30 days window. However, LVX risk was comparable to that of LEX for Achilles TR, and rupture of rotator cuff and significantly lower than LEX for the other TR classes. When comparing the risk of FQs as a class against that of non- FQ antibiotics, most of the non- FQ antibiotics had significantly greater risk than the FQ class as a whole across all TR sites (see last 4 rows of table 4).
In another analysis evaluating risk of death for each anti-biotics, each FQ antibiotic exhibited a significant increase in death risk of : 46% (for CIP), 105% (for MXF) and 119% (for LVX) in a ≤30 days window. Among non- FQ antibiotics, only AMC exhibited 37% increased risk of
Variables Reference HR (95% CI)
Bipolar disorder No 1.02 (0.95 to 1.08)
Major depressive affective disorder
No 1.06 (1.02 to 1.10)↑
Schizophrenia and other psychotic disorders
No 0.67 (0.61 to 0.74)↡
Epilepsy No 0.83 (0.77 to 0.90)↡Fibromyalgia, chronic pain and fatigue
No 1.39 (1.36 to 1.42)↟
Viral hepatitis (general) No 1.04 (0.96 to 1.13)
Liver disease cirrhosis and other liver conditions
No 0.95 (0.92 to 0.99)↓
Leukaemias and lymphomas
No 0.94 (0.88 to 1.01)
Migraine and other chronic headache
No 1.28 (1.23 to 1.33)↟
Mobility impairments No 0.70 (0.65 to 0.76)↡Obesity No 1.04 (1.02 to 1.06)↑
Peripheral vascular disease No 1.00 (0.97 to 1.04)
Tobacco use disorders No 0.82 (0.80 to 0.85)↡Pressure ulcers and chronic ulcers
No 0.82 (0.77 to 0.87)↡
Deafness and hearing impairment
No 1.21 (1.17 to 1.25)↟
HRs and CIs from the primary analysis for covariates except for the study antibiotics (which are in table 3).↟=very significantly increasedwith P value<0.001, ↑=significantly high with 0.001≤ p<0.05.↡=very significantly decreased with P value<0.001, ↓=significantly decrease with 0.001≤ p<0.05.AMC, amoxicillin clavulanate; AMX, amoxicillin; AZT, azithromycin; CIP, ciprofloxacin; FLQ, fluoroquinolone; LEX, cephalexin; LVX, levofloxacin; MXF, moxifloxacin.
Table 2 Continued
on October 15, 2021 by guest. P
rotected by copyright.http://bm
jopen.bmj.com
/B
MJ O
pen: first published as 10.1136/bmjopen-2019-034844 on 21 D
ecember 2020. D
ownloaded from
9Baik S, et al. BMJ Open 2020;10:e034844. doi:10.1136/bmjopen-2019-034844
Open access
Tab
le 3
H
Rs
of e
ach
antib
iotic
by
anat
omic
site
s an
d t
emp
oral
ord
er o
f dru
g ex
pos
ure
Tem
por
al
exp
osur
e
Any
ten
don
rup
ture
Ach
illes
ten
don
rup
ture
Com
ple
te r
uptu
re o
f ro
tato
r cu
ffO
ther
ten
don
rup
ture
sD
eath
(com
pet
ing
risk)
HR
(95%
CI)
HR
(95%
CI)
HR
(95%
CI)
HR
(95%
CI)
HR
(95%
CI)
AM
X v
ersu
s N
O
AM
X≤3
0 d
ays
0.86
(0.8
0 to
0.9
2) ↡
0.88
(0.5
9 to
1.3
3)0.
88 (0
.82
to 0
.95)
↓0.
79 (0
.67
to 0
.93)
↓0.
66 (0
.61
to 0
.71)
↡31
–60
day
s0.
94 (0
.87
to 1
.01)
0.80
(0.4
9 to
1.3
1)0.
91 (0
.84
to 0
.99)
↓1.
08 (0
.93
to 1
.27)
0.69
(0.6
3 to
0.7
5) ↡
≥61
day
s1.
00 (0
.98
to 1
.02)
0.99
(0.8
6 to
1.1
3)1.
01 (0
.99
to 1
.04)
0.97
(0.9
2 to
1.0
1)0.
77 (0
.75
to 0
.78)
↡A
MC
ver
sus
NO
A
MC
≤30
day
s0.
93 (0
.85
to 1
.02)
1.25
(0.7
9 to
1.9
7)0.
87 (0
.79
to 0
.97)
↓1.
17 (0
.98
to 1
.41)
1.37
(1.3
0 to
1.4
5) ↟
31–6
0 d
ays
0.95
(0.8
5 to
1.0
5)1.
37 (0
.82
to 2
.29)
0.95
(0.8
4 to
1.0
6)0.
81 (0
.63
to 1
.04)
1.26
(1.1
7 to
1.3
5) ↟
≥61
day
s1.
07 (1
.04
to 1
.09)
↟0.
95 (0
.81
to 1
.12)
1.07
(1.0
4 to
1.1
0) ↟
1.02
(0.9
6 to
1.0
8)0.
86 (0
.84
to 0
.88)
↡A
ZM
ver
sus
NO
A
ZM
≤30
day
s0.
99 (0
.93
to 1
.06)
1.15
(0.8
2 to
1.6
3)1.
00 (0
.93
to 1
.08)
0.87
(0.7
5 to
1.0
1)0.
80 (0
.75
to 0
.84)
↡31
–60
day
s0.
90 (0
.84
to 0
.98)
↓0.
99 (0
.65
to 1
.49)
0.91
(0.8
4 to
0.9
9) ↓
0.95
(0.8
1 to
1.1
1)0.
77 (0
.73
to 0
.82)
↡≥6
1 d
ays
1.07
(1.0
5 to
1.0
9) ↟
1.02
(0.9
1 to
1.1
5)1.
09 (1
.07
to 1
.12)
↟0.
99 (0
.95
to 1
.04)
0.71
(0.7
0 to
0.7
2) ↡
LEX
ver
sus
NO
LE
X≤3
0 d
ays
1.31
(1.2
2 to
1.4
1) ↟
1.93
(1.3
5 to
2.7
5) ↟
1.19
(1.0
9 to
1.2
9) ↟
1.79
(1.5
6 to
2.0
6) ↟
1.04
(0.9
8 to
1.1
0)
31–6
0 d
ays
1.05
(0.9
5 to
1.1
5)1.
14 (0
.66
to 1
.96)
1.06
(0.9
6 to
1.1
8)1.
02 (0
.82
to 1
.26)
1.01
(0.9
4 to
1.0
8)
≥61
day
s1.
08 (1
.05
to 1
.11)
↟1.
00 (0
.85
to 1
.16)
1.07
(1.0
5 to
1.1
0) ↟
1.15
(1.0
9 to
1.2
1) ↟
0.86
(0.8
4 to
0.8
8) ↡
LVX
ver
sus
NO
LV
X≤3
0 d
ays
1.14
(1.0
5 to
1.2
5) ↑
2.20
(1.5
0 to
3.2
4) ↟
1.16
(1.0
6 to
1.2
8) ↑
0.96
(0.7
8 to
1.1
9)2.
19 (2
.11
to 2
.28)
↟31
–60
day
s1.
09 (0
.98
to 1
.21)
1.91
(1.1
7 to
3.1
0) ↑
1.09
(0.9
7 to
1.2
2)1.
14 (0
.90
to 1
.43)
1.80
(1.7
1 to
1.8
9) ↟
≥61
day
s1.
02 (1
.00
to 1
.05)
1.22
(1.0
3 to
1.4
3) ↑
1.03
(1.0
0 to
1.0
7) ↑
0.97
(0.9
1 to
1.0
3)0.
99 (0
.97
to 1
.01)
CIP
ver
sus
NO
CIP
≤30
day
s0.
96 (0
.89
to 1
.03)
1.06
(0.7
0 to
1.6
0)0.
96 (0
.88
to 1
.04)
0.84
(0.7
1 to
1.0
0) ↓
1.46
(1.4
0 to
1.5
3) ↟
31–6
0 d
ays
0.92
(0.8
5 to
1.0
1)1.
02 (0
.63
to 1
.67)
0.91
(0.8
2 to
1.0
0) ↓
0.95
(0.7
8 to
1.1
4)1.
31 (1
.24
to 1
.38)
↟≥6
1 d
ays
0.96
(0.9
4 to
0.9
8) ↡
1.16
(1.0
2 to
1.3
2) ↑
0.96
(0.9
4 to
0.9
9) ↓
0.92
(0.8
8 to
0.9
7) ↓
0.86
(0.8
4 to
0.8
8) ↡
MX
F ve
rsus
NO
M
XF
≤30
day
s0.
59 (0
.37
to 0
.93)
0.97
(0.1
5 to
6.2
4)0.
52 (0
.30
to 0
.91)
↓0.
76 (0
.33
to 1
.77)
2.05
(1.7
8 to
2.3
5) ↟
31–6
0 d
ays
0.71
(0.4
3 to
1.1
5)0.
00 (0
.00
to 0
.00)
0.63
(0.3
5 to
1.1
3)0.
93 (0
.39
to 2
.25)
1.43
(1.1
8 to
1.7
2) ↟
≥61
day
s0.
99 (0
.93
to 1
.06)
1.02
(0.6
9 to
1.5
1)0.
99 (0
.92
to 1
.06)
1.10
(0.9
5 to
1.2
7)0.
89 (0
.86
to 0
.93)
↡FL
Q v
ersu
s A
MX
≤30
day
s1.
00 (0
.84
to 1
.19)
1.49
(0.6
9 to
3.1
9)0.
94 (0
.77
to 1
.16)
1.08
(0.7
7 to
1.5
0)2.
86 (2
.61
to 3
.13)
↟31
–60
day
s0.
95 (0
.79
to 1
.15)
0.07
(0.0
4 to
0.1
2) ↡
0.94
(0.7
5 to
1.1
7)0.
92 (0
.65
to 1
.31)
2.18
(1.9
6 to
2.4
4) ↟
≥61
day
s0.
99 (0
.96
to 1
.02)
1.14
(0.9
4 to
1.4
0)0.
98 (0
.95
to 1
.02)
1.03
(0.9
6 to
1.1
1)1.
19 (1
.16
to 1
.22)
↟FL
Q v
ersu
s A
ZM
≤30
day
s0.
87 (0
.73
to 1
.03)
1.14
(0.5
4 to
2.3
9)0.
83 (0
.68
to 1
.02)
0.98
(0.7
0 to
1.3
7)2.
35 (2
.18
to 2
.53)
↟31
–60
day
s0.
99 (0
.82
to 1
.19)
0.06
(0.0
4 to
0.0
9) ↡
0.93
(0.7
5 to
1.1
6)1.
06 (0
.75
to 1
.49)
1.94
(1.7
7 to
2.1
3) ↟
≥61
day
s0.
93 (0
.90
to 0
.96)
↡1.
10 (0
.91
to 1
.34)
0.91
(0.8
8 to
0.9
4) ↡
1.00
(0.9
3 to
1.0
8)1.
29 (1
.25
to 1
.32)
↟FL
Q v
ersu
s LE
X≤3
0 d
ays
0.66
(0.5
5 to
0.7
8) ↡
0.68
(0.3
2 to
1.4
2)0.
70 (0
.57
to 0
.87)
↓0.
47 (0
.34
to 0
.66)
↡1.
80 (1
.67
to 1
.95)
↟31
–60
day
s0.
85 (0
.70
to 1
.04)
0.05
(0.0
3 to
0.0
9) ↡
0.80
(0.6
4 to
1.0
1)0.
99 (0
.68
to 1
.44)
1.48
(1.3
4 to
1.6
4) ↟
≥61
day
s0.
92 (0
.89
to 0
.95)
↡1.
13 (0
.92
to 1
.40)
0.92
(0.8
9 to
0.9
6) ↡
0.86
(0.8
0 to
0.9
3) ↡
1.06
(1.0
3 to
1.0
9) ↟
Con
tinue
d
on October 15, 2021 by guest. P
rotected by copyright.http://bm
jopen.bmj.com
/B
MJ O
pen: first published as 10.1136/bmjopen-2019-034844 on 21 D
ecember 2020. D
ownloaded from
10 Baik S, et al. BMJ Open 2020;10:e034844. doi:10.1136/bmjopen-2019-034844
Open access
death in a ≤30 days window. Overall, risk of death for FQs as a class far outweighed that of each non- FQ antibiotics.
DISCUSSIONOur results conflict with the common assertion that the Achilles TR is the most common TR (up to 90% in one report36). In our elderly cohort, Achilles TRs were a tiny, 2.6%, of all TRs. Some of this difference may be explained by the differences in demographics. Reports of high prevalence of Achilles TR came from studies of young military populations.37 38 In contrast, our data came from an elderly Medicare population. Some of the difference could also be due to less ability to diagnose non- Achilles TRs until MRI joint imaging became widely available, because such TRs are less amenable to diag-nosis by physical exam.
Many authorities describe the relationship between FQs and TRs as a class ‘effect’. However, FQs as a class had no significant risk of TR compared with each of the four non- FQ antibiotics in any time window. CIP (n=2 34 994 subjects) is the oral FQ with the greatest use and with a greater effect on metalloproteases than other FQs.39–41 However, neither MXF (n=14 728 subjects) nor CIP had any TR risk at any anatomic site in any time window. CIP’s lack of risk is consistent with two studies5 9 in which CIP exhibited zero risk or small risks compared with oflox-acin, a racemic mixture whose active ingredient is the levo- isomer, LVX. We do see a strong association between LVX and TRs whether we used no LVX or three of the non- FQ antibiotics as controls. However, when we used LEX, a cephalosporin, as the control for LVX’s effect on TRs, we saw no increased risk.
As noted in the introduction, the FDA has added a black box warning about TRs to the labels of FQs. A 2015 paper42 described the evidence for this decision based on the FDA’s Adverse Event Reporting System (FAERS) data-base and an empirical Bayes geometric mean (EBGM) score, which is based on the relative frequency of spon-taneous report about a given adverse event in one drug vs the reporting of that adverse event across all drugs. This EBGM score based on FAERS database has been useful but FAERS database is still limited by a lack of true denominator for population at risk, under- reporting due to a voluntary reporting scheme and bias due to limited adjustment variables.43 Our study was based on a well- defined Medicare population with 80 variable adjust-ments. The fact that LVX’s EBGM score was six times that of ofloxacin42 though both drugs have the same active ingredient (the levo- isomer of ofloxacin) and the same dose of that ingredient, raises questions about what factors influenced that score.
One previous study described the effect of FQs on TR risk as small and unimportant.10 Two studies reported no effect of FQs on TR risk.9 11 At least seven observational studies reported that the use of FQs increased risks of TR.3–8 12 However, in all but one study, the number of TRs among patients taking an FQs was small (between
Tem
por
al
exp
osur
e
Any
ten
don
rup
ture
Ach
illes
ten
don
rup
ture
Com
ple
te r
uptu
re o
f ro
tato
r cu
ffO
ther
ten
don
rup
ture
sD
eath
(com
pet
ing
risk)
HR
(95%
CI)
HR
(95%
CI)
HR
(95%
CI)
HR
(95%
CI)
HR
(95%
CI)
FLQ
ver
sus
AM
C≤3
0 d
ays
0.93
(0.7
7 to
1.1
1)1.
05 (0
.48
to 2
.32)
0.96
(0.7
7 to
1.1
9)0.
72 (0
.51
to 1
.02)
1.37
(1.2
7 to
1.4
8) ↟
31–6
0 d
ays
0.94
(0.7
7 to
1.1
5)0.
04 (0
.02
to 0
.07)
↡0.
90 (0
.72
to 1
.14)
1.24
(0.8
3 to
1.8
6)1.
19 (1
.08
to 1
.31)
↟≥6
1 d
ays
0.93
(0.9
0 to
0.9
7) ↡
1.19
(0.9
5 to
1.4
9)0.
93 (0
.89
to 0
.96)
↡0.
98 (0
.90
to 1
.06)
1.06
(1.0
3 to
1.0
9) ↟
↟=
very
sig
nific
antly
incr
ease
d w
ith p
<0.
001,
↑=
sign
ifica
ntly
incr
ease
d w
ith 0
.001
≤ p
<0.
05.
↡=
very
sig
nific
antly
dec
reas
ed w
ith p
<0.
001,
↓=
sign
ifica
ntly
dec
reas
ed w
ith 0
.001
≤ p
<0.
05.
AM
C, a
mox
icill
in c
lavu
lana
te; A
MX
, am
oxic
illin
; AZ
T, a
zith
rom
ycin
; CIP
, cip
roflo
xaci
n; F
LQ, fl
uoro
qui
nolo
ne; L
EX
, cep
hale
xin;
LV
X, l
evofl
oxac
in; M
XF,
mox
iflox
acin
.
Tab
le 3
C
ontin
ued
on October 15, 2021 by guest. P
rotected by copyright.http://bm
jopen.bmj.com
/B
MJ O
pen: first published as 10.1136/bmjopen-2019-034844 on 21 D
ecember 2020. D
ownloaded from

11Baik S, et al. BMJ Open 2020;10:e034844. doi:10.1136/bmjopen-2019-034844
Open access
Tab
le 4
P
airw
ise
com
par
ison
s
Com
par
ison
Tem
por
al
exp
osur
e
Any
ten
don
rup
ture
Ach
illes
ten
don
rup
ture
Com
ple
te r
uptu
re o
f ro
tato
r cu
ffO
ther
ten
don
rup
ture
Dea
th (c
omp
etin
g ris
k)
HR
(95%
CI)
HR
(95%
CI)
HR
(95%
CI)
HR
(95%
CI)
HR
(95%
CI)
HR
s co
mp
arin
g us
e of
eac
h FQ
with
use
of e
ach
non-
FQ a
ntib
iotic
s in
a ≤
30 d
ays
win
dow
C
IP v
ersu
s LV
X≤3
0 d
ays
0.84
(0.7
5 to
0.9
4)↓
0.48
(0.2
7 to
0.8
6) ↓
0.82
(0.7
3 to
0.9
4) ↓
0.87
(0.6
7 to
1.1
5)0.
67 (0
.63
to 0
.71)↡
C
IP v
ersu
s M
XF
≤30
day
s1.
63 (1
.02
to 2
.61)
↑1.
08 (0
.16
to 7
.29)
1.84
(1.0
5 to
3.2
4)↑
1.10
(0.4
7 to
2.6
0)0.
72 (0
.62
to 0
.83)↡
LV
X v
ersu
s M
XF
≤30
day
s1.
95 (1
.21
to 3
.13)
↑2.
26 (0
.34
to 1
5.17
)2.
24 (1
.27
to 3
.94)
↑1.
26 (0
.53
to 3
.01)
1.07
(0.9
3 to
1.2
4)
C
IP v
ersu
s A
MX
≤30
day
s1.
11 (1
.01
to 1
.23)
↑1.
20 (0
.66
to 2
.16)
1.09
(0.9
7 to
1.2
1)1.
06 (0
.84
to 1
.34)
2.23
(2.0
5 to
2.4
4)↟
C
IP v
ersu
s A
ZM
≤30
day
s0.
97 (0
.87
to 1
.06)
0.91
(0.5
3 to
1.5
7)0.
96 (0
.86
to 1
.07)
0.96
(0.7
7 to
1.2
1)1.
84 (1
.71
to 1
.97)↟
C
IP v
ersu
s LE
X≤3
0 d
ays
0.73
(0.6
6 to
0.8
1)↡
0.55
(0.3
1 to
0.9
5) ↓
0.81
(0.7
2 to
0.9
1)↡
0.47
(0.3
7 to
0.5
9)↟
1.41
(1.3
1 to
1.5
2)↟
C
IP v
ersu
s A
MC
≤30
day
s1.
03 (0
.91
to 1
.16)
0.84
(0.4
6 to
1.5
6)1.
10 (0
.96
to 1
.25)
0.71
(0.5
6 to
0.9
2)↓
1.07
(1.0
0 to
1.1
5)
LV
X v
ersu
s A
MX
≤30
day
s1.
33 (1
.19
to 1
.49)↟
2.50
(1.4
5 to
4.2
9)↑
1.32
(1.1
6 to
1.4
9)↟
1.22
(0.9
3 to
1.5
9)3.
34 (3
.07
to 3
.64)↟
L V
X v
ersu
s A
ZM
≤30
day
s1.
15 (1
.03
to 1
.29)
↑1.
91 (1
.13
to 3
.23)
↑1.
16 (1
.03
to 1
.31)
↑1.
10 (0
.84
to 1
.44)
2.75
(2.5
7 to
2.9
5)↟
LV
X v
ersu
s LE
X≤3
0 d
ays
0.87
(0.7
8 to
0.9
8) ↓
1.14
(0.6
8 to
1.9
2)0.
98 (0
.86
to 1
.12)
0.54
(0.4
1 to
0.6
9)↟
2.11
(1.9
7 to
2.2
7)↟
LV
X v
ersu
s A
MC
≤30
day
s1.
23 (1
.08
to 1
.40)
↑1.
76 (0
.98
to 3
.15)
1.33
(1.1
5 to
1.5
4)↟
0.82
(0.6
2 to
1.0
8)1.
60 (1
.49
to 1
.72)↟
M
XF
vers
us A
MX
≤30
day
s0.
68 (0
.43
to 1
.09)
1.10
(0.1
6 to
7.4
1)0.
59 (0
.34
to 1
.03)
0.96
(0.4
1 to
2.2
7)3.
12 (2
.67
to 3
.65)↟
M
XF
vers
us A
ZM
≤30
day
s0.
59 (0
.37
to 0
.94)
↓0.
84 (0
.13
to 5
.65)
0.52
(0.3
0 to
0.9
1)↓
0.88
(0.3
7 to
2.0
7)2.
57 (2
.21
to 2
.98)↟
M
XF
vers
us L
EX
≤30
day
s0.
45 (0
.28
to 0
.72)
↓0.
50 (0
.08
to 3
.35)
0.44
(0.2
5 to
0.7
7)↓
0.43
(0.1
8 to
1.0
0)1.
97 (1
.70
to 2
.‡29
)↟
MX
F ve
rsus
AM
C≤3
0 d
ays
0.63
(0.3
9 to
1.0
1)0.
78 (0
.11
to 5
.33)
0.60
(0.3
4 to
1.0
5)0.
65 (0
.28
to 1
.53)
1.50
(1.2
9 to
1.7
3)↟
HR
s co
mp
arin
g us
e of
FQ
as
a cl
ass
with
use
of e
ach
non-
FQ a
ntib
iotic
s ac
ross
diff
eren
t tim
e w
ind
ow
FL
Q v
ersu
s A
MX
Ove
rall
0.98
(0.9
0 to
1.0
7)0.
49 (0
.36
to 0
.68)
0.95
(0.8
6 to
1.0
6)1.
01 (0
.86
to 1
.19)
1.95
(1.8
6 to
2.0
5)↟
FL
Q v
ersu
s A
ZM
Ove
rall
0.93
(0.8
5 to
1.0
1)0.
42 (0
.30
to 0
.57)
0.89
(0.8
0 to
0.9
8)↓
1.01
(0.8
6 to
1.1
9)1.
80 (1
.73
to 1
.88)↟
FL
Q v
ersu
s LE
XO
vera
ll0.
80 (0
.73
to 0
.88)
0.34
(0.2
4 to
0.4
7)0.
80 (0
.72
to 0
.89)
0.74
(0.6
2 to
0.8
8)1.
42 (1
.35
to 1
.48)↟
FL
Q v
ersu
s A
MC
Ove
rall
0.93
(0.8
5 to
1.0
2)0.
37 (0
.26
to 0
.52)
0.93
(0.8
3 to
1.0
3)0.
96 (0
.80
to 1
.15)
1.20
(1.1
5 to
1.2
5)↟
↟=
very
sig
nific
antly
incr
ease
d w
ith p
<0.
001,
↑=
sign
ifica
ntly
incr
ease
d w
ith 0
.001
≤ p
<0.
05.
↡=
very
sig
nific
antly
dec
reas
ed w
ith p
<0.
001,
↓=
sign
ifica
ntly
dec
reas
e w
ith 0
.001
≤ p
<0.
05.
AM
C, a
mox
icill
in c
lavu
lana
te; A
MX
, am
oxic
illin
; AZ
T, a
zith
rom
ycin
; CIP
, cip
roflo
xaci
n; F
Q, fl
uoro
qui
nolo
nes;
LE
X, c
epha
lexi
n; L
VX
, lev
oflox
acin
; MX
F, m
oxifl
oxac
in.
on October 15, 2021 by guest. P
rotected by copyright.http://bm
jopen.bmj.com
/B
MJ O
pen: first published as 10.1136/bmjopen-2019-034844 on 21 D
ecember 2020. D
ownloaded from

12 Baik S, et al. BMJ Open 2020;10:e034844. doi:10.1136/bmjopen-2019-034844
Open access
5 and 111). In comparison, our study included 12 517 (3.8%) such patients. One previous study did report a large number of TR events, 23 000 (3.5%) patients while on FQs and, like our study, it focused exclu-sively on elderly patients.3 However, it did not compare the population of FQ users against non- users but FQ usage periods against non- usage periods in the same set of patients, which were likely periods without visits and thus could not account for the effect of increased clinical attention provided at visits requiring a strong systemic antibiotic. Furthermore, they assessed the asso-ciation between AMX and TRs in separate analysis and used the risk of TRs in that analysis as the comparator for the risk observed in the FQ analysis. Finally, their analysis did not include death as a competing risk as is recommend when death rates exceed event rates23 which was likely the case because in the demographics of their study was very similar to ours.
In our study, AMX treated patients exhibited a similar absolute risk of TR as to LVX treated patients (7.56 vs 7.47 per 1000 patient years). However, they had fewer comor-bidities (as in Daneman’s study), almost 14% fewer hospi-talisations and half of death rate, compared with patients taking LVX (7.56 vs 18.50 per 1000 patient years). So, the two populations are not comparable. LVX exhibited 119% increased risk of death in a≤30 days window. They appears to be reserved for more severe infections or more fragile patients and thus subject to differential biases.
The reported activation of metalloprotease activity by FQs has underpinned the idea of a causal link between FQs and TRs. The argument goes as follows: FQs stim-ulate metalloproteases, which can break down collagen; the tendon is made of collagen; so FQs may cause TRs. However, our data disrupt this argument. CIP, which strongly stimulates metalloprotease activity,17 18 exhibited no risk of TRs in our study, and LEX which inhibits metal-loprotease activity44 45 exhibited a large risk. So, we have to question whether metalloprotease activity has any rele-vance to TR risk, and consider other explanations for the observed associations.
The indication for an antibiotic is a presumed bacterial infection. The reported associations between antibiotics and TR could be a consequence of the indication (infec-tion) rather than the antibiotic use to treat it. It could be a perfects example of the confounding by indication.46 Such a bias could explain many reported associations between drugs and TR risk including associations with non- antibiotic drugs reported by Nyyssönen et al.8
This indication (and infection) bias could generate an association between the antibiotic and TRs in different ways. First, the bacterial infection might directly increase the risk of TR via stimulation of general immune or cytokine responses, or even by direct bacterial invasion. A recent study found gram- positive bacteria in a major share of ruptured tendons but not in ‘control’ tendons removed surgically for grafting.47 So, the possibility of direct invasion of tendons by circulating bacteria with subsequent weakening and rupture is plausible.
Second, the greater clinical attention likely focused on patients needing systemic antibiotics, especially those with more severe infections, could increase the chance of noticing and documenting a pre- existing TR. A reservoir of not- yet- diagnosed such cases is likely to exist, because patients do not necessarily correctly identify joint and extremity symptoms as TRs and seek immediate care for them. TRs of the shoulder capsule, for example, are noto-rious for developing symptoms slowly over 2–3 years48 before being correctly diagnosed. Even Achilles TRs can be missed (in 30% of cases) at the first presentation.49 Seeger et al reviewed the medical records of patients with an insurance claim reporting TRs following antibiotic use and found that nearly half of the TRs recorded in the claims were either something else (eg, Bursa inflamma-tion miscoded as a TR) or had occurred pre antibiotic use but only seen in a claim post antibiotic use.11
Indication bias is a plausible explanations for associa-tions reported in observational studies and it should be considered more often before assuming the associations are causal.
LIMITATIONThis study faces all of the limitations of observational studies. Furthermore, it applies only to fee- for- service Medicare populations. In addition, we had no options to verify claims diagnoses via chart review. From a statistical point of view, our findings may have some limitations. First, we included 80 covariates in one analysis and concern about intercorrelation affecting the validity could exist. To evaluate the intercorrelation, we calculated an 80×80 correlation matrix of estimated regression which can deliver information about the strength of intercorrela-tion and indicate the existence of a collinear relationship between two predictors. All pairwise correlations (except diagonal elements) were below 0.5, and the largest was 0.33 indicating minimal bias due to intercorrelation. We also did not consider interactions among covariates in our main analysis because of the problem of overfitting. We ran four sensitivity analyses with interaction terms between the study medications and four covariates (rheu-matoid arthritis/osteoarthritis, obesity, female sex, lung cancer). The inclusion of interactions did not change our conclusion of no TR risk for FQ as a class.
Acknowledgements Jason Lau was with National Institutes of Health (NIH) during this work and now he is with the UC Davis Health. This work was partially supported by the Intramural Research Program of the National Library of Medicine, National Institutes of Health. This research was made possible through the National Institutes of Health (NIH) Medical Research Scholars Program, a public- private partnership supported jointly by the NIH and generous contributions to the Foundation for the NIH from the Doris Duke Charitable Foundation, Genentech, the American Association for Dental Research, the Colgate- Palmolive Company, Elsevier, alumni of student research programs, and other individual supporters via contributions to the Foundation for the National Institutes of Health. For a complete list, please visit the Foundation website at: http:// fnih. org/ what- we- do/ current- education- and- training- programs/ mrsp
Contributors SB: study conception, design, analysis and interpretation; critical review of study content; manuscript drafting; approval of the final manuscript.
on October 15, 2021 by guest. P
rotected by copyright.http://bm
jopen.bmj.com
/B
MJ O
pen: first published as 10.1136/bmjopen-2019-034844 on 21 D
ecember 2020. D
ownloaded from

13Baik S, et al. BMJ Open 2020;10:e034844. doi:10.1136/bmjopen-2019-034844
Open access
JL: study concept and interpretation; manuscript drafting; approval of the final manuscript. VH: study interpretation; manuscript drafting; approval of the final manuscript. CJM: study conception, design and interpretation; critical review of study content; manuscript drafting; approval of the final manuscript.
Funding This study is supported by the Intramural Research Program of the National Library of Medicine, National Institutes of Health.
Competing interests None declared.
Patient consent for publication Not required.
Provenance and peer review Not commissioned; externally peer reviewed.
Data availability statement All data relevant to the study are included in the article or uploaded as supplementary information. The authors confirm that the data supporting the findings of this study are available within the article (and/or) its supplementary materials.
Supplemental material This content has been supplied by the author(s). It has not been vetted by BMJ Publishing Group Limited (BMJ) and may not have been peer- reviewed. Any opinions or recommendations discussed are solely those of the author(s) and are not endorsed by BMJ. BMJ disclaims all liability and responsibility arising from any reliance placed on the content. Where the content includes any translated material, BMJ does not warrant the accuracy and reliability of the translations (including but not limited to local regulations, clinical guidelines, terminology, drug names and drug dosages), and is not responsible for any error and/or omissions arising from translation and adaptation or otherwise.
Open access This is an open access article distributed in accordance with the Creative Commons Attribution Non Commercial (CC BY- NC 4.0) license, which permits others to distribute, remix, adapt, build upon this work non- commercially, and license their derivative works on different terms, provided the original work is properly cited, appropriate credit is given, any changes made indicated, and the use is non- commercial. See: http:// creativecommons. org/ licenses/ by- nc/ 4. 0/.
ORCID iDSeo Baik http:// orcid. org/ 0000- 0002- 2077- 4316
REFERENCES 1 Hicks LA, Bartoces MG, Roberts RM, et al. US outpatient antibiotic
prescribing variation according to geography, patient population, and provider specialty in 2011. Clin Infect Dis 2015;60:1308–16.
2 Magill SS, Edwards JR, Beldavs ZG, et al. Prevalence of antimicrobial use in US acute care hospitals, May- September 2011. JAMA 2014;312:1438.
3 Daneman N, Lu H, Redelmeier DA. Fluoroquinolones and collagen associated severe adverse events: a longitudinal cohort study. BMJ Open 2015;5:e010077.
4 Morales DR, Slattery J, Pacurariu A, et al. Relative and absolute risk of tendon rupture with fluoroquinolone and concomitant Fluoroquinolone/Corticosteroid therapy: population- based nested case- control study. Clin Drug Investig 2019;39:205–13.
5 van der Linden PD, Sturkenboom MCJM, Herings RMC, et al. Increased risk of Achilles tendon rupture with quinolone antibacterial use, especially in elderly patients taking oral corticosteroids. Arch Intern Med 2003;163:1801.
6 Wise BL, Peloquin C, Choi H, et al. Impact of age, sex, obesity, and steroid use on Quinolone- associated tendon disorders. Am J Med 2012;125:1228.e23–28.
7 Sode J, Obel N, Hallas J, et al. Use of fluroquinolone and risk of Achilles tendon rupture: a population- based cohort study. Eur J Clin Pharmacol 2007;63:499–503.
8 Nyyssönen T, Lantto I, Lüthje P, et al. Drug treatments associated with Achilles tendon rupture. A case- control study involving 1118 Achilles tendon ruptures. Scand J Med Sci Sports 2018;28:2625–9.
9 WILTON L V, PEARCE GL, MANN RD. A comparison of ciprofloxacin, norfloxacin, ofloxacin, azithromycin and cefixime examined by observational cohort studies. Br J Clin Pharmacol 1996;41:277–84.
10 Jupiter DC, Fang X, Ashmore Z, et al. The relative risk of Achilles tendon injury in patients taking quinolones. Pharmacotherapy 2018;38:878–87.
11 Seeger JD, West WA, Fife D, et al. Achilles tendon rupture and its association with fluoroquinolone antibiotics and other potential risk factors in a managed care population. Pharmacoepidemiol Drug Saf 2006;15:784–92.
12 Hori K, Yamakawa K, Yoshida N, et al. Detection of fluoroquinolone- induced tendon disorders using a hospital database in Japan. Pharmacoepidemiol Drug Saf 2012;21:886–9.
13 Tanne JH. FDA adds ‘black box’ warning label to fluoroquinolone antibiotics. BMJ 2008;337:a816.
14 Food and Drug Administration. FDA drug safety communication: FDA advises restricting fluoroquinolone antibiotic use for certain uncomplicated infections; warns about disabling side effects that can occur together. Available: https://www. fda. gov/ drugs/ drug- safety- and- availability/ fda- drug- safety- communication- fda- advises- restricting- fluoroquinolone- antibiotic- use- certain [Accessed 12 Jun 2019].
15 Food and Drug Administration. FDA drug safety communication: FDA updates warnings for oral and injectable fluoroquinolone antibiotics due to disabling side effects. Available: https://www. fda. gov/ drugs/ drug- safety- and- availability/ fda- drug- safety- communication- fda- updates- warnings- oral- and- injectable- fluoroquinolone- antibiotics [Accessed 12 Jun 2019].
16 Del Buono A, Oliva F, Osti L, et al. Metalloproteases and tendinopathy. Muscles Ligaments Tendons J 2013;3:51–7.
17 Tsai W- C, Hsu C- C, Chen CPC, et al. Ciprofloxacin up- regulates tendon cells to express matrix metalloproteinase-2 with degradation of type I collagen. J Orthop Res 2011;29:67–73.
18 Corps AN, Harrall RL, Curry VA, et al. Ciprofloxacin enhances the stimulation of matrix metalloproteinase 3 expression by interleukin- 1beta in human tendon- derived cells. A potential mechanism of fluoroquinolone- induced tendinopathy. Arthritis Rheum 2002;46:3034–40.
19 ResDAC. Cms virtual research data center (VRDC). Available: https://www. resdac. org/ cms- virtual- research- data- center- vrdc [Accessed 4 Oct 2019].
20 Cubanski J, Swoope C, Boccuti C, et al. A primer on Medicare, 2015. Available: http:// files. kff. org/ attachment/ report- a- primer- on- medicare- key- facts- about- the- medicare- program- and- the- people- it- covers [Accessed 7 Feb 2019].
21 Johnson ES, Bartman BA, Briesacher BA, et al. The incident user design in comparative effectiveness research. Pharmacoepidemiol Drug Saf 2013;22:1–6.
22 Fine JP, Gray RJ. A proportional hazards model for the Subdistribution of a competing risk. J Am Stat Assoc 1999;94:496–509.
23 Berry SD, Ngo L, Samelson EJ, et al. Competing risk of death: an important consideration in studies of older adults. J Am Geriatr Soc 2010;58:783–7.
24 Putter H, Fiocco M, Geskus RB. Tutorial in biostatistics: competing risks and multi- state models. Stat Med 2007;26:2389–430.
25 The Medicare Payment Advisory Commission. MedPAC Data book: Beneficiaries dually eligible for Medicare and Medicaid - January 2016, 2016. Available: http://www. medpac. gov/ docs/ default- source/ publications/ january- 2016- medpac- and- macpac- data- book- beneficiaries- dually- eligible- for- medicare- and- medicaid. pdf? sfvrsn=0 [Accessed 23 Jan 2017].
26 The Chronic Condition Warehouse. Chronic conditions data Warehouse: CCW chronic condition algorithms. Available: https://www. ccwdata. org/ web/ guest/ condition- categories [Accessed 23 Jan 2017].
27 Stricker BHC, Stijnen T. Analysis of individual drug use as a time- varying determinant of exposure in prospective population- based cohort studies. Eur J Epidemiol 2010;25:245–51.
28 Shariff SZ, Cuerden MS, Jain AK, et al. The secret of immortal time bias in epidemiologic studies. J Am Soc Nephrol 2008;19:841–3.
29 Shintani AK, Girard TD, Eden SK, et al. Immortal time bias in critical care research: application of time- varying COX regression for observational cohort studies. Crit Care Med 2009;37:2939–45.
30 Rosenbaum PR, Rubin DB. The central role of the propensity score in observational studies for causal effects. Biometrika 1983;70:41–55.
31 Austin PC. An introduction to propensity score methods for reducing the effects of confounding in observational studies. Multivariate Behav Res 2011;46:399–424.
32 Austin PC, Stuart EA. The performance of inverse probability of treatment weighting and full matching on the propensity score in the presence of model misspecification when estimating the effect of treatment on survival outcomes. Stat Methods Med Res 2017;26:1654–70.
33 Zakaria MHB, Davis WA, Davis TME. Incidence and predictors of hospitalization for tendon rupture in type 2 diabetes: the Fremantle diabetes study. Diabet Med 2014;31:425–30.
34 Basic- Jukic N, Juric I, Racki S, et al. Spontaneous tendon ruptures in patients with end- stage renal disease. Kidney Blood Press Res 2009;32:32–6.
35 Jafari M, Ansari- Pour N. Why, when and how to adjust your P values? Cell J 2019;20:604–7.
36 Khaliq Y, Zhanel GG. Fluoroquinolone- associated tendinopathy: a critical review of the literature. Clin Infect Dis 2003;36:1404–10.
on October 15, 2021 by guest. P
rotected by copyright.http://bm
jopen.bmj.com
/B
MJ O
pen: first published as 10.1136/bmjopen-2019-034844 on 21 D
ecember 2020. D
ownloaded from

14 Baik S, et al. BMJ Open 2020;10:e034844. doi:10.1136/bmjopen-2019-034844
Open access
37 White DW, Wenke JC, Mosely DS, et al. Incidence of major tendon ruptures and anterior cruciate ligament tears in US army soldiers. Am J Sports Med 2007;35:1308–14.
38 Owens B, Mountcastle S, White D. Racial differences in tendon rupture incidence. Int J Sports Med 2007;28:617–20.
39 Corps AN, Harrall RL, Curry VA, et al. Contrasting effects of fluoroquinolone antibiotics on the expression of the collagenases, matrix metalloproteinases (MMP)-1 and -13, in human tendon- derived cells. Rheumatology 2005;44:1514–7.
40 Sharma C, Velpandian T, Baskar Singh S, et al. Effect of fluoroquinolones on the expression of matrix metalloproteinase in debrided cornea of rats. Toxicol Mech Methods 2011;21:6–12.
41 Sbardella D, Tundo GR, Fasciglione GF, et al. Role of metalloproteinases in tendon pathophysiology. Mini Rev Med Chem 2014;14:978–87.
42 Arabyat RM, Raisch DW, McKoy JM, et al. Fluoroquinolone- associated tendon- rupture: a summary of reports in the food and drug administration’s adverse event reporting system. Expert Opin Drug Saf 2015;14:1653–60.
43 Sakaeda T, Tamon A, Kadoyama K, et al. Data mining of the public version of the FDA adverse event reporting system. Int J Med Sci 2013;10:796–803.
44 Santavirta S, Takagi M, Konttinen YT, et al. Inhibitory effect of cephalothin on matrix metalloproteinase activity around loose hip prostheses. Antimicrob Agents Chemother 1996;40:244–6.
45 Kannan R, Ruff M, Kochins JG, et al. Purification of active matrix metalloproteinase catalytic domains and its use for screening of specific stromelysin-3 inhibitors. Protein Expr Purif 1999;16:76–83.
46 de Koning JS, Klazinga NS, Koudstaal PJ, et al. The role of ‘confounding by indication’ in assessing the effect of quality of care on disease outcomes in general practice: results of a case- control study. BMC Health Serv Res 2005;5:10.
47 Rolf CG, Fu S- C, Hopkins C, et al. Presence of bacteria in spontaneous Achilles tendon ruptures. Am J Sports Med 2017;45:2061–7.
48 Tashjian RZ. Epidemiology, natural history, and indications for treatment of rotator cuff tears. Clin Sports Med 2012;31:589–604.
49 Christensen I. Rupture of the Achilles tendon; analysis of 57 cases. Acta Chir Scand 1953;106:50–60.
on October 15, 2021 by guest. P
rotected by copyright.http://bm
jopen.bmj.com
/B
MJ O
pen: first published as 10.1136/bmjopen-2019-034844 on 21 D
ecember 2020. D
ownloaded from