Embed Size (px)
Citation preview
6 The Open Corrosion Journal, 2008, 1, 6-11
1876-5033/08 2008 Bentham Open
Open Access
Mechanism of SCC on SUS310S Stainless Steel
Hiroyuki Masuda*
Intense Research Group, National Institute for Material Science, 1-2-1 Sengen, Tsukuba, Ibaraki, 305-0047, Japan
Abstract: The author have developed a new SCC test method that enables the super Kelvin force microscope (SKFM)
and the Kelvin force microscope (KFM) observations. By using this test device, the crack tip deformation and surface po-
tential distribution were observed on SUS310S stainless steel by SKFM and KFM. At the same time, the distribution of
hydrogen was examined by the Ag decoration method with the EDX image mapping analysis combined. Moreover, the
existence of hydrogen-induced martensite was examined by the magnetic force microscope (MFM) observations. The re-
sults showed that the less noble potential region existed at whole crack and Ag precipitated at less noble potential region
in most cases. The MFM and KFM observation showed hydrogen-induced martensite existed at the less noble potential
part. SCC is caused by the formation of hydrogen-induced martensite ahead of the crack tip.
INTRODUCTION
Stainless steel is often used as the structural material near seashore environment because of high corrosion resistance. However, the stress corrosion cracking (SCC) caused by sea salt particles has been found under the conditions that the residual stress existed in the structure. Many excellent research works [1-8] have been done from the aspects of mechanical factors (applied stress, residual strain), environmental factors (tem-perature, pH, DO) and material factors (additional element, structure) to clarify the mechanism of SCC on stainless steel. Three basic mechanisms of SCC have been proposed, such as active path dissolution, hydrogen embrittlement and film in-duced cleavage. However, no clear mechanism of SCC has been found in the above-mentioned environment. We have developed a new SCC test device [9] that enables the SKFM [10] (super Kelvin force microscope) observation. By using this test device, topography and potential distribution were observed on the whole crack of SUS304 stainless. Ag decoration [11] was done at the same time to study the relation between the less noble potential region and hydrogen distribution. The results showed there is a good correlation between them [12]. SUS310S stain-less steel is a stable austenitic stainless steel and the mechanism of SCC is considered as active path dissolution. However, no critical evidence has been reported. To clarify the mechanism of SCC on SUS310S stainless steel, the crack morphology and surface potential distribution were observed by SKFM and KFM. At the same time, the distribution of hydrogen was ex-amined by the Ag decoration method with the energy dispersed X-ray (EDX) image mapping analysis combined. Moreover, the existence of hydrogen-induced martensite was examined by the magnetic force microscope (MFM) observations. The mecha-nism of SCC is discussed from the results of these observations.
MATERIAL AND METHODS
SPM Equipment
SKFM was originally developed by the author [10]. The Kelvin force method used in this device was originally
*Address correspondence to this author at the Intense Research Group,
National Institute for Material Science, 1-2-1 Sengen, Tsukuba, Ibaraki,
305-0047, Japan; Tel: 0081-029-859-2542; Fax: 0081-029-859-2501;
E-mail: [email protected]
developed by Yasutake et al. [13]. In this method, topogra-phy and surface potential can be obtained at the same time with non-contact mode. The scanning device of SKFM for X-Y direction used is an accurate X-Y stage. The accuracy of the X-Y stage is less than 0.1 m for repeated positioning. The X-Y stage can move up to 10 x 10 cm
2, but the maxi-
mum scanning area is limited to 1 x 1 cm2. The minimum
vertical movement is 0.2 mm. KFM and MFM observation were done by SPI8000 (SII). The tip used for KFM and SKFM measurement was the conductive gold-coated Si tip with the resonant frequency of around 25 kHz, while the tip used for MFM measurement was the magnet-coated Si tip with the resonant frequency of around 125 kHz. The SKFM image was taken with a scanning speed of between 0.03 and 0.06 Hz with data points of 256 x 256, while KFM and MFM image were taken with a scanning speed of 0.1 Hz with data points of 256 x 256. The bright part corresponds to less no-ble potential part in SKFM and KFM image, while the bright part corresponds to the part where attractive force is operat-ing ( martensite phase) in MFM image.
SCC Test
Test specimen used was commercial SUS310S stainless steel (Cr: 25.0, Ni: 20.1, C: 0.046, Si: 0.26, Mn 0.84, P: 0.008, S: 0.001) with the size of 40 mm to 100 mm in length, 20 mm in width and 0.2 mm in thickness. The test part of specimen was mechanically polished up to 300 nm in roughness. Stress was applied by bending the specimen with a jig [9] of 40 mm to 80 mm in length. The stress on the sur-face of specimen, F, was estimated from the following for-mula:
F = z * E / R (1)
where z is half thickness of specimen, E is Young’s modulus and R is curvature of radius near the centre of the test speci-men. More than 10 pieces of 25% MgCl2 droplet of 2 mm
3 in
volume were attached on the specimen. Test was done at 343 K and 28% RH. The specimen was washed by water after the test. At first, the crack was observed by the color laser mi-croscope and then observed by SKFM or by both KFM and MFM. After SKFM observation, the specimen was im-mersed in 0.043M/L AgK(CN)2 solution about 14h for Ag decoration. After specimen was washed by water and dried,

Mechanism of SCC on SUS310S Stainless Steel The Open Corrosion Journal, 2008, Volume 1 7
EDAX image mapping analysis was carried out around the crack following the color laser microscope observation. Af-ter EDAX image mapping analysis, the specimen was washed by water again and was wiped by paper to remove the attached silver. SKFM observation was done again fol-lowing the color laser microscope observation. KFM and MFM observation were done continuously at the same re-gion for 3 months with the cantilever and the tip changed.
RESULT AND DISCUSSION
Crack Morphology
The crack usually initiated from a pit and propagated to the maximum stress direction. Corrosion took place on some parts of crack surface as shown in Fig. (1a). Fig. (1b) shows the optical microscope image of the area surrounded by square line in Fig. (1a). Discontinuous cracks indicated by arrows were observed. Fig. (1c) shows the atomic force mi-croscope (AFM) image of the area same as Fig. (1b). Shear type of deformation occurred at most part of the crack. In active path dissolution model, it is believed that anodic dis-solution of newly created surface by plastic deformation causes a crack. However, since the crack propagates discon-tinuously, no crack exists on some parts of newly created surface as indicated by an arrow in the figure. Fig. (2) shows scanning electron microscope (SEM) images of fracture
surface produced at applied stress of 588 MPa for 71 days. Transgranular fracture surface was usually observed. Mud crack (oxide crack) as shown in Fig. (2b) was also often ob-served.
Surface Potential and Hydrogen Distribution
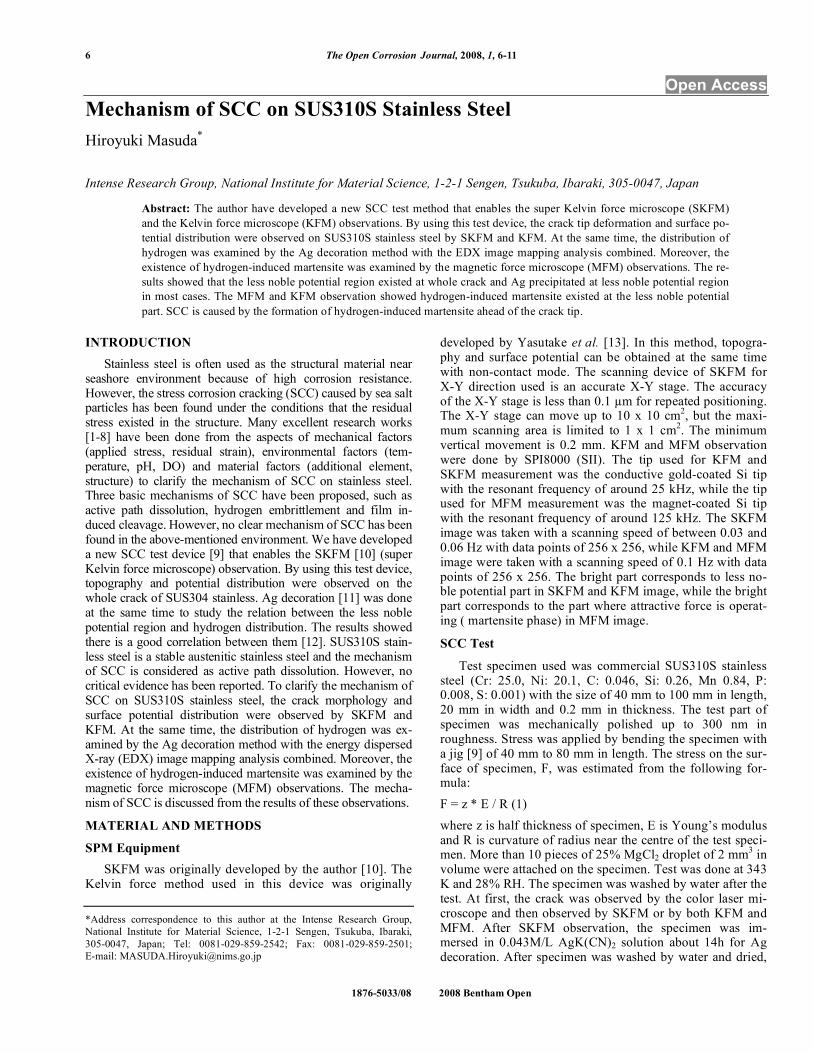
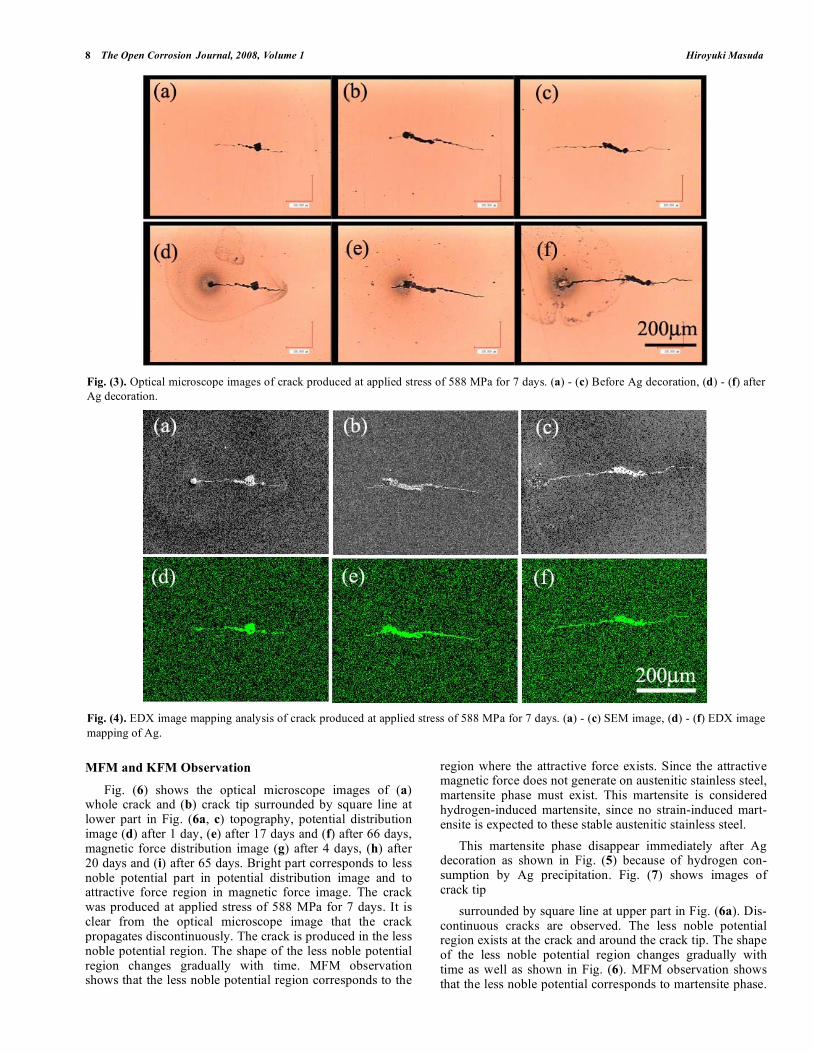
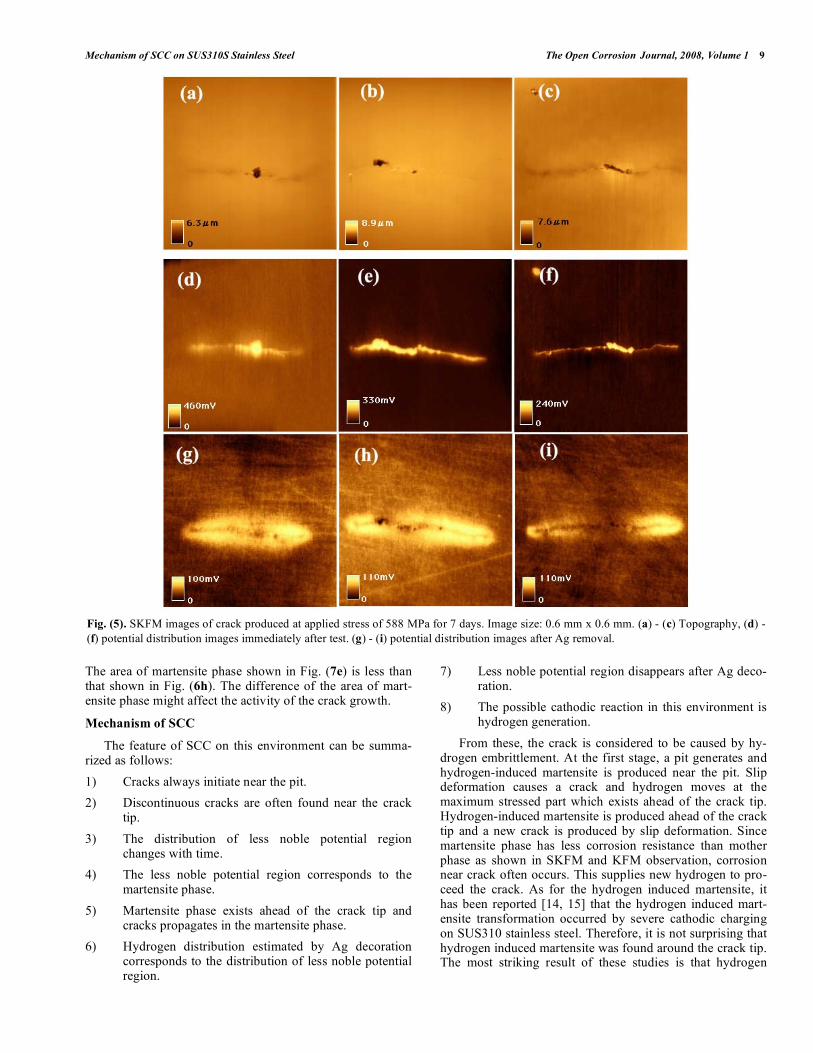
Fig. (3). shows the optical microscope images of cracks (a), (b), (c) before Ag decoration and (d), (e), (f) after Ag decoration. Cracks were produced at the applied stress of 588 MPa for 7 days. Ag which is proved by EDX analysis (Fig. 4) precipitated at whole crack in all cases. The change of color was often observed near the crack tip where large amount of Ag precipitated as shown Fig. (3d-f). One possi-bility to explain this phenomenon is that heat generated by sudden phase change from hydrogen- induced martensite to austenite. Fig. (5) shows the SKFM observation of the cracks. On the surface potential distribution images, bright part corresponds to less noble potential part. The less noble potential region was observed at whole crack in all cases immediately after test. There is very good correlation be-tween the less noble potential region and the region of Ag precipitation. Thus the less noble potential region is closely related to the hydrogen distribution. The less noble potential region which existed before Ag decoration disappear and slight less noble potential region was produced around the crack after removal of Ag.
Fig. (1). Crack produced at applied stress of 588 MPa for 13 days. (a) Optical microscope image of whole crack, (b) optical microscope im-
age of the part surrounded by square line in Fig. (1a, c) AFM image of the same part as in Fig. (1b).
Fig. (2). SEM images of fracture surface produced at applied stress of 588 MPa for 71 days. (a) Transgranular cracking part, (b) mud crack-
ing part.
8 The Open Corrosion Journal, 2008, Volume 1 Hiroyuki Masuda
MFM and KFM Observation
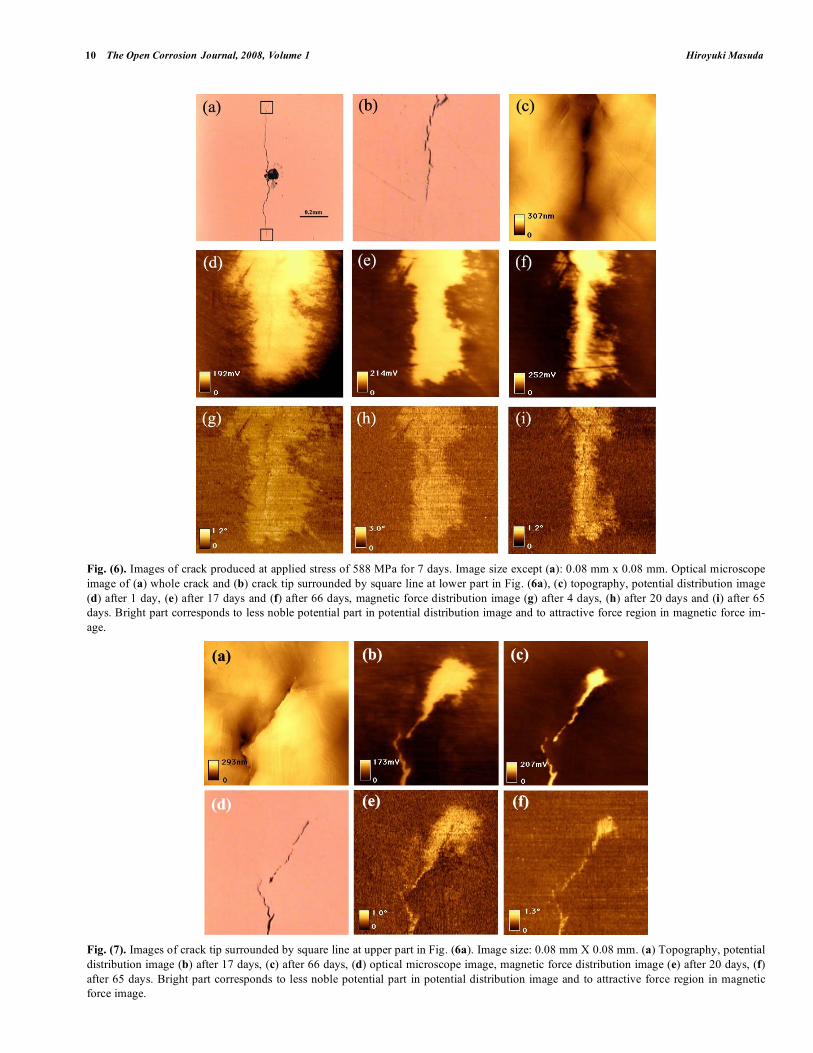
Fig. (6) shows the optical microscope images of (a) whole crack and (b) crack tip surrounded by square line at lower part in Fig. (6a, c) topography, potential distribution image (d) after 1 day, (e) after 17 days and (f) after 66 days, magnetic force distribution image (g) after 4 days, (h) after 20 days and (i) after 65 days. Bright part corresponds to less noble potential part in potential distribution image and to attractive force region in magnetic force image. The crack was produced at applied stress of 588 MPa for 7 days. It is clear from the optical microscope image that the crack propagates discontinuously. The crack is produced in the less noble potential region. The shape of the less noble potential region changes gradually with time. MFM observation shows that the less noble potential region corresponds to the
region where the attractive force exists. Since the attractive magnetic force does not generate on austenitic stainless steel, martensite phase must exist. This martensite is considered hydrogen-induced martensite, since no strain-induced mart-ensite is expected to these stable austenitic stainless steel.
This martensite phase disappear immediately after Ag decoration as shown in Fig. (5) because of hydrogen con-sumption by Ag precipitation. Fig. (7) shows images of crack tip
surrounded by square line at upper part in Fig. (6a). Dis-continuous cracks are observed. The less noble potential region exists at the crack and around the crack tip. The shape of the less noble potential region changes gradually with time as well as shown in Fig. (6). MFM observation shows that the less noble potential corresponds to martensite phase.
Fig. (3). Optical microscope images of crack produced at applied stress of 588 MPa for 7 days. (a) - (c) Before Ag decoration, (d) - (f) after
Ag decoration.
Fig. (4). EDX image mapping analysis of crack produced at applied stress of 588 MPa for 7 days. (a) - (c) SEM image, (d) - (f) EDX image
mapping of Ag.
Mechanism of SCC on SUS310S Stainless Steel The Open Corrosion Journal, 2008, Volume 1 9
The area of martensite phase shown in Fig. (7e) is less than that shown in Fig. (6h). The difference of the area of mart-ensite phase might affect the activity of the crack growth.
Mechanism of SCC
The feature of SCC on this environment can be summa-rized as follows:
1) Cracks always initiate near the pit.
2) Discontinuous cracks are often found near the crack tip.
3) The distribution of less noble potential region changes with time.
4) The less noble potential region corresponds to the martensite phase.
5) Martensite phase exists ahead of the crack tip and cracks propagates in the martensite phase.
6) Hydrogen distribution estimated by Ag decoration corresponds to the distribution of less noble potential region.
7) Less noble potential region disappears after Ag deco-ration.
8) The possible cathodic reaction in this environment is hydrogen generation.
From these, the crack is considered to be caused by hy-drogen embrittlement. At the first stage, a pit generates and hydrogen-induced martensite is produced near the pit. Slip deformation causes a crack and hydrogen moves at the maximum stressed part which exists ahead of the crack tip. Hydrogen-induced martensite is produced ahead of the crack tip and a new crack is produced by slip deformation. Since martensite phase has less corrosion resistance than mother phase as shown in SKFM and KFM observation, corrosion near crack often occurs. This supplies new hydrogen to pro-ceed the crack. As for the hydrogen induced martensite, it has been reported [14, 15] that the hydrogen induced mart-ensite transformation occurred by severe cathodic charging on SUS310 stainless steel. Therefore, it is not surprising that hydrogen induced martensite was found around the crack tip. The most striking result of these studies is that hydrogen
Fig. (5). SKFM images of crack produced at applied stress of 588 MPa for 7 days. Image size: 0.6 mm x 0.6 mm. (a) - (c) Topography, (d) -
(f) potential distribution images immediately after test. (g) - (i) potential distribution images after Ag removal.
10 The Open Corrosion Journal, 2008, Volume 1 Hiroyuki Masuda
Fig. (6). Images of crack produced at applied stress of 588 MPa for 7 days. Image size except (a): 0.08 mm x 0.08 mm. Optical microscope
image of (a) whole crack and (b) crack tip surrounded by square line at lower part in Fig. (6a), (c) topography, potential distribution image
(d) after 1 day, (e) after 17 days and (f) after 66 days, magnetic force distribution image (g) after 4 days, (h) after 20 days and (i) after 65
days. Bright part corresponds to less noble potential part in potential distribution image and to attractive force region in magnetic force im-
age.
Fig. (7). Images of crack tip surrounded by square line at upper part in Fig. (6a). Image size: 0.08 mm X 0.08 mm. (a) Topography, potential
distribution image (b) after 17 days, (c) after 66 days, (d) optical microscope image, magnetic force distribution image (e) after 20 days, (f)
after 65 days. Bright part corresponds to less noble potential part in potential distribution image and to attractive force region in magnetic
force image.

Mechanism of SCC on SUS310S Stainless Steel The Open Corrosion Journal, 2008, Volume 1 11
induced martensite was observed at the first time near the crack tip by MFM and was also able to be observed by KFM as the less noble potential region.
CONCLUSION
The crack tip deformation and surface potential distribu-tion were observed by SKFM and KFM. At the same time, the distribution of hydrogen was examined by the Ag deco-ration method with the EDX image mapping analysis com-bined. Moreover, the existence of hydrogen-induced marten-site was examined by MFM. The results showed that the less noble potential region existed at whole crack and Ag pre-cipitated at the less noble potential part in most cases. The MFM and KFM observation showed hydrogen-induced martensite phase existed at the less noble potential part. SCC is caused by the formation of hydrogen-induced martensite ahead of the crack tip.
REFERENCES
[1] Hoar TP, Hines JG. The stress corrosion cracking of austenitic
stainless steel. J Iron Steel Res Inst 1956; 182: 124- 43 [2] Hoar TP, Scully JC. Mechanism of anodic dissolution of austenitic
stainless steel in hot chloride solution of controlled electrode po-tential. J Electrochem Soc 1964; 111: 348-52
[3] Uhlig HH, Cook EV. Mechanism of inhibiting stress corrosion cracking of 18-8 stainless steek in MgCl2 by acetates and nitrates. J
Electrochem Soc 1969; 116: 173-7
[4] Nielsen NA. Observation and thoughts on stress corrosion mecha-
nisms. Corrosion 1971; 27: 173-89 [5] Whiteman MB, Troiano AR. Hydrogen embrittlement of austenitic
stainless steel. Corrosion 1965; 21: 53-6 [6] Holzworth ML. Hydrogen embrittlement of Type 304L stainless
steel. Corrosion 1969; 25: 107-15 [7] Vaughan DA, Phalen DI, Peterson CL, Boyd WK. Relationship
between hydrogen pickup and susceptible paths in stress corrosion cracking of Type 304 stainless steels. Corrosion 1963; 19: 315t-26t
[8] Rhodes P. Mechanism of chloride stress corrosion cracking of austenitic stainless steels. Corrosion 1969; 25: 462-72
[9] Masuda H. SKFM observation of SCC on SUS304 stainless steel. Corros Sci 2007; 49: 120-9
[10] Masuda H. Effect of MgCl2 liquid thickness on atmospheric corro-sion of pure iron. Corrosion 2001; 57: 99-109
[11] Schober T, Dieker C. Observation of local hydrogen on nickel surfaces. Metall Trans A 1983; 14: 2440-2
[12] Masuda H. Effect of stress on hydrogen distribution around SCC crack of SUS304 stainless steel. ECS Trans 2008; 11(22): 57-70
[13] Yasutake M, Aoki D, Fujihira M. Surface potential measurements using the Kelvin probe force microscope. Thin Solid Films 1996;
273: 279-83 [14] Narita N, Altstetter CJ, Birnbaum HK. Hydrogen-related phase
transformations in austenitic stainless steels. Metall Trans A 1982; 13: 1355-65
[15] Shivanyuk VN, Foct J, Gavriljuk VG. On a role of hydro-gen-induced martensite in embrittlement of stable austenitic steel.
Scr Mater 2003; 49: 601-6.
Received: September 10, 2008 Revised: November 3, 2008 Accepted: November 5, 2008
© Hiroyuki Masuda; Licensee Bentham Open.
This is an open access article licensed under the terms of the Creative Commons Attribution Non-Commercial License (http://creativecommons.org/licenses/by-nc
/3.0/) which permits unrestricted, non-commercial use, distribution and reproduction in any medium, provided the work is properly cited.