Embed Size (px)
Citation preview

1
OAKLAND PARKS Coalition
Contact
Susan Montauk
On the web
www.oaklandparkscoalition.org
OPC 2013 Community Report Card on the State of Maintenance in Oakland Parks
Oakland Parks Coalition Board of Directors John Bliss Susan Montauk Mike Udkow Judy Johnson Emily Rosenberg Iris Winogrond Nancy Karagaca Barbara Schaaf Anne Woodell

OPC 2013 Community Report Card on the State of Maintenance in Oakland Parks
Table of Contents
Introduction………………………………………………………………….……………………1
Historical Background……………………………………………………….……….……….2
Survey Information & Analysis
Survey Ratings by OSCAR Classifications………………… ……………………..3
Rating by Survey Categories……………..……………………………….…………..6
Category Ratings by Council Districts………………………………….…………..7
Park Averages by Council Districts…….…………………………………..……..10
Survey Comments………………………………………………………………………12
Maintenance Overview…………………………………………….…………….………….13
Staffing………………………………………………………………………..……………14
Litter Collection and Mowing……………………..………………………………..15
Repairs and Replacements…………………………..………………………………15
Hardscape and Furniture……………..……….………………………………16
Irrigation………………………………………………………………………….16
Stewardship…………………………………………………………………………..………….16
Is Oakland Maximizing Its Volunteer Potential?...........................................17
A Look Back at 2012 Recommendations………..…………………………..……….18
DeFremery Repairs……………………………………………………………………….…..19
2013Recommendations…………………..……………………..……….………….……..20
Conclusion………………………………………………………………………………………..20
Index………………………………………………………………………………………………..22

OPC 2013 Community Report Card on the State of Maintenance in Oakland Parks
1
Introduction
Early in its history Oakland City leaders demonstrated keen foresight in planning for the
parks and green spaces which we now know are essential for the health and welfare of
citizens. The incorporation and improvement of open space in Oakland has a long and
rich history and continues strongly today. Three outstanding early examples of that spirit
take center stage: Lake Merritt became the first wildlife refuge in North America in 1870
and today, the lake’s park surrounds have been beautifully transformed with Measure
DD bond funds approved by voters in 2002; in 1910, Oakland’s first “municipal play-
grounds” were established at deFremery, Bushrod and Bayview (now Raimondi) parks;
in 1919, the City took the first steps to acquire the acreage that is now included in Oak-
land’s largest park, Joaquin Miller, an all-purpose park of over 500 acres, sporting woods
and meadows, creeks, an equestrian arena, hiking and bike trails, picnic grounds, a dog
park, playgrounds and an amphitheatre. Through the decades, since its incorporation in
1852, City administrators, voters, and organized groups have given strong support to the
expansion and renovation of City and regional parkland, through bonds and grants.
Today, Oaklanders have access to a vast system of parkland. According to the 2010 and
2012 Trust for Public Land City Park Fact studies, Oakland ranks first among high density
US cities for average park acreage per 1000 residents. 1
Year Population Total Park Acres
OPR Acres
East Bay Regional Park District
Acres per 1000 Residents
2010 404,155 5,219 4,101 1,118 12.9
2012 390,724 5,937 4,101 1,836 15.2
While the acreage figures in the table include both natural and wilderness areas, the City
landscape provides abundant developed green spaces: 138 parks afford families of high,
low and median income equal access to sports fields, play structures and recreation pro-
grams (see chart below); scores of landscaped public spaces complement public buildings
and over 100 landscaped medians and streetscapes enrich neighborhoods. It is well-dem-
onstrated that access to parks and park programming can provide economic and health
benefits to citizens and neighborhoods2 but it is also a given that those same parks must
be kept safe, clean and attractive for those benefits to apply.
1 Index to this report has complete table of park acreage for high density cities. 2 Measuring the Economic Value of a City Park System, 2009, Trust for Public Land

OPC 2013 Community Report Card on the State of Maintenance in Oakland Parks
2
Access to parks by Income3 (Park access analyzed by the median income of Oakland, CA)
Population within a ten-minute walk of a public park Low income: households earning less than 75% of the city median income Medium income: households earning between 75%–125% of the city median income High income: households earning more than 125% of the city median income
Historical Background
In the halcyon days of balanced budgets Oakland provided ample funding for park up-
keep but times have changed; costs have escalated, and Oakland, like so many other
municipalities, is left with an ever shrinking percentage of the pie for park maintenance.
The 1989 Landscaping and Lighting Assessment District fully funded maintenance for
about 10 years until costs outran LLAD revenues and the General Purpose Fund had to be
used to supplement maintenance budgets. Hence, in 1998, the first significant cutback in
personnel from 93 to 82 FTEs (Full Time Employees). The slow erosion of maintenance
personnel continued for 20 years until this year, 2013, when 8.5 positions were added
back, bringing staffing up to 64.5 FTEs. OPC is troubled by the negative effect these staff
reductions have had on our parks. It has undertaken the task of surveying parks annually
to assess park conditions and remind City officials of their obligation to preserve and
protect the valuable asset that is our park system.
In this report survey ratings will be displayed through charts and graphs and discussed in
terms of their implications. The survey is a snapshot of park conditions, seen through the
eyes of the survey teams at a given time and day of the year. Although specific conditions
(such as litter accumulation) can change daily--due to weather, maintenance schedules
or park use--this survey draws a general picture of park conditions through the years and
establishes a pattern of care for those same parks.
3 The chart indicates that low-income households actually have better access to Oakland parks than high or medium-income households.

OPC 2013 Community Report Card on the State of Maintenance in Oakland Parks
3
Survey Information & Analysis
OPC formed in 2003 out of a deep concern about declining budgeting for parks. The
organization began surveying park conditions in 2006 and has continued to do so annu-
ally. Our Love Your Parks Day survey has fifty-eight questions in nine park categories4-
litter, picnic areas, free-standing rest-rooms, hardscape, drainage & irrigation, greenery,
recreation center exteriors, outdoor sports areas and outdoor children’s play areas. It is
conducted by survey teams and OPC stewards5 in the fall of each year. Each question is
rated on a 1(worst)-5(best) scale. We train our survey teams using photo examples to
illustrate general parameters for the rating scale.
Training photos used for litter ratings
Give this a 5. Give this a 3. Give this a 1
Survey Ratings by OSCAR Classifications
The OSCAR (Open Space Conservation and Recreation) is our city’s essential guideline for
park development. It was last approved as an element of our General Plan in 1996 and is
long overdue for an update. 6 Our survey uses the OSCAR classifications to compare con-
ditions among the different types of parks. This comparison is important since the level
of traffic in our parks generally coincides with the type of use they provide and more traf-
fic means more wear and tear on the parks. The larger City parks--Community and Neigh-
borhood Parks--may have recreation centers and will usually have children’s play struc-
tures, sports courts and playing fields. User impact in those parks is expected to be great-
er than in most other classifications, except for Athletic Fields, which are highly used by
sports leagues. Smaller parks, such as the Active Mini Parks and Passive Mini Parks, are
often found in small lots interspersed among residential housing; their use is usually
4 Note: The survey is appended to this report.
5 OPC has a current roster of 85 park stewards who work in their parks and conduct our annual survey. 6 Oakland General Plan/OSCAR Element/Overview/Implementation: “The OSCAR Element should be used by City staff and officials on a regular basis in making decisions with open space or natural resource implications…It is an instrument for initiating and responding to the decisions that will shape parks and open spaces during the coming decades. It is intended to educate, to guide, and importantly, to inspire.”

OPC 2013 Community Report Card on the State of Maintenance in Oakland Parks
4
restricted to the immediate neighborhood. Special Use parks may be plazas, memorials
or parks like McCrea, in District 4, which has a casting pool. Linear Parks are long
expanses of landscaped areas such as the Mandela Parkway, and, like Resource
Conservation Areas, have very limited use. Let’s look at selected questions in just a few
category ratings by park classifications.
Are the grounds generally free of litter? It should come as no surprise, considering the dissimilar traffic impacts that for this question, that Resource Conservation Areas scored best with 4.5 and Athletic Fields worst with 3.0.
b) Are enough trash receptacles available? Passive Mini-Parks scored highest with 4.8 while Linear Parks scored the lowest with 3.0. What constitutes enough trash receptacles in a Linear Park that can extend for blocks and blocks? That would be hard to answer but surveyors have voiced their opinions.
c) Are trash receptacles emptied? Again, Linear Parks received the lowest rating of 2.86, while Passive Mini-Parks received the highest.
a) Is grass mowed? Neighborhood and Community Parks score high for this question. Understandably, since mowing schedules give precedence to these parks. Athletic fields score very poorly to this question. OPR is responsible for the upkeep of the infields at
3.6
7
3.9
4
3.7
1
3.5
7
3.4
2
3.4
2 3.6
3
3.7
8
3.7
4
3.7
5
4.8
3.7
9
3.3
2
3.3
2
3.4
6 3
3.3
3
3
3.4
3
2.8
6 4
.5
0
0
0
1
2
3
4
5
6
(a) Are the grounds generally free of litter?
(b) Are enough trash receptacles available?
(c) Are trash receptacles emptied?
Litter 1 = worst and 5 = best. AMP - Active Mini Park
CP – Community Park
NP – Neighborhood Park
PMP – Passive Mini Park
SU – Special Use Park
AF-Athletic Field
LP-Linear Park
RCA-Resource Conservation Area
3 2.9
3
4 3.5
3.92
2.7
5
3.5
3.1
7
3.92
3.2
3.8
6
3.07
3 3.43
3.4
3
3.33
2.6
3
3.3
8
4 3.3
6 2.3
3 3.
67
3
2.5
3.6
7
2.7
5
3.3
3.7
3
0 1
3
0
1
2
3
4
5
a)Is grass mowed? d)Is the grass or ground cover free of bare
spots?
e)Are trees in good condition?
h)Are shrubs weeded and pruned?
Greenery AMP
CP
NP
PMP
SU
AF
LP
RCA

OPC 2013 Community Report Card on the State of Maintenance in Oakland Parks
5
these parks while PWA tends to the outfields. Fields are generally booked solid on week-ends and during the summer months but mowing schedules should be adjusted to ac-commodate the league play. Mowers often break down and have to be pulled out of service, making it difficult to meet mowing schedules.7
d) Is the grass or ground cover free of bare spots? Athletic Fields scored very high for this question while Community Parks and Linear Parks scored low. Surveys were done before the rains so the existence of bare spots is primarily a function of broken irrigation systems. 8
e) Are trees in good condition? Active Mini Parks and Special Use Parks scored highest with 4.0. Garber Park was the only Resource Conservation Area surveyed for tree con-ditions and the park steward gave it a 1.0 because the Garber Park Stewards, along with PWA, have been battling Sudden Oak Death in their park for more than two years.9 Out of necessity, due to sharply reduced numbers of tree-care specialists, emergency repair takes precedence over routine preventive care.10
h) Are shrubs weeded and pruned? Linear parks received the highest rating and Athletic Fields the lowest. Weeding and pruning have taken a back seat to mowing, litter pick up and irrigation repairs. Often, these tasks are relegated to a volunteer workday.
f) Are benches/seating areas in good condition? Passive Mini Parks score best for con-
ditions of benches and walkways while Athletic Fields and Linear Parks score the lowest.
PMPs have less traffic which may explain their high rating for both questions. Linear
parks have the least traffic but are most likely last on the repair lists.
7 See Maintenance Overview for details.
8 See Maintenance Overview for details. 9 http://garberparkstewards.blogspot.com, April 12, 2012: “In the complex riparian woodland of Garber Park, each
of the four constituent trees (and many shrubs) is affected by the pathogen. The Big Leaf Maple and the California
Buckeye are passive carriers. The pathogen aggressively feeds on the leaves of the Bay Laurels without killing the
tree and the Bay Laurels serve as a vector for the conveyance of the pathogen through the forest. The Coast Live
Oak appears to be an unintended victim and a dead end for the pathogen. Yet, the possible consequence of 55%
mortality of Garber’s Coast Live Oaks is a circumstance of great magnitude from every point of view including the
loss of mature canopy and fire hazard that would exist from numerous downed heritage oaks.”
10 Tree-related FTE’s have seesawed in recent history from a high of 28 in 1990 to a low of 15 today.
3.94 3.82
3.58 3.17
3.81 4.05
5 4.75
3.67 3.64
3.33 2.75
3.5 3.89 0
2
4
6
f)Are benches/seating areas in good condition?
g)Are walkways in good condition?
Hardscape AMP
CP
NP
PMP
SU
AF
LP

OPC 2013 Community Report Card on the State of Maintenance in Oakland Parks
6
Ratings by Survey Categories
When ratings drop below a certain threshold, in this case 3.5, there is cause to believe
there is a serious problem in that park. The following chart displays questions that re-
ceived especially low rating averages.
Survey Questions Receiving Low Ratings
Category Question Rating Average
Picnic Areas c. Is the water fountain in the picnic area working? 3.09
d. Are barbecues in good condition? 3.0
Free-Standing Restrooms e. Is the bathroom clean? 3.19
g. Are supplies (soap, paper towels, toilet paper) available? 3.25
h. Are restrooms free of odor? 3.32
Drainage & Irrigation a. Do grounds & landscaping appear to be adequately watered? 3.27
Greenery b. Is the grass edged? 2.91
d. Is the grass or ground cover free of bare spots? 3.1
h. Are shrubs weeded & pruned? 3.25
g. Are planted areas/flower beds weeded? 3.28
f. Do planted areas/flower beds appear to be thriving? 3.31
Outdoor Sports d. Are drinking fountains at sports fields or courts working? 3.26
e. Is there netting (tennis or basketball) where it is needed? 3.31
Problem areas stand out:
Picnic Areas and Sports Areas: Water fountains received low scores in two cate-gories and are a particular headache for maintenance personnel since children use them for play, leaving them clogged by sand or dirt. Netting on basketball hoops tears frequently and replacement is slow.
Greenery: Weeding and pruning questions received low ratings. These gardening tasks are often put on the back burner while more basic maintenance operations, like mowing and litter pickup, receive priority. Bare spots in the grass cover are ubiquitous, signaling malfunctioning irrigation systems. In fact, the process for restoring irrigation systems to working order can be arduous and time-consuming and may involve multiple personnel like crew leaders as well as the three (now four) irrigation specialists. Edging, which is done with weed whackers, occurs only in medians.
Restrooms: Restroom maintenance is especially challenging on weekends when park use accelerates, but cleaning schedules can and should be adjusted to periods of heaviest use. The presence of homeless campers in parks with rest-rooms places a heavy burden on cleaning crews. One unfortunate solution to this problem has been the padlocking of some restrooms.

OPC 2013 Community Report Card on the State of Maintenance in Oakland Parks
7
Category Ratings by Council Districts The charts in this section show the averages in each category for the total of parks sur-veyed in each district. Keep in mind that the higher the score the better the rating.11
Council Districts CD1 CD2 CD3 Lakeside Park* CD4 CD5 CD6 CD7
Number of Parks Surveyed 20 15 29 6 12 11 7 12
11 Note: For our survey, Lakeside Park is treated as its own district and has been divided into six surveyed sectors.
4.06
3.42
3.55
3.42
3.55
3.78
3.22
3.53 0
1
2
3
4
5
-
Litter Averages by Districts District 1
District 2
District 3
Lakeside Park
District 4
District 5
District 6
District 7
3.49
3.35
3.26
4
3.48
4.02
3.71
3.17
0
1
2
3
4
5
Picnic Area Averages by Districts District 1
District 2
District 3
Lakeside Park
District 4
District 5
District 6
District 7
2.33
3.82
3.32
3.47
3.29
3.18
1 0
1
2
3
4
5
-
Restroom Averages by Districts District 1
District 2
District 3
district 4
District 5
District 6
District 7

OPC 2013 Community Report Card on the State of Maintenance in Oakland Parks
8
4.01
4.16
4.89
4.08
3.7
4.05
4.22
4.01 0
1
2
3
4
5
6
-
Hardscape Averages by Districts
District 1
District 2
District 3
Lakeside Park
district 4
District 5
District 6
District 7
3.57
3.29
3.52
3.75
3
3.46
4.33
3.67 0
0.5
1
1.5
2
2.5
3
3.5
4
4.5
5
-
Drainage & Irrigation Averages by Districts
District 1
District 2
District 3
Lakeside Park
District 4
District 5
District 6
District 7
3.63
3.52
3.33
3.78
3.19
3.61
4
3.55 0
0.5
1
1.5
2
2.5
3
3.5
4
4.5
-
Greenery Averages by Districts
District 1
District 2
District 3
Lakeside Park
District 4
District 5
District 6
District 7
OPC 2013 Community Report Card on the State of Maintenance in Oakland Parks
9
4.6
3.73
3.75
3.82
4.53
4.5
4.16
0
0.5
1
1.5
2
2.5
3
3.5
4
4.5
5
-
Rec Center Averages by Districts
District 1
District 2
District 3
District 4
District 5
District 6
District 7
4.33
3.62
3.75
2.97
4.15
3.83
3.05
0
0.5
1
1.5
2
2.5
3
3.5
4
4.5
5
-
Outdoor Sports Averages by Districts
District 1
District 2
District 3
District 4
District 5
District 6
District 7
4.07
3.85
3.61
4
3.64
4.16
4.1
3.8
3.3
3.4
3.5
3.6
3.7
3.8
3.9
4
4.1
4.2
4.3
-
Children's Play Area Averages by Districts
District 1
District 2
District 3
Lakeside Park
District 4
District 5
District 6
District 7

OPC 2013 Community Report Card on the State of Maintenance in Oakland Parks
10
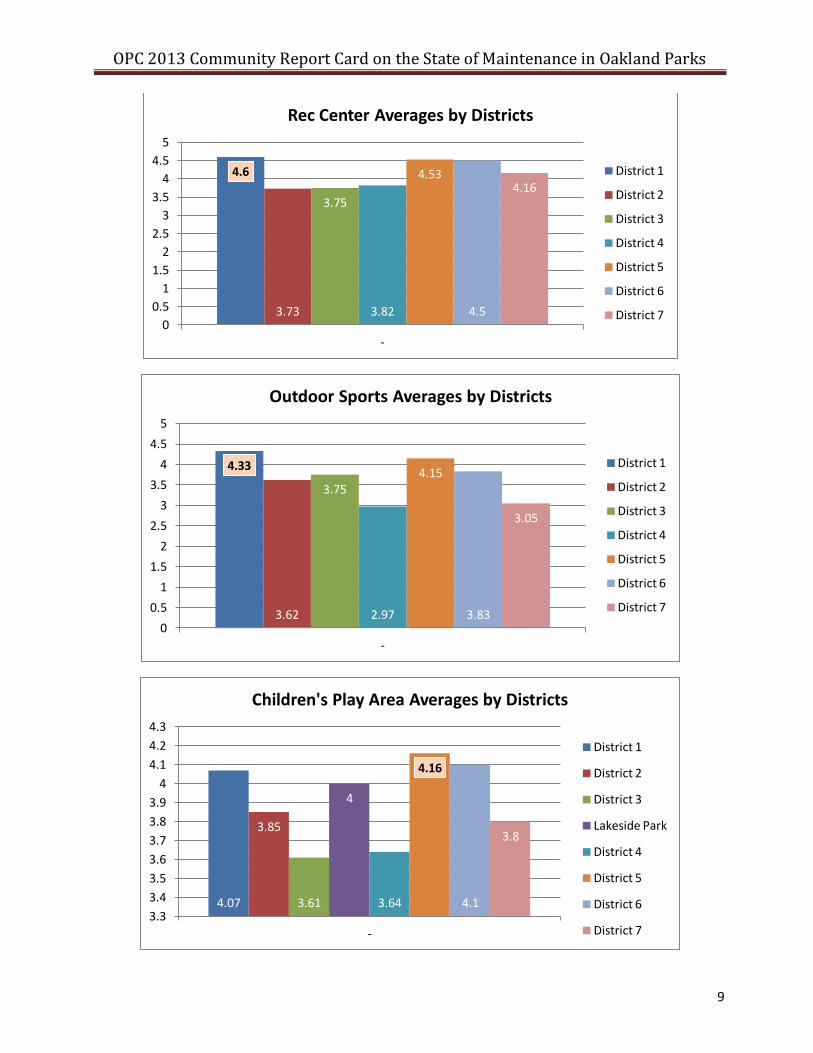
And the winners are:
District 1 for Litter, Rec Center Exteriors and Outdoor Sports Areas
District 5 for Picnic Areas and Children’s Play Areas
District 2 for Free-Standing Restrooms
District 3 for Hardscape
District 6 for Drainage & Irrigation and Greenery
Notable for their absence on the best list are Districts 4 and 7.
Park Averages by Districts
All 58 questions, plus the Park Overall Rating, were totaled and averaged for each park on this table and are listed in ascending order. Parks in green (with asterisks) were surveyed by their own OPC stewards or active volunteers. Districts 1 through 4 have the preponderance of OPC stewards.
District 1 Park Averages Madison Square 3.83 Union Plaza 3.43
Golden Gate 4.50 Clinton Square 3.76 Oak* 3.38
Racine Point* 4.45 FM Smith* 3.69 Oak Glen* 3.31
Colby* 4.42 Bella Vista* 3.45 Raimondi* 3.29
Glen Echo* 4.31 Morgan Plaza 3.37 deFremery* 3.24
Rockridge Blvd* 4.19 Garfield 3.20 Grove Shafter 3.17
Ostrander 4.17 Chinese Garden 2.73 Pine Knoll* 3.17
Linden 4.04 San Antonio* 2.65 Cypress Memorial 3.16
Bushrod* 4.02 Channel* 2.56 Durant* 2.91
Ayala* 4.00 Park Blvd* 2.38 Mandela Pkwy* 2.89
Hardy* 3.69 District 3 Park Averages Marston Campbell* 2.85
Redondo* 3.69 25th Street 4.71 Athol* 2.83
Dover* 3.68 Bishop Floyd 4.54 St. Andrews* 2.13
Gateway Gardens* 3.55 Cleveland Cascade* 4.53 Lafayette Square* 1.66
Garber* 3.50 Bertha Port 4.39 District 4 Park Averages
Chabot* 3.47 Poplar 4.32 Maxwell* 4.46
North Oakland Sports Center* 3.34 Lowell 4.28 Redwood Heights* 4.41
Driver 3.18 Mosswood* 4.14 Avenue Terrace* 4.12
Helen MacGregor 3.12 McClymonds 4.04 McCrea Casting Pool 4.06
Rockridge -Temescal Greenbelt* 2.80 Wade Johnson* 4.00 Joaquin Miller (tot-lot)* 4.00
District 2 Park Averages Jefferson 3.97 Shepherd Canyon* 3.78
Morcom Rose Garden* 4.69 Eastshore* 3.74 Brookdale 3.04
Mandana 4.59 Estuary* 3.69 Montclair* 2.91
Franklin 4.57 Snow 3.65 Allendale* 2.78
Lincoln Square 4.44 Willow 3.61 Dimond* 2.45
Splashpad* 4.00 South Prescott * 3.59 Montclair Railroad Trail* 2.07

OPC 2013 Community Report Card on the State of Maintenance in Oakland Parks
11
District 5 Park Averages Union Point* 2.56 Hellman 4.31
Manzanita 4.73 District 6 Park Averages Ira Jinkins 4.25
Josie de la Cruz 4.33 Tomas Molero-Smith 4.88 Tassafaronga 4.15
Peralta Hacienda Lower 4.33 Lion's Creek 4.58 Eula Brinson/85th* 4.11
Peralta Hacienda Upper* 4.27 Arroyo Viejo 4.11 88th Avenue Mini 3.97
Cesar Chavez* 4.25 Concordia 4.09 Verdese Carter 3.61
Fruitvale Plaza 4.20 Rainbow 4.00 Officer Willie Wilkins 3.27
Nicol Mini 3.89 Carter Gilmore & Greenman Field 3.82 Dolphin Mini 3.06
Central Reservoir 3.36 Burckhalter* 2.90 Sobrante* 2.83
Fruitvale Bridge* 3.00 District 7 Park Averages Columbia Gardens 2.74
William Wood* 2.71 Sheffield Village 4.83 Holly Mini 1.84
Parks receiving the lowest ratings in each district should be looked at carefully. If they are
listed in green, it means they were surveyed by their own OPC stewards who are highly
critical of conditions and the support they get from Public Works.12 Those hovering at the
bottom and which do not have stewards are listed in red.
Here are just three examples of parks that are no longer assets. Cypress Memorial, in
Council District 3, began its life as a worthy tribute to the loss of life, property and infra-
Cypress Memorial
Dolphin Mini
Holly Mini Park
structure in the 1989 earthquake, but it did not have the support of the surrounding
neighborhood whose residents preferred a park with a play structure. Today, the park
12 Note: In our experience with this survey stewards and active volunteers are often more critical of their own parks than random volunteers might be.

OPC 2013 Community Report Card on the State of Maintenance in Oakland Parks
12
has been taken over by the homeless and looks seedy. The original grass, chosen because
it mimicked the seismic waves of the earthquake, was probably a poor choice because of
its extreme susceptibility to weed invasion. In Council District 7, Dolphin Mini, located at
a dead end street but adjacent to a busy intersection, is isolated and run down and
attracts only questionable neighborhood denizens. Holly Mini, on a quiet street in East
Harlem, sits abandoned by the neighborhood and prey to rampant tagging.
Our survey has shown from year to year that these are troubled parks that invite illicit
behaviors. They are not alone and there is no easy fix for parks that fall so far. A clean-
up, a cosmetic makeover, or an infusion of capital may help temporarily but neighbor-
hoods must embrace their parks to keep them viable. Parks that are born out of a
neighborhood need with neighborhood support thrive. A fix for these parks would have
to have its genesis in the neighborhood itself and Councilmembers can help in that
regard. One such example is Tomas Molero-Smith Park on 65th Avenue in East Oakland.
This pocket park was community-built in 2009 (funded by a KaBOOM grant). It was
named after a young shooting victim in that community and launched with great fanfare
by its Councimember. It has been popular and well-cared for ever since.
Survey Comments
Surveyors are asked to write comments for every category about conditions they think
need special attention and many of their concerns are similar from park to park and dis-
trict to district. Here are just a few representative comments:
Critical Comments
o CD 1/Dover Park/Margaret Crayton: “The play equipment has been damaged, but the city
has been slow, but pretty good about fixing what gets damaged. Graffiti continues to be
an ongoing issue. The rubber play surface has been compromised in several areas.”

OPC 2013 Community Report Card on the State of Maintenance in Oakland Parks
13
o CD2/Chinese Garden Park/Krishna & Gloria Moore: “Multiple homeless encampments
make this park unattractive and unappealing.13 As far as garden, there are more homeless
and weeds than plants, flowers, trees or shrubs.”
o CD3/Marston Campbell/Allison Fischman: “Picnic tables in terrible condition. Water foun-
tain leaking.”
o CD4/Montclair Park/Jill Broadhurst: “Lack of weekend service often causes huge messes of
trash bringing out pests and blowing trash all around.”
o CD5/Union Point Park/Chris Atkinson: “Three of the toilets have been locked and labeled
out of order for nearly a year. I have submitted fix it requests twice but they remain
untouched. The other stalls are cleaned, and kept supplied, but are consistently tagged
with graffiti.”
o CD6/Carter Gilmore & Greenman Field/Ben Greenfield: “the worst problem is quite a bit of
graffiti, especially around the playground. A couple of hours of trash pickup and graffiti
removal would be helpful.”
o CD7/Eula Brinson/Connie Payne: “Sparse, tall weeds”
Positive Comments
o CD1/Bushrod/Don Link & Natalie Van Osdol: The park is well-maintained, well-used and in
good shape overall.
o CD2/Lincoln Square/Krishna & Gloria Moore: Great example of an urban public play area
which is heavily utilized, clean, family friendly/inviting.
o CD3/Lowell/Lisa Hire & Myra Redman : Fine multi-use park with several groups playing
sports
o CD5/Cesar Chavez/Agnes Ramirez-Grace : This is a newly [refurbished] park and so far well-
kept. I am hoping that between PWA and the public using the park it continues to be in
good condition. It's good to see that the neighborhood children have a nice area to play.
o CD6/Arroyo Viejo/ Steve, Michele, Blair & Jason Brown : This is a beautiful park.
o CD7/Sheffield Village/Anne Woodell: One can tell-- the neighbors love and appreciate this
park.
Maintenance Overview
OPC commends Public Works for its ingenuity in addressing the labor force deficit.
Reorganization of the workforce and the purchase of new and more efficient equipment
help to compensate for insufficient maintenance staffing but, in the end, more skilled
workers are needed to maintain our parks properly. For decades, Oakland has continued
13 Removal of homeless encampments is a legally complicated procedure. Even once removed they tend to return.

OPC 2013 Community Report Card on the State of Maintenance in Oakland Parks
14
to add park acreage14 while reducing park maintenance positions. This trend may just
now have begun to change.
Staffing
The trend downwards may have shifted course. Public works has been limping along
with greatly reduced maintenance crews for a number of years, but the 2013-2015
budget brings some relief, enabling the addition of a few positions to maintenance staff
and raising the job skill requirements. One Gardener position has been added, bringing
that number to 27 and revised horticultural education requirements of 12 credits
instead of 6 will improve the skill levels of new hires. Continuing gardeners are encour-
aged to take these classes and are reimbursed for tuition costs. In October, through a
joint-effort with Stop-Waste.org, all full-time staffers and 90% of the part-timers were
Bay-Friendly certified, a three-day course in green practices. Oakland is the first city in
Alameda County to certify 100% of its full-time staff.
The number of Park Attendants has been expanded to 32.5 FTEs from last year’s 25. This
translates to 65 actual part-time employees who have a ceiling of 960 hours/year. More
part-timers are employed during the busier use months of May through September than
in other months. PTs primarily do litter pickup and weeding but receive basic training in
gardening skills when time and opportunity permit. They are encouraged to get the cred-
its and skills to be promoted to Gardeners. Tree specialist staffing—today, they number
15--has not significantly changed since 2008 when there were 17. One irrigation special-
ist position will soon be added, bringing the total to four.
14 Just this year, Measure DD funding provided for the creation of a 12-acre park at the 12th street bypass and will fund additional developments in the coming years.
91
80
65
36
26 27
10 9 6 5 5 5
15
28 24
16 15 15
0 6
10
23 25 32.5
0
20
40
60
80
100
1970 1990 2000 2010 2012 2013
FTEs Over the Decades
Gardeners
Supervisors
Trees
Park Attendants

OPC 2013 Community Report Card on the State of Maintenance in Oakland Parks
15
The addition of one Park Supervisor and the redrawing of zone boundaries to equalize
workloads in each area should help to improve efficiency. Each supervisor will have his
or her own irrigation specialist and equipment operator (mowers) and each is given the
latitude to organize his or her zone to create the efficiency desired. The assignment of an
irrigation specialist to each supervisor should speed up repairs and save water costs.
Litter Collection and Mowing
Litter collection and mowing are the basic maintenance tasks. Litter collection, as recent-
ly as last year, monopolized as much as 25% of maintenance hours but, with the three
Mini-Packers that were put into service at the beginning of the year, litter management
has changed for the better. A time-saving study has not been made but Brian Carthan,
newly appointed Park and Trees Services Division Manager, estimates that one Packer
(capacity=6-cubic yards of debris) can collect the same amount of litter that it took four
trucks (1.5 cubic yards of debris) to collect; trips to the dump are reduced by a like
amount with savings on gas and freeing up crew leaders to attend to gardening tasks
that have been neglected in recent years.
Keeping grass mowers functioning is a challenge. “It is an aging fleet and we are working
on the mechanism to address that,” said Carthan. “ Normally we have a 14-18 day mow-
ing schedule but it will have to be adjusted. The schedule is only as good as the equip-
ment you have.” An aging fleet (most of the equipment is 9-10 years old) means that
mowers break down often. One contributing factor to the break-downs is the dearth of
functional trailers (only two to three trailers are available at any given time); the larger
mowers then have to be driven through pot-holed streets to their destinations, some-
thing they were not designed to do. More large trailers and cabs are needed as well as
additional smaller (6ft.) mowers and smaller trailers to round out the fleet. Funding for
these purchases has not yet been identified.
Repairs and Replacements
Hardscape & Furniture
As parks age their play equipment, hardscape and furniture wear out and break down
and the list for repairs and replacement is very long:
o Rubberized surfaces under children’s play structures develop holes which can be
patched but the patches are very expensive.
o Wooden picnic tables and benches splinter and break, creating safety hazards.
o Water fountains clog when children use them for purposes other than drinking.
o Children’s play equipment and picnic tables provide ready-made surfaces for “graffiti
art”.

OPC 2013 Community Report Card on the State of Maintenance in Oakland Parks
16
o Sports courts crack with weather changes.
o Irrigation breaks down regularly or develops leaks (park users step on sprinkler heads,
metal piping is stolen).
Maintenance is exploring new materials for park furniture. The wooden picnic tables
and benches, which splinter and break, creating safety concerns, are replaced as needed
with more durable items such as recycled content (plastic-wood composite) and, per-
haps, concrete precast. Some companies are manufacturing precast concrete tables
and benches that are infused with and coated with anti-graffiti sealant and PWA is
evaluating these as replacements for wooden furniture. Replacement is generally driven
by complaints.
Irrigation Equipment
Irrigation equipment breakage is a constant headache for PWA: park users inadvertently
step on and break sprinkler heads; pipes develop leaks and gush water; vandals steal
irrigation backflows for scrap metal. Steps are being taken to address these problems:
back-flows ($4-$5K replacement cost) are now placed in cages and painted to thwart
thievery; Cal Sense Controllers ($5-7K), an automated system which sends malfunction
alerts to supervisors’ computers, are being installed for any new irrigation installations
and in larger parks when possible (about 26 controllers are currently in place).
Stewardship
OPC believes volunteers are essential to a healthy city and to keep our park system
viable. We cannot expect our public services to operate at the same level they did de-
cades ago. But volunteers need to be coordinated well and a “well-coordinated” system
requires adequate funding to manage and support volunteers. There are important
models for successful volunteer programs on a national and state level.
The National Park Service has a program called VIP (Volunteers in Parks).
“Volunteering is an American tradition that has made an immeasurable contribution to
communities, organizations, and individuals throughout the country. Today's volunteers are
active, dynamic, creative individuals who possess the skills, desire, patience, and time to
accomplish a wide variety of tasks.”15
California State Parks Volunteers in Parks Program was established in 1978. It fosters a
“spirit of citizen initiative and voluntary action among businesses, industries and individual
15 http://www.nps.gov/gettinginvolved/volunteer/index.htm

OPC 2013 Community Report Card on the State of Maintenance in Oakland Parks
17
citizens in the community” [and] involves the recruitment, acceptance, and training of
volunteers who will “augment, but not replace, staff.”’16
Is Oakland maximizing its volunteer potential? By all accounts, Oakland has an army of volunteers eager to work in parks but the gener-al may not always know what his troops are doing. In November the SF Chronicle pub-lished an article describing the types of tasks performed by over 600 volunteers at just one park--Joaquin Miller-- whose work has provided “clean trails, less erosion, new trail signs, less Scotch broom and more oaks [trees].” Many parks, like Joaquin Miller, have long been cared for by local groups who conduct routine workdays. There are also annual volunteer events such as Creek-to-Bay Day, Earth Day, Martin Luther King Day of Service that attract thousands of volunteers. And, in any given week or month the City may be contacted by schools and businesses who want to send volunteers to work in a park or median somewhere in Oakland. We benefit from a vibrant community of businesses, non-profit organizations, and individuals who are eager to work in our parks but ident-ifying, quantifying and coordinating all those volunteers is a daunting task and it falls to the Environmental Services Stewardship Team to do so.
Some groups and events are easier for the team to identify and the requisite Public Works employees to support than others. For example, various neighborhood park groups routinely check in with the team at Environmental Services when they need tools or trash pickups. Yearly events require a great deal of time and work to plan and execute but the formula is the same from year to year. However, setting up projects for the occasional volunteer groups is more problematic, often requiring that supervisors and crews be diverted from their regular schedules to work with these groups. Logistics for support of these groups alone demand a great deal from the four-person Stewardship Team. Furthermore, there are likely dozens of informal neighborhood groups that conduct workdays without requesting support. These efforts may go unacknowledged and uncounted by City officials.
To top it off the Stewardship team also manages the Adopt-a-Spot program, for parks, medians, creeks and streets. Individuals and groups can sign up to be stewards of a given area and will receive guidance and tools from the program. OPC works hand-in-hand with this team through its own park stewardship program.
“Through the Oakland Adopt a Spot program, individuals, neighborhood groups, civic organizations, and businesses can play an active and ongoing role in cleaning, greening, and beautifying parks, creeks, streets, and other public spaces. Public Works supports ongoing adopters with tool lending, debris collection services, and technical assistance.”17
16 http://www.parks.ca.gov/pages/735/files/vipp%20handbooklow032112.pdf 17 http://www2.oaklandnet.com/Government/o/PWA/o/FE/s/VO/index.htm

OPC 2013 Community Report Card on the State of Maintenance in Oakland Parks
18
Volunteerism is a boon to cities strapped by financial constraints. It provides benefits for the volunteers as well as for municipalities.
“Positive effects [of volunteering] are found for life-satisfaction, self-esteem, self-rated health, and for educational and occupational achievement, functional ability, and mortality. Studies of youth also suggest that volunteering reduces the likelihood of engaging in prob-lem behaviors such as school truancy and drug abuse.”18
If the goal is to “utilize voluntary help in such a way that is mutually beneficial” the City of Oakland has much yet to do to give volunteers a sense of cohesion, of belonging to a family. As it stands the volunteer program is operating as a collection of disparate efforts. To counter this, effective outreach is essential. A newsletter might be the way to start, but it would only be the first step. Proper training—periodic horticultural tutorials held at various parks by supervisors or skilled crew leaders, for instance—could be offered, and ongoing communication with and among volunteers must be maintained to support and acknowledge their work and allow them to combine efforts. The Environ-mental Stewardship Team has taken the first important steps but much remains to be done and it may take more funding to do it right.
Review of 2012 Recommendations
The 2012 Community Report Card recommended:
Hire an Additional Irrigation Specialist
Fill the Position of Park Volunteer Coordinator ASAP
Budget for New Equipment (specifically, new trailers)
The first and second recommendations have been fully addressed: the additional Irri-gation Specialist was hired and the new Stewardship Team is fully staffed. Manager Carthan informs us that the budget for new equipment will include new smaller mowers ($7-$9K/each) that can be housed in each zone, and will be available when the larger mowers ($100K) break down. He says they are less efficient but they get the work done.
Our 2012 report also called attention to a growing problem of gopher invasion. PWA hired a private contractor to address the gopher problem in DeFremery and South Prescott. These pests devastate parks by turning a green grass lawn into a crater-pocked surface, an unsightly and unsafe landscape for park users. A few dozen gophers have been trapped and PWA has purchased its own traps to continue trapping but the job requires an all out attack. Carthan says that “gopher management is a continual process, you never get 100% killed.”
18 Annual Review of Sociology, 2000, http://www.jstor.org/discover/10.2307/223443?uid=2&uid=4&sid=21102973332251

OPC 2013 Community Report Card on the State of Maintenance in Oakland Parks
19
$DeFremery Recreation Center Refurbishment
We would like to call attention to one park that should be a jewel in the Oakland crown but whose “recreation center” a genteel Victorian built in 1910 has been in disrepair for some time. Finally, it is getting the makeover it so sorely needs. Stately DeFremery Park has proudly served the residents of West Oakland for over 100 years. It provides youth and adults a myriad of sports options, including tennis, swimming and skate-boarding, and after-school and summer classes in art, dance and other disciplines. It is a meeting place for all ages. It is truly the heart of the West Oakland community. Here are some of the survey comments posted in September, 2013, by OPC DeFremery Park Steward Phyllis Lun:
Restrooms: New door & walls needed. Restroom smells. Need new sinks and better light fixtures--it's too dark in the restrooms as the bulbs fade.
Hardscape: The building is rotting away. Front porch rails and columns need replace-ment. Center floors need sanding and refinishing.
Rec Center: Needs painting and wood siding replacement.
Park is treated like the stepchild of the city. They never finish one job. They started on the grass but gave us NO water. They started killing gophers but never got the last of them. Three years ago we were told the center would be painted. We are still waiting. We are still waiting for a water fountain.
Many of the problems cited by Ms. Lun are or soon will be addressed and resolved. The wooden floors in the center will be completely refinished by the beginning of 2014; the kitchen will be upgraded and the painting will be completed early next year. The basketball court has already been resurfaced, and, budget permitting, the tennis courts will also be resurfaced. We hope that Public Works will also tackle the irrigation and gopher problems so that this park can finally regain some of its former glory.

OPC 2013 Community Report Card on the State of Maintenance in Oakland Parks
20
2013 Recommendations
$GARDENER POSITIONS MUST BE ADDED. For years OPC has been recommending that no further cuts be made to maintenance staffing. With revenues declining during the recession, we felt that there was little chance of funding new positions. In spite of our requests, gardener positions were cut precipitously in 2011, from 36 to 26—a 28% loss--and total FTEs in the field dropped from 93.9 to 80. We are at a crossroads now; revenues are on the ascendance and the future is brighter. Staffing has been given a modest lift in the new budget with the addition of one gardener position, one irrigation position and 7.5 Park Attendant positions. This is a start but it is a very small one. The need is much greater for skilled gardeners. The job description has been revised to attract candidates with more training and that’s a good thing but we need to get ahead of the curve and replenish our ground forces to face the gargantuan task of healing our very deprived parks. We need to bud-get for more gardeners.
$GOPHER ERADICATION CONTRACTS MUST BE RENEWED Trapping contracts should be renewed for DeFremery and South Prescott and Raimondi and Willow Park should be added to the list.
$STEWARDSHIP TEAM NEEDS ONE MORE MEMBER We discussed the need for better coordination of volunteers to offset the loss of so many gardeners. We recommend a position be added to the Stewardship Team of a staffer in charge of collecting and tracking volunteer information, producing a news-letter, handling publicity and outreach to volunteers and the public and any other tasks that fall under the rubric of volunteer communication and quantification.
Conclusion
They often say things were better in the “good old days.” They may be right. We have come a long way from the 1970s when 175 full-time workers--90 gardeners, 10 super-visors, 11 irrigation specialists, and a slew of other specialists-- tended our parks, me-dians and landscaped public spaces. Every decade since has seen a decline in staffing numbers. Today, 20 Gardener Crew Leaders head up teams of 1-2 lower-skilled workers and are responsible for about 700 developed acres in Oakland19, or 35 acres per crew. Out of necessity, most of the work at these 700 acres is devoted to litter pick-up. Mowing is done by five specialists who operate the tractor mowers. Tree maintenance
19 This number does not include Knowland Park and Oakland’s golf courses which are not maintained by PWA.
OPC 2013 Community Report Card on the State of Maintenance in Oakland Parks
21
was done by 30 workers in the 1990’s, but today only 15 tree specialist spend most of their work hours answering calls related to hazardous tree conditions. We can’t expect to protect our park system with these skeleton crews. Some success has been made to require longer-term contracts for newly established parkland but longer term usually amounts to one additional year to the traditional two-year contracts. OPC suggests aiming to extend the contractual maintenance obligations. Ultimately, care of all new parks falls under the Oakland maintenance umbrella. We must be realistic; there is not much hope of returning to the utopia of the 70s, so other solutions must be found. The possibility of more private-public partnerships, albeit with a myriad of potential con-flicts of interest, has always been on the table for discussion and should be considered more closely. Public funding options for specific areas or purposes should also be part of the discussion. Nothing should be off the table when it pertains to safeguarding our very precious resources, our parks and green spaces.
OPC 2013 Community Report Card on the State of Maintenance in Oakland Parks
22
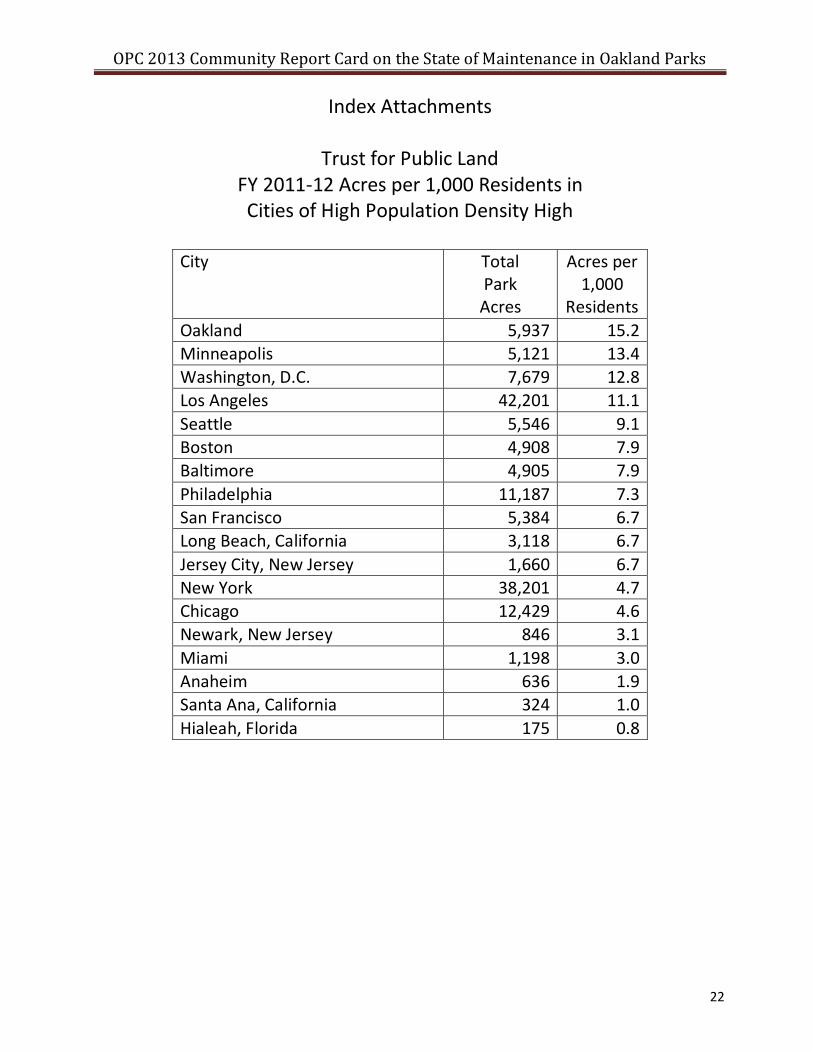
Index Attachments
Trust for Public Land FY 2011-12 Acres per 1,000 Residents in Cities of High Population Density High
City Total Park Acres
Acres per 1,000
Residents
Oakland 5,937 15.2
Minneapolis 5,121 13.4
Washington, D.C. 7,679 12.8
Los Angeles 42,201 11.1
Seattle 5,546 9.1
Boston 4,908 7.9
Baltimore 4,905 7.9
Philadelphia 11,187 7.3
San Francisco 5,384 6.7
Long Beach, California 3,118 6.7
Jersey City, New Jersey 1,660 6.7
New York 38,201 4.7
Chicago 12,429 4.6
Newark, New Jersey 846 3.1
Miami 1,198 3.0
Anaheim 636 1.9
Santa Ana, California 324 1.0
Hialeah, Florida 175 0.8

OPC 2013 Community Report Card on the State of Maintenance in Oakland Parks
23
2013 OPC LOVE YOUR PARKS DAY SURVEY September/October
Rate every question by circling one rating only. More is better: 5 = Best, 1 = Worst.
1. LITTER
a. Are the grounds generally free of litter? 1 2 3 4 5 N/A
b. Are enough trash receptacles available? 1 2 3 4 5 N/A
c. Are trash receptacles emptied? 1 2 3 4 5 N/A
d. Is there evidence of homeless people living in this park? 1 2 3 4 5 N/A
2. PICNIC AREAS (Picnic areas are designated by tables with benches )
a. Are picnic areas generally litter-free?
1 2 3 4 5 N/A
b. Are enough trash receptacles available in the picnic area?
1 2 3 4 5 N/A
c. Is the water fountain in the picnic area working? 1 2 3 4 5 N/A
d. Are barbecues in good condition?
1 2 3 4 5 N/A
e. Are picnic benches & tables in good condition?
1 2 3 4 5 N/A
f. Are picnic benches & tables graffiti-free? 1 2 3 4 5 N/A
3. RESTROOMS Freestanding Only (not in Rec Centers, not porta-potties)
a. Is the restroom open? 1 2 3 4 5 N/A
b. Are toilets clean & working?
1 2 3 4 5 N/A
c. Are sinks clean & working?
1 2 3 4 5 N/A
d. Are trash receptacles available?
1 2 3 4 5 N/A
e. Is the bathroom clean? 1 2 3 4 5 N/A
f. Are doors on stalls & do locks work?
1 2 3 4 5 N/A
g. Are supplies (soap, paper towels, toilet paper) available?
1 2 3 4 5 N/A
h. Are restrooms free of odor?
1 2 3 4 5 N/A
i. Are restrooms free of graffiti? 1 2 3 4 5 N/A
4. HARDSCAPE, FURNITURE, SIGNAGE
a. Is there a sign with the park name at, at least, one entrance?
1 2 3 4 5 N/A
b. Is there a sign with park rules at, at least, one entrance or nearby?
1 2 3 4 5 N/A
c. Are signs graffiti-free?
1 2 3 4 5 N/A
d. Are fences in good condition? 1 2 3 4 5 N/A
e. Are gates working properly & open (during posted hours)?
1 2 3 4 5 N/A
f. Are benches/seating areas in good condition?
1 2 3 4 5 N/A
g. Are walkways in good condition? 1 2 3 4 5 N/A
5. DRAINAGE & IRRIGATION SYSTEMS
a. Do grounds & landscaping appear to be adequately watered? 1 2 3 4 5 N/A
b. Are the low areas free of collected water? 1 2 3 4 5 N/A

OPC 2013 Community Report Card on the State of Maintenance in Oakland Parks
24
6. GREENERY
GRASS & GROUND COVER…………………………………………………………….
a. Is the grass mowed? 1 2 3 4 5 N/A
b. Is the grass edged? 1 2 3 4 5 N/A
c. Is the grass or ground cover free of animal poop? 1 2 3 4 5 N/A
d. Is the grass or ground cover free of bare spots? 1 2 3 4 5 N/A
TREES………………………………………………………………………………………….
e. Are trees in good condition (free of dead branches)? 1 2 3 4 5 N/A
FLOWERS & SHRUBS, COMMUNITY GARDEN…………………………………………
f. Do planted areas/flower beds appear to be thriving? 1 2 3 4 5 N/A
g. Are planted areas/flower beds weeded? 1 2 3 4 5 N/A
h. Are shrubs weeded & pruned?
1 2 3 4 5 N/A
i. Is the community garden in good condition?
1 2 3 4 5 N/A
GOPHER HOLES AND MOUNDS……………………………………………………… j. Is the landscape free of gopher holes & mounds? 1 2 3 4 5 N/A
7. RECREATION CENTERS/EXTERIOR
a. Is the rec center building name visible? 1 2 3 4 5 N/A
b. Are rules, hours & programs posted outside? 1 2 3 4 5 N/A
c. Are building exterior walls/windows free of graffiti? 1 2 3 4 5 N/A
d. Is exterior paint/siding in good condition? 1 2 3 4 5 N/A
e. Are windows & doors in good condition? 1 2 3 4 5 N/A
8. OUTDOOR SPORTS AREAS
a. Is the turf/grass (sports fields only) in good condition? 1 2 3 4 5 N/A
b. Is court (tennis or basketball) surfacing in good condition? 1 2 3 4 5 N/A
c. Are courts free of pools of water? 1 2 3 4 5 N/A
d. Are drinking fountains at sports fields or courts working? 1 2 3 4 5 N/A
e. Is there netting (tennis or basketball) where it is needed? 1 2 3 4 5 N/A
f. Are courts (tennis or basketball) properly marked with lines? 1 2 3 4 5 N/A
g. Are bleachers graffiti-free? 1 2 3 4 5 N/A
h. Are bleachers in good condition? 1 2 3 4 5 N/A
9. OUTDOOR CHILDREN’S PLAY AREAS
a. Is surface area free of litter, sharp objects and weeds? 1 2 3 4 5 N/A
b. Is play equipment in good condition? 1 2 3 4 5 N/A
c. Is play equipment free of graffiti? 1 2 3 4 5 N/A
d. Is the sand or fibar clean? 1 2 3 4 5 N/A
e. Is the rubber play surface in good condition? 1 2 3 4 5 N/A
f. Is seating for parents in good condition? 1 2 3 4 5 N/A
PLEASE GIVE THIS PARK/AREA AN OVERALL RATING. 1 2 3 4 5