Embed Size (px)
Citation preview
8/6/2019 ONU-ESCAP Trade and Investment Division, Staff Working Paper 02/10 Examining the Potential for Cross-South Pac…
http://slidepdf.com/reader/full/onu-escap-trade-and-investment-division-staff-working-paper-0210-examining 1/33
ESCAP Trade and Investment Division Staff Working Paper 02/1
1
Abstract:
This paper discusses the potential for cross-South Pacific trade between selected Southeast Asian and Latin
American economies. The objective of this discussion is to identify obstacles for more intensive tradebetween the observed countries. Firstly, the paper reviews trends in trade flows and trade patterns between the
selected economies, and by using several trade performance indicators it finds the level of trade still relatively
low. It then discusses the possible reasons for this state of affairs. It focuses on a review of tariffs, trading
costs and other possible impediments to trade. Paper also considers how trade relations among these countries
could be improved. It provides a background into the features of the trade agreements that have been signedamong the countries belonging to these two sub-regions in an attempt to identify if any of them could be used
as a “driver” for future integration.
Keywords: ASEAN, Latin America, trade entropy, complementarity, trade agreements, cross-Pacific trade,
noodle bowl
****
Disclaimer: TID Staff Working Papers should not be reported as representing the views of the United Nations. The
views expressed in this TID Staff Paper are those of the author(s) and do not necessarily represent those of the United
Nations. Staff Working Papers describe research in progress by the author(s) and are published to elicit
comments to further debate. They are issued without formal editing. The Designation employed and the presentation of
the material in the TID Staff Paper do not imply the expression of any opinion whatsoever on the part of the Secretariat
of the United Nations concerning the legal status of any country, territory, city or area or of its authorities, or concerning
the delimitation of its frontiers or boundaries.
Mia Mikic 1 with Elias Jakobson
Trade and Investment Division
UNESCAP, Bangkok, Thailand
Copyright © UNESCAP 2010
All rights reserved
www.unescap.org/tid
1
Mia Mikic is an Economic Affairs Officer at TID, ESCAP and Elias Jakobson is a graduate student at Lund University,and was an intern at TID at the time of preparation of this paper. The authors are grateful to Cai Wei, Sangmo Jeon and
Nayeah Kim for their excellent research assistance provided during their respective internship at the ARTNeT
Secretariat, Trade and Investment Division, ESCAP, without which preparation of this paper would not have been
possible. Deanna Morris has done a wonderful job on improving the presentation quality of the paper. Mia Mikic
presented an earlier version of this paper at the Workshop on “Prospects of economic relations between Southeast Asia
and Latin America; Some Policy Options including Small and Medium Enterprises (SMEs)” organized by the ASEAN
Foundation and held on 12 October 2009 at the ASEAN Secretariat in Jakarta, Indonesia.
Trade and Investment Division, Staff Working Paper 02/10
Examining the Potential for Cross-South Pacific Trade:
ASEAN and Latin America
1 December 2010
8/6/2019 ONU-ESCAP Trade and Investment Division, Staff Working Paper 02/10 Examining the Potential for Cross-South Pac…
http://slidepdf.com/reader/full/onu-escap-trade-and-investment-division-staff-working-paper-0210-examining 2/33
ESCAP Trade and Investment Division Staff Working Paper 02/1
2
Contents
I. Introduction ................................................................................................................................................. 4
II. Overall trends in ASEAN and Latin American trade.............................................................................. 7
2.1 Trade entropy ........................................................................................................................................ 10
2.2 Geographical structure of ASEAN-LAC trade ...................................................................................... 11
2.3 Sectoral composition of trade................................................................................................................ 13
2.4 Intra-industry trade and complementarity index................................................................................... 15
III. Obstacles in trade between ASEAN and LAC ........................................................................................ 18
3.1 Tariffs and trade costs in trade between ASEAN and LAC ................................................................... 18
3.2 Role of non-tariff measures and other trade costs ................................................................................ 20
IV. Existing cross-South Pacific trade agreements and issues of ‘noodle bowl’ ........................................ 23
V. Conclusions ................................................................................................................................................ 26
VI. List of references ....................................................................................................................................... 27
Technical appendix...................................................................................................................................... 28
Statistical appendix ..................................................................................................................................... 29
List of Figures
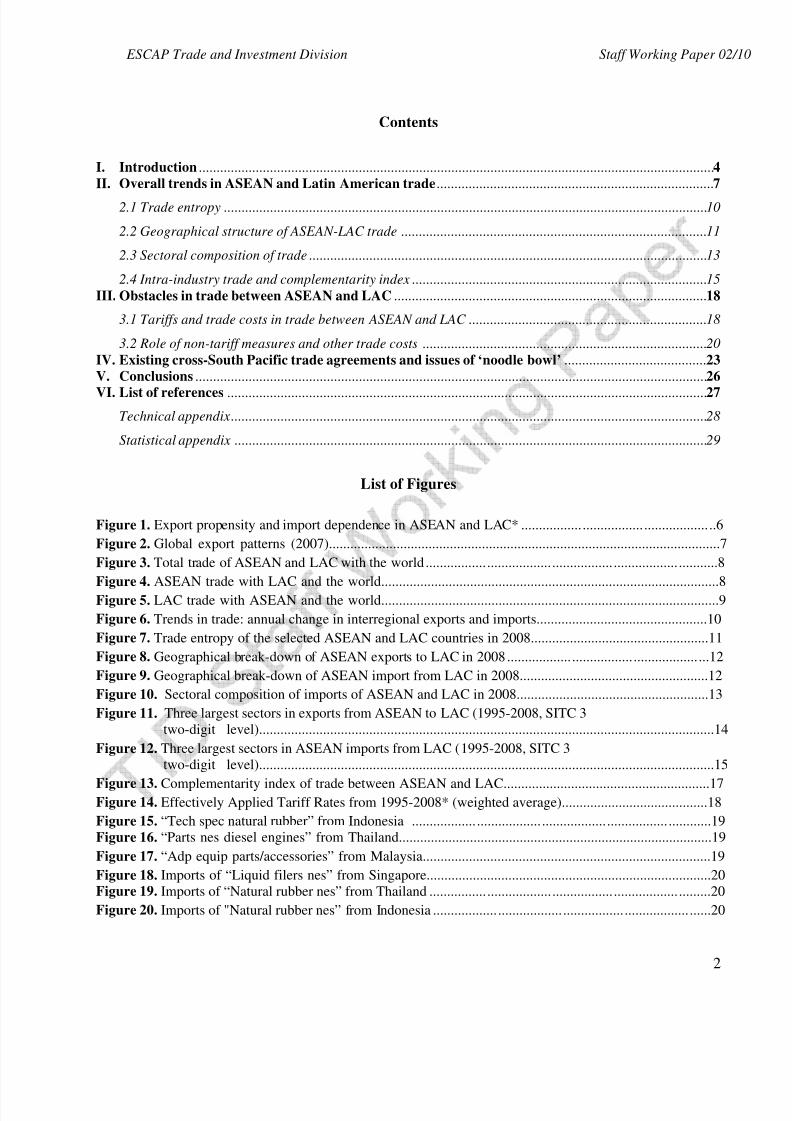
Figure 1. Export propensity and import dependence in ASEAN and LAC* ......................................................6
Figure 2. Global export patterns (2007)..............................................................................................................7
Figure 3. Total trade of ASEAN and LAC with the world.................................................................................8
Figure 4. ASEAN trade with LAC and the world...............................................................................................8
Figure 5. LAC trade with ASEAN and the world...............................................................................................9
Figure 6. Trends in trade: annual change in interregional exports and imports................................................10
Figure 7. Trade entropy of the selected ASEAN and LAC countries in 2008..................................................11
Figure 8. Geographical break-down of ASEAN exports to LAC in 2008 ........................................................12
Figure 9. Geographical break-down of ASEAN import from LAC in 2008.....................................................12
Figure 10. Sectoral composition of imports of ASEAN and LAC in 2008......................................................13
Figure 11. Three largest sectors in exports from ASEAN to LAC (1995-2008, SITC 3
two-digit level)................................................................................................................................14
Figure 12. Three largest sectors in ASEAN imports from LAC (1995-2008, SITC 3
two-digit level)................................................................................................................................15
Figure 13. Complementarity index of trade between ASEAN and LAC..........................................................17Figure 14. Effectively Applied Tariff Rates from 1995-2008* (weighted average).........................................18
Figure 15. “Tech spec natural rubber” from Indonesia ...................................................................................19
Figure 16. “Parts nes diesel engines” from Thailand........................................................................................19
Figure 17. “Adp equip parts/accessories” from Malaysia.................................................................................19
Figure 18. Imports of “Liquid filers nes” from Singapore................................................................................20
Figure 19. Imports of “Natural rubber nes” from Thailand ..............................................................................20
Figure 20. Imports of "Natural rubber nes” from Indonesia .............................................................................20
8/6/2019 ONU-ESCAP Trade and Investment Division, Staff Working Paper 02/10 Examining the Potential for Cross-South Pac…
http://slidepdf.com/reader/full/onu-escap-trade-and-investment-division-staff-working-paper-0210-examining 3/33
ESCAP Trade and Investment Division Staff Working Paper 02/1
3
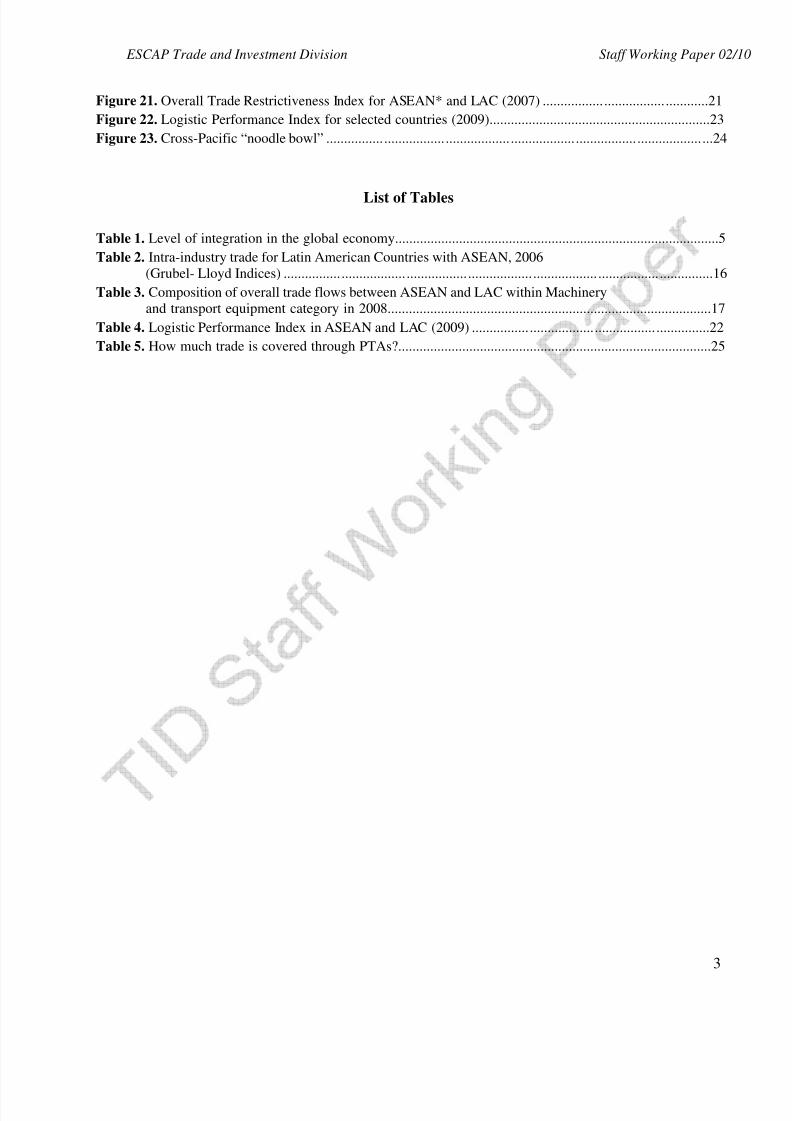
Figure 21. Overall Trade Restrictiveness Index for ASEAN* and LAC (2007) ..............................................21
Figure 22. Logistic Performance Index for selected countries (2009)..............................................................23
Figure 23. Cross-Pacific “noodle bowl” ...........................................................................................................24
List of Tables
Table 1. Level of integration in the global economy...........................................................................................5
Table 2. Intra-industry trade for Latin American Countries with ASEAN, 2006
(Grubel- Lloyd Indices) .......................................................................................................................16
Table 3. Composition of overall trade flows between ASEAN and LAC within Machinery
and transport equipment category in 2008...........................................................................................17
Table 4. Logistic Performance Index in ASEAN and LAC (2009) ..................................................................22
Table 5. How much trade is covered through PTAs?........................................................................................25
8/6/2019 ONU-ESCAP Trade and Investment Division, Staff Working Paper 02/10 Examining the Potential for Cross-South Pac…
http://slidepdf.com/reader/full/onu-escap-trade-and-investment-division-staff-working-paper-0210-examining 4/33
ESCAP Trade and Investment Division Staff Working Paper 02/1
4
I. Introduction
Trade in Asian economies has plummeted at double digit rates for the first time in modern history whenthe demand for their products collapsed under the pressure of the financial downturn and subsequently the
economic global crisis during 2008 and 2009. The loss of traditional export markets has forced export-ledAsian economies to consider shifting the source of their future growth towards different drivers: domestic
demand and other export markets. While there are sound arguments for pursing the goal of achieving more
balanced consumption and savings in Asia, which would lead into a larger domestic absorption of production,
it is obvious that domestic demand in Asia cannot support their growth at levels that were experienced in
years preceding the crisis. Many small economies cannot rely on their own domestic demand as an engine of
growth. Therefore, Asian economies have become keen to diversify their export destination markets to reduce
overall risk from exogenous shifts in growth and demand for their exports. The strategy, inter alia, relies on
the intensification of South-South trade (and investment) – not only within developing Asia, but also with
developing countries from outside the region, including Latin America.
Economic Commission for Latin America and the Caribbean (ECLAC) has recently prepared several
comprehensive reports pertinent to this topic of furthering cooperation between Latin America and Asia in the
area of trade and investment (see list of references for details). These reports single out geographical
distance as a major factor affecting economic cooperation between the two regions, but also list disparities
between regions in areas of economics, politics, culture and history as other significant obstacles. Furthermore,
a relevant factor affecting cooperation in the past has been the approach to the role of trade in economic
growth: Asian economies on average have been hailed as the “model” of export-led growth, while Latin
America as a whole was more or less associated with inward-looking strategies for growth. However these
categorizations are broad and one has to hasten to say that within Asia, as within Latin America, there areeconomies that do not fit within the general stereotype.
By complementing the recent reports of ECLAC with some additional statistical information on trade
flows and patterns, this paper discusses the potential for cross-South Pacific trade between selected Southeast
Asian and Latin American economies.2
The objective of this discussion is to identify obstacles for moreintensive trade between the observed countries. The paper proceeds as follows. Section 2 reviews trends in
trade flows and trade patterns between the selected economies, and by using several trade performance
indicators it finds the level of trade still relatively low. Section 3 then discusses the possible reasons for this
state of affairs. It focuses on a review of tariffs, trading costs and other possible impediments to trade. Section
4 considers how trade relations among these countries could be improved. It provides a background into thefeatures of the trade agreements that have been signed among the countries belonging to these two sub-
regions in an attempt to identify if any of them could be used as a “driver” for future integration. Section 5
concludes the discussion.
2While there is a relatively large amount of trade across the Pacific Ocean when East Asian countries and North
American countries are accounted for, the level of trade across the southern parts of the Pacific Ocean (involvingSoutheast Asia and Latin American countries) is still very low. This paper focuses only on these two sub-regions, and
also observes only the largest contributors to trade between them. “Cross-South Pacific” is still used as the simplest
description of trade flows direction being analyzed. A group of six countries, includes members of Association of
Southeast Asian Nations (ASEAN), that is Singapore, Viet Nam, Philippines, Thailand, Indonesia and Malaysia (named
ASEAN thereafter) and a group of five countries from Latin America includes Argentina, Brazil, Chile, Mexico and
Venezuela (named LAC thereafter). Even though Panama has significant trade with ASEAN it was omitted from
analysis after large amounts of unclassified trade with Singapore were identified. Data was retrieved from COMTRADE
through WITS based on SITC rev 3 classification of trade data. The ASEAN countries were used as reporting countries
in all tables and figures unless stated otherwise.
8/6/2019 ONU-ESCAP Trade and Investment Division, Staff Working Paper 02/10 Examining the Potential for Cross-South Pac…
http://slidepdf.com/reader/full/onu-escap-trade-and-investment-division-staff-working-paper-0210-examining 5/33
ESCAP Trade and Investment Division Staff Working Paper 02/1
5
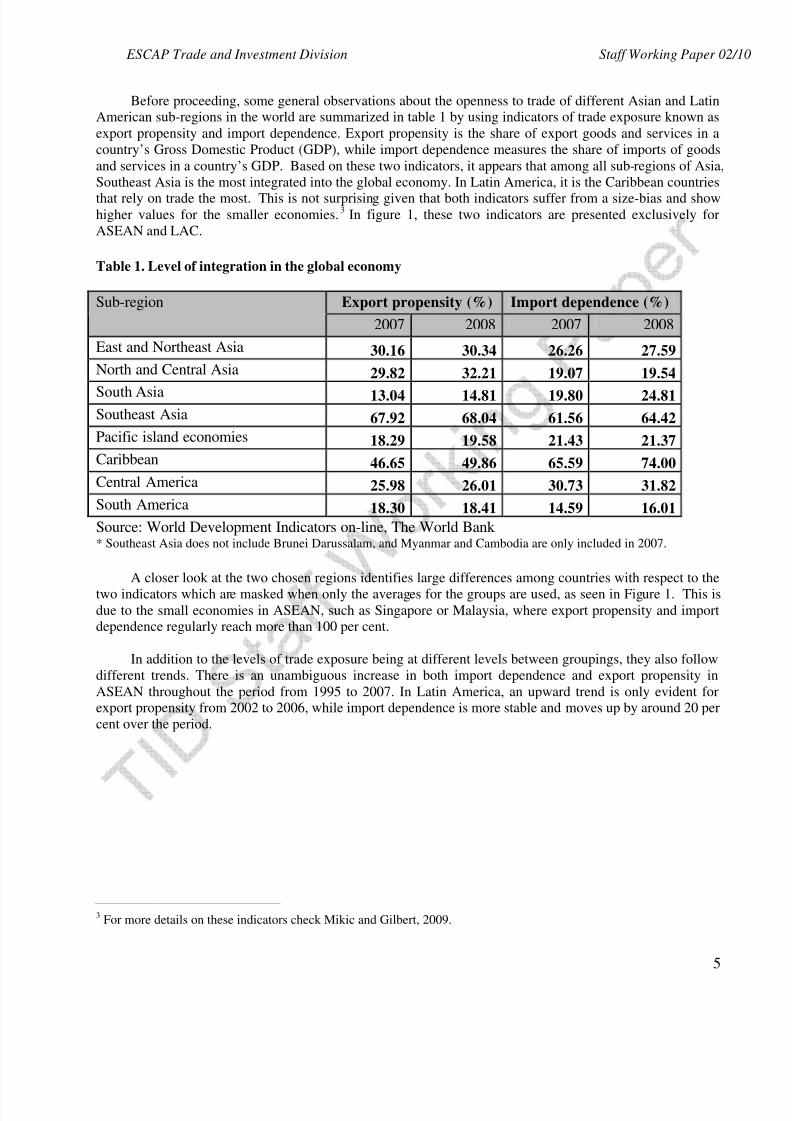
Before proceeding, some general observations about the openness to trade of different Asian and LatinAmerican sub-regions in the world are summarized in table 1 by using indicators of trade exposure known as
export propensity and import dependence. Export propensity is the share of export goods and services in a
country’s Gross Domestic Product (GDP), while import dependence measures the share of imports of goods
and services in a country’s GDP. Based on these two indicators, it appears that among all sub-regions of Asia,
Southeast Asia is the most integrated into the global economy. In Latin America, it is the Caribbean countries
that rely on trade the most. This is not surprising given that both indicators suffer from a size-bias and showhigher values for the smaller economies.3 In figure 1, these two indicators are presented exclusively for
ASEAN and LAC.
Table 1. Level of integration in the global economy
Export propensity (%) Import dependence (%)Sub-region
2007 2008 2007 2008
East and Northeast Asia 30.16 30.34 26.26 27.59
North and Central Asia 29.82 32.21 19.07 19.54
South Asia 13.04 14.81 19.80 24.81Southeast Asia 67.92 68.04 61.56 64.42
Pacific island economies 18.29 19.58 21.43 21.37
Caribbean 46.65 49.86 65.59 74.00
Central America 25.98 26.01 30.73 31.82
South America 18.30 18.41 14.59 16.01
Source: World Development Indicators on-line, The World Bank * Southeast Asia does not include Brunei Darussalam, and Myanmar and Cambodia are only included in 2007.
A closer look at the two chosen regions identifies large differences among countries with respect to the
two indicators which are masked when only the averages for the groups are used, as seen in Figure 1. This isdue to the small economies in ASEAN, such as Singapore or Malaysia, where export propensity and importdependence regularly reach more than 100 per cent.
In addition to the levels of trade exposure being at different levels between groupings, they also follow
different trends. There is an unambiguous increase in both import dependence and export propensity in
ASEAN throughout the period from 1995 to 2007. In Latin America, an upward trend is only evident forexport propensity from 2002 to 2006, while import dependence is more stable and moves up by around 20 per
cent over the period.
3For more details on these indicators check Mikic and Gilbert, 2009.
8/6/2019 ONU-ESCAP Trade and Investment Division, Staff Working Paper 02/10 Examining the Potential for Cross-South Pac…
http://slidepdf.com/reader/full/onu-escap-trade-and-investment-division-staff-working-paper-0210-examining 6/33
ESCAP Trade and Investment Division Staff Working Paper 02/1
6
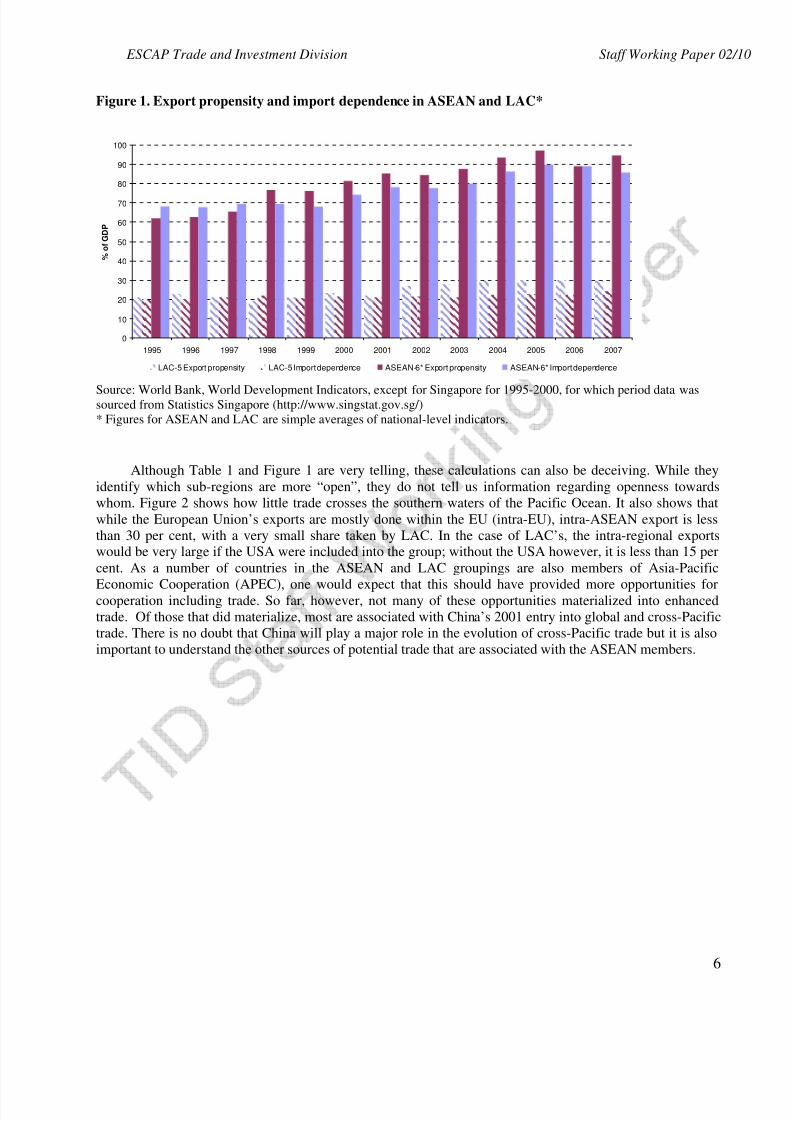
Figure 1. Export propensity and import dependence in ASEAN and LAC*
0
10
20
30
40
50
60
70
80
90
100
1995 1996 1997 1998 1999 2000 2001 2002 2003 2004 2005 2006 2007
% o
f G D P
LAC-5 Export propensity LAC-5 Import dependence ASEAN-6* Export propensity ASEAN-6* Import dependence
Source: World Bank, World Development Indicators, except for Singapore for 1995-2000, for which period data wassourced from Statistics Singapore (http://www.singstat.gov.sg/)
* Figures for ASEAN and LAC are simple averages of national-level indicators.
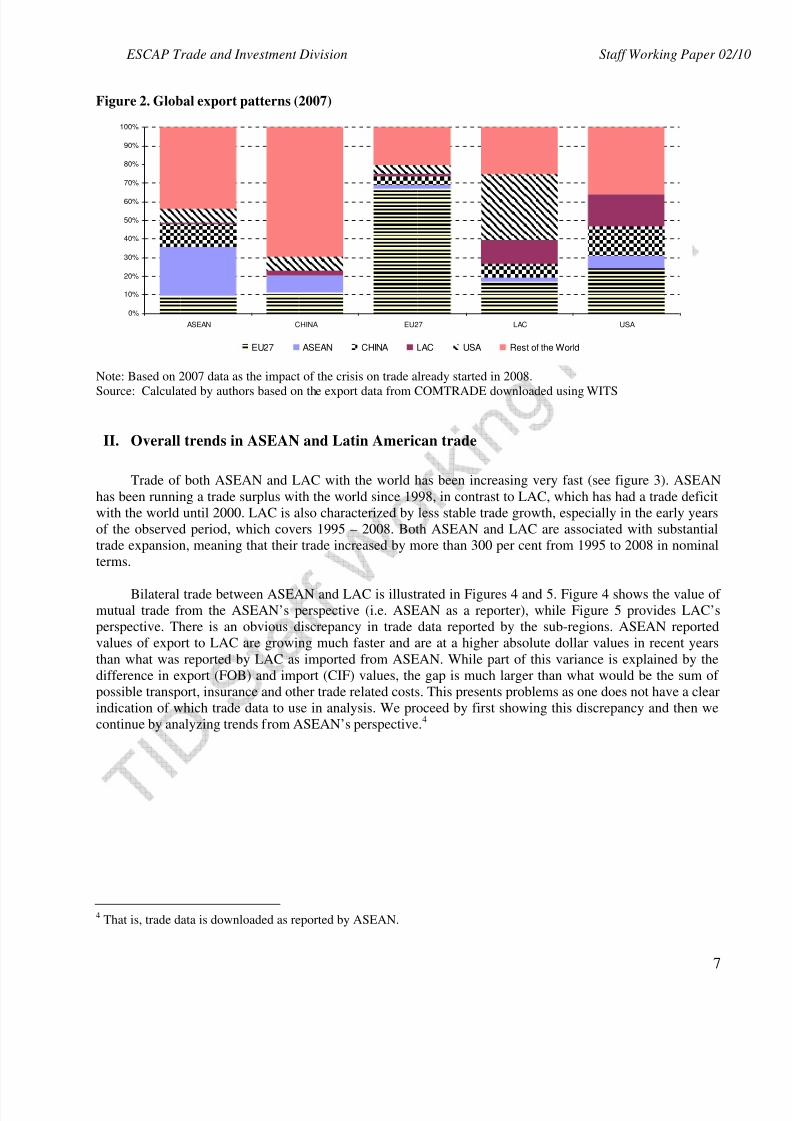
Although Table 1 and Figure 1 are very telling, these calculations can also be deceiving. While they
identify which sub-regions are more “open”, they do not tell us information regarding openness towards
whom. Figure 2 shows how little trade crosses the southern waters of the Pacific Ocean. It also shows that
while the European Union’s exports are mostly done within the EU (intra-EU), intra-ASEAN export is less
than 30 per cent, with a very small share taken by LAC. In the case of LAC’s, the intra-regional exportswould be very large if the USA were included into the group; without the USA however, it is less than 15 per
cent. As a number of countries in the ASEAN and LAC groupings are also members of Asia-Pacific
Economic Cooperation (APEC), one would expect that this should have provided more opportunities forcooperation including trade. So far, however, not many of these opportunities materialized into enhanced
trade. Of those that did materialize, most are associated with China’s 2001 entry into global and cross-Pacific
trade. There is no doubt that China will play a major role in the evolution of cross-Pacific trade but it is also
important to understand the other sources of potential trade that are associated with the ASEAN members.
8/6/2019 ONU-ESCAP Trade and Investment Division, Staff Working Paper 02/10 Examining the Potential for Cross-South Pac…
http://slidepdf.com/reader/full/onu-escap-trade-and-investment-division-staff-working-paper-0210-examining 7/33
ESCAP Trade and Investment Division Staff Working Paper 02/1
7
Figure 2. Global export patterns (2007)
0%
10%
20%
30%
40%
50%
60%
70%
80%
90%
100%
ASEAN CHINA EU27 LAC USA
EU27 ASEAN CHINA LAC USA Rest of the World
Note: Based on 2007 data as the impact of the crisis on trade already started in 2008.
Source: Calculated by authors based on the export data from COMTRADE downloaded using WITS
II. Overall trends in ASEAN and Latin American trade
Trade of both ASEAN and LAC with the world has been increasing very fast (see figure 3). ASEAN
has been running a trade surplus with the world since 1998, in contrast to LAC, which has had a trade deficit
with the world until 2000. LAC is also characterized by less stable trade growth, especially in the early years
of the observed period, which covers 1995 – 2008. Both ASEAN and LAC are associated with substantial
trade expansion, meaning that their trade increased by more than 300 per cent from 1995 to 2008 in nominal
terms.
Bilateral trade between ASEAN and LAC is illustrated in Figures 4 and 5. Figure 4 shows the value of mutual trade from the ASEAN’s perspective (i.e. ASEAN as a reporter), while Figure 5 provides LAC’s
perspective. There is an obvious discrepancy in trade data reported by the sub-regions. ASEAN reported
values of export to LAC are growing much faster and are at a higher absolute dollar values in recent years
than what was reported by LAC as imported from ASEAN. While part of this variance is explained by the
difference in export (FOB) and import (CIF) values, the gap is much larger than what would be the sum of
possible transport, insurance and other trade related costs. This presents problems as one does not have a clear
indication of which trade data to use in analysis. We proceed by first showing this discrepancy and then we
continue by analyzing trends from ASEAN’s perspective.4
4That is, trade data is downloaded as reported by ASEAN.
8/6/2019 ONU-ESCAP Trade and Investment Division, Staff Working Paper 02/10 Examining the Potential for Cross-South Pac…
http://slidepdf.com/reader/full/onu-escap-trade-and-investment-division-staff-working-paper-0210-examining 8/33
ESCAP Trade and Investment Division Staff Working Paper 02/1
8
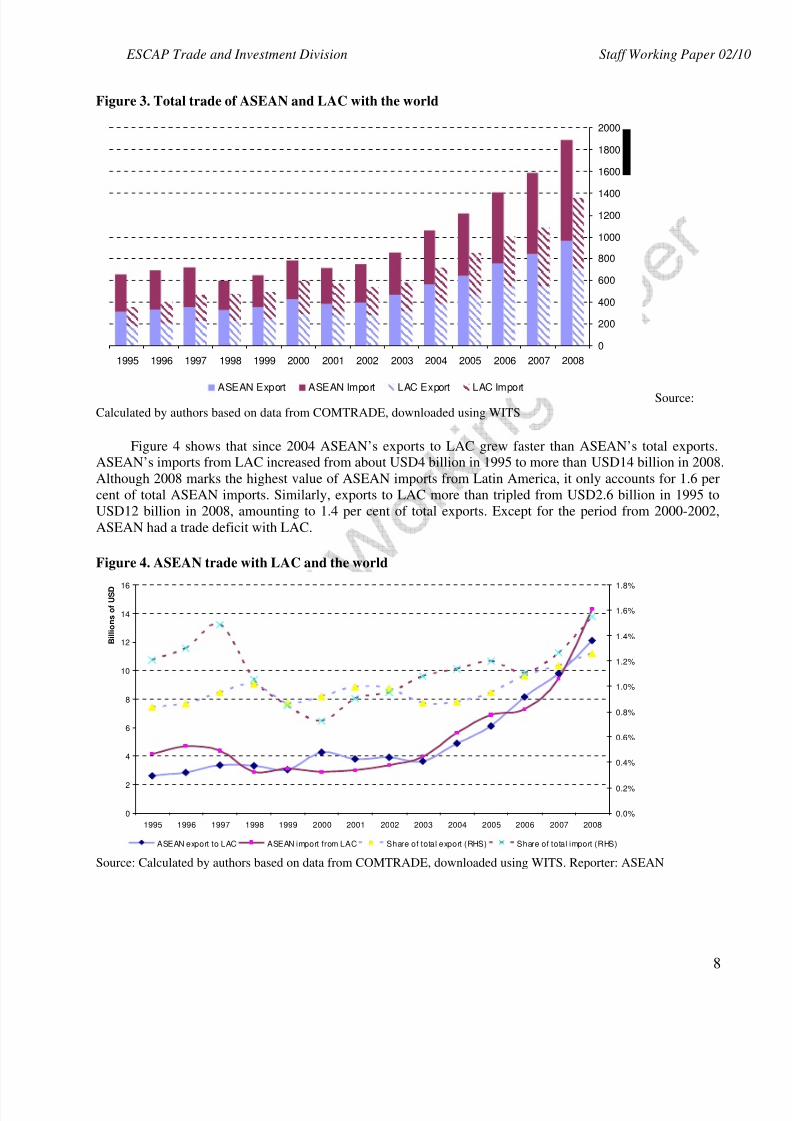
Figure 3. Total trade of ASEAN and LAC with the world
0
200
400
600
800
1000
1200
1400
1600
1800
2000
1995 1996 1997 1998 1999 2000 2001 2002 2003 2004 2005 2006 2007 2008
ASEAN Export ASEAN Import LAC Export LAC Import Source:
Calculated by authors based on data from COMTRADE, downloaded using WITS
Figure 4 shows that since 2004 ASEAN’s exports to LAC grew faster than ASEAN’s total exports.ASEAN’s imports from LAC increased from about USD4 billion in 1995 to more than USD14 billion in 2008.
Although 2008 marks the highest value of ASEAN imports from Latin America, it only accounts for 1.6 per
cent of total ASEAN imports. Similarly, exports to LAC more than tripled from USD2.6 billion in 1995 to
USD12 billion in 2008, amounting to 1.4 per cent of total exports. Except for the period from 2000-2002,
ASEAN had a trade deficit with LAC.
Figure 4. ASEAN trade with LAC and the world
0
2
4
6
8
10
12
14
16
1995 1996 1997 1998 1999 2000 2001 2002 2003 2004 2005 2006 2007 2008
B i l l i o n s o f U S D
0.0%
0.2%
0.4%
0.6%
0.8%
1.0%
1.2%
1.4%
1.6%
1.8%
ASEAN export to LAC ASEAN import from LAC Share of total export (RHS) Share of total import (RHS)
Source: Calculated by authors based on data from COMTRADE, downloaded using WITS. Reporter: ASEAN
8/6/2019 ONU-ESCAP Trade and Investment Division, Staff Working Paper 02/10 Examining the Potential for Cross-South Pac…
http://slidepdf.com/reader/full/onu-escap-trade-and-investment-division-staff-working-paper-0210-examining 9/33
ESCAP Trade and Investment Division Staff Working Paper 02/1
9
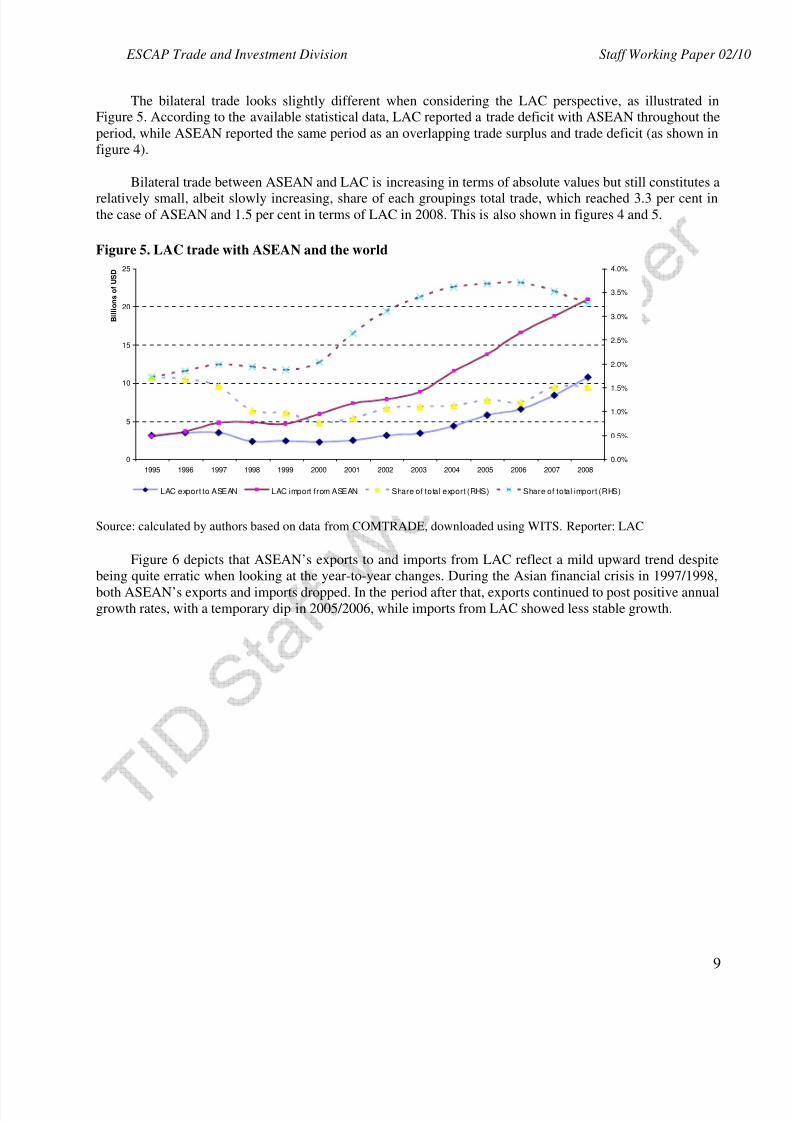
The bilateral trade looks slightly different when considering the LAC perspective, as illustrated inFigure 5. According to the available statistical data, LAC reported a trade deficit with ASEAN throughout the
period, while ASEAN reported the same period as an overlapping trade surplus and trade deficit (as shown in
figure 4).
Bilateral trade between ASEAN and LAC is increasing in terms of absolute values but still constitutes a
relatively small, albeit slowly increasing, share of each groupings total trade, which reached 3.3 per cent inthe case of ASEAN and 1.5 per cent in terms of LAC in 2008. This is also shown in figures 4 and 5.
Figure 5. LAC trade with ASEAN and the world
0
5
10
15
20
25
1995 1996 1997 1998 1999 2000 2001 2002 2003 2004 2005 2006 2007 2008
B i l l i o n s o f U S D
0.0%
0.5%
1.0%
1.5%
2.0%
2.5%
3.0%
3.5%
4.0%
LAC export to ASEAN LAC import from ASEAN Share of total export (RHS) Share of total import (RHS)
Source: calculated by authors based on data from COMTRADE, downloaded using WITS. Reporter: LAC
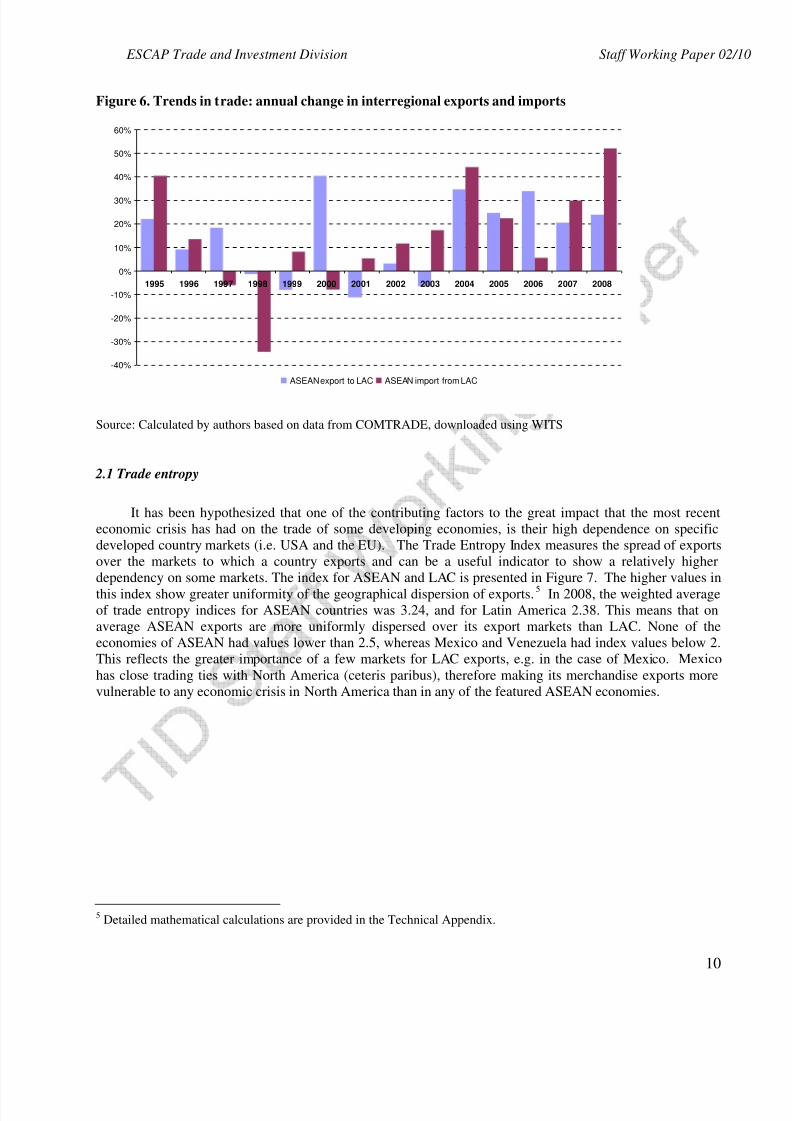
Figure 6 depicts that ASEAN’s exports to and imports from LAC reflect a mild upward trend despite
being quite erratic when looking at the year-to-year changes. During the Asian financial crisis in 1997/1998,
both ASEAN’s exports and imports dropped. In the period after that, exports continued to post positive annualgrowth rates, with a temporary dip in 2005/2006, while imports from LAC showed less stable growth.
8/6/2019 ONU-ESCAP Trade and Investment Division, Staff Working Paper 02/10 Examining the Potential for Cross-South Pac…
http://slidepdf.com/reader/full/onu-escap-trade-and-investment-division-staff-working-paper-0210-examining 10/33
ESCAP Trade and Investment Division Staff Working Paper 02/1
10
Figure 6. Trends in trade: annual change in interregional exports and imports
-40%
-30%
-20%
-10%
0%
10%
20%
30%
40%
50%
60%
1995 1996 1997 1998 1999 2000 2001 2002 2003 2004 2005 2006 2007 2008
ASEAN export to LAC ASEAN import from LAC
Source: Calculated by authors based on data from COMTRADE, downloaded using WITS
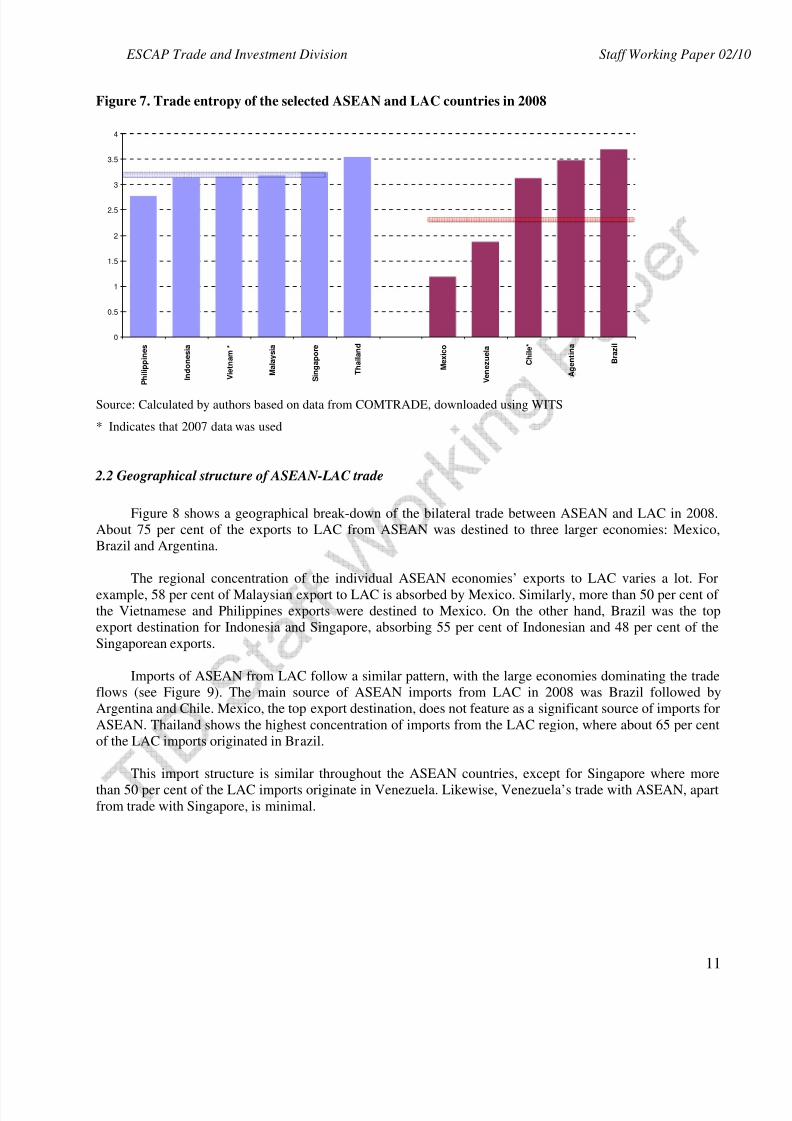
2.1 Trade entropy
It has been hypothesized that one of the contributing factors to the great impact that the most recent
economic crisis has had on the trade of some developing economies, is their high dependence on specific
developed country markets (i.e. USA and the EU). The Trade Entropy Index measures the spread of exports
over the markets to which a country exports and can be a useful indicator to show a relatively higher
dependency on some markets. The index for ASEAN and LAC is presented in Figure 7. The higher values in
this index show greater uniformity of the geographical dispersion of exports.5 In 2008, the weighted averageof trade entropy indices for ASEAN countries was 3.24, and for Latin America 2.38. This means that on
average ASEAN exports are more uniformly dispersed over its export markets than LAC. None of the
economies of ASEAN had values lower than 2.5, whereas Mexico and Venezuela had index values below 2.
This reflects the greater importance of a few markets for LAC exports, e.g. in the case of Mexico. Mexico
has close trading ties with North America (ceteris paribus), therefore making its merchandise exports more
vulnerable to any economic crisis in North America than in any of the featured ASEAN economies.
5Detailed mathematical calculations are provided in the Technical Appendix.
8/6/2019 ONU-ESCAP Trade and Investment Division, Staff Working Paper 02/10 Examining the Potential for Cross-South Pac…
http://slidepdf.com/reader/full/onu-escap-trade-and-investment-division-staff-working-paper-0210-examining 11/33
ESCAP Trade and Investment Division Staff Working Paper 02/1
11
Figure 7. Trade entropy of the selected ASEAN and LAC countries in 2008
0
0.5
1
1.5
2
2.5
3
3.5
4
P h i l i p p i n e s
I n d o n e s i a
V i e t n a m *
M a l a y s i a
S i n g a p o r e
T h a i l a n d
M e x i c o
V e n e z u e l a
C h i l e *
A g e n t i n a
B r a z i l
Source: Calculated by authors based on data from COMTRADE, downloaded using WITS
* Indicates that 2007 data was used
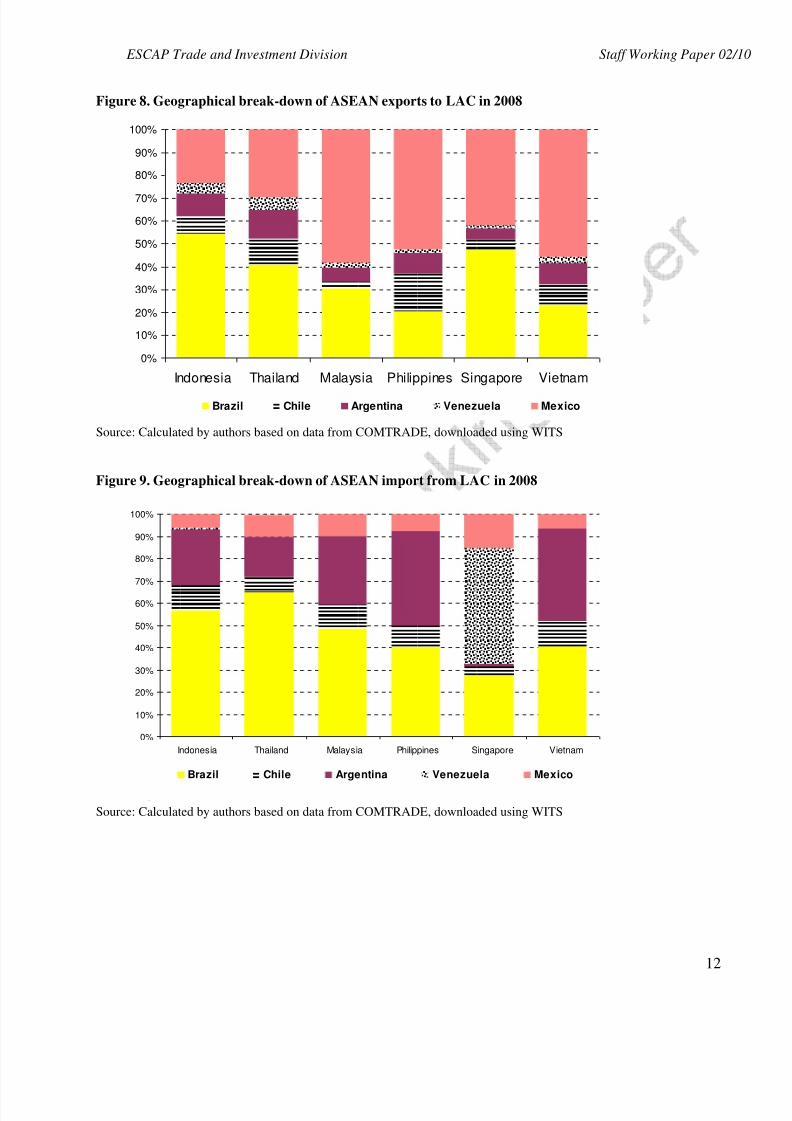
2.2 Geographical structure of ASEAN-LAC trade
Figure 8 shows a geographical break-down of the bilateral trade between ASEAN and LAC in 2008.
About 75 per cent of the exports to LAC from ASEAN was destined to three larger economies: Mexico,
Brazil and Argentina.
The regional concentration of the individual ASEAN economies’ exports to LAC varies a lot. For
example, 58 per cent of Malaysian export to LAC is absorbed by Mexico. Similarly, more than 50 per cent of
the Vietnamese and Philippines exports were destined to Mexico. On the other hand, Brazil was the top
export destination for Indonesia and Singapore, absorbing 55 per cent of Indonesian and 48 per cent of the
Singaporean exports.
Imports of ASEAN from LAC follow a similar pattern, with the large economies dominating the trade
flows (see Figure 9). The main source of ASEAN imports from LAC in 2008 was Brazil followed by
Argentina and Chile. Mexico, the top export destination, does not feature as a significant source of imports for
ASEAN. Thailand shows the highest concentration of imports from the LAC region, where about 65 per cent
of the LAC imports originated in Brazil.
This import structure is similar throughout the ASEAN countries, except for Singapore where more
than 50 per cent of the LAC imports originate in Venezuela. Likewise, Venezuela’s trade with ASEAN, apartfrom trade with Singapore, is minimal.
8/6/2019 ONU-ESCAP Trade and Investment Division, Staff Working Paper 02/10 Examining the Potential for Cross-South Pac…
http://slidepdf.com/reader/full/onu-escap-trade-and-investment-division-staff-working-paper-0210-examining 12/33
ESCAP Trade and Investment Division Staff Working Paper 02/1
12
Figure 8. Geographical break-down of ASEAN exports to LAC in 2008
0%
10%
20%
30%
40%
50%
60%
70%
80%
90%
100%
Indonesia Thailand Malaysia Philippines Singapore Vietnam
Brazil Chile Argentina Venezuela Mexico
Source: Calculated by authors based on data from COMTRADE, downloaded using WITS
Figure 9. Geographical break-down of ASEAN import from LAC in 2008
0%
10%
20%
30%
40%
50%
60%
70%
80%
90%
100%
Indonesia Thailand Malaysia Philippines Singapore Vietnam
Brazil Chile Argentina Venezuela Mexico
Source: Calculated by authors based on data from COMTRADE, downloaded using WITS
8/6/2019 ONU-ESCAP Trade and Investment Division, Staff Working Paper 02/10 Examining the Potential for Cross-South Pac…
http://slidepdf.com/reader/full/onu-escap-trade-and-investment-division-staff-working-paper-0210-examining 13/33
ESCAP Trade and Investment Division Staff Working Paper 02/1
13
2.3 Sectoral composition of trade
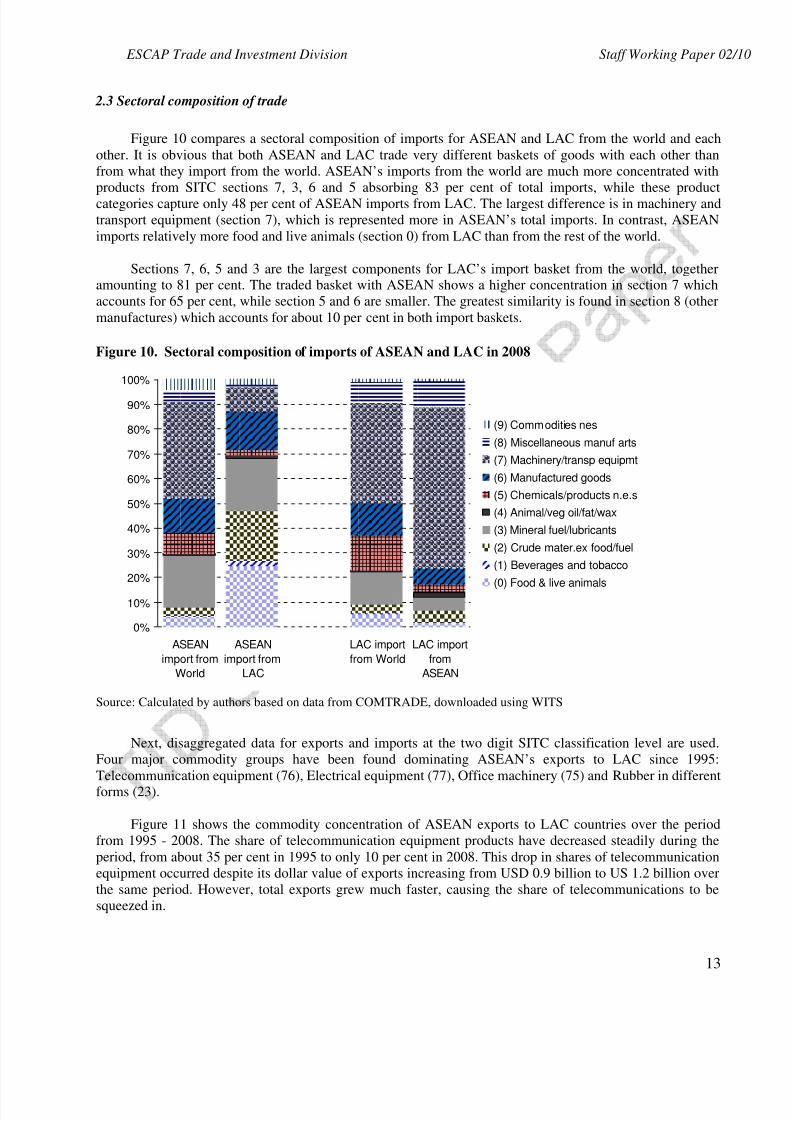
Figure 10 compares a sectoral composition of imports for ASEAN and LAC from the world and each
other. It is obvious that both ASEAN and LAC trade very different baskets of goods with each other than
from what they import from the world. ASEAN’s imports from the world are much more concentrated with
products from SITC sections 7, 3, 6 and 5 absorbing 83 per cent of total imports, while these product
categories capture only 48 per cent of ASEAN imports from LAC. The largest difference is in machinery and
transport equipment (section 7), which is represented more in ASEAN’s total imports. In contrast, ASEAN
imports relatively more food and live animals (section 0) from LAC than from the rest of the world.
Sections 7, 6, 5 and 3 are the largest components for LAC’s import basket from the world, togetheramounting to 81 per cent. The traded basket with ASEAN shows a higher concentration in section 7 which
accounts for 65 per cent, while section 5 and 6 are smaller. The greatest similarity is found in section 8 (other
manufactures) which accounts for about 10 per cent in both import baskets.
Figure 10. Sectoral composition of imports of ASEAN and LAC in 2008
0%
10%
20%
30%
40%
50%
60%
70%
80%
90%
100%
ASEAN
import from
World
ASEAN
import from
LAC
LAC import
from World
LAC import
from
ASEAN
(9) Commodities nes
(8) Miscellaneous manuf arts
(7) Machinery/transp equipmt
(6) Manufactured goods
(5) Chemicals/products n.e.s
(4) Animal/veg oil/fat/wax
(3) Mineral fuel/lubricants
(2) Crude mater.ex food/fuel
(1) Beverages and tobacco
(0) Food & live animals
Source: Calculated by authors based on data from COMTRADE, downloaded using WITS
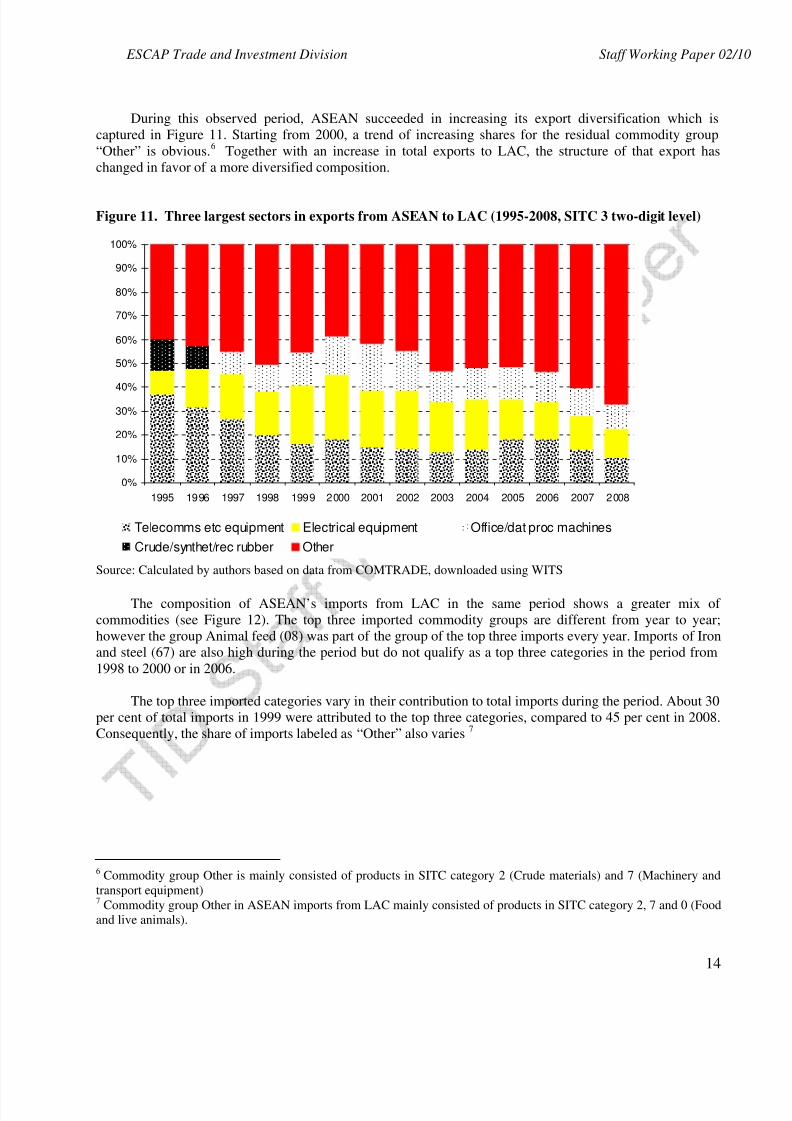
Next, disaggregated data for exports and imports at the two digit SITC classification level are used.
Four major commodity groups have been found dominating ASEAN’s exports to LAC since 1995:
Telecommunication equipment (76), Electrical equipment (77), Office machinery (75) and Rubber in differentforms (23).
Figure 11 shows the commodity concentration of ASEAN exports to LAC countries over the period
from 1995 - 2008. The share of telecommunication equipment products have decreased steadily during the
period, from about 35 per cent in 1995 to only 10 per cent in 2008. This drop in shares of telecommunication
equipment occurred despite its dollar value of exports increasing from USD 0.9 billion to US 1.2 billion over
the same period. However, total exports grew much faster, causing the share of telecommunications to be
squeezed in.
8/6/2019 ONU-ESCAP Trade and Investment Division, Staff Working Paper 02/10 Examining the Potential for Cross-South Pac…
http://slidepdf.com/reader/full/onu-escap-trade-and-investment-division-staff-working-paper-0210-examining 14/33
ESCAP Trade and Investment Division Staff Working Paper 02/1
14
During this observed period, ASEAN succeeded in increasing its export diversification which is
captured in Figure 11. Starting from 2000, a trend of increasing shares for the residual commodity group
“Other” is obvious.6
Together with an increase in total exports to LAC, the structure of that export has
changed in favor of a more diversified composition.
Figure 11. Three largest sectors in exports from ASEAN to LAC (1995-2008, SITC 3 two-digit level)
0%
10%
20%
30%
40%
50%
60%
70%
80%
90%
100%
1995 1996 1997 1998 1999 2000 2001 2002 2003 2004 2005 2006 2007 2008
Telecomms etc equipment Electrical equipment Office/dat proc machines
Crude/synthet/rec rubber Other
Source: Calculated by authors based on data from COMTRADE, downloaded using WITS
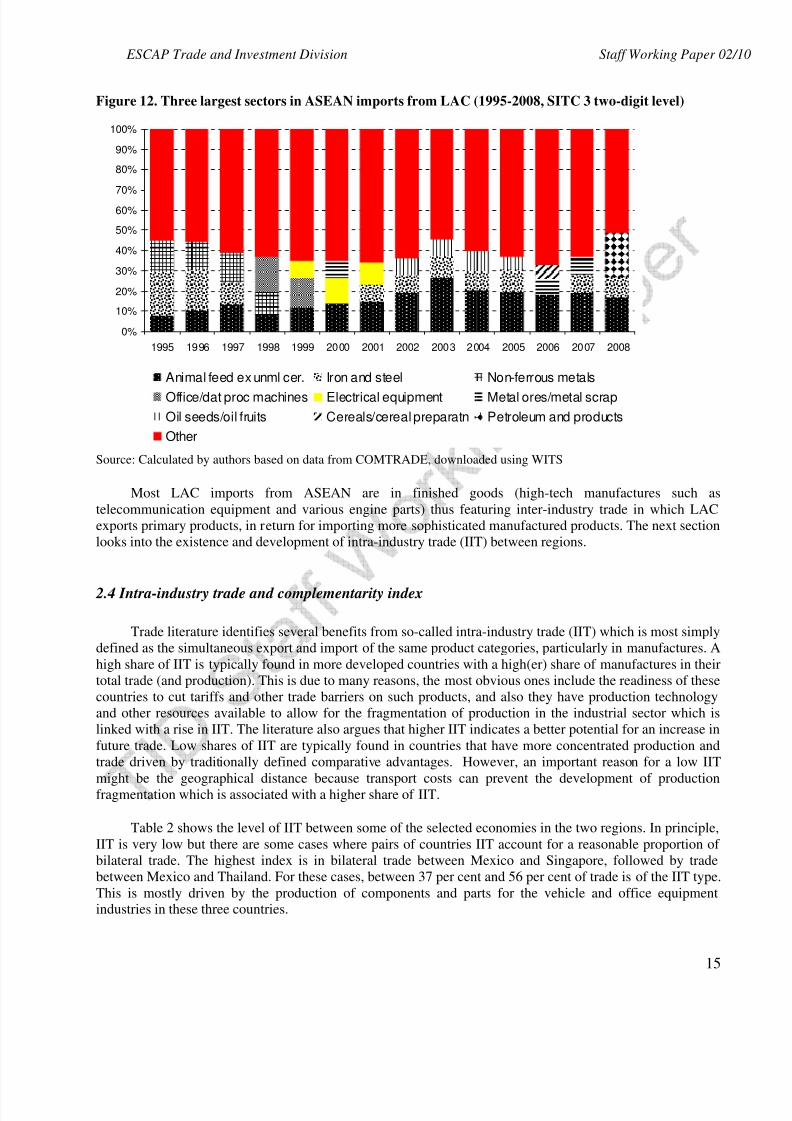
The composition of ASEAN’s imports from LAC in the same period shows a greater mix of
commodities (see Figure 12). The top three imported commodity groups are different from year to year;
however the group Animal feed (08) was part of the group of the top three imports every year. Imports of Iron
and steel (67) are also high during the period but do not qualify as a top three categories in the period from
1998 to 2000 or in 2006.
The top three imported categories vary in their contribution to total imports during the period. About 30
per cent of total imports in 1999 were attributed to the top three categories, compared to 45 per cent in 2008.
Consequently, the share of imports labeled as “Other” also varies 7
6 Commodity group Other is mainly consisted of products in SITC category 2 (Crude materials) and 7 (Machinery and
transport equipment)7
Commodity group Other in ASEAN imports from LAC mainly consisted of products in SITC category 2, 7 and 0 (Food
and live animals).
8/6/2019 ONU-ESCAP Trade and Investment Division, Staff Working Paper 02/10 Examining the Potential for Cross-South Pac…
http://slidepdf.com/reader/full/onu-escap-trade-and-investment-division-staff-working-paper-0210-examining 15/33
ESCAP Trade and Investment Division Staff Working Paper 02/1
15
Figure 12. Three largest sectors in ASEAN imports from LAC (1995-2008, SITC 3 two-digit level)
0%
10%
20%
30%
40%
50%
60%
70%
80%
90%
100%
1995 1996 1997 1998 1999 2000 2001 2002 2003 2004 2005 2006 2007 2008
Animal feed ex unml cer. Iron and steel Non-ferrous metals
Office/dat proc machines Electrical equipment Metal ores/metal scrap
Oil seeds/oil fruits Cereals/cereal preparatn Petroleum and products
Other
Source: Calculated by authors based on data from COMTRADE, downloaded using WITS
Most LAC imports from ASEAN are in finished goods (high-tech manufactures such as
telecommunication equipment and various engine parts) thus featuring inter-industry trade in which LAC
exports primary products, in return for importing more sophisticated manufactured products. The next section
looks into the existence and development of intra-industry trade (IIT) between regions.
2.4 Intra-industry trade and complementarity index
Trade literature identifies several benefits from so-called intra-industry trade (IIT) which is most simply
defined as the simultaneous export and import of the same product categories, particularly in manufactures. A
high share of IIT is typically found in more developed countries with a high(er) share of manufactures in their
total trade (and production). This is due to many reasons, the most obvious ones include the readiness of these
countries to cut tariffs and other trade barriers on such products, and also they have production technology
and other resources available to allow for the fragmentation of production in the industrial sector which is
linked with a rise in IIT. The literature also argues that higher IIT indicates a better potential for an increase in
future trade. Low shares of IIT are typically found in countries that have more concentrated production and
trade driven by traditionally defined comparative advantages. However, an important reason for a low IIT
might be the geographical distance because transport costs can prevent the development of production
fragmentation which is associated with a higher share of IIT.
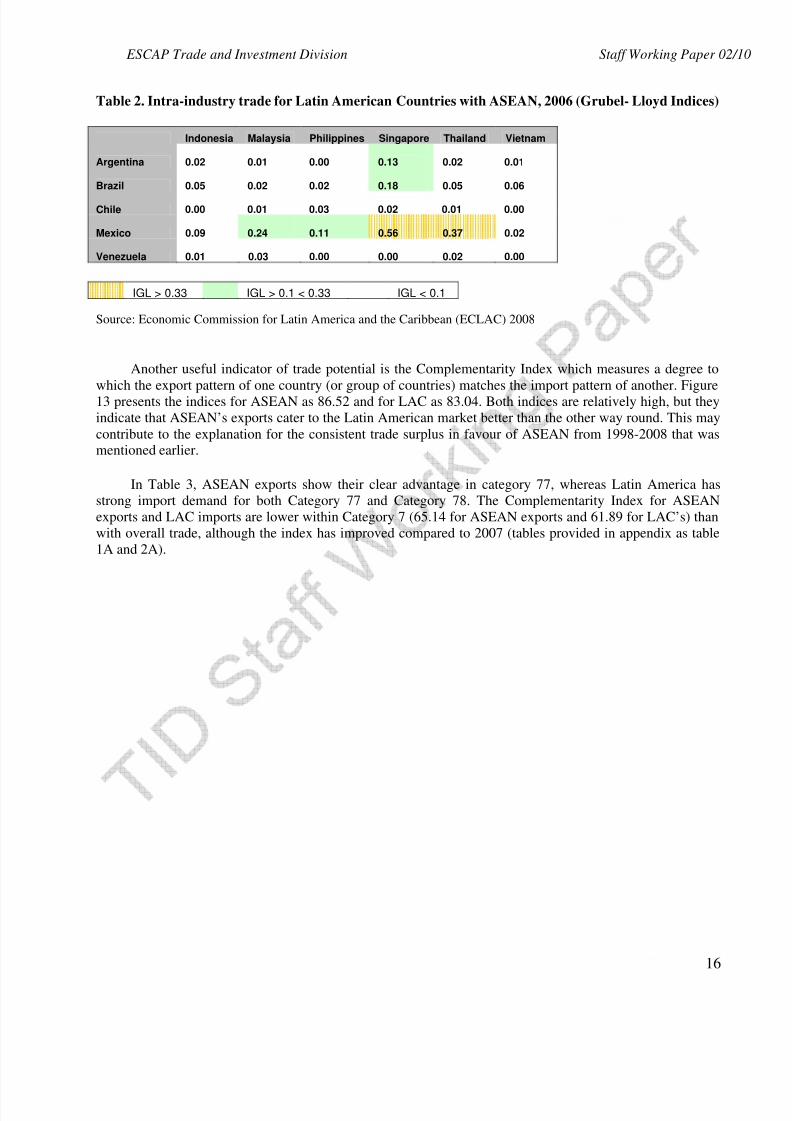
Table 2 shows the level of IIT between some of the selected economies in the two regions. In principle,
IIT is very low but there are some cases where pairs of countries IIT account for a reasonable proportion of
bilateral trade. The highest index is in bilateral trade between Mexico and Singapore, followed by trade
between Mexico and Thailand. For these cases, between 37 per cent and 56 per cent of trade is of the IIT type.
This is mostly driven by the production of components and parts for the vehicle and office equipmentindustries in these three countries.
8/6/2019 ONU-ESCAP Trade and Investment Division, Staff Working Paper 02/10 Examining the Potential for Cross-South Pac…
http://slidepdf.com/reader/full/onu-escap-trade-and-investment-division-staff-working-paper-0210-examining 16/33
ESCAP Trade and Investment Division Staff Working Paper 02/1
16
Table 2. Intra-industry trade for Latin American Countries with ASEAN, 2006 (Grubel- Lloyd Indices)
Indonesia Malaysia Philippines Singapore Thailand Vietnam
Argentina 0.02 0.01 0.00 0.13 0.02 0.01
Brazil 0.05 0.02 0.02 0.18 0.05 0.06
Chile 0.00 0.01 0.03 0.02 0.01 0.00
Mexico 0.09 0.24 0.11 0.56 0.37 0.02
Venezuela 0.01 0.03 0.00 0.00 0.02 0.00
IGL > 0.33 IGL > 0.1 < 0.33 IGL < 0.1
Source: Economic Commission for Latin America and the Caribbean (ECLAC) 2008
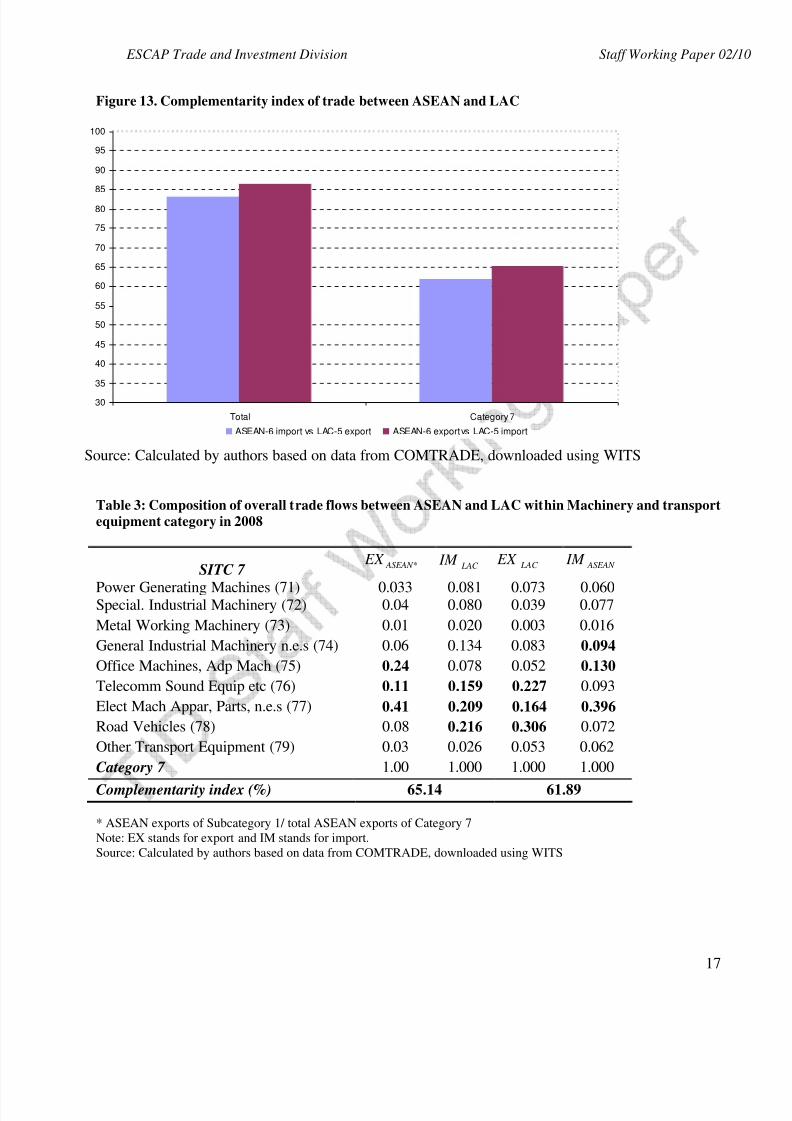
Another useful indicator of trade potential is the Complementarity Index which measures a degree to
which the export pattern of one country (or group of countries) matches the import pattern of another. Figure
13 presents the indices for ASEAN as 86.52 and for LAC as 83.04. Both indices are relatively high, but they
indicate that ASEAN’s exports cater to the Latin American market better than the other way round. This may
contribute to the explanation for the consistent trade surplus in favour of ASEAN from 1998-2008 that wasmentioned earlier.
In Table 3, ASEAN exports show their clear advantage in category 77, whereas Latin America has
strong import demand for both Category 77 and Category 78. The Complementarity Index for ASEAN
exports and LAC imports are lower within Category 7 (65.14 for ASEAN exports and 61.89 for LAC’s) than
with overall trade, although the index has improved compared to 2007 (tables provided in appendix as table
1A and 2A).
8/6/2019 ONU-ESCAP Trade and Investment Division, Staff Working Paper 02/10 Examining the Potential for Cross-South Pac…
http://slidepdf.com/reader/full/onu-escap-trade-and-investment-division-staff-working-paper-0210-examining 17/33
ESCAP Trade and Investment Division Staff Working Paper 02/1
17
Figure 13. Complementarity index of trade between ASEAN and LAC
30
35
40
45
50
55
60
65
70
75
80
85
90
95
100
Total Category 7
ASEAN-6 import vs LAC-5 export ASEAN-6 export vs LAC-5 import
Source: Calculated by authors based on data from COMTRADE, downloaded using WITS
Table 3: Composition of overall trade flows between ASEAN and LAC within Machinery and transport
equipment category in 2008
SITC 7
Power Generating Machines (71) 0.033 0.081 0.073 0.060Special. Industrial Machinery (72) 0.04 0.080 0.039 0.077
Metal Working Machinery (73) 0.01 0.020 0.003 0.016
General Industrial Machinery n.e.s (74) 0.06 0.134 0.083 0.094
Office Machines, Adp Mach (75) 0.24 0.078 0.052 0.130
Telecomm Sound Equip etc (76) 0.11 0.159 0.227 0.093
Elect Mach Appar, Parts, n.e.s (77) 0.41 0.209 0.164 0.396
Road Vehicles (78) 0.08 0.216 0.306 0.072
Other Transport Equipment (79) 0.03 0.026 0.053 0.062
Category 7 1.00 1.000 1.000 1.000
Complementarity index (%) 65.14 61.89
* ASEAN exports of Subcategory 1/ total ASEAN exports of Category 7
Note: EX stands for export and IM stands for import.
Source: Calculated by authors based on data from COMTRADE, downloaded using WITS
* ASEAN EX LAC IM LAC EX ASEAN IM
8/6/2019 ONU-ESCAP Trade and Investment Division, Staff Working Paper 02/10 Examining the Potential for Cross-South Pac…
http://slidepdf.com/reader/full/onu-escap-trade-and-investment-division-staff-working-paper-0210-examining 18/33
ESCAP Trade and Investment Division Staff Working Paper 02/1
18
III. Obstacles in trade between ASEAN and LAC
3.1 Tariffs and trade costs in trade between ASEAN and LAC
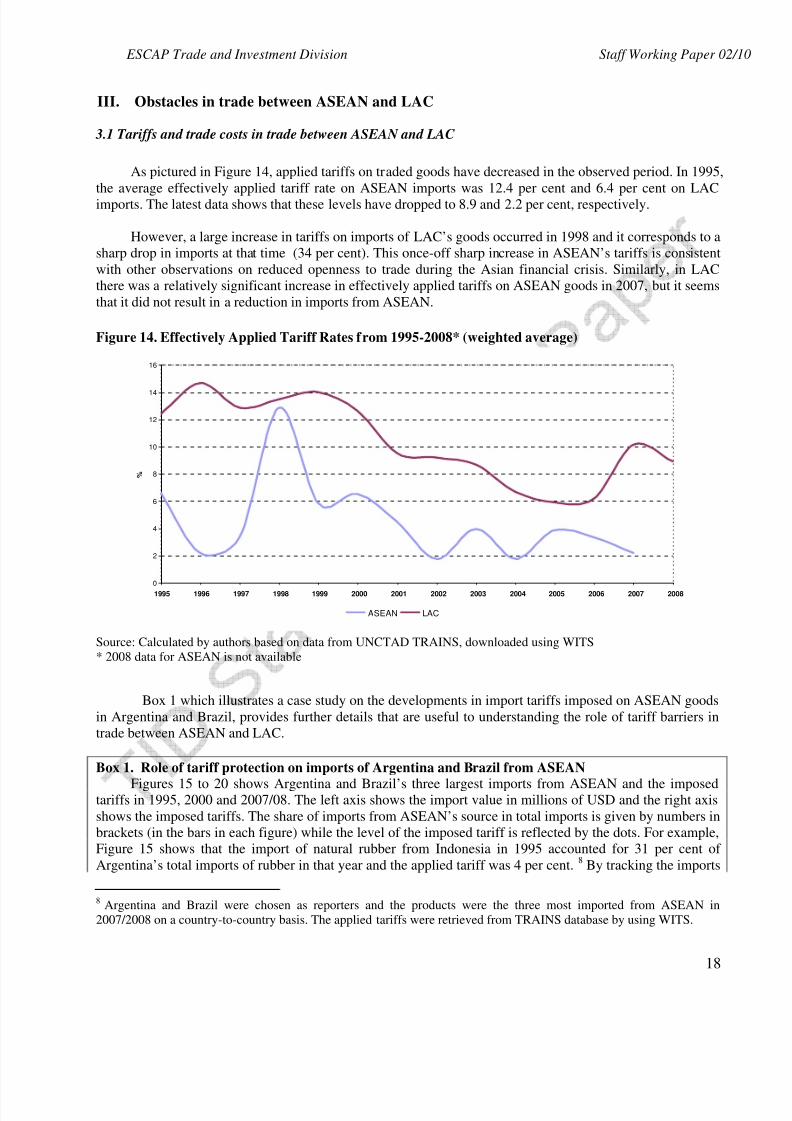
As pictured in Figure 14, applied tariffs on traded goods have decreased in the observed period. In 1995,
the average effectively applied tariff rate on ASEAN imports was 12.4 per cent and 6.4 per cent on LAC
imports. The latest data shows that these levels have dropped to 8.9 and 2.2 per cent, respectively.
However, a large increase in tariffs on imports of LAC’s goods occurred in 1998 and it corresponds to a
sharp drop in imports at that time (34 per cent). This once-off sharp increase in ASEAN’s tariffs is consistent
with other observations on reduced openness to trade during the Asian financial crisis. Similarly, in LAC
there was a relatively significant increase in effectively applied tariffs on ASEAN goods in 2007, but it seems
that it did not result in a reduction in imports from ASEAN.
Figure 14. Effectively Applied Tariff Rates from 1995-2008* (weighted average)
0
2
4
6
8
10
12
14
16
1995 1996 1997 1998 1999 2000 2001 2002 2003 2004 2005 2006 2007 2008
%
ASEAN LAC
Source: Calculated by authors based on data from UNCTAD TRAINS, downloaded using WITS
* 2008 data for ASEAN is not available
Box 1 which illustrates a case study on the developments in import tariffs imposed on ASEAN goods
in Argentina and Brazil, provides further details that are useful to understanding the role of tariff barriers in
trade between ASEAN and LAC.
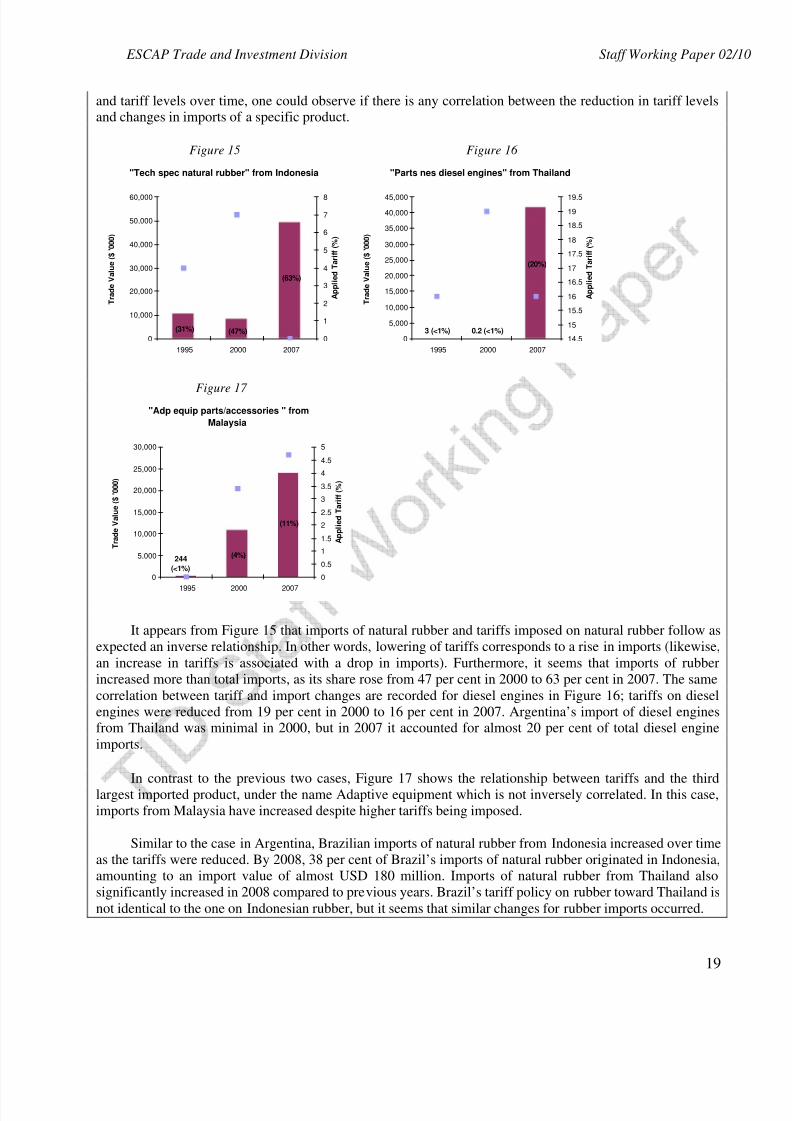
Box 1. Role of tariff protection on imports of Argentina and Brazil from ASEAN
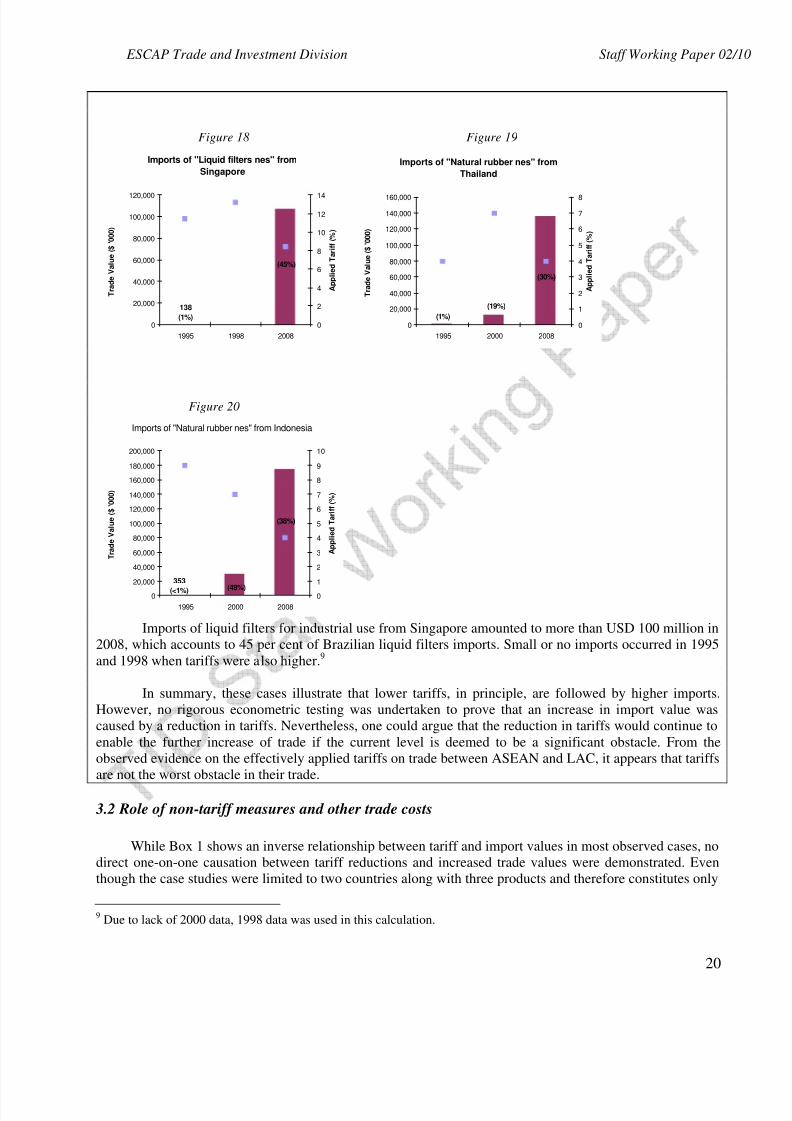
Figures 15 to 20 shows Argentina and Brazil’s three largest imports from ASEAN and the imposedtariffs in 1995, 2000 and 2007/08. The left axis shows the import value in millions of USD and the right axis
shows the imposed tariffs. The share of imports from ASEAN’s source in total imports is given by numbers in
brackets (in the bars in each figure) while the level of the imposed tariff is reflected by the dots. For example,
Figure 15 shows that the import of natural rubber from Indonesia in 1995 accounted for 31 per cent of
Argentina’s total imports of rubber in that year and the applied tariff was 4 per cent.8
By tracking the imports
8Argentina and Brazil were chosen as reporters and the products were the three most imported from ASEAN in
2007/2008 on a country-to-country basis. The applied tariffs were retrieved from TRAINS database by using WITS.
8/6/2019 ONU-ESCAP Trade and Investment Division, Staff Working Paper 02/10 Examining the Potential for Cross-South Pac…
http://slidepdf.com/reader/full/onu-escap-trade-and-investment-division-staff-working-paper-0210-examining 19/33
ESCAP Trade and Investment Division Staff Working Paper 02/1
19
and tariff levels over time, one could observe if there is any correlation between the reduction in tariff levelsand changes in imports of a specific product.
Figure 15 Figure 16
"Tech spec natural rubber" from Indonesia
(63%)
(47%)(31%)
0
10,000
20,000
30,000
40,000
50,000
60,000
1995 2000 2007
T r a d e V a l u e ( $ ' 0 0 0 )
0
1
2
3
4
5
6
7
8
A p p l i e d T a r i f f ( % )
"Parts nes diesel engines" from Thailand
0.2 (<1%)3 (<1%)
(20%)
0
5,000
10,000
15,000
20,000
25,000
30,000
35,000
40,000
45,000
1995 2000 2007
T r a d e V a l u e ( $ ' 0 0 0 )
14.5
15
15.5
16
16.5
17
17.5
18
18.5
19
19.5
A p p l i e d T a r i f f ( % )
Figure 17 "Adp equip parts/accessories " from
Malaysia
244
(<1%)
(11%)
(4%)
0
5,000
10,000
15,000
20,000
25,000
30,000
1995 2000 2007
T r a d e V a l u e ( $ ' 0 0 0 )
0
0.5
1
1.5
2
2.5
3
3.5
4
4.5
5
A p p l i e d T a r i f f ( % )
It appears from Figure 15 that imports of natural rubber and tariffs imposed on natural rubber follow as
expected an inverse relationship. In other words, lowering of tariffs corresponds to a rise in imports (likewise,
an increase in tariffs is associated with a drop in imports). Furthermore, it seems that imports of rubber
increased more than total imports, as its share rose from 47 per cent in 2000 to 63 per cent in 2007. The same
correlation between tariff and import changes are recorded for diesel engines in Figure 16; tariffs on diesel
engines were reduced from 19 per cent in 2000 to 16 per cent in 2007. Argentina’s import of diesel enginesfrom Thailand was minimal in 2000, but in 2007 it accounted for almost 20 per cent of total diesel engine
imports.
In contrast to the previous two cases, Figure 17 shows the relationship between tariffs and the third
largest imported product, under the name Adaptive equipment which is not inversely correlated. In this case,
imports from Malaysia have increased despite higher tariffs being imposed.
Similar to the case in Argentina, Brazilian imports of natural rubber from Indonesia increased over time
as the tariffs were reduced. By 2008, 38 per cent of Brazil’s imports of natural rubber originated in Indonesia,
amounting to an import value of almost USD 180 million. Imports of natural rubber from Thailand also
significantly increased in 2008 compared to previous years. Brazil’s tariff policy on rubber toward Thailand is
not identical to the one on Indonesian rubber, but it seems that similar changes for rubber imports occurred.
8/6/2019 ONU-ESCAP Trade and Investment Division, Staff Working Paper 02/10 Examining the Potential for Cross-South Pac…
http://slidepdf.com/reader/full/onu-escap-trade-and-investment-division-staff-working-paper-0210-examining 20/33
ESCAP Trade and Investment Division Staff Working Paper 02/1
20
Figure 18 Figure 19
Imports of "Liquid filters nes" from
Singapore
138
(1%)
(45%)
0
20,000
40,000
60,000
80,000
100,000
120,000
1995 1998 2008
T r a d e V a l u e ( $ ' 0 0 0 )
0
2
4
6
8
10
12
14
A p p l i e d T a r i f f ( % )
Imports of "Natural rubber nes" from
Thailand
(30%)
(1%)0
20,000
40,000
60,000
80,000
100,000
120,000
140,000
160,000
1995 2000 2008
T r a d e V a l u e ( $ ' 0 0 0 )
0
1
2
3
4
5
6
7
8
A p p l i e d T a r i f f ( % )
(19%)
Figure 20
Imports of "Natural rubber nes" from Indonesia
(48%)
(38%)
353
(<1%)0
20,000
40,000
60,000
80,000
100,000
120,000
140,000
160,000
180,000
200,000
1995 2000 2008
T r a d e V a l u e ( $ ' 0 0 0 )
0
1
2
3
4
5
6
7
8
9
10
A p p l i e d T a r i f f ( % )
Imports of liquid filters for industrial use from Singapore amounted to more than USD 100 million in
2008, which accounts to 45 per cent of Brazilian liquid filters imports. Small or no imports occurred in 1995
and 1998 when tariffs were also higher.9
In summary, these cases illustrate that lower tariffs, in principle, are followed by higher imports.
However, no rigorous econometric testing was undertaken to prove that an increase in import value was
caused by a reduction in tariffs. Nevertheless, one could argue that the reduction in tariffs would continue to
enable the further increase of trade if the current level is deemed to be a significant obstacle. From the
observed evidence on the effectively applied tariffs on trade between ASEAN and LAC, it appears that tariffs
are not the worst obstacle in their trade.
3.2 Role of non-tariff measures and other trade costs
While Box 1 shows an inverse relationship between tariff and import values in most observed cases, no
direct one-on-one causation between tariff reductions and increased trade values were demonstrated. Even
though the case studies were limited to two countries along with three products and therefore constitutes only
9Due to lack of 2000 data, 1998 data was used in this calculation.
8/6/2019 ONU-ESCAP Trade and Investment Division, Staff Working Paper 02/10 Examining the Potential for Cross-South Pac…
http://slidepdf.com/reader/full/onu-escap-trade-and-investment-division-staff-working-paper-0210-examining 21/33
ESCAP Trade and Investment Division Staff Working Paper 02/1
21
anecdotal evidence, it is argued that the tariffs are not the best explanatory variable for the current state of trade between ASEAN and LAC. These other factors relate to non-tariff measures and other costs related to
trade included in both transport and trade facilitation. To analyze the role of these factors, two indicators from
the World Bank’s World Trade Indicators database were chosen, these include: the Overall Trade
Restrictiveness Index (OTRI) and the Logistic Performance Index (LPI).
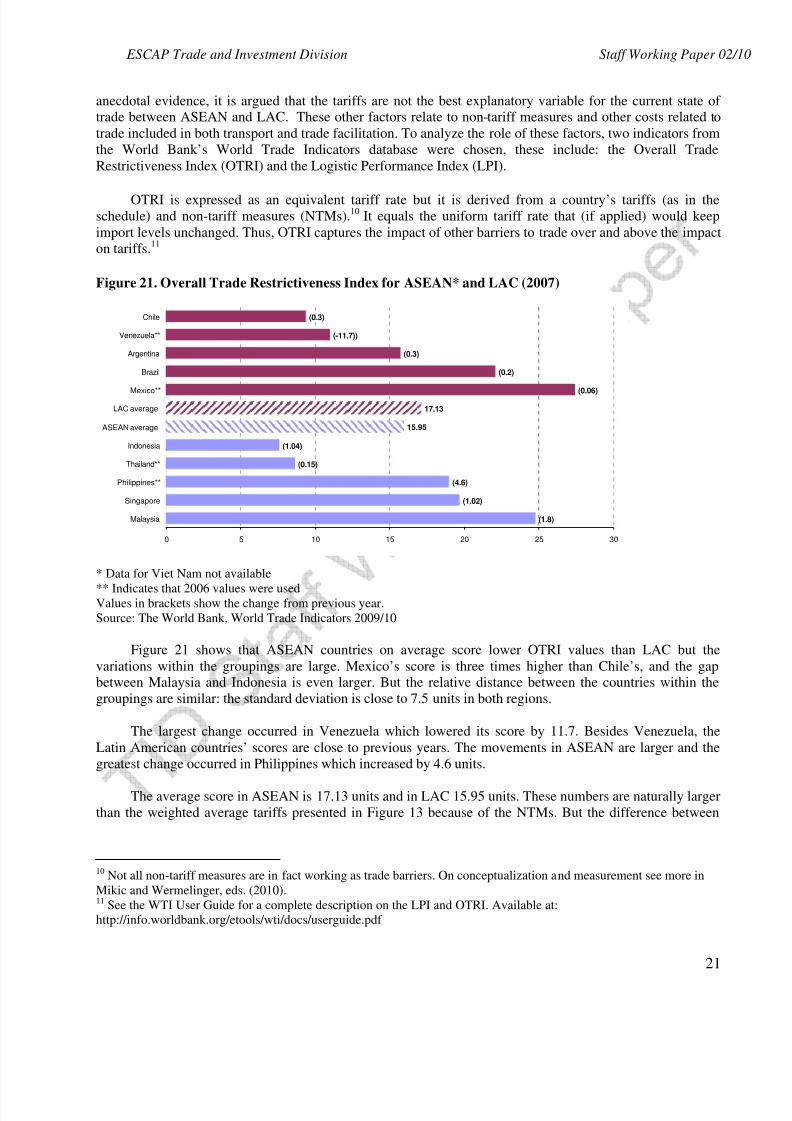
OTRI is expressed as an equivalent tariff rate but it is derived from a country’s tariffs (as in theschedule) and non-tariff measures (NTMs).10 It equals the uniform tariff rate that (if applied) would keep
import levels unchanged. Thus, OTRI captures the impact of other barriers to trade over and above the impact
on tariffs.11
Figure 21. Overall Trade Restrictiveness Index for ASEAN* and LAC (2007)
(-11.7))
(0.3)
15.95
17.13
(0.3)
(0.2)
(0.06)
(1.04)
(0.15)
(4.6)
(1.02)
(1.8)
0 5 10 15 20 25 30
Malaysia
Singapore
Philippines**
Thailand**
Indonesia
ASEAN average
LAC average
Mexico**
Brazil
Argentina
Venezuela**
Chile
* Data for Viet Nam not available
** Indicates that 2006 values were usedValues in brackets show the change from previous year.
Source: The World Bank, World Trade Indicators 2009/10 Figure 21 shows that ASEAN countries on average score lower OTRI values than LAC but the
variations within the groupings are large. Mexico’s score is three times higher than Chile’s, and the gapbetween Malaysia and Indonesia is even larger. But the relative distance between the countries within the
groupings are similar: the standard deviation is close to 7.5 units in both regions.
The largest change occurred in Venezuela which lowered its score by 11.7. Besides Venezuela, the
Latin American countries’ scores are close to previous years. The movements in ASEAN are larger and the
greatest change occurred in Philippines which increased by 4.6 units.
The average score in ASEAN is 17.13 units and in LAC 15.95 units. These numbers are naturally larger
than the weighted average tariffs presented in Figure 13 because of the NTMs. But the difference between
10 Not all non-tariff measures are in fact working as trade barriers. On conceptualization and measurement see more in
Mikic and Wermelinger, eds. (2010).11
See the WTI User Guide for a complete description on the LPI and OTRI. Available at:
http://info.worldbank.org/etools/wti/docs/userguide.pdf
8/6/2019 ONU-ESCAP Trade and Investment Division, Staff Working Paper 02/10 Examining the Potential for Cross-South Pac…
http://slidepdf.com/reader/full/onu-escap-trade-and-investment-division-staff-working-paper-0210-examining 22/33
ESCAP Trade and Investment Division Staff Working Paper 02/1
22
OTRI and the weighted average tariff is 7 in LAC and 14 in ASEAN. Thus, there are indications that NTMsare contributing to a higher extent in AESAN’s overall restrictiveness.
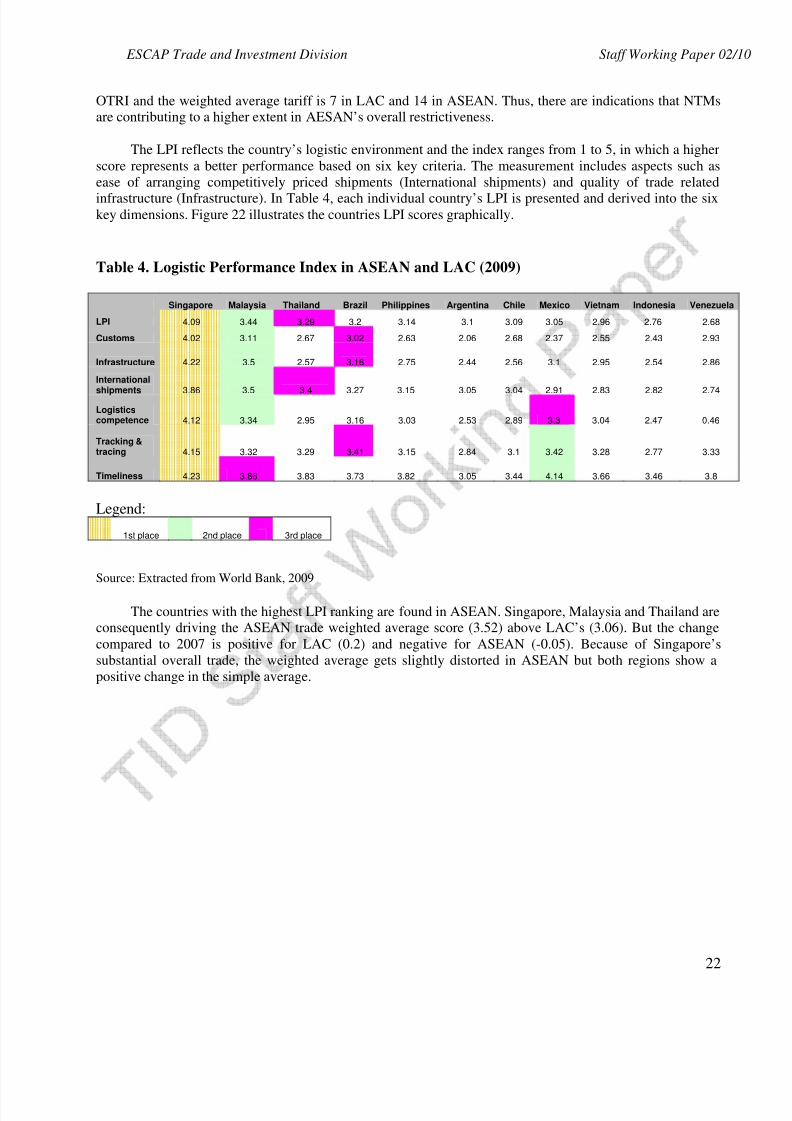
The LPI reflects the country’s logistic environment and the index ranges from 1 to 5, in which a higher
score represents a better performance based on six key criteria. The measurement includes aspects such as
ease of arranging competitively priced shipments (International shipments) and quality of trade related
infrastructure (Infrastructure). In Table 4, each individual country’s LPI is presented and derived into the sixkey dimensions. Figure 22 illustrates the countries LPI scores graphically.
Table 4. Logistic Performance Index in ASEAN and LAC (2009)
Singapore Malaysia Thailand Brazil Philippines Argentina Chile Mexico Vietnam Indonesia Venezuela
LPI 4.09 3.44 3.29 3.2 3.14 3.1 3.09 3.05 2.96 2.76 2.68
Customs 4.02 3.11 2.67 3.02 2.63 2.06 2.68 2.37 2.55 2.43 2.93
Infrastructure 4.22 3.5 2.57 3.16 2.75 2.44 2.56 3.1 2.95 2.54 2.86
International
shipments 3.86 3.5 3.4 3.27 3.15 3.05 3.04 2.91 2.83 2.82 2.74
Logisticscompetence 4.12 3.34 2.95 3.16 3.03 2.53 2.89 3.3 3.04 2.47 0.46
Tracking &tracing 4.15 3.32 3.29 3.41 3.15 2.84 3.1 3.42 3.28 2.77 3.33
Timeliness 4.23 3.86 3.83 3.73 3.82 3.05 3.44 4.14 3.66 3.46 3.8
Legend:
1st place 2nd place 3rd place
Source: Extracted from World Bank, 2009
The countries with the highest LPI ranking are found in ASEAN. Singapore, Malaysia and Thailand areconsequently driving the ASEAN trade weighted average score (3.52) above LAC’s (3.06). But the change
compared to 2007 is positive for LAC (0.2) and negative for ASEAN (-0.05). Because of Singapore’s
substantial overall trade, the weighted average gets slightly distorted in ASEAN but both regions show a
positive change in the simple average.
8/6/2019 ONU-ESCAP Trade and Investment Division, Staff Working Paper 02/10 Examining the Potential for Cross-South Pac…
http://slidepdf.com/reader/full/onu-escap-trade-and-investment-division-staff-working-paper-0210-examining 23/33
ESCAP Trade and Investment Division Staff Working Paper 02/1
23
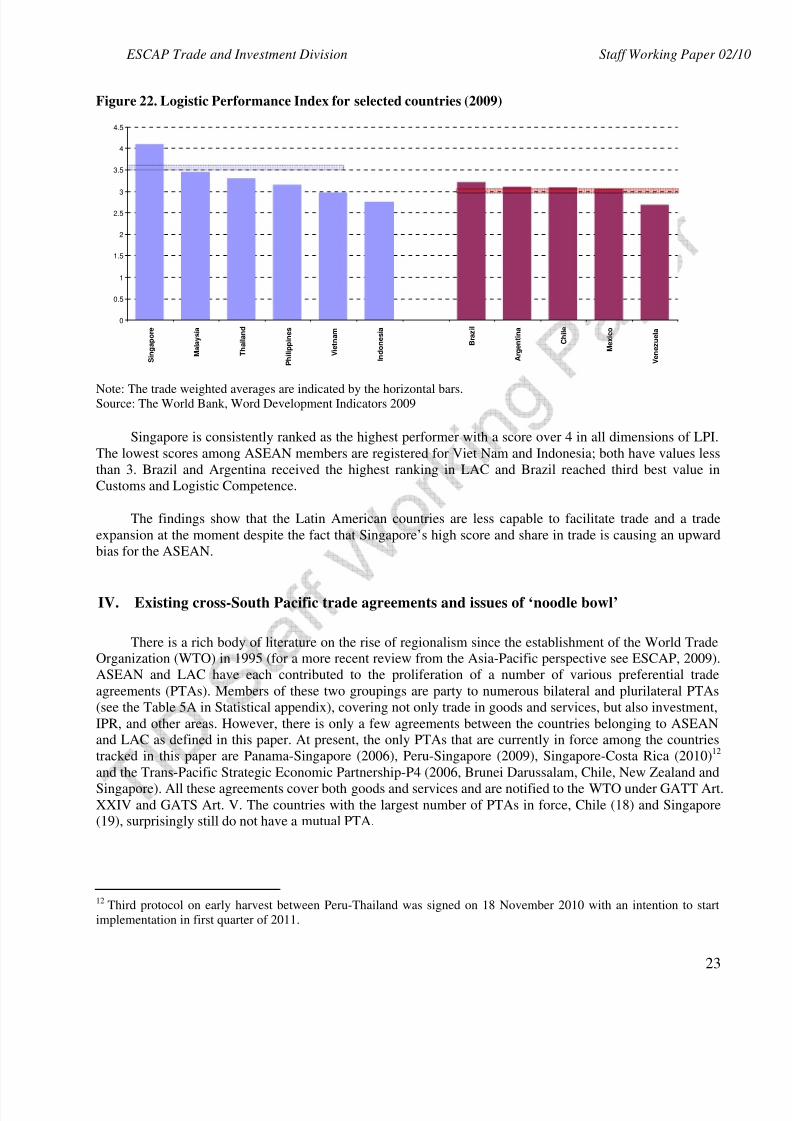
Figure 22. Logistic Performance Index for selected countries (2009)
0
0.5
1
1.5
2
2.5
3
3.5
4
4.5
S i n g a p o r e
M a l a y s i a
T h a i l a n d
P h i l i p p i n e s
V i e t n a m
I n d o n e s i a
B r a z i l
A r g e n t i n a
C h i l e
M e x i c o
V e n e z u e l a
Note: The trade weighted averages are indicated by the horizontal bars.Source: The World Bank, Word Development Indicators 2009
Singapore is consistently ranked as the highest performer with a score over 4 in all dimensions of LPI.
The lowest scores among ASEAN members are registered for Viet Nam and Indonesia; both have values less
than 3. Brazil and Argentina received the highest ranking in LAC and Brazil reached third best value in
Customs and Logistic Competence.
The findings show that the Latin American countries are less capable to facilitate trade and a trade
expansion at the moment despite the fact that Singapore’s high score and share in trade is causing an upward
bias for the ASEAN.
IV. Existing cross-South Pacific trade agreements and issues of ‘noodle bowl’
There is a rich body of literature on the rise of regionalism since the establishment of the World TradeOrganization (WTO) in 1995 (for a more recent review from the Asia-Pacific perspective see ESCAP, 2009).
ASEAN and LAC have each contributed to the proliferation of a number of various preferential trade
agreements (PTAs). Members of these two groupings are party to numerous bilateral and plurilateral PTAs
(see the Table 5A in Statistical appendix), covering not only trade in goods and services, but also investment,
IPR, and other areas. However, there is only a few agreements between the countries belonging to ASEANand LAC as defined in this paper. At present, the only PTAs that are currently in force among the countries
tracked in this paper are Panama-Singapore (2006), Peru-Singapore (2009), Singapore-Costa Rica (2010)12
and the Trans-Pacific Strategic Economic Partnership-P4 (2006, Brunei Darussalam, Chile, New Zealand and
Singapore). All these agreements cover both goods and services and are notified to the WTO under GATT Art.XXIV and GATS Art. V. The countries with the largest number of PTAs in force, Chile (18) and Singapore(19), surprisingly still do not have a mutual PTA.
12Third protocol on early harvest between Peru-Thailand was signed on 18 November 2010 with an intention to start
implementation in first quarter of 2011.
8/6/2019 ONU-ESCAP Trade and Investment Division, Staff Working Paper 02/10 Examining the Potential for Cross-South Pac…
http://slidepdf.com/reader/full/onu-escap-trade-and-investment-division-staff-working-paper-0210-examining 24/33
ESCAP Trade and Investment Division Staff Working Paper 02/1
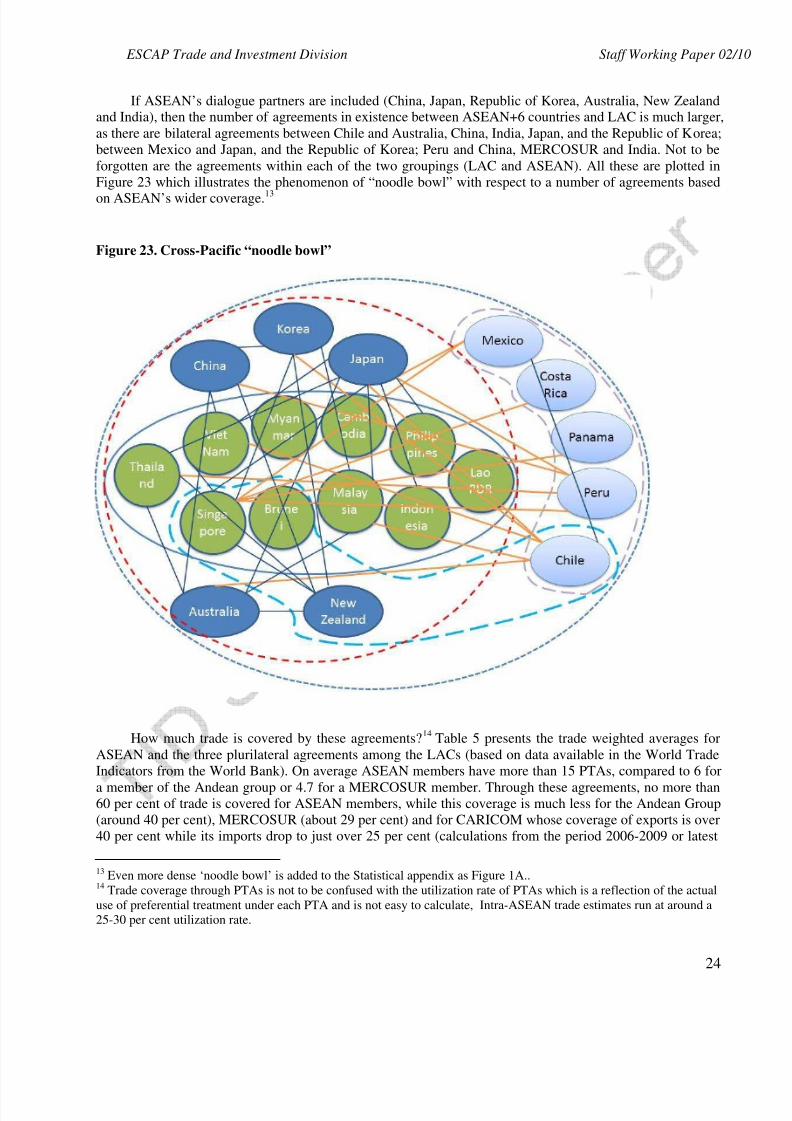
24
If ASEAN’s dialogue partners are included (China, Japan, Republic of Korea, Australia, New Zealandand India), then the number of agreements in existence between ASEAN+6 countries and LAC is much larger,
as there are bilateral agreements between Chile and Australia, China, India, Japan, and the Republic of Korea;
between Mexico and Japan, and the Republic of Korea; Peru and China, MERCOSUR and India. Not to be
forgotten are the agreements within each of the two groupings (LAC and ASEAN). All these are plotted in
Figure 23 which illustrates the phenomenon of “noodle bowl” with respect to a number of agreements based
on ASEAN’s wider coverage.13
Figure 23. Cross-Pacific “noodle bowl”
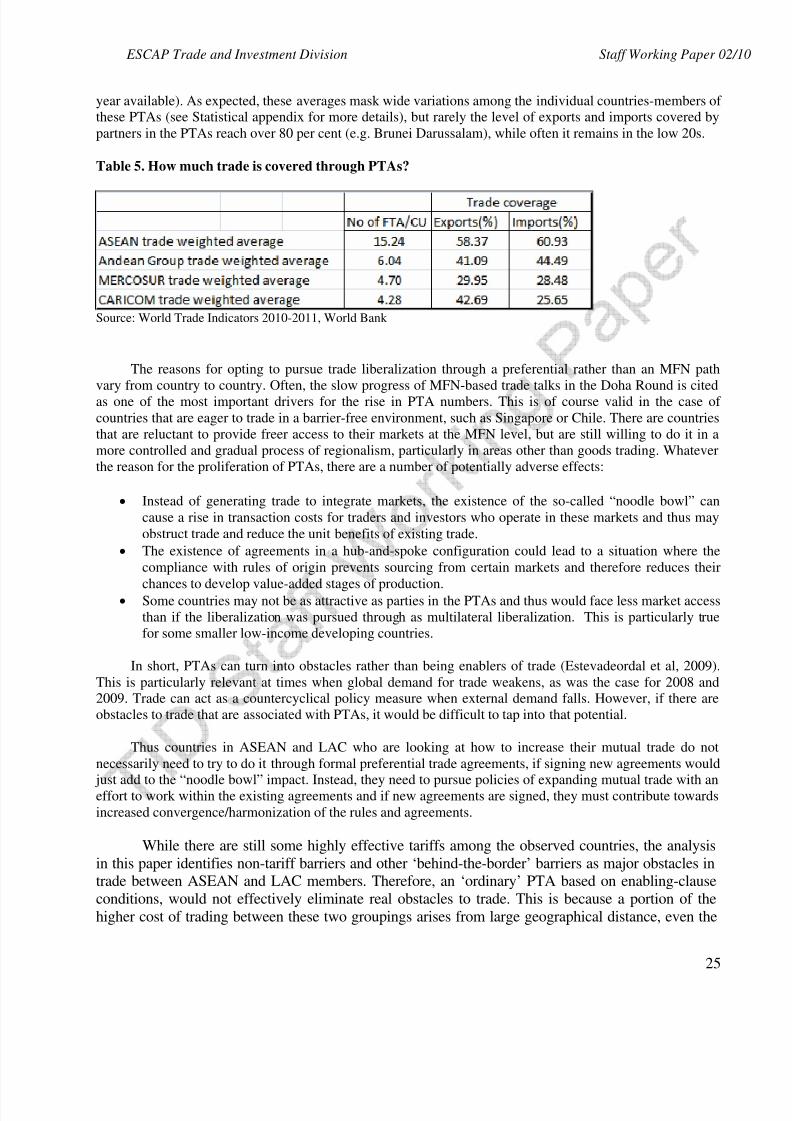
How much trade is covered by these agreements?14 Table 5 presents the trade weighted averages for
ASEAN and the three plurilateral agreements among the LACs (based on data available in the World Trade
Indicators from the World Bank). On average ASEAN members have more than 15 PTAs, compared to 6 for
a member of the Andean group or 4.7 for a MERCOSUR member. Through these agreements, no more than60 per cent of trade is covered for ASEAN members, while this coverage is much less for the Andean Group
(around 40 per cent), MERCOSUR (about 29 per cent) and for CARICOM whose coverage of exports is over
40 per cent while its imports drop to just over 25 per cent (calculations from the period 2006-2009 or latest
13 Even more dense ‘noodle bowl’ is added to the Statistical appendix as Figure 1A..14
Trade coverage through PTAs is not to be confused with the utilization rate of PTAs which is a reflection of the actual
use of preferential treatment under each PTA and is not easy to calculate, Intra-ASEAN trade estimates run at around a
25-30 per cent utilization rate.
8/6/2019 ONU-ESCAP Trade and Investment Division, Staff Working Paper 02/10 Examining the Potential for Cross-South Pac…
http://slidepdf.com/reader/full/onu-escap-trade-and-investment-division-staff-working-paper-0210-examining 25/33
ESCAP Trade and Investment Division Staff Working Paper 02/1
25
year available). As expected, these averages mask wide variations among the individual countries-members of these PTAs (see Statistical appendix for more details), but rarely the level of exports and imports covered by
partners in the PTAs reach over 80 per cent (e.g. Brunei Darussalam), while often it remains in the low 20s.
Table 5. How much trade is covered through PTAs?
Source: World Trade Indicators 2010-2011, World Bank
The reasons for opting to pursue trade liberalization through a preferential rather than an MFN path
vary from country to country. Often, the slow progress of MFN-based trade talks in the Doha Round is cited
as one of the most important drivers for the rise in PTA numbers. This is of course valid in the case of
countries that are eager to trade in a barrier-free environment, such as Singapore or Chile. There are countries
that are reluctant to provide freer access to their markets at the MFN level, but are still willing to do it in a
more controlled and gradual process of regionalism, particularly in areas other than goods trading. Whatever
the reason for the proliferation of PTAs, there are a number of potentially adverse effects:
• Instead of generating trade to integrate markets, the existence of the so-called “noodle bowl” can
cause a rise in transaction costs for traders and investors who operate in these markets and thus may
obstruct trade and reduce the unit benefits of existing trade.
• The existence of agreements in a hub-and-spoke configuration could lead to a situation where the
compliance with rules of origin prevents sourcing from certain markets and therefore reduces their
chances to develop value-added stages of production.• Some countries may not be as attractive as parties in the PTAs and thus would face less market access
than if the liberalization was pursued through as multilateral liberalization. This is particularly true
for some smaller low-income developing countries.
In short, PTAs can turn into obstacles rather than being enablers of trade (Estevadeordal et al, 2009).
This is particularly relevant at times when global demand for trade weakens, as was the case for 2008 and2009. Trade can act as a countercyclical policy measure when external demand falls. However, if there are
obstacles to trade that are associated with PTAs, it would be difficult to tap into that potential.
Thus countries in ASEAN and LAC who are looking at how to increase their mutual trade do not
necessarily need to try to do it through formal preferential trade agreements, if signing new agreements would
just add to the “noodle bowl” impact. Instead, they need to pursue policies of expanding mutual trade with aneffort to work within the existing agreements and if new agreements are signed, they must contribute towards
increased convergence/harmonization of the rules and agreements.
While there are still some highly effective tariffs among the observed countries, the analysis
in this paper identifies non-tariff barriers and other ‘behind-the-border’ barriers as major obstacles intrade between ASEAN and LAC members. Therefore, an ‘ordinary’ PTA based on enabling-clause
conditions, would not effectively eliminate real obstacles to trade. This is because a portion of the
higher cost of trading between these two groupings arises from large geographical distance, even the
8/6/2019 ONU-ESCAP Trade and Investment Division, Staff Working Paper 02/10 Examining the Potential for Cross-South Pac…
http://slidepdf.com/reader/full/onu-escap-trade-and-investment-division-staff-working-paper-0210-examining 26/33
ESCAP Trade and Investment Division Staff Working Paper 02/1
26
most sophisticated and advanced agreements will not be able to remove that natural obstacle.
Notwithstanding that, there are many untapped areas of collaboration which can be furtherdeveloped by making sure that the most obvious trade barriers, such as tariffs, tariff-rate quotas and
other QRs are eliminated. With an increased volume of trade, there will also be some positive
externalities arising from better knowledge of the markets and their demands, and lower costs of
trading that can reinforce production specialization benefiting both sides.
V. Conclusions
ASEAN countries have learned an important lesson in the aftermath of the Asian financial crisis,
specifically when regional cooperation is working towards enabling trade it could act as a countercyclical
policy. Therefore when the latest global economic crisis hit the region, and countries in this region lost their
important exporting markets, an increase of trade within the region was equally as important as the
introduction of packages to stimulate domestic demand. Moreover, in contrast to the situation in the late1990s, the developing countries globally were experiencing a lesser fall in their GDPs opening potential for
more intensive South-South trade and investment. In fact, Latin American economies on average have been
posting admirable growth rates, for example Peru’s growth rate projections show an increase from 2.95 percent in 2000 to 8.2 per cent in 2010, while Panama is projected to increase from 2.7 per cent in 2000 to 6.2
per cent in 2010 (International Monitory Fund, 2010). However, while this relatively vibrant growth mayindicate potential for new trade, factors such as lack of knowledge of each other’s’ markets, lack of ‘social
capital’ between the traders, no established financial channels and guarantees, geographical, linguistic,
cultural and other distances, all played a role in limiting possibilities for expanding trade between ASEAN
and LAC.
To increase trade between the ASEAN and LAC from the current low level, much more than “politicalwill” is needed. As trade is done by firms, it is firms that need to recognize that there are positive returns from
trade (and investment) across the south-Pacific. Obviously environments in which firms have to do business
matter, as do barriers that exist on and behind the border. Governments of countries on both sides of thePacific should share best practices on domestic reforms and supporting policies to create predictable and
stable environments for firms operating in the production of goods and provision of services, irrespective of their national origins. This includes a cooperation and coordination between governments on introducing
cross-regional standards on regulatory measures, quality control measures, and also the removal of border and
behind-the-border barriers. Whether this is done on a reciprocal basis through a contractual arrangement (such
as trade and other inter-governmental agreements) or in a less formal way (based on business association
agreements), is a matter of decision and must be based on further impact analysis of such agreements. As
established in the literature, high transport costs and weak logistics are undermining trade potential. This
needs to be addressed through infrastructural investments but also through sharing of experiences - some of
the best performers in logistics come from ASEAN. Most importantly, the gap in knowledge about each
other’s regions characteristics and needs should be closed by investing in more people-to-people contacts
through university and professional exchanges, business trips, organization of business and cultural fairs, andthrough formalizing some joint projects co-funded by governments on both sides. Opportunities for beneficial
cooperation between the two regions abound and they should not be left unused for much longer.
8/6/2019 ONU-ESCAP Trade and Investment Division, Staff Working Paper 02/10 Examining the Potential for Cross-South Pac…
http://slidepdf.com/reader/full/onu-escap-trade-and-investment-division-staff-working-paper-0210-examining 27/33
ESCAP Trade and Investment Division Staff Working Paper 02/1
27
VI. List of references
Economic and Social Commission for Asia and the Pacific (ESCAP), 2009. Asia-Pacific Trade and
Investment Report 2009. Bangkok: ESCAP.
Economic Commission for Latin America and the Caribbean (ECLAC), 2008a. Opportunities for Trade and Investment between Latin America and the Asia Pacific: The Link with APEC . Santiago: ECLAC,
November.
Economic Commission for Latin America and the Caribbean (ECLAC), 2008b. The Latin American Pacific
Basin Initiative and the Asia-Pacific Region, Santiago: ECLAC, October.
Economic Commission for Latin America and the Caribbean (ECLAC), 2007. Latin America and the
Caribbean in the World Economy, 2008 Trends, Santiago: ECLAC.
Estevadeordal, A. and K. Suominen with J. T. Harris and M. Shearer, 2009. Bridging Regional Trade
Agreements in the Americas Special Report on Integration and Trade, Inter-American Development
Bank.
International Monetary Fund, 2010. Online “World Economic Outlook Database, October 2010.”
Medalla, E. and J. Balboa, 2009. “Prospects for Regional Cooperation between Latin America and
Caribbean and Asia Pacific: Perspective from East Asia” presentation at Fifth LAEBA Conference,
Singapore, 15 July.
Mikic, M. and J. Gilbert, 2009. Trade Statistics in Policymaking – A Handbook of Commonly Used Trade
Indices and indicators (Revised edition), Bangkok: ESCAP.
Mikic, M. and M. Wermelinger (eds.), 2010. Rising of non-tariff protectionism and crisis recovery, Bangkok;
ESCAP.
World Bank, 2009. The World Trade Indicators On-line database, Washington, D.C.: The World Bank.
World Trade Organization (WTO), 2008 “Factual Presentation: Trans-Pacific Strategic Economics
Partnership Agreement between Brunei Darussalam, Chile, New Zealand and Singapore (Goods and
services)”, report by the Secretariat, WT/REG229/1, 9 May.
8/6/2019 ONU-ESCAP Trade and Investment Division, Staff Working Paper 02/10 Examining the Potential for Cross-South Pac…
http://slidepdf.com/reader/full/onu-escap-trade-and-investment-division-staff-working-paper-0210-examining 28/33
ESCAP Trade and Investment Division Staff Working Paper 02/1
28
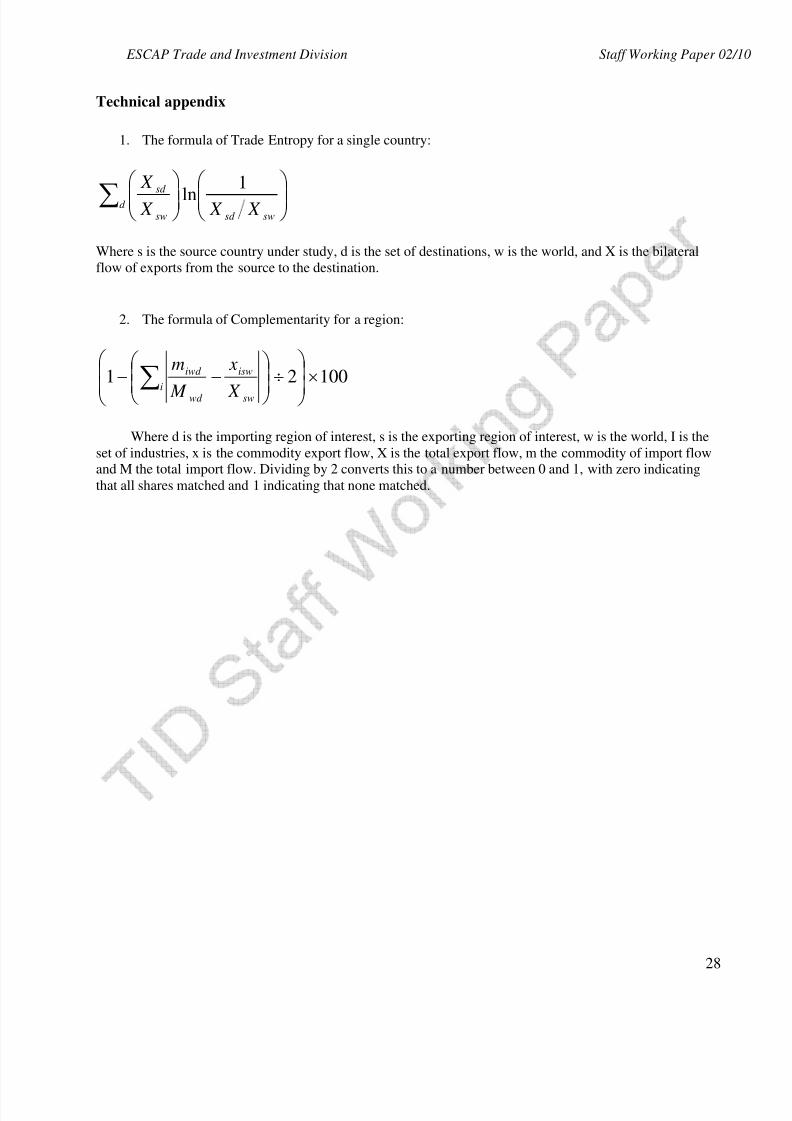
Technical appendix
1. The formula of Trade Entropy for a single country:
∑ swsd d
sw
sd
X X X
X 1ln
Where s is the source country under study, d is the set of destinations, w is the world, and X is the bilateral
flow of exports from the source to the destination.
2. The formula of Complementarity for a region:
10021 ×
÷
−− ∑i
sw
isw
wd
iwd
X
x
M
m
Where d is the importing region of interest, s is the exporting region of interest, w is the world, I is the
set of industries, x is the commodity export flow, X is the total export flow, m the commodity of import flowand M the total import flow. Dividing by 2 converts this to a number between 0 and 1, with zero indicating
that all shares matched and 1 indicating that none matched.
8/6/2019 ONU-ESCAP Trade and Investment Division, Staff Working Paper 02/10 Examining the Potential for Cross-South Pac…
http://slidepdf.com/reader/full/onu-escap-trade-and-investment-division-staff-working-paper-0210-examining 29/33
ESCAP Trade and Investment Division Staff Working Paper 02/1
29
Statistical appendix
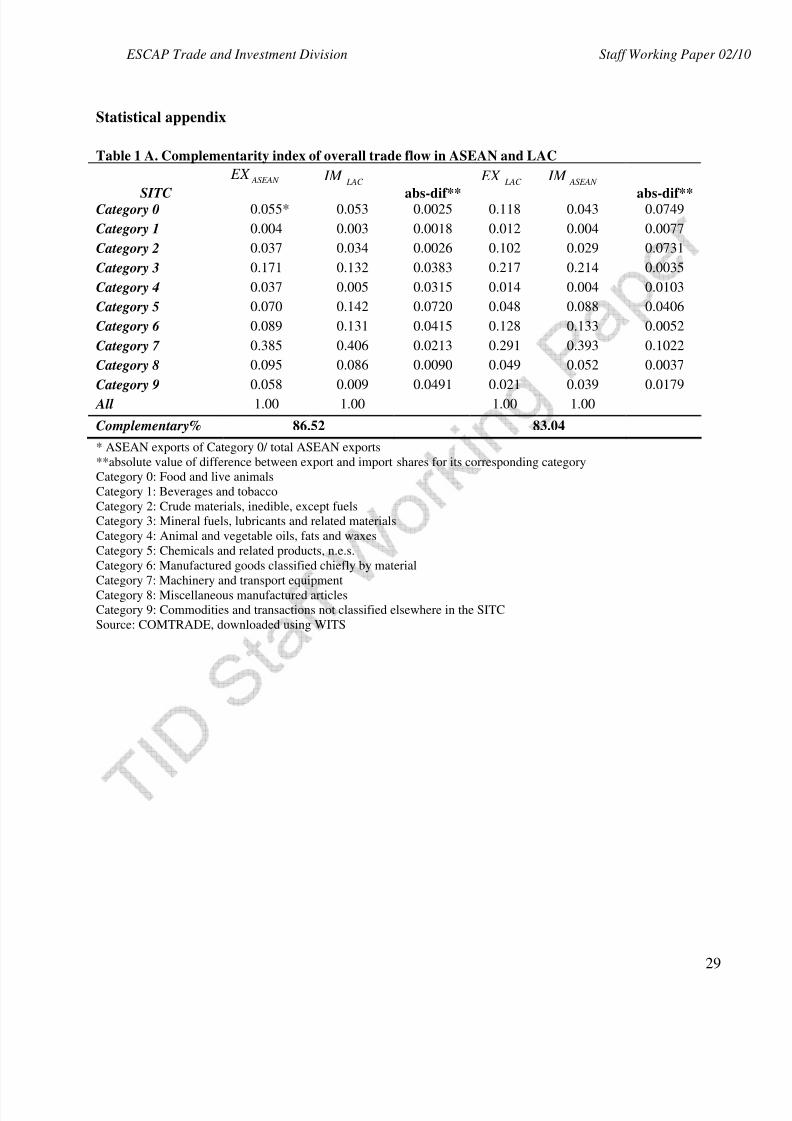
Table 1 A. Complementarity index of overall trade flow in ASEAN and LAC
SITC abs-dif** abs-dif** Category 0 0.055* 0.053 0.0025 0.118 0.043 0.0749
Category 1 0.004 0.003 0.0018 0.012 0.004 0.0077
Category 2 0.037 0.034 0.0026 0.102 0.029 0.0731
Category 3 0.171 0.132 0.0383 0.217 0.214 0.0035
Category 4 0.037 0.005 0.0315 0.014 0.004 0.0103
Category 5 0.070 0.142 0.0720 0.048 0.088 0.0406
Category 6 0.089 0.131 0.0415 0.128 0.133 0.0052
Category 7 0.385 0.406 0.0213 0.291 0.393 0.1022
Category 8 0.095 0.086 0.0090 0.049 0.052 0.0037
Category 9 0.058 0.009 0.0491 0.021 0.039 0.0179
All 1.00 1.00 1.00 1.00
Complementary% 86.52 83.04
* ASEAN exports of Category 0/ total ASEAN exports
**absolute value of difference between export and import shares for its corresponding category
Category 0: Food and live animals
Category 1: Beverages and tobacco
Category 2: Crude materials, inedible, except fuels
Category 3: Mineral fuels, lubricants and related materials
Category 4: Animal and vegetable oils, fats and waxes
Category 5: Chemicals and related products, n.e.s.
Category 6: Manufactured goods classified chiefly by material
Category 7: Machinery and transport equipment
Category 8: Miscellaneous manufactured articles
Category 9: Commodities and transactions not classified elsewhere in the SITC
Source: COMTRADE, downloaded using WITS
ASEAN EX LAC IM LAC EX ASEAN IM
8/6/2019 ONU-ESCAP Trade and Investment Division, Staff Working Paper 02/10 Examining the Potential for Cross-South Pac…
http://slidepdf.com/reader/full/onu-escap-trade-and-investment-division-staff-working-paper-0210-examining 30/33
ESCAP Trade and Investment Division Staff Working Paper 02/1
30
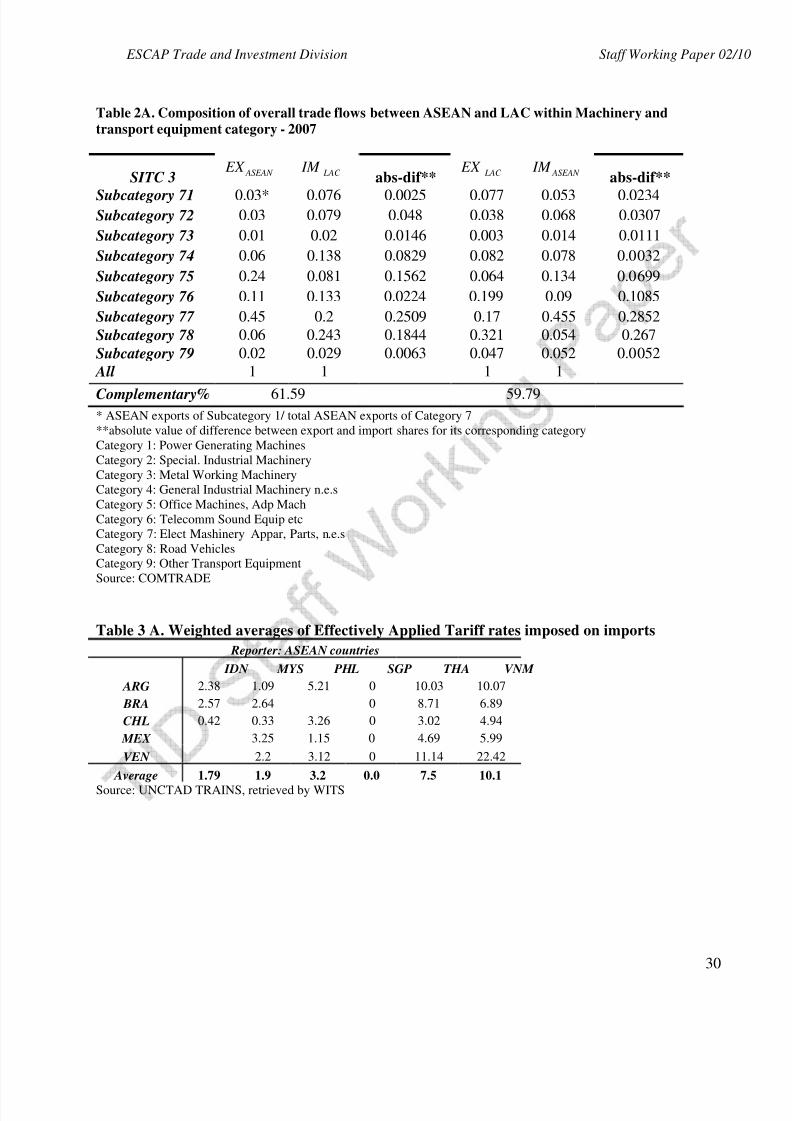
Table 2A. Composition of overall trade flows between ASEAN and LAC within Machinery and
transport equipment category - 2007
SITC 3 abs-dif** abs-dif**
Subcategory 71 0.03* 0.076 0.0025 0.077 0.053 0.0234Subcategory 72 0.03 0.079 0.048 0.038 0.068 0.0307
Subcategory 73 0.01 0.02 0.0146 0.003 0.014 0.0111
Subcategory 74 0.06 0.138 0.0829 0.082 0.078 0.0032
Subcategory 75 0.24 0.081 0.1562 0.064 0.134 0.0699
Subcategory 76 0.11 0.133 0.0224 0.199 0.09 0.1085
Subcategory 77 0.45 0.2 0.2509 0.17 0.455 0.2852
Subcategory 78 0.06 0.243 0.1844 0.321 0.054 0.267
Subcategory 79 0.02 0.029 0.0063 0.047 0.052 0.0052
All 1 1 1 1
Complementary% 61.59 59.79* ASEAN exports of Subcategory 1/ total ASEAN exports of Category 7
**absolute value of difference between export and import shares for its corresponding category
Category 1: Power Generating Machines
Category 2: Special. Industrial Machinery
Category 3: Metal Working Machinery
Category 4: General Industrial Machinery n.e.s
Category 5: Office Machines, Adp Mach
Category 6: Telecomm Sound Equip etc
Category 7: Elect Mashinery Appar, Parts, n.e.s
Category 8: Road Vehicles
Category 9: Other Transport Equipment
Source: COMTRADE
Table 3 A. Weighted averages of Effectively Applied Tariff rates imposed on imports
Reporter: ASEAN countries
IDN MYS PHL SGP THA VNM
ARG 2.38 1.09 5.21 0 10.03 10.07
BRA 2.57 2.64 0 8.71 6.89
CHL 0.42 0.33 3.26 0 3.02 4.94
MEX 3.25 1.15 0 4.69 5.99
VEN 2.2 3.12 0 11.14 22.42
Average 1.79 1.9 3.2 0.0 7.5 10.1
Source: UNCTAD TRAINS, retrieved by WITS
ASEAN EX LAC IM LAC EX ASEAN IM
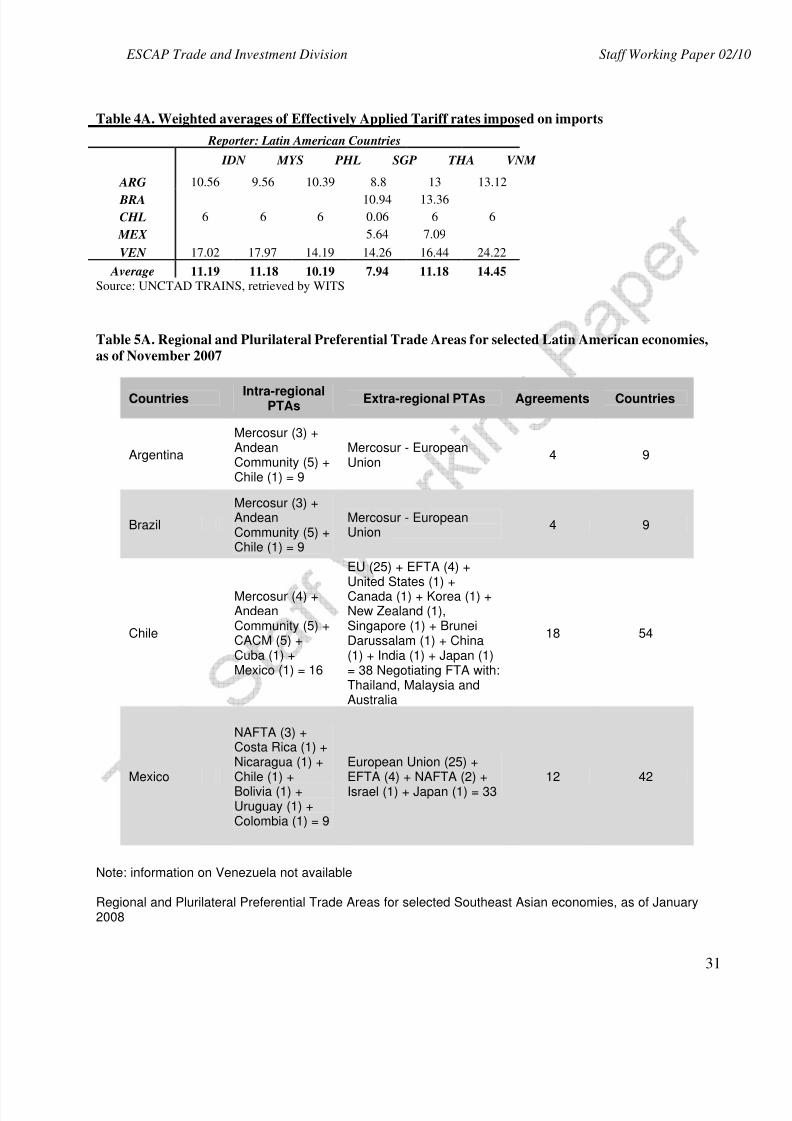
8/6/2019 ONU-ESCAP Trade and Investment Division, Staff Working Paper 02/10 Examining the Potential for Cross-South Pac…
http://slidepdf.com/reader/full/onu-escap-trade-and-investment-division-staff-working-paper-0210-examining 31/33
ESCAP Trade and Investment Division Staff Working Paper 02/1
31
Table 4A. Weighted averages of Effectively Applied Tariff rates imposed on imports
Reporter: Latin American Countries
IDN MYS PHL SGP THA VNM
ARG 10.56 9.56 10.39 8.8 13 13.12
BRA 10.94 13.36
CHL 6 6 6 0.06 6 6
MEX 5.64 7.09
VEN 17.02 17.97 14.19 14.26 16.44 24.22
Average 11.19 11.18 10.19 7.94 11.18 14.45Source: UNCTAD TRAINS, retrieved by WITS
Table 5A. Regional and Plurilateral Preferential Trade Areas for selected Latin American economies,
as of November 2007
Countries Intra-regionalPTAs
Extra-regional PTAs Agreements Countries
Argentina
Mercosur (3) +AndeanCommunity (5) +Chile (1) = 9
Mercosur - EuropeanUnion
4 9
Brazil
Mercosur (3) +AndeanCommunity (5) +Chile (1) = 9
Mercosur - EuropeanUnion
4 9
Chile
Mercosur (4) +AndeanCommunity (5) +CACM (5) +Cuba (1) +Mexico (1) = 16
EU (25) + EFTA (4) +United States (1) +Canada (1) + Korea (1) +New Zealand (1),Singapore (1) + BruneiDarussalam (1) + China(1) + India (1) + Japan (1)= 38 Negotiating FTA with:Thailand, Malaysia andAustralia
18 54
Mexico
NAFTA (3) +Costa Rica (1) +Nicaragua (1) +Chile (1) +Bolivia (1) +Uruguay (1) +Colombia (1) = 9
European Union (25) +EFTA (4) + NAFTA (2) +Israel (1) + Japan (1) = 33
12 42
Note: information on Venezuela not available
Regional and Plurilateral Preferential Trade Areas for selected Southeast Asian economies, as of January2008
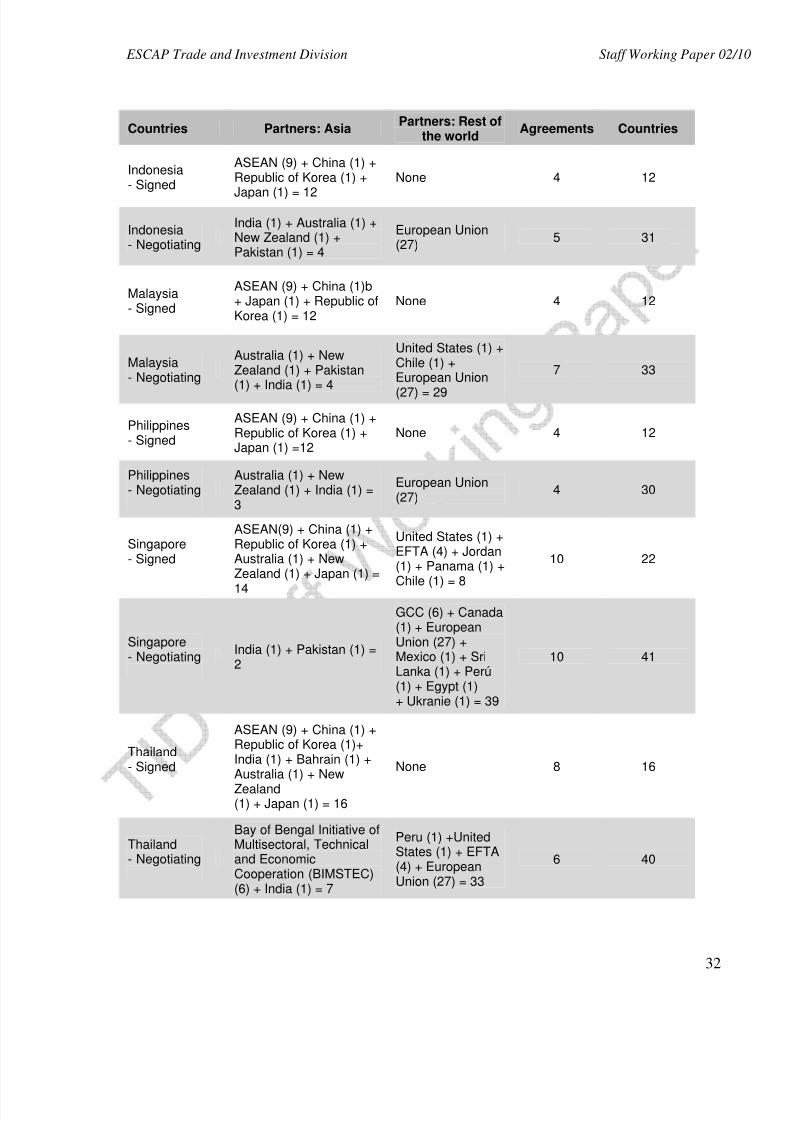
8/6/2019 ONU-ESCAP Trade and Investment Division, Staff Working Paper 02/10 Examining the Potential for Cross-South Pac…
http://slidepdf.com/reader/full/onu-escap-trade-and-investment-division-staff-working-paper-0210-examining 32/33
ESCAP Trade and Investment Division Staff Working Paper 02/1
32
Countries Partners: AsiaPartners: Rest of
the worldAgreements Countries
Indonesia- Signed
ASEAN (9) + China (1) +Republic of Korea (1) +
Japan (1) = 12
None 4 12
Indonesia- Negotiating
India (1) + Australia (1) +New Zealand (1) +Pakistan (1) = 4
European Union(27)
5 31
Malaysia- Signed
ASEAN (9) + China (1)b+ Japan (1) + Republic ofKorea (1) = 12
None 4 12
Malaysia- Negotiating
Australia (1) + NewZealand (1) + Pakistan(1) + India (1) = 4
United States (1) +Chile (1) +European Union
(27) = 29
7 33
Philippines- Signed
ASEAN (9) + China (1) +Republic of Korea (1) +Japan (1) =12
None 4 12
Philippines- Negotiating
Australia (1) + NewZealand (1) + India (1) =3
European Union(27)
4 30
Singapore- Signed
ASEAN(9) + China (1) +Republic of Korea (1) +Australia (1) + NewZealand (1) + Japan (1) =
14
United States (1) +EFTA (4) + Jordan(1) + Panama (1) +Chile (1) = 8
10 22
Singapore- Negotiating
India (1) + Pakistan (1) =2
GCC (6) + Canada(1) + EuropeanUnion (27) +Mexico (1) + SriLanka (1) + Perú(1) + Egypt (1)+ Ukranie (1) = 39
10 41
Thailand- Signed
ASEAN (9) + China (1) +Republic of Korea (1)+India (1) + Bahrain (1) +Australia (1) + New
Zealand(1) + Japan (1) = 16
None 8 16
Thailand- Negotiating
Bay of Bengal Initiative ofMultisectoral, Technicaland EconomicCooperation (BIMSTEC)(6) + India (1) = 7
Peru (1) +UnitedStates (1) + EFTA(4) + EuropeanUnion (27) = 33
6 40
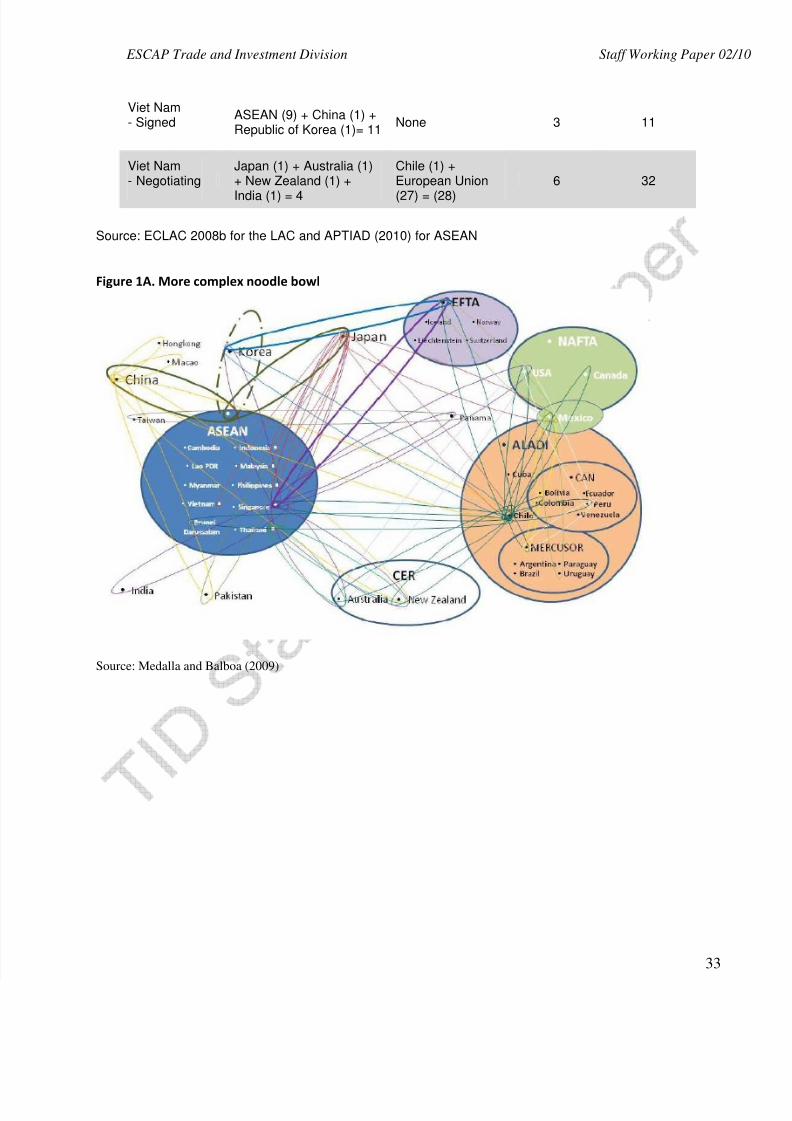
8/6/2019 ONU-ESCAP Trade and Investment Division, Staff Working Paper 02/10 Examining the Potential for Cross-South Pac…
http://slidepdf.com/reader/full/onu-escap-trade-and-investment-division-staff-working-paper-0210-examining 33/33
ESCAP Trade and Investment Division Staff Working Paper 02/1
Viet Nam- Signed
ASEAN (9) + China (1) +Republic of Korea (1)= 11
None 3 11
Viet Nam- Negotiating
Japan (1) + Australia (1)+ New Zealand (1) +
India (1) = 4
Chile (1) +European Union
(27) = (28)
6 32
Source: ECLAC 2008b for the LAC and APTIAD (2010) for ASEAN
Figure 1A. More complex noodle bowl
Source: Medalla and Balboa (2009)