Embed Size (px)
Citation preview

ONTARIO TOGETHER2021 PROGRESS REPORT ON IMPLEMENTATION OF THE
TRANSFORMATIVE CLIMATE COMMUNITIES PROGRAM GRANT

2 | Ontario Together: 2021 Progress Report on Implementation of the TCC Grant
AcknowledgmentsAcknowledgmentsPrepared by the UCLA Luskin Center for InnovationPrincipal Investigator: J.R. DeShazo, Ph.D.Co-Principal Investigator: William Eisenstein, Ph.D.Researchers: Silvia González, Jason Karpman, Bo Liu, Britta McOmber, and Kelly TrumbullEditor: Colleen Callahan
Prepared forCalifornia Strategic Growth Council (SGC) (Contract Number: SGC18124)
Report PeriodOntario Together award date (January 2018) through the end of month 16 of implementation (June 2020)
AcknowledgmentsWe thank SGC for commissioning the UCLA Luskin Center for Innovation to conduct a five-year, third-party evaluation of Transformative Climate Communities Program (TCC) investments in Ontario. In particular, we thank Louise Bedsworth, Alexandra Gallo, Sandra Lupien, Saharnaz Mirzazad, Gerard Rivero, and Sophie Young for their commitment to our work, and for their attention to our many informational requests.
In addition to our state partners at SGC, we’d also like to thank our partners at the California Department of Conserva-tion — namely, Brendan Pipkin, Elizabeth Hessom, and Sydney Mathis — for reviewing the accuracy of TCC background information provided in this report.
This report would also not have been possible without the support of a team of skilled undergraduate and graduate student researchers who helped with data collection, analysis, writing, editing, and document design. Specifically, we would like to recognize Deanna Cunningham, Emma French, Elena Hernández, Bo Liu, Sharon Sand, and Deja Thomas for their work on this document.
We owe a great deal of gratitude to Nick Cuccia for his copy editing and design support.
We would also like to thank Bruce Mirken, Alvaro Sanchez, and Emi Wang at the Greenlining Institute for their thoughtful input on how to structure the content contained in this report.
Moreover, a big thank you to all of the Ontario Together project partners for sharing so much primary data with the eval-uation team, as well as reviewing the content within this report for accuracy.
Finally and importantly, the authors also acknowledge the Gabrielino and Tongva peoples as the traditional land caretak-ers of Tovaangar (Los Angeles basin, Southern Channel Islands), and recognize that their displacement has enabled the flourishing of UCLA.
DisclaimerThe UCLA Luskin Center for Innovation appreciates the contributions of the aforementioned agencies. This report, how-ever, does not necessarily reflect their views nor does it serve as an endorsement of findings. Any errors are those of the authors.
For More Informationwww.innovation.luskin.ucla.edu
Cover image: Construction of Vista Verde Apartments, a 101-unit affordable housing project located in Ontario and funded by TCC, in April 2020 (Photo credit: Aero Cine Pros Inc.)
© May 20, 2021 by the Regents of the University of California, Los Angeles. All rights reserved.

Ontario Together: 2021 Progress Report on Implementation of the TCC Grant | 3
Table of ContentsTable of Contents EXECUTIVE SUMMARY ���������������������������������������������������������������������������������������������������������������������������������������������������������������������������������������������������������������������������������4
Ontario Today ��������������������������������������������������������������������������������������������������������������������������������������������������������������������������������������������������������������������������������������� 5Ontario Together ������������������������������������������������������������������������������������������������������������������������������������������������������������������������������������������������������������������������������� 5Projects ����������������������������������������������������������������������������������������������������������������������������������������������������������������������������������������������������������������������������������������������������� 6Transformative Plans ����������������������������������������������������������������������������������������������������������������������������������������������������������������������������������������������������������������������� 7Anticipated Benefits ������������������������������������������������������������������������������������������������������������������������������������������������������������������������������������������������������������������������ 8Cumulative Accomplishments �������������������������������������������������������������������������������������������������������������������������������������������������������������������������������������������������� 9Operationalized Transformative Plans ����������������������������������������������������������������������������������������������������������������������������������������������������������������������������10
BACKGROUND �����������������������������������������������������������������������������������������������������������������������������������������������������������������������������������������������������������������������������������������������������13The Vision Behind TCC �����������������������������������������������������������������������������������������������������������������������������������������������������������������������������������������������������������������13Evaluating the Impacts of TCC ����������������������������������������������������������������������������������������������������������������������������������������������������������������������������������������������16Ontario Together: Looking Back and Forward ������������������������������������������������������������������������������������������������������������������������������������������������������������19
PROFILES: TRANSFORMATIVE PLANS �������������������������������������������������������������������������������������������������������������������������������������������������������������������������������������21Community Engagement Plan������������������������������������������������������������������������������������������������������������������������������������������������������������������������������������������������22
Stories From the Community: Grassroots model empowers residents to serve as local leaders ������������������������������������������24Displacement Avoidance Plan ������������������������������������������������������������������������������������������������������������������������������������������������������������������������������������������������26Workforce Development Plan ������������������������������������������������������������������������������������������������������������������������������������������������������������������������������������������������28
PROFILES: TCC FUNDED PROJECTS ���������������������������������������������������������������������������������������������������������������������������������������������������������������������������������������������31Active Transportation Projects ���������������������������������������������������������������������������������������������������������������������������������������������������������������������������������������������31Affordable Housing and Sustainable Communities Project �������������������������������������������������������������������������������������������������������������������������������33Organics Recycling Project ������������������������������������������������������������������������������������������������������������������������������������������������������������������������������������������������������35Rooftop Solar Projects �����������������������������������������������������������������������������������������������������������������������������������������������������������������������������������������������������������������37Transit Operations Project ��������������������������������������������������������������������������������������������������������������������������������������������������������������������������������������������������������39Urban and Community Forestry Project ��������������������������������������������������������������������������������������������������������������������������������������������������������������������������41
PROFILES: LEVERAGED PROJECTS ����������������������������������������������������������������������������������������������������������������������������������������������������������������������������������������������43Healthy Ontario Initiative ���������������������������������������������������������������������������������������������������������������������������������������������������������������������������������������������������������44
Stories From the Community: Initiative inspires residents to get well and give back �����������������������������������������������������������������46Small Business Support Program ������������������������������������������������������������������������������������������������������������������������������������������������������������������������������������������48
Stories From the Community: Business incubator program provides community and inspiration �������������������������������������50
APPENDICES ���������������������������������������������������������������������������������������������������������������������������������������������������������������������������������������������������������������������������������������������������������52Appendix 1: Supplemental Maps �������������������������������������������������������������������������������������������������������������������������������������������������������������������������������������������52Appendix 2: Summary of Methods for Estimating Project Benefits �������������������������������������������������������������������������������������������������������������54Appendix 3: Ontario Together Trustees �������������������������������������������������������������������������������������������������������������������������������������������������������������������������55Appendix 4: Ontario Together TCC Census Tracts �����������������������������������������������������������������������������������������������������������������������������������������������������������56Appendix 5: Ontario Together Control Census Tracts �������������������������������������������������������������������������������������������������������������������������������������������57Appendix 6: Indicator Data�������������������������������������������������������������������������������������������������������������������������������������������������������������������������������������������������������58
Appendix 6.1: Demographics �������������������������������������������������������������������������������������������������������������������������������������������������������������������������������������������58Appendix 6.2: Economy ������������������������������������������������������������������������������������������������������������������������������������������������������������������������������������������������������62Appendix 6.3: Energy ������������������������������������������������������������������������������������������������������������������������������������������������������������������������������������������������������������64Appendix 6.4: Environment ����������������������������������������������������������������������������������������������������������������������������������������������������������������������������������������������66Appendix 6.5: Health�������������������������������������������������������������������������������������������������������������������������������������������������������������������������������������������������������������67Appendix 6.6: Housing ���������������������������������������������������������������������������������������������������������������������������������������������������������������������������������������������������������71Appendix 6.7: Transportation ������������������������������������������������������������������������������������������������������������������������������������������������������������������������������������������75

4 | Ontario Together: 2021 Progress Report on Implementation of the TCC Grant
THE TRANSFORMATIVE CLIMATE COMMUNITIES PROGRAM
(TCC) is an innovative, new investment in community-scale cli-
mate action, with potentially broad implications. Launched in 2017
by the California State Legislature, TCC funds the implementation
of neighborhood-level transformative plans that include multiple
coordinated projects to reduce greenhouse gas (GHG) emissions.
The program is also designed to provide an array of local economic,
environmental, and health benefits to disadvantaged communities,
while minimizing the risk of displacement. TCC empowers the
communities most impacted by pollution to choose their own goals,
strategies, and projects to enact transformational change — all with
data-driven milestones and measurable outcomes.
The California Strategic Growth Council (SGC) serves as the lead ad-
ministrator of TCC. During the first round of the program, and through
a competitive process, SGC awarded multimillion-dollar grants to the
City of Fresno ($66.5 million), the Watts Neighborhood of Los Angeles
($33.25 million), and the City of Ontario ($33.25 million). During the
second round, SGC awarded the City of Sacramento ($23 million) and
Pacoima, the Northeast San Fernando Valley neighborhood of Los An-
geles ($23 million). And during the third and most recent round, SGC
awarded the City of Oakland ($28.2 million), the City of Riverside ($9.1
million), and the City of Stockton ($10.8 million).
The UCLA Luskin Center for Innovation (LCI) serves as the lead eval-
uator for all three Round 1 sites, one Round 2 site (Northeast San
Fernando Valley), and one Round 3 site (Stockton). LCI researchers are
working with the these communities to document their progress and
evaluate the impacts of TCC investments.
This progress report is the second in a series of five that will provide an
overview of the key accomplishments and estimated benefits of TCC
funded activities in Ontario, collectively referred to as Ontario Togeth-
er.1 This specific report documents progress through the end of FY
2019-20, which overlaps with about 16 months of program implemen-
tation (March 2019 through June 2020) and the first four months of
the COVID-19 pandemic. Project partners’ responses to the pandemic
are highlighted throughout the report.
1 For annual reports that document TCC investments in Fresno and Watts, visit: https://innovation.luskin.ucla.edu/climate/climate-investments/
OntarioOntarioTogether
99 street trees planted
1 neighborhood fair that spotlighted Ontario Together investments
13 individuals placed in jobs after meeting with new workforce specialist
8 public workshops about Ontario Together projects and plans
7 solar PV systems installed on homes occupied by low-income households
5 resident leaders hired to assist with community engagement efforts
4 convenings of Ontario Together Trustees, a resident-inclusive grant governance body;
2 new buses powered by renewable natural gas put into service
June 2020 Key Accomplishments To Date
January 2018Award Announced
March 2019Grant Execution
June 2024Grant Completion
EXECUTIVE SUMMARY EXECUTIVE SUMMARY

Ontario Together: 2021 Progress Report on Implementation of the TCC Grant | 5
Ontario TodaySituated in the Inland Valley of Southern California, down-town Ontario sits at the intersection of a busy transporta-tion corridor, an underutilized retail and commercial area, and several residential neighborhoods. The residents of this area are predominantly Hispanic. The community faces many economic and health challenges, including high rates of poverty, housing insecurity, asthma, and obesity. Climate change could exacerbate these challenges. De-spite local collaboration to address some of these chal-lenges, the community continues to need more affordable housing and transit access, training and job opportunities, and safe spaces to walk, bike, and play.
Ontario TogetherThe foundation for TCC in Ontario was laid in 2007, when a coalition of community residents, partners, and the City of Ontario came together to improve the quality of life in their city by creating the Healthy Ontario Initiative (HOI). In 2010, Ontario was awarded a Healthy Eating and Active Living (HEAL) Zone grant by Kaiser Permanente to expand HOI community engagement activities. The partnerships
and goals borne out of HOI eventually laid the groundwork for Ontario’s proposal for grant funding through TCC. To ensure that the city’s proposal reflected the priorities of the community, public workshops and meetings were held to collaboratively select projects that would address health and economic disparities, food security, housing and tran-sit, active transportation, and other key issues identified by the community.
Engagement efforts resulted in Ontario Together, a community-driven plan and initiative to transform a 4.86-square mile area of Downtown Ontario through a suite of projects and plans that will reduce greenhouse gas (GHG) emissions while also providing local environmental, health, and economic co-benefits. In early 2018, Ontario Together was selected by SGC for a TCC grant of $33.25 million to bring its vision to fruition. Ontario Together will also leverage at least $28.9 million in outside funds toward this vision. Along with Fresno and Watts — two other sites awarded Round 1 TCC funding — Ontario will serve as one of the first communities in the country to pilot a commu-nity-led, multi-benefit, and place-based climate change mitigation program that specifically targets the needs of low-income households.
Ontario Together’s community engagement team and fellow fitness instructors at a neighborhood fair in February 2020. Photo credit: City of Ontario

6 | Ontario Together: 2021 Progress Report on Implementation of the TCC Grant
ProjectsOntario Together includes a total of 10 projects, eight of which are funded by TCC dollars and two of which are fund-ed by leveraged dollars. The TCC funded and leveraged projects work synergistically to achieve the broad goals of
TCC. The TCC funded projects and leveraged projects are consolidated into eight distinct project types (summarized below), and are mapped in Figure 1 (where applicable):
TCC Funded Projects
Active Transportation — Funds two distinct projects aimed at improving and expanding infrastructure for bicyclists and pedestrians, with one project filling in 435
feet of missing sidewalk segments through the commu-nity, and the other project adding 5 miles of bikes lanes and 3 miles of sidewalks along a major corridor. These projects aim to reduce car travel by improving alterna-tive mobility options.
Affordable Housing and Sustainable Communities — Funds the construction of Vista Verde Apartments, a 101-unit afford-able housing development, as well as public
transportation and pedestrian/bicycle improvements (e.g., 2 new buses powered by renewable natural gas, 11 new bus shelters, 100 monthly free monthly bus passes over a 3-year period, 25 bike lockers, 12 bike racks, 0.51 miles of multiuse trails, etc.). Together these invest-ments are aimed at improving transit ridership and re-ducing vehicle miles traveled (VMT), along with lower-ing housing costs and travel costs for Ontario residents.
Organics Recycling — Will fund the de-velopment of an organics recycling system (referred locally as a carbon farm) that takes food and yard waste donated by local
residents and businesses and produces compost that can be used locally for gardening, farming, and urban
greening applications. This recycling process will help divert the amount of organic material that is sent to landfill, where it decomposes in the absence of oxygen and releases methane, a potent GHG.
Rooftop Solar — Funds two distinct proj-ects aimed at installing free rooftop solar systems on residential properties, with
one project focusing on multifamily properties and the other project focusing on single family homes. These two projects will enhance local generation of renewable energy and lower energy costs for property owners.
Transit Operations — Expands the fre-quency of bus service along a central corri-dor through the project area, and couples this service expansion with free transit
passes and trainings on how to navigate the local bus system. Like the affordable housing project, the transit operation project is aimed at improving transit rider-ship and reducing VMT.
Urban and Community Forestry — Funds the planting of 365 trees. As the trees ma-ture, they will sequester carbon and shade nearby buildings, which should reduce
the demand for electricity for cooling purposes. The additional tree coverage will also reduce the urban heat island effect on hot days and absorb stormwater on rainy days.
Leveraged Projects
Health and Wellness — Leverages the HOI initiative launched in 2007, which aims to broadly improve community health. One signature element of the initiative is the es-
tablishment of a network of health hubs at community centers where residents can learn about nutrition, par-ticipate in fitness classes and clubs, and get connected with preventative care resources.
Small Business Support — Leverages a recently launched program to attract and retain small businesses in downtown On-tario, thereby supporting local job creation
and economic growth. The program includes the roll-out of a maker space and an incubator space for local entrepreneurs to kickstart their small businesses.
EXECUTIVE SUMMARY EXECUTIVE SUMMARYEXECUTIVE SUMMARY EXECUTIVE SUMMARY

Ontario Together: 2021 Progress Report on Implementation of the TCC Grant | 7
Transformative PlansTCC is unique from other state-funded GHG reduction programs because it requires grantees to develop three transformative plans to maximize the benefits of the previously described project and to minimize unintended harms. Specifically, grantees were required to develop a community engagement plan (CEP), workforce develop-ment plan (WDP), and displacement avoidance plan (DAP).
Respectively, these three plans are designed to ensure that TCC investments reflect the community’s vision and goals, bring economic opportunities to disadvantaged and low-income communities, and minimize the risk of gentri-fication and displacement of existing residents and busi-nesses. In the case of Ontario Together, these three plans have been adapted in the following ways:
Community Engagement Plan Workforce Development Plan Displacement Avoidance Plan
» Institutionalize opportunities for residents to participate in the planning and governance of TCC implementation
»Create a network of community based educators that inspire behavior change
»Connect residents with training and educational opportunities that provide them with new skills
»Place residents in employment opportunities on TCC and leveraged projects
» Incentivize affordable housing production
»Protect tenure of existing residents
»Retain local small business community
Figure 1. Project Area Map With Locations of Projects*
EXECUTIVE SUMMARY EXECUTIVE SUMMARYEXECUTIVE SUMMARY EXECUTIVE SUMMARY
*See the previous page for information about what each project icon represents. This map does not include projects or plans that are sitewide (e.g., community engagement) or projects for which locations have not yet been determined (e.g., rooftop solar installations). Figure credit: UCLA Luskin Center for Innovation

8 | Ontario Together: 2021 Progress Report on Implementation of the TCC Grant
Harder to quantify, but nevertheless important, is the leadership and collaboration capacity that will be created in Ontario over the course of the TCC implementation process. This capacity could lay the foundation for many other funding and action-oriented opportunities that
leverage the TCC projects and plans to bring additional en-vironmental, health, and economic benefits to Ontario. In addition, lessons learned and best practices from Ontario TCC could inform local climate action and investments well beyond Ontario.
EXECUTIVE SUMMARY EXECUTIVE SUMMARYEXECUTIVE SUMMARY EXECUTIVE SUMMARY
Anticipated BenefitsOntario Together is slated to bring a number of benefits to residents of the TCC project area. The infographic below highlights a non-exhaustive list of these benefits, grouped by indicator type. This list includes outputs, outcomes, and impacts from TCC funded projects and does not include those from leveraged projects. Project outputs refer to the tangible goods and services that Ontario Together
will deliver by the end of project implementation. These outputs are expected to result in many positive outcomes and impacts. Outcomes refer to changes in stakeholder knowledge, attitudes, skills, behaviors, practices, or deci-sions, while impacts refer to changes in the environmental or human conditions that align with the objectives and goals of TCC.
Project Outputs
2 See Appendix 2 for a summary of methods for how these benefits were estimated. Benefits are reported as totals over the operational period of the projects, also referred to as project lifetimes. Totals reported here for projects implemented in 2019 reflect revisions completed after the release of the California Climate Investments 2020 Annual Report. These revisions will be reflected in the next reporting cycle for California Climate Investments.
3 All jobs are reported as full-time equivalents (FTEs).
5 miles of bike lanes
3 miles of sidewalk and construction improvements
101 new housing units (100 affordable)
2 new buses powered by renewable natural gas
7,200 free monthly transit passes for local residents
365 new trees that will provide shade for buildings and sidewalks
700 kW of solar power on affordable multifamily developments and single-family homes
11,575 tons of compost produced from local food and green waste
20 paid internship on residential solar installation projects
Project Outcomes and Impacts2
19,432 metric tons (MT) of avoided GHG emissions (in CO
2e)
17,850,995 miles of averted travel in passenger vehicles annually
$4,710,150 in travel cost savings for residents who shift their travel modes
$4,012,492 in energy cost savings for solar PV and street tree beneficiaries
3,750,056 gallons in avoided stormwater runoff
177 direct jobs 73 indirect jobs, and 111 induced jobs supported by TCC funding3

Ontario Together: 2021 Progress Report on Implementation of the TCC Grant | 9
EXECUTIVE SUMMARY EXECUTIVE SUMMARYEXECUTIVE SUMMARY EXECUTIVE SUMMARY
Much has happened following SGC’s announcement of Ontario Together’s TCC award in 2018. From then through the close of the 2019-’20 fiscal year (June 30, 2020), project partners have developed grant administration processes, refined work plans, built capacity and governance struc-tures, and made considerable progress toward implement-ing an ambitious, unprecedented climate action initiative. These accomplishments are described in more detail below according to the time period in which they occurred.
Post-Award Process (January 2018 – March 2019)Laid Foundation for Grant SuccessIn 2018, SGC announced that Ontario Together was award-ed a Round 1 TCC grant. This kicked off a process known as post-award consultation in which SGC and the City of On-tario participated in a comprehensive review of all projects and transformative plans to ensure that they comply with TCC guidelines and, more broadly, that the foundation is laid to maximize implementation success. Specific out-comes from the post-award consultation process include:
» The development of an evaluation plan for tracking the outputs and outcomes from each project and transfor-mative plan; and
» An executed grant agreement with clearly defined work plans, deliverables, and reporting expectations for each project and plan.
Post-Grant Execution (March 2019 – June 2020)Broke Ground on GHG Reduction ProjectsAfter the City of Ontario executed its grant agreement with SGC on March 5, 2019, the post-award consultation phase ended and grant implementation began. Before GHG re-duction projects could officially start spending TCC funds, they were each required to meet SGC’s project readiness requirements (e.g., completing necessary California Envi-ronmental Quality Act documentation, obtaining permits, finalizing project maps and designs, developing operations and maintenance plans, etc). During the first 16 months of implementation, all eight of Ontario Together ‘s GHG reduction projects successfully achieved project readiness. This process took longer for some projects, so while not all projects officially broke ground during the reporting period, three projects are well underway: the affordable housing project, urban forestry project, and single-fam-ily solar project. Notable implementation milestones for these projects include:
» Construction of the Vista Verde Apartments kicked off on June 17, 2019 and progressed towards its March 2021 completion date.
» 99 street trees were planted in the project area;
» 7 solar PV systems were installed on single-family homes, totaling around 31 kilowatts (kW) in renewable energy capacity; and
» 2 new buses powered by renewable natural gas were purchased and put into service in the project area.
Construction of the Vista Verde Apartments affordable housing development in June 2020. Photo credit: Aero Cine Pros Inc.
Cumulative Accomplishments

10 | Ontario Together: 2021 Progress Report on Implementation of the TCC Grant
EXECUTIVE SUMMARY EXECUTIVE SUMMARYEXECUTIVE SUMMARY EXECUTIVE SUMMARY
Neighborhood fair at De Anza Park in February 2020. Photo credit: City of Ontario
Operationalized Transformative Plans All three of Ontario Together’s transformative plans were put into practice during the reporting period. These plans leverage a number of long-standing initiatives already un-derway in Ontario. For example, Ontario’s CEP integrates much of the health programming and outreach strategies piloted under HOI into Ontario’s TCC framework, so that residents can continue to get involved with local planning efforts vis-a-vis the channels they already know and use. Similarly, Ontario’s WDP leverages much of the existing relationships that the San Bernardino County Workforce Development Department (SBCWDD) has built with local employers, training programs, and educational campuses to connect residents with career advancement opportuni-ties. Last, Ontario’s DAP leverages the ongoing work of the Ontario Housing Authority to augment the local supply of affordable housing in the community. The integration of these leveraged activities into Ontario Together’s transfor-mative plans are reflected in many of the accomplishments enumerated in this report, which often refer back to estab-lished programs or projects that predate TCC.
With respect to community engagement, key accomplish-ments during the reporting period include:
» Gathering of Ontario residents, project partners, and other local government agencies at a neighborhood fair that showcased various initiatives underway in the community, including Ontario Together;
» 4 convenings of the Ontario Together Trustees, a grant governance body composed of 10 project partners, 7 stakeholder groups, and a resident leader;
» 5 community health workers (known locally as resident leaders) were hired and trained by Ontario Together partners to help with community engagement;
» 8 informational workshops about Ontario Together projects and plans (4 on affordable housing; 3 on roof-top solar; and 1 on urban forestry); and
» 15 meetings facilitated by the Community Health Im-provement Association (CHIA), a resident-led advisory body that reports to the Trustees about health and safety improvements that the community needs;
Workforce development accomplishments include:
» 32 events at Ontario’s downtown library about job train-ing opportunities and 14 events about job placement opportunities;
» 13 individuals placed in jobs and 4 placed in training after meeting with the workforce specialist stationed at Ontario’s downtown library; and
» 7 scholarships provided through the Promise Program, which provides high school graduates with two years of free tuition at a California community college of the student’s choice.
Displacement avoidance accomplishments include:
» Construction of Emporia Place Apartments, which add-ed 75 units of affordable housing to the project area (23 units filled during the report period);
» Issued a $24.6 million bond to rehabilitate and extend the affordability covenants of 86 housing units at On-tario Townhouses, which are located within the project area; and
» 1,697 mobile home units protected with rent caps under the Jack Galvin Mobile Home Park Accord.

Ontario Together: 2021 Progress Report on Implementation of the TCC Grant | 11
EXECUTIVE SUMMARY EXECUTIVE SUMMARYEXECUTIVE SUMMARY EXECUTIVE SUMMARY
Screenshot from an online workshop in April 2020 about opportunities to obtain a free rooftop solar system through Ontario Shines. Photo credit: UCLA Luskin Center for Innovation
Responded to COVID-19 Pandemic After the COVID-19 pandemic hit, many of Ontario Togeth-er’s various projects and transformative plans had to halt implementation to mitigate community spread of the virus. Ontario Together project partners quickly regrouped and identified which project components should be postponed and which could be modified to employ physical distancing protocols. Notable implementation pivots include:
» Community engagement programming, such as afford-able housing workshops and Zūm!Up classes, moved to a virtual environment (Zoom) and were recorded for wider dissemination;
» Virtual CHIA meetings educated resident leaders about prevention, treatment, and vaccine rollouts, who then relayed the information more broadly within the com-munity;
» Business outreach was adjusted to include information about COVID-19 related resources;
» Workforce development services remained available at the downtown library through an online appointment booking system;
» Construction workers continued working on Vista Verde Apartments by wearing masks and physically distancing;
» Paid internships with GRID Alternatives were modified so that interns could work remotely on outreach- or design-related tasks;
» All components of the transit operations project have been postponed until vaccines are widely available and schools have reopened, so that transit investments are implemented when they will have the greatest impact on increasing ridership.

12 | Ontario Together: 2021 Progress Report on Implementation of the TCC Grant
EXECUTIVE SUMMARY EXECUTIVE SUMMARY
Ontario Together’s community engagement team and fellow fitness instructors lead a public ZumUp! class in February 2020 (top photo); Recording of a physically distanced ZumUp! class in March 2020 (bottom photo). Photo credit (top and bottom):
City of Ontario

Ontario Together: 2021 Progress Report on Implementation of the TCC Grant | 13
The Vision Behind TCCThe Transformative Climate Communities Program (TCC) was authorized in 2016 by Assembly Bill
2722 (authored by Assembly member Autumn Burke). The bill’s intent is to fund the development and
implementation of neighborhood-level transformative climate community plans that include multiple
coordinated greenhouse gas (GHG) emissions reduction projects that provide local economic, en-
vironmental, and health benefits to disadvantaged communities.4 The program is part of California’s
broader suite of programs, referred to as California Climate Investments, that use revenues from the
state’s Cap-and-Trade Program to fund projects that reduce GHG emissions. TCC is novel because of
three signature elements: 1) its place-based and community-driven approach toward transformation;
2) robust, holistic programming via the integration of diverse strategies; and 3) cross-sector partner-
ships. The authors of this report are not aware of such a comprehensive, community-driven, and place-
based climate action program anywhere else in the world.
4 AB 2722, Transformative Climate Communities. 2016. Web. February 2017. Retrieved from: https://leginfo.legislature.ca.gov/faces/billNavClient.xhtml?bill_id=201520160AB2722
Former Governor Jerry Brown in Fresno signs a package of climate change bills in September of 2016, including Assembly Bill 2722, which was authored by Assembly member Autumn R. Burke (at right) and established the Transformative Climate Communities (TCC) Program. Photo credit: The Fresno Bee
BACKGROUNDBACKGROUND

14 | Ontario Together: 2021 Progress Report on Implementation of the TCC Grant
As a place-based program, all grant applicants must iden-tify a project area that will be the focus of the TCC propos-al. Proposals must be borne out of a robust community engagement process that brings together residents and stakeholders toward the development of a shared vision of how to invest TCC funds. The program’s emphasis on comprehensive community engagement helps ensure that proposals are based on a deep understanding of a commu-nity’s needs and assets, thereby maximizing the benefits that TCC dollars bring to existing residents in a selected site.
As a holistic program, TCC integrates a wide variety of GHG reduction strategies, such as sustainable land use, low car-bon transportation, renewable energy generation, urban greening, and waste diversion. With these strategies in mind, TCC grantees develop site-specific projects, such as transit-oriented affordable housing, expanded bus service, rooftop solar installations, tree planting, and food waste recovery. These GHG reduction projects are modeled after existing California Climate Investment (CCI) project types, but TCC is novel in that it unifies them into a single, place-based initiative. In addition to integrating various CCI project types, TCC also requires TCC sites to incorpo-rate crosscutting transformative plans, ensuring that TCC investment is underpinned by meaningful community en-gagement, provides direct economic benefits to existing residents and businesses, and enables these stakeholders to remain in their neighborhood. Moreover, grant recipi-ents are expected to use TCC dollars in concert with other sources of funding that could complement the TCC invest-ment to implement the community vision.
Last, the program emphasizes cross-sector partnerships by requiring applicants to form a coalition of organizations that would carry the implementation of the community vision. To assure that the implementation will deliver the community’s vision, all applicants are required to have an oversight committee that consists of project partners, community members, and local community-based organi-zations. The diverse partnerships, robust governance, and aforementioned transformative plans help ensure trans-
parency and accountability for the investments, all while building the capacity of communities historically underin-vested in, thereby helping to reverse that trend.
Program AdministrationSGC awards TCC grants and administers the program in partnership with the Department of Conservation (DOC), with collaboration by other state agencies. SGC staff coor-dinates efforts with partnering state agencies and works with the California Air Resources Board (CARB) and DOC on program guidelines, evaluating applications, preparing agreements, monitoring agreement implementation, and program reporting.
There are two types of grants administered through TCC: implementation grants and planning grants. SGC awards implementation grants to sites that have demonstrated a clear, community-led vision for how they can use TCC dol-lars to achieve program objectives in their communities. SGC also awards planning grants to fund planning activities in disadvantaged communities that may be eligible for future TCC implementation grants and other California Climate Investment programs. The implementation grants are funded through California’s Cap-and-Trade auction proceeds while the planning grants are funded through a mix of Proposition 84 funds and Cap-and-Trade auction proceeds.
Program AwardsSince the launch of the program in 2016, there have been three rounds of awards. During Round 1, which was tied to fiscal year (FY) 2016-2017 funding, a total of $133 million was allocated to implementation grants and $1.6 million was allocated to planning grants. For Round 2, which was tied to FY 2018-2019 funding, a total of $46 million was allocat-ed to implementation grants, and a total of $800,000 was allocated to planning grants. Last, for Round 3, which was tied to FY 2019-2020 funding, a total of $48 million was allocated to implementation grants and a total of $600,000 was allocated planning grants. Table 1 provides an overview of the implementation and planning grants that have been distributed through FY 2019-2020.
BACKGROUND BACKGROUNDBACKGROUND BACKGROUND

Ontario Together: 2021 Progress Report on Implementation of the TCC Grant | 15
Table 1: Overview of TCC Implementation and Planning Grants Through FY 2019-2020
Site Location Round (Fiscal Year) Grant Type Funding Amount
Fresno Round 1 (FY 2016-2017) Implementation $66.5 million
Ontario Round 1 (FY 2016-2017) Implementation $33.25 million
Los Angeles - Watts Round 1 (FY 2016-2017) Implementation $33.25 million
Coachella Valley Round 1 (FY 2016-2017) Planning $170k
East Los Angeles Round 1 (FY 2016-2017) Planning $170k
East Oakland Round 1 (FY 2016-2017) Planning $170k
Gateway Cities Round 1 (FY 2016-2017) Planning $170k
Moreno Valley Round 1 (FY 2016-2017) Planning $94k
Richmond Round 1 (FY 2016-2017) Planning $170k
Riverside Round 1 (FY 2016-2017) Planning $170k
Sacramento - Franklin Round 1 (FY 2016-2017) Planning $170k
Stockton Round 1 (FY 2016-2017) Planning $170k
West Oakland Round 1 (FY 2016-2017) Planning $170k
Northeast Los Angeles - Pacoima Round 2 (FY 2018-2019) Implementation $23 million
Sacramento - River District Round 2 (FY 2018-2019) Implementation $23 million
Bakersfield Round 2 (FY 2018-2019) Planning $200k
Indio Round 2 (FY 2018-2019) Planning $200k
McFarland Round 2 (FY 2018-2019) Planning $200k
South Los Angeles Round 2 (FY 2018-2019) Planning $200k
Tulare County Round 2 (FY 2018-2019) Planning $200k
East Oakland Round 3 (FY 2019-2020) Implementation $28.2 million
Riverside Round 3 (FY 2019-2020) Implementation $9.1 million
Stockton Round 3 (FY 2019-2020) Implementation $10.8 million
Pomona Round 3 (FY 2019-2020) Planning $200k
Porterville Round 3 (FY 2019-2020) Planning $200k
San Diego - Barrio Logan/Logan Heights Round 3 (FY 2019-2020) Planning $200k
BACKGROUND BACKGROUNDBACKGROUND BACKGROUND

16 | Ontario Together: 2021 Progress Report on Implementation of the TCC Grant
Evaluating the Impacts of TCC In 2017, SGC contracted with the University of California, Los Angeles and the University of California, Berkeley (UCLA-UCB evaluation team) to draft an evaluation plan for assessing the progress and outcomes of Round 1 TCC implementation grants at the neighborhood level. In No-vember 2018, the UCLA-UCB evaluation team published an evaluation plan to serve as a guide for evaluating the three TCC Round 1 sites.5 For Rounds 2 and 3 of the program, each TCC site selected a third-party evaluator from a list of qualified evaluation technical assistance providers that were preapproved by SGC through an open application process. Evaluation plans for Rounds 2 and 3 closely follow the evaluation plan from Round 1, with some site-specific modifications to reflect each site’s unique set of projects, goals, and priorities for data tracking.
The Round 1 evaluation plan was developed in close consultation with the TCC Round 1 sites. To qualify for
5 The UCLA Luskin Center for Innovation and UC Berkeley Center for Resource Efficient Communities. 2018. Transformative Climate Communities Evaluation Plan: A Road Map for Assessing Progress and Results of the Round 1 Place-based Initiatives. Retrieved from: http://sgc.ca.gov/programs/tcc/docs/20190213-TCC_Evaluation_Plan_November_2018.pdf
TCC funding, TCC applicants had to identify performance indicators associated with each proposed project type and transformative plan. The UCLA-UCB evaluation team then worked with the awarded grantees to refine their indicator tracking plans to ensure that they aligned with their proj-ect goals. To do so, the evaluator developed project-spe-cific and plan-specific logic models in collaboration with the grantees. Logic models are a helpful evaluation tool that illustrate all of the interim steps that must occur for a project or plan to realize its intended goals. These steps, within the context of TCC, are defined as follows:
» Inputs: The investment dollars and leveraged funds that support TCC
» Activities: The work of TCC grantees and co-applicants
» Outputs: The products and services that TCC projects produce and deliver
» Short-term Outcomes: Changes in stakeholders’ knowledge, attitude, and skills
UCLA graduate student researcher Elena Hernandez (left) tours the Huerta del Valle Community Garden, led by one of Ontario’s community leaders, Beatriz Castro (right), in November 2019. Photo credit: UCLA Luskin Center for Innovation
BACKGROUND BACKGROUNDBACKGROUND BACKGROUND

Ontario Together: 2021 Progress Report on Implementation of the TCC Grant | 17
» Intermediate Outcomes: Changes in stakeholders’ behaviors, practices, or decisions
» Impacts: Changes in environmental or human condi-tions that align with the objectives and goals of TCC
The latter four steps in the framework described above were treated as performance indicators that could be quantified and tracked for the purposes of program evalu-ation. The Round 1 evaluation plan for TCC summarizes the final list of indicators adopted by SGC for TCC evaluation and the methods for tracking those indicators.6 Indica-tor tracking responsibilities will be partially split among the UCLA-UCB evaluation team and the grantees over a five-year period (2019-2024). In general, all output-related indicators will be tracked by the grantees, while most out-come and impact related indicators will be tracked by the UCLA-UCB evaluation team.
It is important to note that it could take a generation for many of the transformative impacts of TCC investment to show up in secondary data. Trees, for example, can take 40 years to grow to maturity. Similarly, the transition to a new, higher-paying career can take decades of education and skill building to achieve. Thus, at the end of the relatively short five-year evaluation period, changes in the impact indicators may be too small to draw any statistically valid conclusions about indicator changes at the selected sites. Nonetheless, the UCLA-UCB evaluation team will update impact indicators annually for the sake of maintaining a complete time series, which will be helpful for developing trend lines over the long run that show the directionality of impact indicators. See Appendix 6 for the latest indicator data the UCLA-UCB has collected.
Methods for Evaluating TCCThe TCC Evaluation Plan includes two different modes of comparison. First, the UCLA-UCB evaluation team will measure changes in indicators in the TCC sites before and after the influx of TCC investment (before and after com-parison). When possible, the UCLA-UCB evaluation will try to construct a five-year pre-investment trend line prior to implementation kickoff (2014-2018) and following kickoff (2019-2023). Second, the UCLA-UCB evaluation team will conduct the same before and after comparison for a set of control sites to isolate the effect of TCC investment from larger social, economic, and environmental forces. These control sites are individual census tracts that are similar to their respective TCC sites along a number of dimensions, including socioeconomic demographics, climate, and pol-lution burden (as demonstrated by their CalEnviroScreen scores).7
6 Ibid.7 See the TCC Round 1 Evaluation Plan (Appendix 3.2) of the TCC Round 1 Evaluation Plan for a summary of the methods used to identify control sites: http://sgc.ca.gov/programs/tcc/ docs/20190213-TCC_Evaluation_Plan_November_2018.pdf
In addition to measuring changes within the TCC sites and a set of control sites, the UCLA-UCB evaluation team is also looking at changes at the county and state level for a select set of indicators that speak to social equity (e.g., income, employment, housing costs, etc.). Improvements in these indicators however, do not necessarily correspond to improved social equity. If, for example, employment slightly increases within the TCC sites, but a much greater increase is observed regionally, then the economic gap between TCC sites and nearby communities has not been fully addressed.
In summary, the UCLA-UCB evaluation team will collect data at four geographic scales to assist with evaluating the effects of TCC:
» TCC project area: The neighborhood boundary iden-tified by the TCC grantees in which all TCC investments will be located. In some cases, a cluster of census tracts that have more than 10% area overlap with the TCC project boundary area will be used for indicator tracking purposes instead of the actual project boundary. This is the case for all indicators that rely on American Commu-nity Survey (ACS) data, which cannot reliably be appor-tioned to fit the actual TCC project boundary area. See Appendix 4 for a list of census tracts that will be used as a proxy for Ontario’s TCC project boundary area.
» TCC control sites: A cluster of census tracts that match TCC census tracts along a number of dimensions, in-cluding socioeconomic demographics, climate, and pol-lution burden, but that did not receive TCC investment. Collecting before and after data for the control sites will help control for external forces such as broader trends that could also explain the changes in environmental, health, and economic conditions observed in the three awarded TCC sites. See Appendix 5 for a list of census tracts that will be used as control sites for evaluating the impacts of TCC investment in Ontario.
» County: The county in which TCC sites are situated (San Bernardino County in this report). County-scale mea-surements are helpful for understanding the degree to which TCC investments are addressing social equity concerns.
» State: The state in which TCC sites are situated (Cal-ifornia). Like county-scale measurements, statewide measurements are helpful for understanding the degree to which TCC investments are addressing social equity concerns, but at a broader scale.
BACKGROUND BACKGROUNDBACKGROUND BACKGROUND

18 | Ontario Together: 2021 Progress Report on Implementation of the TCC Grant
When possible, the UCLA-UCB evaluation team will track indicators for the TCC project area and at the scale of the control sites, county, and state. However, a number of indicators do not easily lend themselves to measurement for the latter three geographies. Many of the indicators tracked by the UCLA-UCB evaluation team rely on primary data (e.g., transit ridership, business retention, compost production, etc.) that would be cost-prohibitive or tech-nically infeasible to obtain at the same level of detail for control sites, the county, or the state. Even when second-ary data are available, it may not be prudent to use limited evaluation resources to analyze indicators at all four scales. For example, accessibility indicators will be tracked for both TCC sites and control sites, but not at the county and state scale because of the processing time associated with running network analyses in ArcGIS. Furthermore, some indicators must be estimated because they are tied to spe-cific project activities and cannot be reliably obtained from either primary or secondary data (e.g., GHG reductions, energy and travel cost-savings, indirect and induced jobs, etc.). In these cases, estimates will be provided only for the TCC sites.
Evaluation Activities Through June 2020In the months after TCC grantees executed their contracts, the UCLA-UCB evaluation team worked with the grantees to operationalize a number of indicator tracking protocols. Specifically, the UCLA-UCB evaluation team developed re-porting forms to streamline tracking activities and trained TCC project leads on how to use those forms. On an annual basis, TCC grantees complete and submit these reporting forms to the UCLA-UCB evaluation team. Each submission reflects the grantee’s activities during the previous fiscal year. Many of the key accomplishments described in this document are pulled directly from the grantees’ report-ing forms for the first year that includes the post-award period and the three months of implementation after grant execution.
By the end of 2019, the UCLA-UCB evaluation team also completed baseline data collection for quantitative indi-cators. Findings from the baseline data collection process are narratively described in the final chapter of Ontario Together’s first annual report, titled Ontario Together: A Baseline and Progress Report on Early Implementation of
8 See Section 3.3 of the TCC Round 1 Evaluation Plan for a summary of the timing, intent, and target population associated with each of these data collection instruments: http://sgc.ca.gov/programs/tcc/docs/20190213-TCC_Evaluation_Plan_November_2018.pdf
the TCC Grant. The underlying data for analyzing baseline trends are also included in Appendix 6 of this report, along with additional data that has been collected and processed within the past year. This Appendix will continue to be up-dated on an annual basis through the end of 2023.
With respect to qualitative data collection, the UCLA-UCB evaluation team began the process of testing and refin-ing qualitative data collection instruments (i.e., surveys, interview guides, and focus group scripts).8 The UCLA-UCB evaluation substantially revised the instruments from the original versions posted in the 2018 evaluation plan, im-proving their legibility and reducing their completion time.
In fall 2019, the UCLA-UCB evaluation started disseminating final versions of the community engagement and work-force development surveys in Ontario. The surveys were made available in both English and Spanish. Community engagement surveys were disseminated in-person at informational workshops about TCC projects and a neigh-borhood fair. Workforce development surveys were dis-seminated at the beginning and end of GRID Alternatives internship programs. Survey data will be analyzed toward the end of the five-year evaluation period, when it can be interpreted alongside the data that will be collected from forthcoming interviews and focus groups.
Evaluation Activities for the Coming YearDuring the third year of program implementation, the UCLA-UCB evaluation team will start conducting focus groups, which will focus on the topic of displacement. For each TCC site, there will be two focus groups: one with representatives from community-based organizations that work on housing issues and one with representatives of the business community. This is a departure from the 2018 evaluation plan in that a third focus group with local public officials will be replaced by interviews with those individuals, which will allow a greater range of topics to be covered. Focus group participants will be recruited in collaboration with TCC project partners. All focus groups will be conducted in a virtual environment. As with the survey data, the data collected during focus groups will be analyzed toward the end of the five-year evaluation period in the context of the full suite of qualitative data that will be gathered during the evaluation.
BACKGROUND BACKGROUNDBACKGROUND BACKGROUND

Ontario Together: 2021 Progress Report on Implementation of the TCC Grant | 19
Dinner event at Huerta del Valle (taken prior to TCC implementation). Photo credit: Huerta del Valle
Ontario Together: Looking Back and ForwardDowntown Ontario has been the focus of intense planning, pilot projects, and community engagement since 2007. In that year, a coalition of community residents, private and nonprofit partners, and the City of Ontario launched the Healthy Ontario Initiative (HOI), which created a shared vision to address major public health concerns in the com-munity, including asthma, obesity, cardiovascular disease, and diabetes. To support this vision, the City of Ontario and HOI partners instituted a network of health hubs at community centers where residents can learn about nutrition, participate in fitness classes and clubs, and get connected with preventative care resources. HOI planning efforts also led to the establishment of a resident advisory group, known as the Community Health Improvement Association (CHIA), that consults with the City of Ontario in developing initiatives at the intersection of public health and urban planning.
In 2010, Kaiser Permanente recognized Ontario for its ambitious work to address chronic disease and awarded the city a Healthy Eating and Active Living (HEAL) Zone grant. The grant allowed Ontario to expand and focus its health programming and community engagement activi-ties in a residential neighborhood just south of downtown where a number of key assets are located, including the Huerta del Valle community garden, community centers that also function as health hubs, public parks with recre-ational facilities, schools, and churches. The HEAL Zone grant also brought additional technical capacity to the HOI collaborative by formalizing a partnership with Kaiser per-
manente, a major health care provider in the region.
After the launch of TCC and call for proposals in 2017, the City of Ontario worked with HOI partners and CHIA resi-dent leaders to co-host a series of focus groups, meetings, and workshops aimed at developing a TCC concept pro-posal. Through this process, Ontario residents and stake-holders identified their priorities for investing TCC dollars. Specifically, residents articulated a need for projects that improve air quality, access to fresh food, pedestrian and bi-cycle safety, housing quality and affordability, employment opportunities that pay livable wages, and educational and transportation options to support residents’ professional pursuits. Based on these needs, the City of Ontario devel-oped a concept proposal that was then refined through another series of stakeholder meetings.
The result of all of these engagement efforts coupled with foundational pilot projects is Ontario Together, a suite of projects and plans aimed at reducing GHGs while also providing local environmental, health and economic co-benefits for Ontario residents. Per the TCC guidelines for Round 1 applicants, the Ontario Together proposal included the following elements: (1) TCC funded projects that have a direct impact on GHG reductions; (2) leveraged projects that further the broad goals of TCC and only use matching funds; and (3) transformative plans to ensure that the suite of projects are bolstered by meaningful com-munity engagement, workforce development, and dis-placement avoidance activities. As a place-based initiative, Ontario Together proposed concentrating TCC dollars in a 4.86-square-mile area of Downtown Ontario, a boundary area that leverages Ontario’s existing network of health hubs and HEAL Zone investments.
BACKGROUND BACKGROUNDBACKGROUND BACKGROUND

20 | Ontario Together: 2021 Progress Report on Implementation of the TCC Grant
In early 2018, Ontario Together was selected through a competitive grant process by SGC for a TCC grant of $33.25 million to bring their vision to fruition. Ontario Together will also leverage at least $28.9 million (and up to $74.5 million) in outside funds toward this vision. The TCC award not only brings a significant influx of financial resources to the community but also reinforces the cross-sector partnerships that were built before and during the TCC application process. Table 2 provides a summary of the Ontario Together projects, plans, and partners involved with implementation. Appendix 1 provides a detailed map of where all of the TCC and leveraged projects are located
within the TCC boundary area, as well as where the HEAL Zone is situated within the TCC boundary area.
The next three sections of this report provide summary profiles on the various transformative plans, TCC funded projects, and leveraged projects that make up Ontario Together. Each profile includes an overview of the proj-ect or plan’s goals, the roles of various partners involved with implementation, and key accomplishments that have occurred following the announcement of Ontario’s TCC award through the end of FY 2019-2020. This period over-laps with about one year of post-award consultation and 16 months of program implementation.
BACKGROUND BACKGROUND
Table 2: Summary of Ontario Together Projects and Plans
Project/Plan Type Project/Plan Name Partners TCC FundingLeveraged
FundingCommunity Engagement Plan N/A Social Impact Artists;*
City of Ontario $199,515 $5,896
Displacement Avoidance Plan N/A City of Ontario;*
Ontario Housing Authority $0 $33,077,706
Workforce Development Plan N/A
City of Ontario;*County San Bernardino; Ontario-Montclair School District
$238,271 $84,687
Active Transportation Program
Pedestrian Pathway Improvements and Network City of Ontario* $141,799 $208,603
Mission Boulevard Bike and Pedestrian Improvements City of Ontario* $5,698,469 $1,030,196
Affordable Housing and Sustainable Communities Project
Vista Verde Apartments
City of Ontario;* National Community Renaissance; Ontario Housing Authority; Omnitrans
$18,825,393 $37,490,793
Organics Recycling Project Ontario Carbon Farm Huerta del Valle;*
City of Ontario* $1,106,000 $286,500
Rooftop Solar Projects
Ontario Shines: Multi-family Solar PV
GRID Alternatives;* City of Ontario $1,141,180 $132,000
Ontario Shines: Single-family Solar PV
GRID Alternatives;* City of Ontario $1,860,820 $800,000
Transit Operations Project
Transit Pass Program/Travel Training/Route 83 Expansion Omnitrans* $1,900,500 $0
Urban and Community Forestry Project Urban Canopy City of Ontario* $529,821 $11,463
Leveraged Projects
Healthy Ontario InitiativeCity of Ontario;* Huerta del Valle; County of San Bernardino; Social Impact Artists
$0 $333,595
Small Business Support Program
Inland Empire Small Business Development Center;* City of Ontario; County of San Bernardino
$0 $1,000,489
Total** $31,641,768 $74,461,928
*Project lead**TCC funding total does not include additional grant money provided for grant administration and other related activities. Leverage funding total is including additional projected funds that were not originally included in the grant award package (i.e., $28,997,038).

Ontario Together: 2021 Progress Report on Implementation of the TCC Grant | 21
Healthy Ontario vision board that informed the City of Ontario’s TCC proposal. Photo credit: City of Ontario
THE COUPLING OF TRANSFORMATIVE PLANS alongside GHG reduction projects is one of the cen-
tral elements of the TCC that separates it from all other California Climate Investments. For Round 1
of TCC, applicants were required to develop three transformative plans: a community engagement
plan, workforce development plan, and displacement avoidance plan. Together, these three plans are
designed to ensure that TCC investments reflect the community’s vision and goals, bring economic
opportunities to disadvantaged and low-income communities, and minimize the risk of gentrification
and displacement of existing residents and businesses. Applicants were provided a menu of strategies
for developing their plans and encouraged to choose those that spoke to the site’s priorities and
strengths. The following section provides an overview of how Ontario Together structured its three
transformative plans and what progress has been made toward plan implementation.
PROFILES:PROFILES:
TRANSFORMATIVE PLANSTRANSFORMATIVE PLANS
22 | Ontario Together: 2021 Progress Report on Implementation of the TCC Grant
City staff and residents were honored as semifinalists for their community engagement work at the 2019 All-America City Award Competition and Conference in Denver. Photo credit: City of Ontario
Community Engagement PlanCommunity Engagement Plan PROFILES:PROFILES: TRANSFORMATIVE PLANS TRANSFORMATIVE PLANS PROFILES:PROFILES: TRANSFORMATIVE PLANS TRANSFORMATIVE PLANS
ONTARIO TOGETHER’S COMMUNITY ENGAGEMENT PLAN
(CEP) involves residents and businesses in the planning, imple-
mentation, and governance of the various projects supported
by TCC. The CEP also leverages the many partnerships formed
between the City of Ontario, community-based organizations,
project area residents, and business leaders during the TCC appli-
cation process. That process engaged more than 200 residents
in a series of visioning/mapping workshops, focus groups, and a
number of other public meetings.
The City of Ontario, Health Ontario Initiative (HOI) partners,
the League of Conservation Voters, and Social Impact Artists led
the engagement process around Ontario’s TCC proposal. Social
Impact Artists, a local consulting organization that focuses on
community-based health equity strategies, will collaborate closely
with the City of Ontario and its partner organizations to lead en-
gagement efforts.
Key Accomplishments*
» Neighborhood fair that showcased
various initiatives underway in
Ontario, including those that are TCC
funded
» Convening of 33 partners at a World
Cafe, in which local leaders met to
discuss engagement challenges and
strategies, among other topics
» 8 informational workshops about Ontario Together projects and plans (4 on affordable housing, 3 on rooftop solar, and 1 on urban forestry) with 14-149 stakeholders engaged at each workshop
* From award date (January 2018) through the end of FY 2019-’20 (June 2020)
Continues on next page

Ontario Together: 2021 Progress Report on Implementation of the TCC Grant | 23
Engagement StrategyOntario Together’s strategy for engagement draws heavily from the model used by HOI, which is now integrated into Ontario Together. Two signature elements exist:
1. The deployment of paid community health workers, known as resident leaders, who educate residents about public health resources, provide updates about local initiatives, and collect community feedback to inform planning and implementation decisions; and
2. The deployment of community health coaches who provide deeper health education, support targeted out-reach efforts, and connect residents to health hubs.
Resident leaders conduct outreach through various means, such as knocking on doors, leading fitness classes, and holding public meetings. During implementation of the CEP, five resident leaders will work part time as Ontario To-gether ambassadors and eight health coaches will work part time to provide classes, education, and support outreach.
Additional means of engagement include neighborhood fairs that showcase TCC funded projects, informational workshops about how residents can access TCC funded opportunities (e.g., affordable housing info sessions, job training open houses, community garden member orienta-tions, etc.), social media updates, and mailings. All mate-
rials and events will be written and spoken in both English and Spanish, the two primary languages spoken at home in the Ontario Together initiative area.
Governance ModelThe City of Ontario has assembled a collaborative stake-holder group, referred to as the Trustees, who provide advisory oversight over the implementation of the TCC grant. The Trustees are composed of 18 members. Besides the City of Ontario, this includes nine project partners who oversee funded and leveraged projects, seven stakehold-er groups that work in the community, and one ex officio delegate from the community (See Appendix 3 for a list of Trustees). The ex officio delegate is designated by the Healthy Ontario Neighborhood Council, a less formal, non-membership body of Ontario residents. The Trustees hold quarterly meeting that are open-door and provide an opportunity for public comment.
In addition to the Trustees, the Community Health Im-provement Association (CHIA) is an advisory body involved with TCC implementation. CHIA is composed of 12 resident leaders and helps the City of Ontario identify health and safety improvements needed in the community. CHIA was borne out of the HOI implementation process and played a key role in developing the Ontario Together proposal.
Project Details
Launch date
May 2019 Anticipated completion date
February 2021TCC grant funds
$199,515Leveraged funds
$5,896
PROFILES:PROFILES: TRANSFORMATIVE PLANS TRANSFORMATIVE PLANS PROFILES:PROFILES: TRANSFORMATIVE PLANS TRANSFORMATIVE PLANS
Responses to COVID-19
» All community engagement events conducted virtually
» Personal protective equipment (PPE) training provided for all CEP team members
» Virtual CHIA meetings educated resident leaders about prevention, treatment, and vaccine rollouts through partnerships with local hospitals and public officials
» PPE training for all CEP team members
Key Accomplishments
(Continued )
» 5 resident leaders and 5 health coaches hired and trained to support the CEP
» 15 CHIA meetings with 7-20 stakeholders engaged at each meeting
» 2 house meetings about Ontario Shines with 27 and 147 stakeholders engaged at each meeting
» 2 focus groups about housing outreach strategies with 9 and 11 participants in each group

24 | Ontario Together: 2021 Progress Report on Implementation of the TCC Grant
Photo credit: UCLA Luskin Center for Innovation
“I recruit from the community – someone I saw in a Zūm Up! fitness class, someone
who came to a forum, someone who really knows the needs of the community and is
invested in the work we do.” NORA BELTRAN,
outside her office at El Sol Neighborhood Educational Center
STORIES FROM THE COMMUNITY
Grassroots model empowers Grassroots model empowers residents to serve as local leadersresidents to serve as local leaders
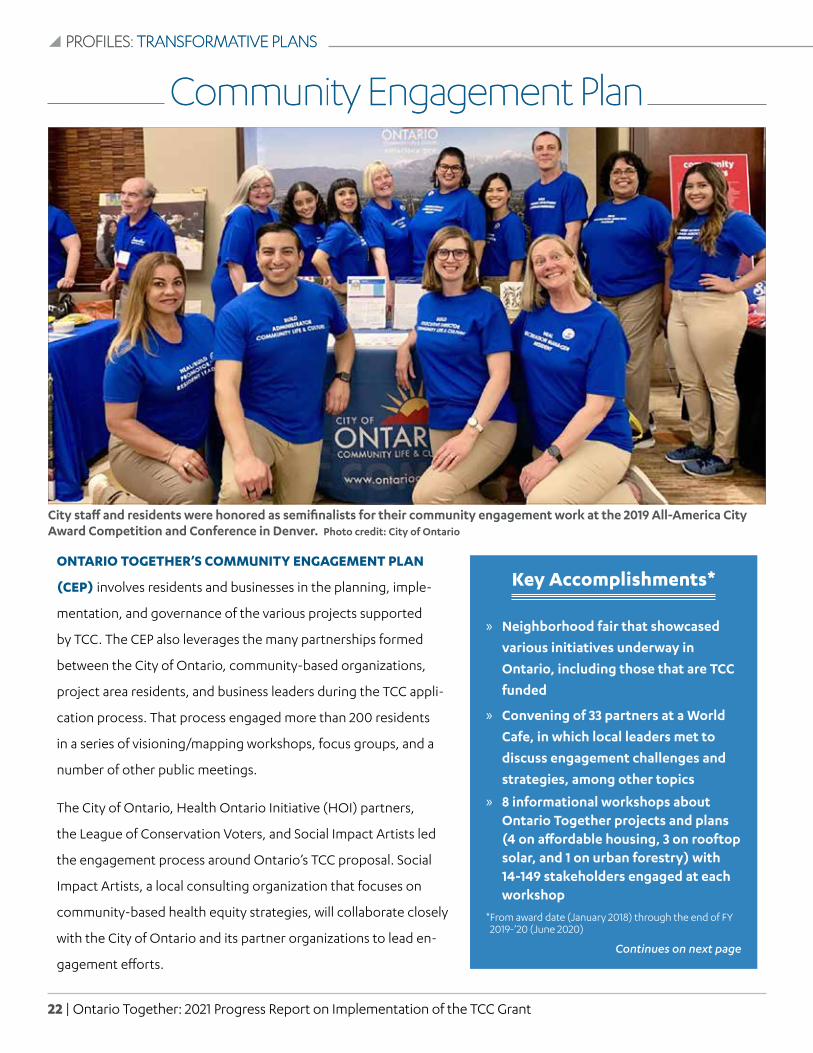
NORA BELTRAN wears a number of hats. She is raising two daughters in Ontario, is part of a team known as Zūm Up! that teaches Zumba© exercise classes alongside leader-ship skills, and coordinates health programs as a resident leader at El Sol Neighborhood Educational Center, a local nonprofit. In that position, Beltran is tasked with recruiting other residents to serve as resident leaders, which function as community health workers who motivate and educate Ontario residents to maintain active and healthy lifestyles. Using their communication skills and social networks, the resident leaders will assist with Ontario Together commu-nity engagement. This includes collecting feedback about the rollout of TCC projects, which they report back to the TCC Trustees, the governance body tasked with TCC imple-mentation.
In recruiting resident leaders, Beltran looks for local res-idents who have a demonstrated passion for community engagement and health education. HOI and Social Impact Artists then help pay for residents to obtain educational credentials that support their work. Social Impact Artists also coordinates certifications of residents to teach fitness and nutritional classes.
PROFILES:PROFILES: TRANSFORMATIVE PLANS TRANSFORMATIVE PLANS PROFILES:PROFILES: TRANSFORMATIVE PLANS TRANSFORMATIVE PLANS
Community leaders attending a Healthy Ontario Collaborative visioning retreat to set goals for planning efforts in Ontario. Photo credit: City of Ontario
Ontario Together: 2021 Progress Report on Implementation of the TCC Grant | 25
STORIES FROM THE COMMUNITY
“As a resident leader, I don’t just inform the community about local resources, I also provide emotional support. These
interpersonal connections are what I enjoy most about the job.”
BEATRIZ CASTRO , at the demonstration oven in Huerta del Valle
BEATRIZ CASTRO is one of the community members whom Beltran recruited to serve as a resident leader. Castro, a moth-er of four, moved to Ontario from Mexico about 20 years ago. As her children grew older, Castro began to suffer from feel-ings of isolation and depression. She started attending one of Ontario’s free Zūm Up! classes to connect with other women. Inspired by the instructor and her own transformation within the class, she received an HOI scholarship to be certificated as a Zumba© instructor, which sparked her broader interest in health and wellness. In 2018, Castro received a Community Health Worker certification from Loma Linda University and began working as a Clinical Community Health Worker. The following year, she received certification to also work as a Plate Nutrition Health Coach.
Castro credits her various training opportunities with pro-viding her valuable communication skills, which she relies upon in her job as a resident leader. Castro explains that many of the people that she encounters in the community need someone to talk to about their feelings, and that those emo-tions must be acknowledged and validated before she can help motivate any behavioral change. The bonds that Castro has built in the community also give her an intimate window into the struggles of Ontario residents and how HOI and now Ontario Together can work synergistically to help support and empower residents.
ROSALBA MARTINEZ is another Ontario resident turned resident leader and Zumba© Plate Nutrition Health Coach, which she juggles with being a mother of two. Her reputation as a health expert comes as a bit of a surprise to her because she didn’t graduate from high school. She thought that would prevent her from becoming an educator. But when she learned about an adult-centered General Educational Development (GED) program at a health hub in Ontario, she became more optimistic about her future. In 2018, Martinez obtained her GED. The next year, she received a Healthy Ontario scholarship to be certified as a Plate Nutrition Coach.
Martinez says these credentials have instilled in her greater self confidence, which has allowed her to take on more public-facing responsibilities. As a resident leader, Martinez recently spearheaded a hiking club as a way to bring more physical fitness and social engagement op-portunities to the community. The club format provides Martinez an opportunity to have long, unstructured dialogues with other residents. From these conversa-tions, Martinez has collected valuable input from com-munity members about the changes they’d like to see in Ontario and how TCC can support those changes.
“I was encouraged to create my own mode of engagement, so I started a hiking club for
people like me – people who love nature, who love to walk, and prefer to do it in the
company of others.” ROSALBA MARTINEZ ,
in front of the vegetable plots at Huerta del Valle
Photo credit: UCLA Luskin Center for Innovation
Photo credit: UCLA Luskin Center for Innovation
PROFILES:PROFILES: TRANSFORMATIVE PLANS TRANSFORMATIVE PLANS PROFILES:PROFILES: TRANSFORMATIVE PLANS TRANSFORMATIVE PLANS

26 | Ontario Together: 2021 Progress Report on Implementation of the TCC Grant
Press event held in the community on March 23, 2018 to announce Ontario’s TCC award and to highlight the community’s plans to expand affordable housing opportunities. Photo credit: Jennifer Cappuccio Maher, Inland Valley Daily Bulletin/SCNG
Displacement Avoidance PlanDisplacement Avoidance Plan PROFILES:PROFILES: TRANSFORMATIVE PLANS TRANSFORMATIVE PLANS PROFILES:PROFILES: TRANSFORMATIVE PLANS TRANSFORMATIVE PLANS
Key Accomplishments*
» Closed funding gap for the construction of Emporia Place Apartments, which added 75 units of affordable housing to the project area (23 units filled during the report period)
» 1,697 mobile home units protected with rent caps under the Jack Galvin Mobile Home Park Accord
» Issued a $24.6 million bond to rehabilitate and extend the affordability covenants of 86 housing units at Ontario Townhouses, which are located within the project area
» 985 landlord-tenant and 299 fair housing cases opened with IHMB
* From award date (January 2018) through the end of FY 2019-’20 (June 2020)
Continues on next page
ONTARIO TOGETHER’S DISPLACEMENT AVOIDANCE PLAN
(DAP ) weaves together a number of city and county programs to-
ward the dual purpose of growing the supply of affordable housing
in the TCC project area and protecting the tenure of residents and
small businesses already located in the community. These efforts
seek to address the indirect effects of TCC investment that may lead
to displacement by raising the value of residential and commercial
land. It is important to note that none of the Ontario Together’s
proposed activities will directly cause displacement, as all proposed
housing units will be constructed on vacant underutilized lots and
transportation activities will occur within the public right-of-way.
The Ontario Housing Authority is responsible for leading the im-
plementation of the DAP. Additional partners that will support DAP
implementation include: the Inland Fair Housing and Mediation
Board (IFHMB), Mercy House, Social Impact Artists, the Inland Em-
pire Small Businesses Development Center (SBDC), and the Ontario
Economic Development Department.
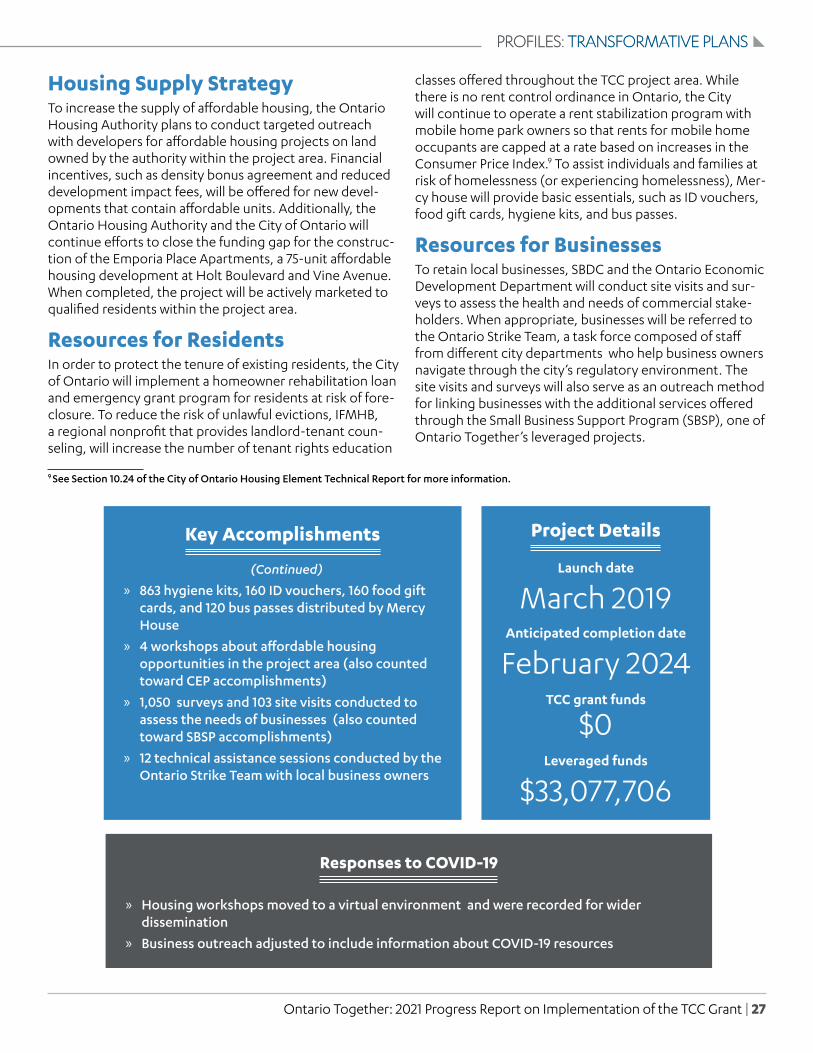
Ontario Together: 2021 Progress Report on Implementation of the TCC Grant | 27
Project Details
Launch date
March 2019Anticipated completion date
February 2024TCC grant funds
$0Leveraged funds
$33,077,706
PROFILES:PROFILES: TRANSFORMATIVE PLANS TRANSFORMATIVE PLANS PROFILES:PROFILES: TRANSFORMATIVE PLANS TRANSFORMATIVE PLANS
Key Accomplishments
(Continued)
» 863 hygiene kits, 160 ID vouchers, 160 food gift cards, and 120 bus passes distributed by Mercy House
» 4 workshops about affordable housing opportunities in the project area (also counted toward CEP accomplishments)
» 1,050 surveys and 103 site visits conducted to assess the needs of businesses (also counted toward SBSP accomplishments)
» 12 technical assistance sessions conducted by the Ontario Strike Team with local business owners
Responses to COVID-19
» Housing workshops moved to a virtual environment and were recorded for wider dissemination
» Business outreach adjusted to include information about COVID-19 resources
Housing Supply StrategyTo increase the supply of affordable housing, the Ontario Housing Authority plans to conduct targeted outreach with developers for affordable housing projects on land owned by the authority within the project area. Financial incentives, such as density bonus agreement and reduced development impact fees, will be offered for new devel-opments that contain affordable units. Additionally, the Ontario Housing Authority and the City of Ontario will continue efforts to close the funding gap for the construc-tion of the Emporia Place Apartments, a 75-unit affordable housing development at Holt Boulevard and Vine Avenue. When completed, the project will be actively marketed to qualified residents within the project area.
Resources for Residents In order to protect the tenure of existing residents, the City of Ontario will implement a homeowner rehabilitation loan and emergency grant program for residents at risk of fore-closure. To reduce the risk of unlawful evictions, IFMHB, a regional nonprofit that provides landlord-tenant coun-seling, will increase the number of tenant rights education
9 See Section 10.24 of the City of Ontario Housing Element Technical Report for more information.
classes offered throughout the TCC project area. While there is no rent control ordinance in Ontario, the City will continue to operate a rent stabilization program with mobile home park owners so that rents for mobile home occupants are capped at a rate based on increases in the Consumer Price Index.9 To assist individuals and families at risk of homelessness (or experiencing homelessness), Mer-cy house will provide basic essentials, such as ID vouchers, food gift cards, hygiene kits, and bus passes.
Resources for Businesses To retain local businesses, SBDC and the Ontario Economic Development Department will conduct site visits and sur-veys to assess the health and needs of commercial stake-holders. When appropriate, businesses will be referred to the Ontario Strike Team, a task force composed of staff from different city departments who help business owners navigate through the city’s regulatory environment. The site visits and surveys will also serve as an outreach method for linking businesses with the additional services offered through the Small Business Support Program (SBSP), one of Ontario Together’s leveraged projects.

28 | Ontario Together: 2021 Progress Report on Implementation of the TCC Grant
Demonstration of logistics technologies at Ontario High School Career and College Exposition in October 2019. Photo credit: Baldy View ROP
Workforce Development PlanWorkforce Development Plan PROFILES:PROFILES: TRANSFORMATIVE PLANS TRANSFORMATIVE PLANS PROFILES:PROFILES: TRANSFORMATIVE PLANS TRANSFORMATIVE PLANS
Key Accomplishments*
» 32 events at Ontario’s downtown library about job training opportunities and 14 events about job placement opportunities
» 13 individuals placed in jobs and 4 placed in training after meeting with the workforce specialist stationed at Ontario’s downtown library
* From award date (January 2018) through the end of FY 2019-’20 (June 2020)
Continues on next page
ONTARIO TOGETHER’S WORKFORCE DEVELOPMENT PLAN
(WDP) will expand programming in the project area that connects
residents to job training and employment opportunities, partic-
ularly those related to decarbonization and healthcare. Project
area residents will be recruited for open positions on TCC funded
projects,as well as those in the broader community, regardless of
funding source.
The San Bernardino County Workforce Development Depart-
ment (SBCWDD) is responsible for leading the implementation of
Ontario Together’s WDP. Additional partners include the Ontario
Economic Development Department and the Ontario-Montclair
School District (OMSD).

Ontario Together: 2021 Progress Report on Implementation of the TCC Grant | 29
Project Details
Launch date
April 2019 Anticipated completion date
February 2022TCC grant funds
$238,271Leveraged funds
$84,687
PROFILES:PROFILES: TRANSFORMATIVE PLANS TRANSFORMATIVE PLANS PROFILES:PROFILES: TRANSFORMATIVE PLANS TRANSFORMATIVE PLANS
Key Accomplishments
(Continued)
» 250 classroom visits in which 3-4 presenters speak to sixth grade students about their journey from elementary school to their current occupation
» 7 scholarships provided through the Promise Program, which provides high schools graduates with two years of free tuition at a California community college of the student’s choice
Responses to COVID-19
» Workforce services remained available at the library through an online appointment booking system
» SBCWDD held virtual programming and job fairs throughout the pandemic
» OMSD and the City of Ontario continue to support virtual visits and resource sharing with students
Strategy for Connecting Ontario Residents to Skilled EmploymentSBCWDD already oversees a suite of workforce develop-ment programs in the region that help place San Bernardi-no County residents in new jobs or gain new skills. These programs include job fairs at educational campuses, job readiness workshops, and one-on-one job coaching. Additionally, SBCWDD oversees a number of educational programs to help prepare unemployed or underemployed residents to enter the workforce, including English lan-guage courses, assistance obtaining a high school diploma or GED) and scholarships for higher education.
To ensure that existing workforce programs and new TCC workforce opportunities reach residents of the TCC project area specifically, SBCWDD will use TCC funds to create a permanent workforce development program at the Ovitt Family Community Library in downtown Ontario. At this lo-cation, library patrons will be able to meet with a workforce specialist to learn about open job postings, upcoming training opportunities, and funding opportunities to gain new skills or higher education
Job Training and Employment Opportunities on TCC Projects Project area residents will be recruited for the following job training and employment opportunities that are partially funded by TCC dollars:
» Construction jobs to build the affordable housing de-velopment at Virginia Avenue and Holt Boulevard (66 estimated direct jobs)
» Waste management jobs with Huerta del Valle to collect food and yard waste and process it into compost for gardening and farming applications (three full-time jobs)
» Health education jobs (known locally as resident lead-ers) with the City of Ontario to promote healthy eating and living practices (five part-time jobs)
» Solar installation and community outreach training with GRID Alternatives to install solar photovoltaic (PV) systems in residential settings (20 paid three-month internships)

30 |Ontario Together: 2021 Progress Report on Implementation of the TCC Grant
Arthur Levine, an interim project lead for the Ontario Carbon Farm, leading a compost demonstration at the Huerta del Valle Community Garden (taken prior to TCC implementation). Photo credit: OntarioRealFood.org
TCC APPLICANTS CHOSE FROM A WIDE ARRAY OF PROJECT TYPES in their effort to achieve
the three objectives of TCC, namely: (1) reductions in GHGs; (2) improvements in public health and
environmental benefits, and (3) expanded economic opportunity and shared prosperity. These project
types align with the suite of California Climate Investments overseen by various state agencies.10 This
alignment was built into TCC to streamline the proposal and indicator tracking process. For example,
the California Air Resources Board (CARB) has developed GHG reduction quantification methodol-
ogies and co-benefit assessment methodologies for each project type under the existing suite of
California Climate Investments. These methodologies can then be used by TCC grantees (and technical
assistance providers, such as the UCLA-UCB evaluation team) to estimate the benefits of each project.
The following section provides an overview of the Ontario Together projects, aggregated by project
type, that will be using TCC dollars to achieve the aims of the program.
10 For more information about California Climate Investments, visits: http://www.caclimateinvestments.ca.gov/
PROFILES: PROFILES:
TCC FUNDED PROJECTS TCC FUNDED PROJECTS

Ontario Together: 2021 Progress Report on Implementation of the TCC Grant| 31
Bike lane around Ontario Town Square during an active transportation event held on August 8, 2018. Photo credit: City of Ontario
Active Transportation ProjectsActive Transportation Projects
ONTARIO TOGETHER’S ACTIVE TRANSPORTATION PROJECTS aim to
reduce vehicle miles traveled (VMT) in passenger vehicles by improving
mobility options for pedestrians, bicyclists, and transit riders to access
key destinations in and outside the TCC project area. Specifically, the
Pedestrian Pathway Improvement and Network Connectivity Project
(PPINCP) will fill in 434 linear feet of missing sidewalk segment within the
community, and the Mission Boulevard Bike and Pedestrian Improve-
ments (MBBPI) will add five miles of Class IV buffered bike lanes and three
miles of sidewalks along Mission Boulevard. Both projects are managed
by the Ontario Engineering Department.
Additionally, MBBPI will also provide a number of amenities along Mission
Boulevard to enhance the walking and biking experience for residents.
These amenities include bike detention at signalized intersections, ramps
for individuals with limited mobility, and sidewalk adjacent landscaping.
All of the vegetation planted will be native and drought tolerant.
Key Accomplishments
Implementation pending
PROFILES: PROFILES:
TCC FUNDED PROJECTS TCC FUNDED PROJECTS

32 |Ontario Together: 2021 Progress Report on Implementation of the TCC Grant
Project Details
Anticipated completion date
February 2021Project lifetime (post-implementation)
20 years
TCC grant funds
$5,840,268Leveraged funds
$1,238,799
Estimated Benefits Over Project Lifetime
GHG emissions reductions
440 MTCO2eVMT reduction
1,144,345 milesTravel cost savings
$638,646
Direct jobs from TCC dollars
24 FTEsIndirect jobs from TCC dollars
11 FTEsInduced jobs from TCC dollars
20 FTEs
PROFILES:PROFILES: TCC FUNDED PROJECTS TCC FUNDED PROJECTS PROFILES:PROFILES: TCC FUNDED PROJECTS TCC FUNDED PROJECTS

Ontario Together: 2021 Progress Report on Implementation of the TCC Grant| 33
PROFILES:PROFILES: TCC FUNDED PROJECTS TCC FUNDED PROJECTS PROFILES:PROFILES: TCC FUNDED PROJECTS TCC FUNDED PROJECTS
Rendering of Vista Verde Apartments. Photo credit: City of Ontario
Affordable Housing Affordable Housing and Sustainable Communities Projectand Sustainable Communities Project
ONTARIO TOGETHER’S AFFORDABLE HOUSING AND SUSTAINABLE
COMMUNITIES PROJECT will augment housing supply, increase density, and
reduce VMT. Specifically, the project will fund the construction of a 101-unit
affordable housing development called Vista Verde Apartments.11 Of these
units, 21 will be rented to households making below 30% of the area median
income (AMI), 37 units will be rented to households at 50% AMI, and 42 units
will be rented to households at 60% AMI. The remaining unit will be reserved
for a building manager and will not be income restricted. Qualified applicants
for the affordable units will be offered a unit through a lottery process that
gives preference to applicants who already work and live in Ontario. Project
partners anticipate the affordable units will start to be occupied in March 2021.
The development will be constructed by the National Community Renais-
sance, also known as National CORE, a nonprofit community builder based
in Rancho Cucamonga that specializes in affordable, multifamily, mixed-in-
come, senior, workforce and special needs housing. Supporting partners
include the City of Ontario, the Ontario Housing Authority, and Omnitrans,
the main transportation agency for San Bernardino County.
11 For a definition of affordable, see Appendix A of the FY 2017-18 AHSC Program Guidelines.
Key Accomplishments*
»City Ontario Housing Authority closed escrow and began construction of Vista Verde Apartments on June 17, 2019
»2 new buses powered by renewable natural gas were purchased and put into service along three routes that serve the project area (61, 83, and 87)
* From award date (January 2018) through the end of FY 2019-’20 (June 2020)

34 |Ontario Together: 2021 Progress Report on Implementation of the TCC Grant
Project Details
Launch date
April 2019Anticipated completion date
February 2024Project lifetime (post-implementation)
30 years
TCC grant funds
$18,825,393Leveraged funds
$37,490,793
Estimated Benefits Over Project Lifetime
GHG emissions reductions
6,238 MTCO2eVMT reductions
16,438,915 miles Travel cost savings
$3,837,640
Direct jobs from TCC dollars
84 FTEsIndirect jobs from TCC dollars
48 FTEsInduced jobs from TCC dollars
65 FTEs
PROFILES:PROFILES: TCC FUNDED PROJECTS TCC FUNDED PROJECTS PROFILES:PROFILES: TCC FUNDED PROJECTS TCC FUNDED PROJECTS
In addition to building new housing, the project includes a number of transit-related investments to reduce car dependency. The largest investment is the purchase of two new buses that increase the frequency of bus service along Route 83 from every 60 minutes to every 30 minutes. This bus line runs along Euclid Avenue, a central corridor near the housing development. The buses are powered by natural gas and take advantage of renewable natural gas credits to ensure that all miles driven result in net zero GHG emissions.
In addition to the housing and transit service investments, this project will fund:
» A mobility hub that includes no fewer than 25 bike lock-ers, 12 bike racks, a bike repair kiosk, and real time tran-
sit scheduling to help assist the transfer from different travel modes
» 12 real-time messaging boards at select stops
» 11 new bus shelters
» 0.51 miles of multiuse bike and pedestrian trails along Grove Avenue
» 8 block-level installations of rapid flashing beacons and/or in-pavement warning lights
» 2 speed feedback signs to slow traffic signs
» 100 free monthly Omnitrans bus passes for building residents over a three-year period
» A travel training program for building residents to en-courage a mode shift from driving to public transit
Responses to COVID-19
» Construction workers were able to continue working on-site by wearing masks and physically distancing

Ontario Together: 2021 Progress Report on Implementation of the TCC Grant| 35
PROFILES:PROFILES: TCC FUNDED PROJECTS TCC FUNDED PROJECTS PROFILES:PROFILES: TCC FUNDED PROJECTS TCC FUNDED PROJECTS
Composting workshop at Huerta del Valle (taken prior to TCC implementation). Photo credit: OntarioRealFood.org
Organics Recycling ProjectOrganics Recycling Project
ONTARIO’S ORGANICS RECYCLING PROJECT , referred to as the
Ontario Carbon Farm, will produce compost from food and yard waste
donated by project area residents and businesses. The project will reduce
GHGs by diverting organic waste from landfills where it would otherwise
decompose in the absence of oxygen, thereby producing methane, a
potent GHG with warming properties up to 34 times more potent than
carbon dioxide over 100 years. By diverting organic waste to compost-
ing facilities where it is processed in the presence of oxygen, methane
emissions from landfills are avoided. The diversion of organic waste to
local composting facilities should also reduce the vehicle trips needed to
transport organic material to off-site landfills, but these trips are difficult
to estimate, so resulting GHG emissions are not reported here.
Key Accomplishments
Implementation pending

36 |Ontario Together: 2021 Progress Report on Implementation of the TCC Grant
PROFILES:PROFILES: TCC FUNDED PROJECTS TCC FUNDED PROJECTS PROFILES:PROFILES: TCC FUNDED PROJECTS TCC FUNDED PROJECTS
The Ontario Carbon Farm will be operated by Huerta Del Valle, a local nonprofit that also runs a community garden in the project area. The compost produced at the carbon farm will be fed back into the project area for residents, businesses, and city agencies to use in gardening, farm-ing, and urban greening applications. When used as a soil amendment, compost has been demonstrated to seques-ter carbon, but there is no established methodology for estimating those sequestration benefits in urban envi-
ronments, so they are not included in the GHG emissions reductions reported here.
This project will also provide on-the-job training oppor-tunities for residents who are interested in a career in the organics recycling sector. Trainees will learn the funda-mentals of the composting process as well as gardening and landscaping skills on how best to incorporate compost into soils to maximize environment benefits.
Project Details
12 This estimate does not include the potential carbon sequestration benefits of compost that is used as a soil amendment. There is currently no standardized methodology for estimating the carbon sequestration benefit of applying compost to soils in urban environments. This estimate also does not include the GHGs that may be avoided from reduced vehicle trips needed to transport organic material to off-site landfills.
Anticipated completion date
August 2023Project lifetime (post-implementation)
10 years
TCC grant funds
$1,106,000Leveraged funds
$286,500
Estimated Benefits Over Project Lifetime
GHG emissions reductions
3,023 MTCO2e12
Material diverted from landfill
11,575 tonnes
Direct jobs from TCC dollars
7 FTEsIndirect jobs from TCC dollars
2 FTEsInduced jobs from TCC dollars

Ontario Together: 2021 Progress Report on Implementation of the TCC Grant| 37
PROFILES:PROFILES: TCC FUNDED PROJECTS TCC FUNDED PROJECTS PROFILES:PROFILES: TCC FUNDED PROJECTS TCC FUNDED PROJECTS
GRID Alternatives staff and trainees install rooftop solar PV panels in July 2019. Photo credit: GRID Alternatives
ONTARIO TOGETHER’S SOLAR PROJECTS, collectively referred to as
Ontario Shines, will enhance the generation of local renewable energy by
installing up to 700 kW of solar PV panels on affordable multi-family hous-
ing developments (360 kW) and single-family properties (340 kW). All sin-
gle-family homes must be owner-occupied by a low-income household to
qualify. The projects are led by GRID Alternatives, a nonprofit organization
based in Oakland, California that installs solar power systems and provides
job training for underserved communities
For the multi-family developments, GRID Alternatives will specifically
target properties that are providing permanent and/or transitional hous-
ing units serving homeless and/or low-income residents, such as Mercy
Housing Living Centers and National Community Renaissance of California.
By installing solar PV systems on these permanent and transitional housing
developments, operational costs will be reduced and cost-savings can in
turn be used to increase funding for homeless services.
The solar projects will also provide on-the-job training opportunities for
residents who are interested in a career in the solar sector. The training will
be conducted by GRID Alternatives, which provides two training tracts: (1)
solar installation and construction basics; and (2) outreach coordination
and project administration.
Rooftop Solar ProjectsRooftop Solar Projects
Key Accomplishments*
» 7 solar PV systems installed on single-family homes, totaling around 31 kW in capacity
» 2 contracts executed with multi-family properties to install solar PV systems (190 kW at Vista Verde Apartments, an affordable housing development, and 23 kW at Assisi House, a transitional housing facility)
» 1 paid intern completed job training on solar PV system design (now working as a designer for Motive Energy)
» 4,169 mailers sent out to project area residents to inform them about Ontario Shines
* From award date (January 2018) through the end of FY 2019-’20 (June 2020)
Continues on next page

38 |Ontario Together: 2021 Progress Report on Implementation of the TCC Grant
Project Details
Launch date
January 2020Anticipate completion date
February 2024 Project lifetime (post-implementation)
30 years
TCC grant funds
$3,002,000Leveraged funds
$932,000
Estimated Benefits Over Project Lifetime
GHG emissions reductions
8,753 MTCO2eRenewable energy generation
28,367,697 kWhEnergy cost savings
$3,789,924
Direct jobs from TCC dollars
16 FTEsIndirect jobs from TCC dollars
6 FTEsInduced jobs from TCC dollars
11 FTEs
PROFILES:PROFILES: TCC FUNDED PROJECTS TCC FUNDED PROJECTS PROFILES:PROFILES: TCC FUNDED PROJECTS TCC FUNDED PROJECTS
Responses to COVID-19
» Solar installations were conducted by permanent GRID Alternatives staff in lieu of the typical community barn-raising model that includes interns, job trainees, and community volunteers
» Paid internships with GRID Alternatives were modified so that interns could work remotely on either outreach or design related tasks
» Resident outreach shifted from a mixed-methods approach (mailers, canvassing, flyers, etc.) to focus on mailers, resulting in three rounds of mailers sent out instead of the conventional practice of one round
Key Accomplishments
(Continued)
» 15 CHIA meetings with 7-20 stakeholders
engaged at each meeting
» 25 site visits conducted to assess solar capacity
at single-family homes and multi-family
properties (20 and 5 at each property type,
respectively)
» 3 workshops about free rooftop solar
opportunities through Ontario Shines with 33 to
41 participants reached at each workshop (also
counted towards CEP accomplishments)

Ontario Together: 2021 Progress Report on Implementation of the TCC Grant| 39
PROFILES:PROFILES: TCC FUNDED PROJECTS TCC FUNDED PROJECTS PROFILES:PROFILES: TCC FUNDED PROJECTS TCC FUNDED PROJECTS
Omnitrans buses serving the residents of the Inland Valley in 2018. Photo credit: InlandEmpire.us
Transit Operations ProjectTransit Operations Project
ONTARIO TOGETHER’S TRANSIT OPERATIONS PROJECT is
coordinated by Omnitrans, the main transportation agency for San
Bernardino County, and is designed to enhance bus ridership in the
TCC project area and across Omnitrans’ network more broadly. To
accomplish this aim, Omnitrans will provide training to residents in
the TCC project area on how to navigate the public transit system
to meet one’s travel needs. In addition to the trainings, the project
will give away 100 monthly transit passes for a three-year period to
ride the Omnitrans bus system for free. The transit trainings and
free bus passes described here are supplemental to those being
provided through the Affordable Housing and Sustainable Commu-
nities (AHSC) project.
Funds from this project will also be used to increase the frequency
of the two additional buses along Route 83. The capital costs of the
buses were financed through the AHSC project. The GHG reduc-
tion benefits and co-benefits from the added bus service are cap-
tured under the AHSC project, so as to avoid the double counting
of benefits across projects.
Key Accomplishments
Implementation pending
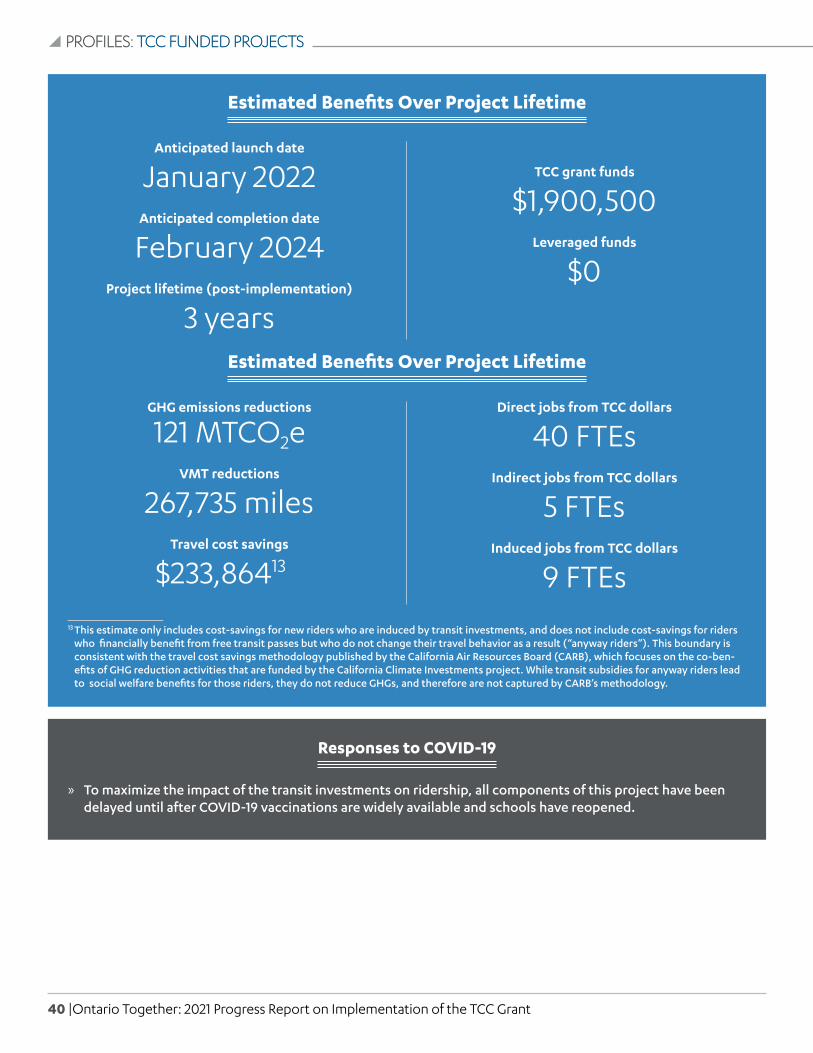
40 |Ontario Together: 2021 Progress Report on Implementation of the TCC Grant
PROFILES:PROFILES: TCC FUNDED PROJECTS TCC FUNDED PROJECTS PROFILES:PROFILES: TCC FUNDED PROJECTS TCC FUNDED PROJECTS
Responses to COVID-19
» To maximize the impact of the transit investments on ridership, all components of this project have been delayed until after COVID-19 vaccinations are widely available and schools have reopened.
Estimated Benefits Over Project Lifetime
13 This estimate only includes cost-savings for new riders who are induced by transit investments, and does not include cost-savings for riders who financially benefit from free transit passes but who do not change their travel behavior as a result (“anyway riders”). This boundary is consistent with the travel cost savings methodology published by the California Air Resources Board (CARB), which focuses on the co-ben-efits of GHG reduction activities that are funded by the California Climate Investments project. While transit subsidies for anyway riders lead to social welfare benefits for those riders, they do not reduce GHGs, and therefore are not captured by CARB’s methodology.
Anticipated launch date
January 2022Anticipated completion date
February 2024Project lifetime (post-implementation)
3 years
TCC grant funds
$1,900,500Leveraged funds
$0
Estimated Benefits Over Project Lifetime
GHG emissions reductions
121 MTCO2eVMT reductions
267,735 miles Travel cost savings
$233,8641310
Direct jobs from TCC dollars
40 FTEsIndirect jobs from TCC dollars
5 FTEsInduced jobs from TCC dollars
9 FTEs

Ontario Together: 2021 Progress Report on Implementation of the TCC Grant| 41
PROFILES:PROFILES: TCC FUNDED PROJECTS TCC FUNDED PROJECTS PROFILES:PROFILES: TCC FUNDED PROJECTS TCC FUNDED PROJECTS
Above: Tree saplings in downtown Ontario funded by TCC investments. Photo credit: City of Ontario
Urban and Community Forestry ProjectUrban and Community Forestry Project
ONTARIO TOGETHER’S URBAN AND COMMUNITY FORESTRY
PROJECT will bring 365 trees to downtown Ontario. The trees — a
mix of drought-tolerant species, including oaks, ginkgoes, and
sycamores — will be planted by the City of Ontario’s Public Works
agency. As the trees mature, they will reduce GHGs by sequestering
carbon and by cooling nearby buildings, which should reduce the
demand for electricity on hot days. Moreover, the trees will help
absorb stormwater runoff during rainy days, thereby reducing the
load on local wastewater treatment facilities.
Under the leadership of Ontario Together’s Community Engagement
Team, a community event will be held to educate local residents of
the importance of trees, how to plant them, and how to maintain
them. Compost from the Ontario Together’s Organics Recycling
Project will also be incorporated into the soil in which the trees are
grown, thereby enhancing soil fertility and water retention.
Key Accomplishments*
» Community meeting held with 20 participants to inform residents about the impacts of the program and tree selection process (also counted towards CEP accomplishments)
» 99 trees planted in parks and along medians within the project area (all trees were 15 gallons in size)
* From award date (January 2018) through the end of FY 2019-’20 (June 2020)

42 |Ontario Together: 2021 Progress Report on Implementation of the TCC Grant
Estimated Benefits Over Project Lifetime
Launch date
June 2020Anticipated completion date
February 2024 Project lifetime (post-implementation)
40 years
TCC grant funds
$529,821Leveraged funds
$11,463
Estimated Benefits Over Project Lifetime
GHG emissions reductions
857 MTCO2eAvoided stormwater runoff
3,750,056 gallons Energy cost savings
$222,568
Direct jobs from TCC dollars
6 FTEsIndirect jobs from TCC dollars
1 FTEInduced jobs from TCC dollars
2 FTEs
PROFILES:PROFILES: TCC FUNDED PROJECTS TCC FUNDED PROJECTS
Responses to COVID-19
»Trees were planted by a contractor in lieu of community plantings
»Community workshop was moved to a virtual environment

Ontario Together: 2021 Progress Report on Implementation of the TCC Grant | 43
Ontario residents participate in a walking club event (taken prior to TCC implementation), which is one of several programs offered in the community as part of the Healthy Ontario Initiative. Photo credit: City of Ontario
LEVERAGED PROJECTS are those that further the goals of TCC investments and use entirely external
sources of funding. In the case of Ontario Together, there are two leveraged projects that are helping
lay the foundation for local economic and health transformation, namely: (1) the Healthy Ontario
Initiative and (2) the Small Business Support Program. The Healthy Ontario Initiative will work in
concert with active transportation projects and the organics recycling project by connecting residents
with opportunities to exercise safely and farm locally. The Small Business Support Program will enhance
the impact of the Workforce Development Plan (WDP) by fostering economic innovation that leads to
skilled employment opportunities for residents. The following section provides an overview of the two
leveraged projects underway in Ontario.
PROFILES: PROFILES:
LEVERAGED PROJECTS LEVERAGED PROJECTS

44 | Ontario Together: 2021 Progress Report on Implementation of the TCC Grant
Healthy Ontario InitiativeHealthy Ontario Initiative
Zūm Up! (a fitness and leadership class) offered in October 2019 to Ontario residents free of charge. Photo credit: City of Ontario
PROFILES:PROFILES: LEVERAGED PROJECTS LEVERAGED PROJECTS PROFILES:PROFILES: LEVERAGED PROJECTS LEVERAGED PROJECTS
THE HEALTHY ONTARIO INITIATIVE (HOI) is a long-term,
multifaceted endeavor underway in Ontario that aims to broadly im-
prove community health. The initiative works in concert with Ontario
Together’s active transportation projects to provide safe opportunities
for residents to engage in physical activity, and the organics recycling
project to connect residents with compost for local food production.
The Initiative was launched in 2007 and is coordinated by the City of
Ontario’s Planning Department in collaboration with private health care
providers (Kaiser Permanente, San Antonio Regional Hospital), com-
munity-based organizations (Social Impact Artists, Huerta del Valle),
school districts, and community residents. The initiative utilizes only
leveraged funds, including a competitive grant awarded in 2012 by Kai-
ser Permanente’s Healthy Eating Active Living (HEAL) Zone Initiative.
The City of Ontario is in the process of reviewing and enhancing the
Healthy Ontario Initiative as part of the General Plan Update.
Key Accomplishments*
» 805 free Zūm-Up! fitness and leadership classes provided for the community with a combined attendance of 6,946 participants
» 92 walking club activities (e.g., community walk, hike, etc.) that served a total of 67 unduplicated participants
» 32 nutritional classes that served a total of 108 unduplicated participants
»21 HOI community forums held with residents about available resources in the community (including those offered by TCC), engaging a total of 217 unduplicated participants
* From award date (January 2018) through the end of FY 2019-’20 (June 2020)

Ontario Together: 2021 Progress Report on Implementation of the TCC Grant | 45
Project Details
Launch date
May 2007Anticipated completion date
OngoingTCC grant funds
$0Leveraged funds
$333,595
PROFILES:PROFILES: LEVERAGED PROJECTS LEVERAGED PROJECTS PROFILES:PROFILES: LEVERAGED PROJECTS LEVERAGED PROJECTS
USING A COMMUNITY-BASED APPROACH to wellness, HOI seeks to make changes at multiple levels to bring about improved health outcomes. The initiative has four main strategies for improving health in the community: (1) prevention and wellness; (2) health care access and utiliza-tion; (3) education and lifelong learning; and (4) safe and complete neighborhoods.
To prevent chronic disease and improve general wellness, the City of Ontario offers a number of services, programs, and facilities that support individuals who want to take a proactive approach to their health by eating healthy and being physically active. Within the project area, healthy eating resources include nutrition classes at the Dorothy A. Quesada Community Center, and free produce (in ex-change for volunteer hours) at Huerta del Valle, Ontario’s first community garden. Physical recreation resources within the project area include a weekly walking club along three miles of Euclid Avenue (a historic, tree-lined bou-levard through the heart of Ontario) and free Zūm Up! fitness classes offered six days per week at four different community centers within the project area. The Zūm Up! fitness classes couple Zumba© instruction with leadership skill development.
With respect to health care access, HOI partners with health care providers and local, regional, state, and feder-al agencies to attract and retain a diversity of affordable, quality health care facilities and providers to serve the en-
tire community. Initiative partners then conduct targeted outreach to connect residents to health care resources.
Within the HOI framework, educational attainment is con-sidered a key social determinant of health and wellness. Thus, the initiative seeks to provide a range of educational and training opportunities for residents of all ages and abilities to advance in their education or professional development. Within the project area, educational and training referrals are offered at the city library and four community centers. Referral opportunities include math classes, citizenship classes, and literacy classes, among other opportunities. The city library also houses a veterans resource center staffed by volunteers trained to help veter-ans access public benefits and financial aid for educational advancement.
The HOI framework also recognizes neighborhood safety and completeness as important social determinants of physical and mental health. The initiative defines a safe and complete neighborhood as one that serves most of the daily needs of its residents within an ideal walking distance of a quarter to a half mile, with convenient pathways of travel in which residents face minimal risk of harm. Within the project area, neighborhood safety and completeness efforts include holistic programming at health hubs where residents can get multiple needs met, such as the Huerta del Valle community garden, the Dorothy A. Quesada Community Center and De Anza Community Center.
Responses to COVID-19
» All in-person programming has been suspended
» Zūm-Up! classes were recorded and posted online
» Outdoor recreational facilities remained open to the public, except for playgrounds, which must remain closed per state public health guidelines

46 | Ontario Together: 2021 Progress Report on Implementation of the TCC Grant
CARLOS DORANTES has learned firsthand the role that food can play in one’s physical and mental health. Dorantes is a father of two children and has lived in Ontario for over 10 years. His younger son struggles with mental illness, which has motivated Dorantes to explore different avenues for improving his son’s quality of life and overall well-being.
Dorantes first learned about HOI after encountering one of the city’s outreach workers stationed at a table in a park. After chatting with the outreach worker about the various health-related programs offered in the community, Dorantes attended the free 10-week Healthy Ontario Plate Nutrition and Wellness class at the Veterans Memorial Community Center, one of the health hubs located in the project area. There he learned about how to prepare low-cost, healthy meals at home.
“The nutrition classes have changed the way I eat.
I’m cooking more meals at home, eating out less, and buying more fruits
and vegetables. My kids especially like the chia seed pudding that we learned to
make in class together.”
In addition to inspiring new food choices, the nutrition and wellness class has also led to larger behavioral changes in the Dorantes home. Dor-antes recalls his younger son being shy and unwilling to spend time with the family. Now cooking has become
STORIES FROM THE COMMUNITY
Initiative inspires residents to get well and give backInitiative inspires residents to get well and give back
one of the activities they do as a family. The Dorantes family has also started to exercise together on a daily basis.
“Our doctor commented on how surprised he was by the dramatic improvement
in my youngest son’s health. Eating healthier and
exercising more has had such a positive impact on
his life.”
Now that Dorantes is connected with the programming at Ontario’s health hubs, he has also become more involved in the community and par-ticipates in the monthly engagement forums. At these forums, residents provide input about the design and implementation of HOI, to ensure that it continues to address the communi-ty’s health concerns. The experience has inspired Dorantes to start recruit-ing other residents in his network to join the engagement forum and to access the free programming offered through HOI.
[ Continues to next page ]
Carlos Dorantes and Plate Nutrition Health Coach Rosalba Martinez at the Veterans Memorial Community Center in 2019. Photo credit: Evette de Luca
PROFILES:PROFILES: LEVERAGED PROJECTS LEVERAGED PROJECTS PROFILES:PROFILES: LEVERAGED PROJECTS LEVERAGED PROJECTS

Ontario Together: 2021 Progress Report on Implementation of the TCC Grant | 47
PROFILES:PROFILES: LEVERAGED PROJECTS LEVERAGED PROJECTS PROFILES:PROFILES: LEVERAGED PROJECTS LEVERAGED PROJECTS
ROSARIO SANTILLAN is anoth-er Ontario resident who has made dramatic changes in her life as a result of HOI. Santillan has been a resident of Ontario for nearly 30 years and has raised her two sons in the commu-nity. About eight years ago, her life took an unexpected and unwelcome turn when she suffered an accidental injury that made physical movement challenging. The immobility began to wear on her physical and mental health, causing her to gain weight and become depressed. To compound her problems, Santillan’s blood pressure began to climb and she was eventually diagnosed with prediabetes.
Santillan was eager to take charge of her health and began taking free Zum-ba classes at the Dorothy A. Quesada Community Center. The center is one of five health hubs created in Ontario as part of a Kaiser Permanente initia-tive designed to make healthy choices more accessible to individuals and
families in areas of need. The center also provides a free gym and nutrition classes, which Santillan learned about from her Zumba classmates and incor-porated into her recovery plan.
“I feel so much better – I’ve lost over 67 pounds, have
normal blood pressure without medication,
wonderful new friends, and I’m not prediabetic or
depressed anymore.”
Santillan’s experience has inspired her to become more involved in trans-forming public health outcomes in her community. She’s now on the other side of the stage, teaching a weekly Zumba class at the Dorothy A. Que-sada Community Center. Additionally,
Santillan serves as a resident leader and helps others in the community to become healthy and stay that way. To serve as a community leader, residents must graduate from the HOI lead-ership academy, a two-month pro-gram that teaches advocacy and civic engagement skills alongside health systems literacy.
On top of everything, Santillan also serves as the ex officio delegate within Ontario’s TCC Trustees, the gover-nance body for local implementation of Ontario’s TCC award. She was nom-inated to this position by the Healthy Ontario Neighborhood Council, a separate oversight body that focuses on the implementation of HOI. At TCC Trustee meetings, Santillan serves as a representative of residents in the TCC project area, reporting on questions and comments she’s encountered from other residents through her work in community engagement.
“I teach Zumba, not
because it’s my job, but
because I love it. I am
convinced that it works,
I’ve seen it transform
my life and now I want
to spread the word.”
STORIES FROM THE COMMUNITY
Rosario Santillan in November 2019 at the Dorothy A. Quesada Community Center where she teaches a Zūm Up! class.
Photo credit: UCLA Luskin Center for Innovation
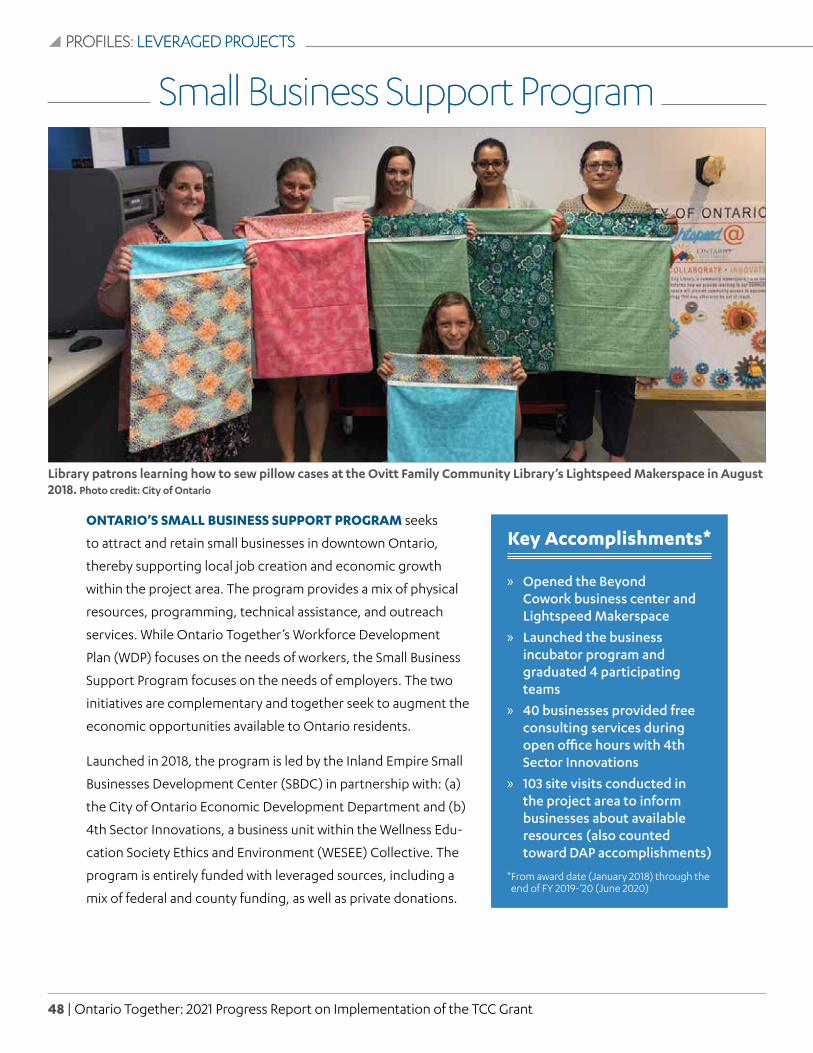
48 | Ontario Together: 2021 Progress Report on Implementation of the TCC Grant
Library patrons learning how to sew pillow cases at the Ovitt Family Community Library’s Lightspeed Makerspace in August 2018. Photo credit: City of Ontario
Small Business Support ProgramSmall Business Support Program
ONTARIO’S SMALL BUSINESS SUPPORT PROGRAM seeks
to attract and retain small businesses in downtown Ontario,
thereby supporting local job creation and economic growth
within the project area. The program provides a mix of physical
resources, programming, technical assistance, and outreach
services. While Ontario Together’s Workforce Development
Plan (WDP) focuses on the needs of workers, the Small Business
Support Program focuses on the needs of employers. The two
initiatives are complementary and together seek to augment the
economic opportunities available to Ontario residents.
Launched in 2018, the program is led by the Inland Empire Small
Businesses Development Center (SBDC) in partnership with: (a)
the City of Ontario Economic Development Department and (b)
4th Sector Innovations, a business unit within the Wellness Edu-
cation Society Ethics and Environment (WESEE) Collective. The
program is entirely funded with leveraged sources, including a
mix of federal and county funding, as well as private donations.
PROFILES:PROFILES: LEVERAGED PROJECTS LEVERAGED PROJECTS PROFILES:PROFILES: LEVERAGED PROJECTS LEVERAGED PROJECTS
Key Accomplishments*
» Opened the Beyond Cowork business center and Lightspeed Makerspace
» Launched the business incubator program and graduated 4 participating teams
» 40 businesses provided free consulting services during open office hours with 4th Sector Innovations
» 103 site visits conducted in the project area to inform businesses about available resources (also counted toward DAP accomplishments)
* From award date (January 2018) through the end of FY 2019-’20 (June 2020)

Ontario Together: 2021 Progress Report on Implementation of the TCC Grant | 49
PROFILES:PROFILES: LEVERAGED PROJECTS LEVERAGED PROJECTS PROFILES:PROFILES: LEVERAGED PROJECTS LEVERAGED PROJECTS
PHYSICAL RESOURCESThe Small Business Support Program offers two publicly accessible spaces to the community for commercial activities: (1) Lightspeed Makerspace and (2) Beyond Cowork.
The Lightspeed Makerspace opened in August 2018 and is located at the Ovitt Family Community Library in downtown Ontario. The space pro-vides library card holders with access to a laser cutter, electronics and circuits, robotics, and other high-tech equipment that can be used for a variety of manufacturing applications. These physical applications align with the technology curriculum offered to students in the Ontario-Montclair School District, which exposes stu-dents to programming, coding and elementary circuitry, and computer- aided design.
Beyond Cowork opened in January 2020 in a vacant, city-owned building on Euclid Avenue in downtown On-tario. The City of Ontario worked with 4th Sector Innovations to transform the former boxing gym into a publicly accessible business center with hot desks, conference rooms, a media studio, and workspaces that can be reserved in advance. The facility also includes a coffee shop and tap house for more informal meetings.
PROGRAMMING In 2020, the City of Ontario worked with 4th Sector Innovations to launch two new programs for entrepre-neurs in the commerce and logistics sector: (1) business incubator pro-gram, known locally as Interphase; and (2) business accelerator program, known locally as Instantaneous. Both programs are free and nondilutive (they do not require equity in the
company), and are open to firms of all sizes.
The incubator program works with entrepreneurs for a nine-month pe-riod to test the viability of their ideas before they invest resources into cre-ating their product. Participants meet weekly to go through learning mod-ules on early business development and discuss their progress with peers and industry experts. The first cohort of entrepreneurs, four business teams in total, graduated from the incubator program in June 2020.
The accelerator program works with entrepreneurs who have a viable busi-ness idea and are ready to start the process of commercialization. Partic-ipants meet weekly for three months and complete a curriculum to assess the scalability of their idea, perfect their pitch, and start securing inves-tors. The first cohort of entrepreneurs
will begin in the fall of FY 2020-’21.
TECHNICAL ASSISTANCEIn addition to offering structured pro-gramming, the City of Ontario offers ad hoc technical assistance services for local businesses. Every week, staff from 4th Sector Innovations hold free office hours in which members from the community can pose questions related to business development, such as financing, marketing, and contract-ing.
BUSINESS OUTREACHTo inform businesses about the afore-mentioned resources and services, the City of Ontario is conducting tar-geted outreach within the TCC project area. Outreach activities are conduct-ed by SBDC and the City of Ontario Economic Development Department through mailers, phone calls, email blasts, social media posts, and in-per-son site visits.
Responses to COVID-19
» Reconfigured Beyond Cowork business center to be compliant with county public health guidelines
» Moved incubator program to a virtual setting and modified curriculum to address business solutions to COVID-19 (See following “Stories from the Community” on pages 50 and 51 for more information)
Project Details
Launch date
November 2018
Anticipated completion date
OngoingTCC grant funds
$0Leveraged funds
$1,000,489

50 | Ontario Together: 2021 Progress Report on Implementation of the TCC Grant
STORIES FROM THE COMMUNITY
Business Incubator Program Provides Business Incubator Program Provides Community and InspirationCommunity and Inspiration
Michael Lim, Co-Founder of Xtelligent and graduate of Ontario’s business incubator program, presents his business model to transportation experts on a trip to the United Kingdom in February 2020. Photo credit: CoMotion Ontario
MICHAEL LIM is co-founder of Xtelligent, a transportation technol-ogy company that replaces outdated traffic signal systems with more in-telligent technologies. The company uses the latest research in network control and artificial intelligence to lay the groundwork for safe integration of multimodal transportation and au-tomated vehicles. Until recently, Lim’s entire operation has been based out of Downtown Los Angeles, but he has since expanded Xtelligent’s presence to Downtown Ontario to take advan-tage of the city’s suite of services for entrepreneurs in the commerce and logistics sector.
“The primary benefit of being part of Ontario’s
ecosystem is access to city staff who are willing to
work with you to pilot new technologies. Without their
cooperation and support, we can’t really make
progress.”
Lim’s working relationship with the City of Ontario began in November 2019, when he joined the first cohort of entrepreneurs to go through the city’s business incubator program. The program helps entrepreneurs flesh out their vision for a new product or service through learning modules on early business development, such as stakeholder discovery, assumption testing, and risk assessment. The program also provides a platform for
peer-to-peer learning and partnership building opportunities. Lim found that latter component to be most bene-ficial, as his business model requires buy-in from local governments and delivery service companies.
“The program has helped broker private and public sector partnerships that
can provide guidance and support, particularly to
identify the problems that our technology is well
suited to address.”
ONCE THE PANDEMIC HIT, the program’s weekly in-person sessions moved to a virtual format, and the curriculum was modified to include sessions on how businesses could help
the response to COVID-19. That shift has challenged Lim to think about how Xtelligent can help make the transpor-tation sector more resilient to emer-gencies. For example, when there’s a greater demand for emergency response vehicles, such as ambulanc-es and fire engines, then Xtelligent’s signal systems could give emergency vehicles priority at the intersection so that they don’t have to run a red light, with all the safety hazards that presents.
“The incubator facilitated conversations about how to turn lemons into lemonade,
about how to pivot one’s business model to be
more aligned with the new normal and still add value.”
[ Continues to next page ]
PROFILES:PROFILES: LEVERAGED PROJECTS LEVERAGED PROJECTS PROFILES:PROFILES: LEVERAGED PROJECTS LEVERAGED PROJECTS

Ontario Together: 2021 Progress Report on Implementation of the TCC Grant | 51
STORIES FROM THE COMMUNITY
After completing the incubator pro-gram, Lim plans to focus on solidifying partnerships that were born out of the program, and then hopefully roll out Xtelligent’s traffic signal technology directly in Ontario. Lim is also inter-ested in exploring Ontario’s talent pool and potentially recruiting some support staff for Xtelligent. Ontario Together’s Workforce Development Plan (WDP) works synergistically with the incubator program in this regard, as the former serves to create the qualified labor force for the latter.
ERIC CHAFFEY is another entrepre-neur who was attracted to Ontario’s incubator program to flesh out his business idea. While working as a delivery driver on several different web-based platforms, Chaffey saw a need for a business intelligence product to help drivers optimize their work schedules and routes, thereby minimizing their vehicle miles traveled and maximizing their take-home pay. New to the transportation technology arena, Chaffey saw the incubator program as a way to get constructive feedback from other entrepreneurs who may have tried and failed at simi-lar ventures.
“When you’re in an environment like the
incubator program, with like-minded people who
are very passionate about their product or their
idea, it’s encouraging and enlightening.”
THE STRESSORS OF COVID-19 made Chaffey particularly grateful to be part of the incubator community. The
Eric Chaffey, incubator program graduate, delivering his final pitch during the program. Photo credit: 4th Sector Innovations
weekly interactions with his peers kept Chaffey motivated to keep work-ing on his product, and the incubator program’s emphasis on innovation and resilience inspired Chaffey to take his idea in new, but complementary, directions.
“Being part of the incubator during the pandemic made me think about developing
a way for drivers to be more active in their local
community, like delivering PPE or disinfectant to those
who need to it.”
Now that he’s graduated the incuba-tor program, Chaffey hopes to enroll
in Ontario’s accelerator program once he’s done refining his business model. The accelerator program augments the incubator program’s curriculum and helps entrepreneurs start the process of commercialization. Chaf-fey also plans to stay connected to contacts he made in the incubator program, and potentially join forces on future business ventures.
“I’m going to stay in touch with everybody in the incubator. If I have the
opportunity to sit down and do a commercial project
with them, then that would be amazing as well.”
PROFILES:PROFILES: LEVERAGED PROJECTS LEVERAGED PROJECTS PROFILES:PROFILES: LEVERAGED PROJECTS LEVERAGED PROJECTS

52 | Ontario Together: 2021 Progress Report on Implementation of the TCC Grant
Appendix 1: Supplemental MapsAppendix 1: Supplemental Maps
Detailed project map. Figure credit: City of Ontario
APPENDICES APPENDICES

Ontario Together: 2021 Progress Report on Implementation of the TCC Grant | 53
Maps depicting the scale of the TCC project area. Figure credit: UCLA Luskin Center for Innovation

54 | Ontario Together: 2021 Progress Report on Implementation of the TCC Grant
Appendix 2: Appendix 2: Summary of Methods for Estimating Project BenefitsSummary of Methods for Estimating Project Benefits
Benefit Methodology Version
Avoided stormwater runoff iTree Planting 1.2.0
Energy cost savings California Air Resources Board (CARB) Co-benefit Assessment Methodology for Energy and Fuel Cost Savings14
September 13,2019
Greenhouse gas (GHG) reductionsCARB GHG Quantification Methodologies by Project Type
FY 2016-17
Jobs (direct, indirect, induced) CARB Job Co-benefit Assessment Methodology April 2019
Travel cost savingsCARB Co-benefit Assessment Methodology for Travel Cost Savings15
October 18, 2019
Vehicle miles traveled (VMT) reductionsCARB GHG Quantification Methodologies by Project Type
FY 2016-17
14 CARB’s energy and fuel cost savings methodology does not provide an explicit example of how to calculate cost savings from urban forestry and greening projects. Nonetheless, CARB’s methodology does provide a basic framework for estimating cost savings from any project that achieves energy use reductions: (energy cost savings = net decline in energy use X per unit cost of energy). Thus, for urban forestry and urban greening projects, the UCLA-UCB evaluation team estimated energy cost savings by taking two outputs from iTree (annual electricity savings and annual natural gas savings) and multiplying these outputs by their per unit cost (as based on cost assumptions from Appendix A of CARB’s energy cost savings methodology). The evaluation team then scaled up these costs by 40 years and prorated them according to the percentage of trees that actually shade buildings (and therefore have a meaningful impact on electricity and gas use).
15 To calculate travel cost savings, CARB’s travel cost savings methodology relies on estimates about changes in transit ridership. For Affordable Housing and Sustainable Communities (AHSC) projects, subsequent changes in ridership are unknown, and CARB’s methodology does not provide a method for calculating travel cost savings in the face of that unknown. Thus, the UCLA-UCB evaluation team expanded upon CARB’s methodology by estimating travel cost savings from AHSC projects without ridership estimates. To do so, the evaluation team conservatively assumes the following: (1) VMT reductions associated with the AHSC projects are achieved by drivers who switch to the most expensive alternative mode (which between transit, biking, and walking would be transit); (2) all individuals in the apartment complex will take transit so often that they buy a monthly transit pass because that’s the most economical thing to do at high levels of transit ridership; and (3) that all individuals in the apartment complex buy a pass for the duration of the project lifetime (less the number of months for which they receive a free pass). The evaluation team estimated the number of individuals in the apartment complex by multiplying the number of units by the average household size for the TCC census tracts.
APPENDICESAPPENDICES APPENDICESAPPENDICES

Ontario Together: 2021 Progress Report on Implementation of the TCC Grant | 55
Appendix 3 Appendix 3 Ontario Together Trustees Ontario Together Trustees
Member Membership Type
City of Ontario Grantee
Virginia-Holt Housing LP Project Partner
Ontario Housing Authority Project Partner
Huerta del Valle Project Partner
Social Impact Artists Project Partner
GRID Alternatives Inland Empire Project Partner
Omnitrans Project Partner
San Bernardino County Workforce Development Department Project Partner
San Bernardino County Public Health Department Project Partner
Inland Empire Small Business Development Center Project Partner
Center for Community Action and Environmental Justice Stakeholder
Safe Routes to School National Partnership Stakeholder
Ontario-Montclair Schools Foundation Stakeholder
Inland Mediation Board, DBA Inland Fair Housing and Mediation Board Stakeholder
Mercy House Stakeholder
Neighborhood Partnership Housing Services Stakeholder
San Bernardino County Transportation Authority Stakeholder
Rosario Santillan Ex Officio Delegate
APPENDICESAPPENDICES APPENDICESAPPENDICES

56 | Ontario Together: 2021 Progress Report on Implementation of the TCC Grant
Appendix 4: Appendix 4: Ontario Together TCC Census TractsOntario Together TCC Census Tracts
Census Tract GeoID Number City
Population (ACS 2011-2016
estimate)Area
(sq. mi.)Population Density
(pop./ sq.mi.)
14000US06071001600 Ontario 5,742 4.80 1,197
14000US06071001702 Ontario 5,073 0.97 5,257
14000US06071001400 Ontario 2,611 0.44 5,902
14000US06071001813 Ontario 4,898 0.60 8,187
14000US06071001707 Ontario 6,740 0.66 10,211
14000US06071001812 Ontario 3,715 0.34 10,831
14000US06071001504 Ontario 5,571 0.50 11,240
14000US06071001706 Ontario 5,924 0.43 13,765
14000US06071001501 Ontario 4,177 0.29 14,393
APPENDICESAPPENDICES APPENDICESAPPENDICES

Ontario Together: 2021 Progress Report on Implementation of the TCC Grant | 57
Appendix 5: Appendix 5: Ontario Together Control Census TractsOntario Together Control Census Tracts
Census Tract GeoID Number City
Population (ACS 2011-2016
estimate)Area
(sq. mi.)
Population Density
(pop./ sq.mi.)
14000US06071000603 Chino / Ontario 5,090 0.87 5,852
14000US06071003803 Rialto / San Bernardino 5,222 0.64 8,193
14000US06071000207 Montclair 4,744 0.49 9,770
14000US06071002804 Fontana 5,958 0.39 15,377
14000US06071002602 Fontana 7,616 0.78 9,802
14000US06071002902 Fontana 6,579 0.75 8,762
14000US06071003200 Fontana 8,724 1.00 8,719
14000US06071003102 Fontana 5,939 0.50 11,850
14000US06071003301 Fontana 5,111 0.75 6,830
14000US06071003101 Fontana 4,638 0.53 8,711
14000US06071003509 Rialto 4,335 0.75 5,760
14000US06071004700 San Bernardino 5,143 0.77 6,677
14000US06071004604 San Bernardino 5,438 0.94 5,755
14000US06071006700 Colton 4,424 0.73 6,023
14000US06071007000 Colton 6,880 0.88 7,836
14000US06071000201 Montclair 4,455 1.14 3,923
14000US06071003401 Fontana 7,453 1.00 7,448
14000US06071000904 Upland 3,273 0.45 7,321
14000US06071001104 Ontario 5,783 0.69 8,356
14000US06071001001 Ontario 5,500 0.56 9,855
14000US06071001305 Ontario 4,621 0.46 10,153
14000US06071003607 Rialto 5,626 0.71 7,974
14000US06071006604 Colton 3,883 0.38 10,299
14000US06071002204 Unincorporated / Fontana 7,039 7.45 945
14000US06071006302 Unincorporated / San Bernardino / Highland 9,383 1.00 9,365
14000US06071000303 Unincorporated / Montclair 7,799 0.81 9,639
14000US06071002402 Unincorporated / Fontana 8,166 1.51 5,418
14000US06071002401 Unincorporated / Fontana 8,847 1.52 5,818
14000US06071002501 Unincorporated / Fontana 6,185 1.54 4,017
14000US06071003302 Unincorporated / Fontana 6,097 1.04 5,854
APPENDICESAPPENDICES APPENDICESAPPENDICES

58 | Ontario Together: 2021 Progress Report on Implementation of the TCC Grant
Appendix 6: Appendix 6: Indicator DataIndicator Data
Appendix 6.1: Demographics
Table A6.1.1: American Community Survey (ACS) Demographic Indicators*Time
Period (ACS 5-Year
sample)
Estimate for
TCC Tracts MOE
Estimate for
Control Tracts MOE
Estimate for San
Bernardino County MOE
Estimate for
California MOE
Total Population (B01003) 2009-2013 47,203 1,756 179,329 3,345 2,056,915 0 37,659,181 0
2010-2014 48,364 1,721 179,541 3,182 2,078,586 0 38,066,920 0
2011-2015 47,102 1,605 179,944 2,973 2,094,769 0 38,421,464 0
2012-2016 48,442 1,471 179,951 2,976 2,106,754 0 38,654,206 0
2013-2017 49,834 1,493 182,092 2,884 2,121,220 0 38,982,847 0
2014-2018 50,922 1,403 182,411 3,019 2,135,413 0 39,148,760 0
2015-2019 49,016 1,413 185,013 3,121 2,149,031 0 39,283,497 0
Percent Hispanic, all races (B03002)
2009-2013 79.9% 2.5% 78.2% 1.2% 49.9% 0.0% 37.9% 0.0%
2010-2014 80% 2.1% 78.4% 1.2% 50.5% 0.0% 38.2% 0.0%
2011-2015 78.7% 2.2% 78.2% 1.1% 51.1% 0.0% 38.4% 0.0%
2012-2016 78.6% 2.0% 78.5% 1.1% 51.7% 0.0% 38.6% 0.0%
2013-2017 78% 2.0% 78.7% 1.1% 52.3% 0.0% 38.8% 0.0%
2014-2018 78.7% 1.8% 79.1% 1.2% 52.8% 0.0% 38.9% 0.0%
2015-2019 78.9% 2.1% 79.2% 1.3% 53.3% 0.0% 39.0% 0.0%
Percent White, non-Hispanic (B03002)
2009-2013 11.8% 1.4% 12.1% 0.7% 32.5% 0.0% 39.7% 0.0%
2010-2014 11.1% 1.2% 12.5% 0.7% 31.8% 0.0% 39.2% 0.0%
2011-2015 11.8% 1.4% 12.0% 0.7% 31.2% 0.0% 38.7% 0.0%
2012-2016 10.4% 1.1% 11.7% 0.7% 30.5% 0.0% 38.4% 0.0%
2013-2017 10.5% 1.1% 11.9% 0.6% 29.8% 0.0% 37.9% 0.0%
2014-2018 9.4% 0.9% 11.7% 0.7% 29.2% 0.0% 37.5% 0.0%
2015-2019 9.9% 1.0% 11.6% 0.7% 28.5% 0.0% 37.2% 0.0%
Percent all communities of color, non-Hispanic: Black, Asian, Pacific Islander, American Indian, Other, and Two or More Races (B03002)
2009-2013 8.3% 1.2% 9.7% 0.8% 17.6% 0.2% 22.4% 0.0%
2010-2014 8.9% 1.2% 9.1% 0.8% 17.7% 0.2% 22.7% 0.0%
2011-2015 9.5% 1.2% 9.8% 0.9% 17.7% 0.2% 22.9% 0.0%
2012-2016 11.0% 1.4% 9.7% 0.9% 17.8% 0.2% 23.1% 0.0%
2013-2017 11.5% 1.3% 9.4% 0.8% 17.9% 0.2% 23.3% 0.0%
2014-2018 11.9% 1.4% 9.2% 0.8% 18.0% 0.2% 23.6% 0.0%
2015-2019 11.2% 1.3% 9.3% 0.8% 18.2% 0.2% 23.8% 0.0%
* MOEs for the county and the state are obtained directly from the U.S. Census Bureau. MOEs for TCC and control census tracts are de-rived by the UCLA Luskin Center for Innovation in accordance with the methods described by the U.S. Census Bureau in Understanding and Using American Community Survey Data: What All Data Users Need to Know (2018). All MOEs are reported at the 90% confidence. level.
APPENDICESAPPENDICES APPENDICESAPPENDICES

Ontario Together: 2021 Progress Report on Implementation of the TCC Grant | 59
Time Period
(ACS 5-Yearsample)
Estimate for
TCC Tracts MOE
Estimate for
Control Tracts MOE
Estimate for San
Bernardino County MOE
Estimate for
California MOE
DEMOGRAPHIC-RELATED INDICATORS (CONTINUED)
Percent other communities of color, non-Hispanic: Pacific Islander, American Indian, Other, Two or More Races
2009-2013 1.3% 0.6% 2.0% 0.4% 3.0% 0.1% 3.6% 0.0%
2010-2014 1.5% 0.5% 1.9% 0.4% 3.1% 0.1% 3.7% 0.0%
2011-2015 1.5% 0.5% 1.6% 0.4% 3.1% 0.1% 3.7% 0.0%
2012-2016 1.7% 0.5% 1.6% 0.4% 3.1% 0.1% 3.8% 0.0%
2013-2017 1.9% 0.6% 1.5% 0.4% 3.2% 0.1% 3.9% 0.0%
2014-2018 2.1% 0.6% 1.5% 0.3% 3.3% 0.2% 3.9% 0.0%
2015-2019 1.7% 0.5% 1.4% 0.3% 3.3% 0.1% 4.0% 0.0%
Percent Black, non-Hispanic (B03002)
2009-2013 3.9% 0.8% 5.0% 0.6% 8.3% 0.1% 5.7% 0.0%
2010-2014 4.6% 0.9% 4.6% 0.6% 8.2% 0.1% 5.7% 0.0%
2011-2015 4.4% 0.9% 5.3% 0.7% 8.1% 0.1% 5.6% 0.0%
2012-2016 5.4% 1.1% 5.1% 0.6% 8.1% 0.1% 5.6% 0.0%
2013-2017 5.2% 0.9% 5.1% 0.6% 8.0% 0.1% 5.5% 0.0%
2014-2018 4.7% 0.9% 4.9% 0.6% 7.9% 0.1% 5.5% 0.0%
2015-2019 5.0% 1.0% 4.8% 0.6% 7.9% 0.1% 5.5% 0.0%
Percent Asian, non-Hispanic (B03002)
2009-2013 3.1% 0.7% 2.7% 0.4% 6.3% 0.1% 13.1% 0.0%
2010-2014 2.8% 0.6% 2.6% 0.4% 6.4% 0.1% 13.3% 0.0%
2011-2015 3.6% 0.7% 2.8% 0.4% 6.5% 0.1% 13.5% 0.0%
2012-2016 3.9% 0.8% 3.0% 0.5% 6.6% 0.1% 13.7% 0.0%
2013-2017 4.5% 0.8% 2.8% 0.4% 6.7% 0.1% 13.9% 0.0%
2014-2018 5.0% 0.9% 2.8% 0.4% 6.8% 0.1% 14.1% 0.0%
2015-2019 4.5% 0.7% 3.1% 0.4% 7.0% 0.1% 14.3% 0.0%
Percent Pacific Islanders, non-Hispanic (B03002)
2009-2013 0.0% 0.1% 0.2% 0.2% 0.3% 0.0% 0.4% 0.0%
2010-2014 0.1% 0.2% 0.3% 0.2% 0.3% 0.0% 0.4% 0.0%
2011-2015 0.2% 0.2% 0.3% 0.2% 0.3% 0.0% 0.4% 0.0%
2012-2016 0.2% 0.2% 0.4% 0.3% 0.3% 0.0% 0.4% 0.0%
2013-2017 0.2% 0.2% 0.3% 0.3% 0.3% 0.0% 0.4% 0.0%
2014-2018 0.2% 0.2% 0.3% 0.2% 0.3% 0.0% 0.4% 0.0%
2015-2019 0.1% 0.1% 0.1% 0.1% 0.3% 0.0% 0.4% 0.0%
Percent American Indian, non-Hispanic(B03002)
2009-2013 0.1% 0.1% 0.4% 0.2% 0.4% 0.0% 0.4% 0.0%
2010-2014 0.0% 0.1% 0.3% 0.2% 0.4% 0.0% 0.4% 0.0%
2011-2015 0.1% 0.1% 0.2% 0.2% 0.4% 0.0% 0.4% 0.01%
2012-2016 0.2% 0.1% 0.1% 0.1% 0.3% 0.0% 0.4% 0.01%
2013-2017 0.2% 0.1% 0.1% 0.1% 0.3% 0.0% 0.4% 0.0%
2014-2018 0.2% 0.1% 0.2% 0.1% 0.3% 0.0% 0.4% 0.0%
2015-2019 0.2% 0.1% 0.3% 0.2% 0.4% 0.0% 0.4% 0.0%
APPENDICESAPPENDICES APPENDICESAPPENDICES

60 | Ontario Together: 2021 Progress Report on Implementation of the TCC Grant
Time Period
(ACS 5-Yearsample)
Estimate for
TCC Tracts MOE
Estimate for
Control Tracts MOE
Estimate for San
Bernardino County MOE
Estimate for
California MOE
DEMOGRAPHIC-RELATED INDICATORS (CONTINUED)
Percent two or more races, non-Hispanic (B03002)
2009-2013 0.9% 0.4% 1.3% 0.3% 2.1% 0.1% 2.6% 0.0%
2010-2014 1.1% 0.5% 1.2% 0.3% 2.2% 0.1% 2.7% 0.0%
2011-2015 1.0% 0.4% 1.0% 0.2% 2.2% 0.1% 2.8% 0.0%
2012-2016 0.8% 0.3% 0.9% 0.2% 2.3% 0.1% 2.9% 0.0%
2013-2017 1.2% 0.5% 0.9% 0.2% 2.4% 0.1% 2.9% 0.0%
2014-2018 1.3% 0.4% 0.9% 0.2% 2.4% 0.1% 3.0% 0.0%
2015-2019 1.2% 0.4% 0.9% 0.2% 2.5% 0.1% 3.0% 0.0%
Percent other, non-Hispanic (B03002)
2009-2013 0.3% 0.4% 0.2% 0.1% 0.2% 0.0% 0.2% 0.0%
2010-2014 0.2% 0.2% 0.1% 0.1% 0.2% 0.0% 0.2% 0.0%
2011-2015 0.2% 0.2% 0.1% 0.1% 0.2% 0.0% 0.2% 0.0%
2012-2016 0.4% 0.4% 0.2% 0.1% 0.2% 0.0% 0.2% 0.0%
2013-2017 0.3% 0.3% 0.2% 0.1% 0.2% 0.0% 0.2% 0.0%
2014-2018 0.4% 0.3% 0.1% 0.1% 0.2% 0.0% 0.2% 0.0%
2015-2019 0.2% 0.2% 0.1% 0.1% 0.2% 0.0% 0.3% 0.0%
Percent foreign-born population (B05006)
2009-2013 36.4% 2.3% 32.9% 1.1% 21.1% 0.2% 27.0% 0.1%
2010-2014 36.6% 2.1% 32.3% 1.1% 21.3% 0.3% 27.0% 0.1%
2011-2015 35.3% 1.9% 31.9% 1.0% 21.3% 0.3% 27.0% 0.1%
2012-2016 34.8% 1.7% 32.1% 1.0% 21.3% 0.2% 27.0% 0.1%
2013-2017 33.6% 1.7% 30.7% 1.0% 20.9% 0.2% 27.0% 0.1%
2014-2018 33.8% 1.6% 29.8% 0.9% 21.0% 0.2% 26.9% 0.1%
2015-2019 33.5% 1.8% 30.0% 1.0% 21.0% 0.2% 26.8% 0.1%
Percent born in Asia (B05006)
2009-2013 2.4% 0.5% 2.1% 0.3% 4.7% 0.1% 9.8% 0.0%
2010-2014 2.2% 0.5% 2.1% 0.3% 4.8% 0.1% 10.0% 0.0%
2011-2015 2.8% 0.6% 2.3% 0.4% 5.0% 0.1% 10.1% 0.0%
2012-2016 3.0% 0.6% 2.5% 0.4% 5.0% 0.1% 10.2% 0.0%
2013-2017 3.1% 0.6% 2.4% 0.4% 5.0% 0.1% 10.4% 0.0%
2014-2018 3.3% 0.6% 2.4% 0.4% 5.1% 0.1% 10.5% 0.0%
2015-2019 3.4% 0.6% 2.8% 0.5% 5.2% 0.1% 10.6% 0.0%
Percent born in Africa (B05006)
2009-2013 0.1% 0.1% 0.2% 0.1% 0.5% 0.1% 0.4% 0.0%
2010-2014 0.1% 0.1% 0.2% 0.1% 0.5% 0.1% 0.4% 0.0%
2011-2015 0.2% 0.2% 0.2% 0.1% 0.5% 0.1% 0.4% 0.0%
2012-2016 0.2% 0.2% 0.3% 0.1% 0.5% 0.1% 0.5% 0.0%
2013-2017 0.2% 0.2% 0.2% 0.1% 0.5% 0.1% 0.5% 0.0%
2014-2018 0.2% 0.2% 0.2% 0.1% 0.4% 0.1% 0.5% 0.0%
2015-2019 0.2% 0.2% 0.2% 0.1% 0.4% 0.0% 0.5% 0.0%
APPENDICESAPPENDICES APPENDICESAPPENDICES

Ontario Together: 2021 Progress Report on Implementation of the TCC Grant | 61
Time Period
(ACS 5-Yearsample)
Estimate for
TCC Tracts MOE
Estimate for
Control Tracts MOE
Estimate for San
Bernardino County MOE
Estimate for
California MOE
DEMOGRAPHIC-RELATED INDICATORS (CONTINUED)
Percent born in Latin America (B05006)
2009-2013 0.1% 0.2% 0.1% 0.0% 0.2% 0.0% 0.2% 0.0%
2010-2014 0.2% 0.2% 0.1% 0.1% 0.2% 0.0% 0.2% 0.0%
2011-2015 31.8% 1.9% 29.0% 1.0% 14.9% 0.2% 14.2% 0.1%
2012-2016 31.1% 1.7% 28.8% 1.0% 14.9% 0.2% 14.0% 0.0%
2013-2017 29.6% 1.7% 27.7% 0.9% 14.5% 0.2% 13.8% 0.1%
2014-2018 29.7% 1.6% 26.9% 0.9% 14.5% 0.2% 13.7% 0.1%
2015-2019 0.0% 0.0% 0.0% 0.0% 0.0% 0.0% 0.1% 0.0%
APPENDICESAPPENDICES APPENDICESAPPENDICES

62 | Ontario Together: 2021 Progress Report on Implementation of the TCC Grant
Time Period
(ACS 5-Yearsample)
Estimate for
TCC Tracts MOE
Estimate for
Control Tracts MOE
Estimate for San
Bernardino County MOE
Estimate for
California MOE
Median household income (B19001)
2009-2013 $43,547 N/A $43,503 N/A $54,090 $511 $61,094 $157
2010-2014 $44,019 N/A $43,993 N/A $54,100 $452 $61,489 $154
2011-2015 $43,398 N/A $44,516 N/A $53,433 $571 $61,818 $156
2012-2016 $44,335 N/A $45,894 N/A $54,469 $559 $63,783 $188
2013-2017 $46,959 N/A $49,769 N/A $57,156 $594 $67,169 $192
2014-2018 $50,112 N/A $51,731 N/A $60,164 $626 $71,228 $217
2015-2019 $53,180 N/A $54,368 N/A $63,362 $581 $75,235 $232
Percent of individuals living below poverty (B17001)
2009-2013 27.5% 3.3% 25.1% 1.7% 18.7% 0.5% 15.9% 0.1%
2010-2014 26.5% 3.0% 24.3% 1.6% 19.2% 0.4% 16.4% 0.1%
2011-2015 25.2% 2.5% 24.1% 1.5% 19.5% 0.4% 16.3% 0.1%
2012-2016 23.9% 2.5% 22.3% 1.5% 19.1% 0.4% 15.8% 0.1%
2013-2017 21.9% 2.3% 20.3% 1.4% 18.2% 0.4% 15.1% 0.1%
2014-2018 20.1% 2.3% 19.2% 1.4% 17.3% 0.4% 14.3% 0.1%
2015-2019 17.6% 2.1% 18.7% 1.4% 16.0% 0.3% 13.4% 0.1%
Percent high income ($125k +) (B19001)
2009-2013 5.7% 1.3% 5.2% 0.7% 13.1% 0.3% 19.9% 0.1%
2010-2014 5.1% 1.1% 5.6% 0.7% 13.4% 0.3% 20.4% 0.1%
2011-2015 4.8% 1.0% 5.7% 0.7% 13.2% 0.3% 20.9% 0.1%
2012-2016 5.7% 1.2% 5.7% 0.7% 13.9% 0.3% 22.1% 0.1%
2013-2017 8.1% 1.4% 6.8% 0.7% 15.3% 0.4% 23.9% 0.1%
2014-2018 9.9% 1.6% 8.8% 0.9% 17.1% 0.4% 26.1% 0.1%
2015-2019 11.0% 1.6% 9.7% 0.9% 18.6% 0.4% 28.0% 0.1%
Percent with less than high school education (S1501)
2009-2013 40.7% 2.9% 38.4% 1.4% 21.8% 0.3% 18.8% 0.1%
2010-2014 41.7% 2.7% 38.6% 1.4% 21.7% 0.3% 18.5% 0.1%
2011-2015 40.1% 2.6% 37.5% 1.3% 21.4% 0.3% 18.2% 0.1%
2012-2016 39.4% 2.3% 37.0% 1.3% 21.2% 0.3% 17.9% 0.1%
2013-2017 37.5% 2.3% 35.3% 1.3% 20.8% 0.3% 17.5% 0.1%
2014-2018 38.1% 2.3% 34.0% 1.3% 20.5% 0.3% 17.1% 0.1%
2015-2019 36.1% 2.2% 32.8% 1.3% 20.0% 0.3% 16.7% 0.1%
APPENDICESAPPENDICES APPENDICESAPPENDICES
Appendix 6.2: Economy
Table A6.2.1: American Community Survey (ACS) Economic Indicators*
* MOEs for the county and the state are obtained directly from the U.S. Census Bureau. MOEs for TCC and control census tracts are de-rived by the UCLA Luskin Center for Innovation in accordance with the methods described by the U.S. Census Bureau in Understanding and Using American Community Survey Data: What All Data Users Need to Know (2018). All MOEs are reported at the 90% confidence. level.

Ontario Together: 2021 Progress Report on Implementation of the TCC Grant | 63
Time Period
(ACS 5-Yearsample)
Estimate for
TCC Tracts MOE
Estimate for
Control Tracts MOE
Estimate for San
Bernardino County MOE
Estimate for
California MOE
ECONOMIC INDICATORS (CONTINUED)
Percent with bachelor’s degree or higher (S1501)
2009-2013 9.7% 1.4% 8.4% 0.6% 18.7% 0.3% 30.7% 0.1%
2010-2014 9.7% 1.3% 8.5% 0.6% 18.8% 0.3% 31.0% 0.1%
2011-2015 10.2% 1.2% 8.7% 0.6% 19.0% 0.3% 31.4% 0.1%
2012-2016 10.9% 1.1% 9.6% 0.7% 19.3% 0.3% 32.0% 0.1%
2013-2017 12.0% 1.2% 10.7% 0.7% 19.8% 0.3% 32.6% 0.1%
2014-2018 12.3% 1.2% 11.2% 0.7% 20.3% 0.3% 33.3% 0.1%
2015-2019 13.2% 1.3% 11.5% 0.7% 21.0% 0.3% 33.9% 0.1%
Percent employed for the population 16 years and over (B23025)
2009-2013 53.9% 1.8% 51.5% 0.8% 52.0% 0.3% 56.4% 0.1%
2010-2014 54.6% 1.6% 51.3% 0.9% 51.9% 0.3% 56.4% 0.1%
2011-2015 56.9% 1.7% 53.1% 0.9% 52.3% 0.3% 56.9% 0.1%
2012-2016 58.1% 1.5% 55.0% 0.9% 53.0% 0.3% 57.5% 0.1%
2013-2017 58.3% 1.6% 56.2% 0.9% 53.9% 0.3% 58.2% 0.1%
2014-2018 60.4% 1.4% 57.2% 1.0% 54.8% 0.3% 58.9% 0.1%
2015-2019 61.6% 1.6% 58.7% 1.0% 55.7% 0.3% 59.4% 0.1%
APPENDICESAPPENDICES APPENDICESAPPENDICES
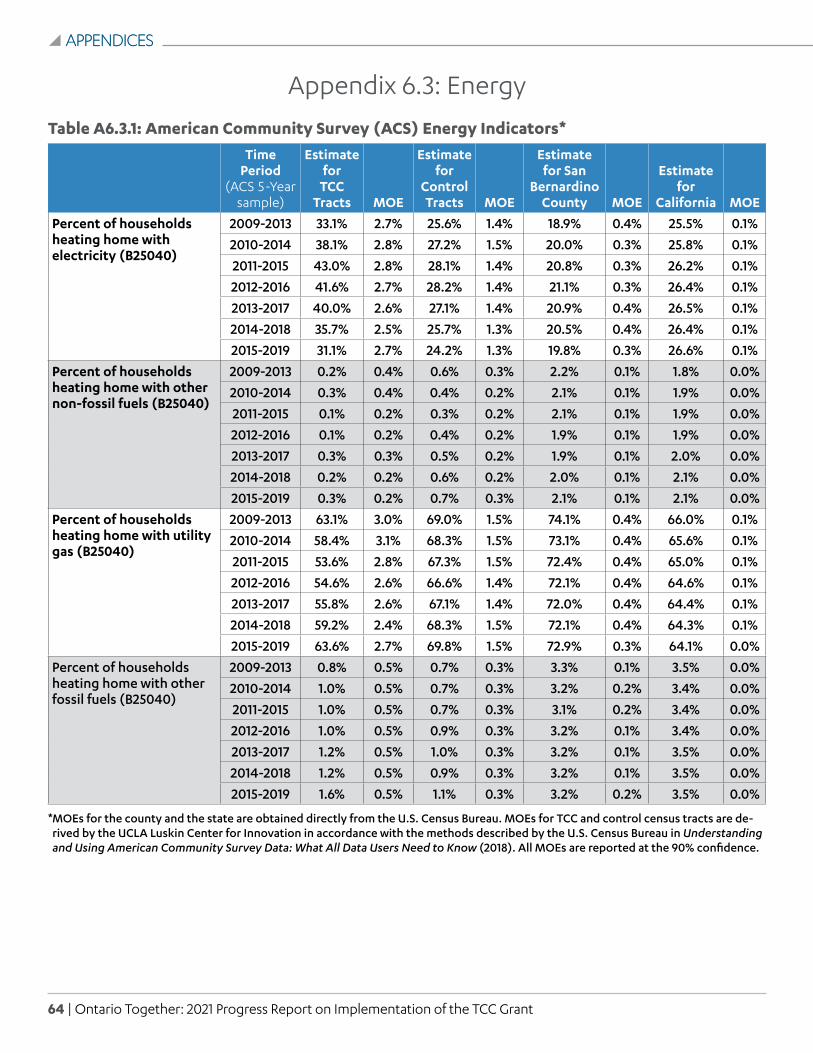
64 | Ontario Together: 2021 Progress Report on Implementation of the TCC Grant
Time Period
(ACS 5-Yearsample)
Estimate for
TCC Tracts MOE
Estimate for
Control Tracts MOE
Estimate for San
Bernardino County MOE
Estimate for
California MOE
Percent of households heating home with electricity (B25040)
2009-2013 33.1% 2.7% 25.6% 1.4% 18.9% 0.4% 25.5% 0.1%
2010-2014 38.1% 2.8% 27.2% 1.5% 20.0% 0.3% 25.8% 0.1%
2011-2015 43.0% 2.8% 28.1% 1.4% 20.8% 0.3% 26.2% 0.1%
2012-2016 41.6% 2.7% 28.2% 1.4% 21.1% 0.3% 26.4% 0.1%
2013-2017 40.0% 2.6% 27.1% 1.4% 20.9% 0.4% 26.5% 0.1%
2014-2018 35.7% 2.5% 25.7% 1.3% 20.5% 0.4% 26.4% 0.1%
2015-2019 31.1% 2.7% 24.2% 1.3% 19.8% 0.3% 26.6% 0.1%
Percent of households heating home with other non-fossil fuels (B25040)
2009-2013 0.2% 0.4% 0.6% 0.3% 2.2% 0.1% 1.8% 0.0%
2010-2014 0.3% 0.4% 0.4% 0.2% 2.1% 0.1% 1.9% 0.0%
2011-2015 0.1% 0.2% 0.3% 0.2% 2.1% 0.1% 1.9% 0.0%
2012-2016 0.1% 0.2% 0.4% 0.2% 1.9% 0.1% 1.9% 0.0%
2013-2017 0.3% 0.3% 0.5% 0.2% 1.9% 0.1% 2.0% 0.0%
2014-2018 0.2% 0.2% 0.6% 0.2% 2.0% 0.1% 2.1% 0.0%
2015-2019 0.3% 0.2% 0.7% 0.3% 2.1% 0.1% 2.1% 0.0%
Percent of households heating home with utility gas (B25040)
2009-2013 63.1% 3.0% 69.0% 1.5% 74.1% 0.4% 66.0% 0.1%
2010-2014 58.4% 3.1% 68.3% 1.5% 73.1% 0.4% 65.6% 0.1%
2011-2015 53.6% 2.8% 67.3% 1.5% 72.4% 0.4% 65.0% 0.1%
2012-2016 54.6% 2.6% 66.6% 1.4% 72.1% 0.4% 64.6% 0.1%
2013-2017 55.8% 2.6% 67.1% 1.4% 72.0% 0.4% 64.4% 0.1%
2014-2018 59.2% 2.4% 68.3% 1.5% 72.1% 0.4% 64.3% 0.1%
2015-2019 63.6% 2.7% 69.8% 1.5% 72.9% 0.3% 64.1% 0.0%
Percent of households heating home with other fossil fuels (B25040)
2009-2013 0.8% 0.5% 0.7% 0.3% 3.3% 0.1% 3.5% 0.0%
2010-2014 1.0% 0.5% 0.7% 0.3% 3.2% 0.2% 3.4% 0.0%
2011-2015 1.0% 0.5% 0.7% 0.3% 3.1% 0.2% 3.4% 0.0%
2012-2016 1.0% 0.5% 0.9% 0.3% 3.2% 0.1% 3.4% 0.0%
2013-2017 1.2% 0.5% 1.0% 0.3% 3.2% 0.1% 3.5% 0.0%
2014-2018 1.2% 0.5% 0.9% 0.3% 3.2% 0.1% 3.5% 0.0%
2015-2019 1.6% 0.5% 1.1% 0.3% 3.2% 0.2% 3.5% 0.0%
APPENDICESAPPENDICES APPENDICESAPPENDICES
Appendix 6.3: Energy
Table A6.3.1: American Community Survey (ACS) Energy Indicators*
* MOEs for the county and the state are obtained directly from the U.S. Census Bureau. MOEs for TCC and control census tracts are de-rived by the UCLA Luskin Center for Innovation in accordance with the methods described by the U.S. Census Bureau in Understanding and Using American Community Survey Data: What All Data Users Need to Know (2018). All MOEs are reported at the 90% confidence.

Ontario Together: 2021 Progress Report on Implementation of the TCC Grant | 65
Time Period
(ACS 5-Yearsample)
Estimate for
TCC Tracts MOE
Estimate for
Control Tracts MOE
Estimate for San
Bernardino County MOE
Estimate for
California MOE
ENERGY-RELATED INDICATORS (CONTINUED)
Percent of houses with no fuel used (B25040)
2009-2013 2.8% 0.9% 4.0% 0.7% 1.3% 0.1% 2.9% 0.0%
2010-2014 2.2% 0.7% 3.3% 0.6% 1.3% 0.1% 3.0% 0.0%
2011-2015 2.3% 0.8% 3.5% 0.6% 1.5% 0.1% 3.2% 0.0%
2012-2016 2.7% 0.8% 3.9% 0.6% 1.6% 0.1% 3.3% 0.0%
2013-2017 2.7% 0.8% 4.2% 0.6% 1.7% 0.1% 3.4% 0.0%
2014-2018 3.5% 0.9% 4.4% 0.7% 2.0% 0.1% 3.4% 0.0%
2015-2019 3.3% 0.9% 4.2% 0.7% 1.8% 0.1% 3.3% 0.0%
APPENDICESAPPENDICES APPENDICESAPPENDICES
Table A6.3.2: Solar PV Systems per 1,000 Households16
IndicatorDataset
Year
Ontario TCC Census Tracts
Control Census Tracts
San Bernardino
County CaliforniaSolar PV Systems for All Building Types 2018 24.4 45.5 55.4 49.4
16 Solar PV system data were sourced from The DeepSolar Project, a product of Stanford Engineering. For TCC census tracts and control tracts, a weighted average was applied, as based on the number of households within each census tract (using 2011-2015 ACS data)

66 | Ontario Together: 2021 Progress Report on Implementation of the TCC Grant
APPENDICESAPPENDICES APPENDICESAPPENDICES
Appendix 6.4: Environment
Table A6.4.1: Land-Cover Indicators17
Indicator Dataset Year Percent area for TCC
Project Area Square Miles
Impervious / buildings 2016 56.6% 2.8
Dry vegetation / barren 2016 21.8% 1.1
Green vegetation 2016 18.3% 0.9
Shadow 2016 3.2% 0.2
Unclassified 2016 0.2% <0.1
Water 2016 0% 0
17 Land-cover indicators were derived from satellite imagery maintained by the National Agriculture Imagery Program (NAIP).

Ontario Together: 2021 Progress Report on Implementation of the TCC Grant | 67
Time Period
(ACS 5-Yearsample)
Estimate for
TCC Tracts MOE
Estimate for
Control Tracts MOE
Estimate for San
Bernardino County MOE
Estimate for
California MOE
Percent with health insurance coverage (B27001)
2009-2013 70.1% 2.1% 70.8% 1.1% 79.8% 0.4% 82.2% 0.1%
2010-2014 71.0% 1.8% 71.7% 1.0% 80.9% 0.3% 83.3% 0.1%
2011-2015 74.6% 1.5% 75.2% 1.0% 83.5% 0.3% 85.3% 0.1%
2012-2016 77.9% 1.5% 78.6% 0.9% 85.9% 0.3% 87.4% 0.1%
2013-2017 81.0% 1.4% 82.0% 0.9% 88.4% 0.2% 89.5% 0.1%
2014-2018 84.0% 1.2% 85.6% 0.7% 90.6% 0.2% 91.5% 0.1%
2015-2019 86.1% 1.4% 87.4% 0.7% 91.6% 0.2% 92.5% 0.1%
Percent with private health insurance coverage (B27002)
2009-2013 40.1% 2.4% 38.5% 1.2% 54.5% 0.5% 61.0% 0.2%
2010-2014 39.8% 2.3% 38.7% 1.2% 54.1% 0.5% 60.8% 0.2%
2011-2015 41.2% 2.0% 39.6% 1.2% 54.4% 0.5% 61.2% 0.2%
2012-2016 43.6% 2.1% 40.4% 1.2% 54.6% 0.4% 61.8% 0.2%
2013-2017 42.3% 2.0% 41.6% 1.2% 55.4% 0.4% 62.6% 0.2%
2014-2018 43.2% 1.9% 42.6% 1.2% 56.0% 0.4% 63.4% 0.2%
2015-2019 44.9% 2.2% 43.5% 1.3% 56.4% 0.5% 63.8% 0.2%
Percent with public health insurance coverage (B27003)
2009-2013 33.8% 2.4% 36.5% 1.3% 31.7% 0.3% 29.5% 0.1%
2010-2014 34.7% 2.2% 37.4% 1.3% 33.1% 0.3% 30.8% 0.1%
2011-2015 37.6% 2.2% 40.3% 1.3% 35.7% 0.4% 32.6% 0.1%
2012-2016 38.6% 2.0% 43.3% 1.3% 38.2% 0.3% 34.3% 0.1%
2013-2017 43.3% 2.0% 45.3% 1.3% 40.1% 0.3% 35.8% 0.1%
2014-2018 45.3% 2.2% 47.7% 1.3% 41.8% 0.3% 37.2% 0.1%
2015-2019 46.4% 2.4% 48.6% 1.4% 42.6% 0.4% 38.0% 0.1%
APPENDICESAPPENDICES APPENDICESAPPENDICES
Appendix 6.5: Health
Table A6.5.1: American Community Survey (ACS) Health Indicators*
* MOEs for the county and the state are obtained directly from the U.S. Census Bureau. MOEs for TCC and control census tracts are de-rived by the UCLA Luskin Center for Innovation in accordance with the methods described by the U.S. Census Bureau in Understanding and Using American Community Survey Data: What All Data Users Need to Know (2018). All MOEs are reported at the 90% confidence.

68 | Ontario Together: 2021 Progress Report on Implementation of the TCC Grant
IndicatorDataset
Year
Gross Number of Collisions Normalized by 1,000 Street Mile
Value for TCC Site by Buffer
Size
Value for Controls by Buffer Size
Value for TCC Site by Buffer
Size
Value for Con-trols by Buffer
Size
0ft 50 ft 0ft 50 ft 0ft 50ft 0ft 50ft
Bicycle Collision at Injury Level 1: Fatal
2019 0 0 1 1 0 0 2.1 2.1
2018 2 2 0 1 21.5 21.5 0 2.1
2017 0 0 0 0 0 0 0 0
2016 0 0 1 2 0 0 2.1 4.3
2015 0 0 0 0 0 0 0 0
2014 0 0 0 0 0 0 0 0
2013 2 2 2 2 21.5 21.5 4.3 4.3
Bicycle Collision at Injury Level 2: Severe Injury
2019 1 2 1 1 10.8 21.5 2.1 2.1
2018 0 1 2 3 0 10.8 4.3 6.4
2017 0 0 2 2 0 0 4.3 4.3
2016 0 0 2 3 0 0 4.3 6.4
2015 1 1 2 3 10.8 10.8 4.3 6.4
2014 3 3 1 1 32.3 32.3 2.1 2.1
2013 0 0 0 1 0 0 0 2.1
Bicycle Collision at Injury Level 3: Visible Injury
2019 8 8 20 21 86.0 86.0 42.6 44.7
2018 5 6 24 32 53.8 64.5 51.1 68.1
2017 2 2 24 29 21.5 21.5 51.1 61.7
2016 7 9 19 22 75.3 96.8 40.4 46.8
2015 8 9 29 33 86.0 96.8 61.7 70.3
2014 8 8 26 36 86.0 86.0 55.3 76.6
2013 10 11 29 36 107.5 118.3 61.7 76.6
Bicycle Collision at Injury Level 4: Complaint of Pain
2019 4 4 12 14 43.0 43.0 25.5 29.8
2018 10 11 15 19 107.5 118.3 31.9 40.4
2017 2 3 14 22 21.5 32.3 29.8 46.8
2016 10 11 18 20 107.5 118.3 38.3 42.6
2015 5 6 21 26 53.8 64.5 44.7 55.3
2014 5 7 18 28 53.8 75.3 38.3 59.6
2013 14 14 16 19 150.5 150.5 34.1 40.4
Table A6.5.2: Vehicle Collisions Involving Bicyclists and Pedestrians*
* Collision data were obtained from the Transportation Injury Mapping System (TIMS). The numbers presented here are conservative in that they do not include collisions that were missing geographic coordinates in TIMS. Street mileage was obtained from OpenStreetsMap (OSM) and totaled 129 miles for the project area and 470 miles for the control tracts. Vehicle collisions involving bicycles and pedestrians are not mutually exclusive because some accidents may involve both modes.
APPENDICESAPPENDICES APPENDICESAPPENDICES

Ontario Together: 2021 Progress Report on Implementation of the TCC Grant | 69
APPENDICESAPPENDICES APPENDICESAPPENDICES
IndicatorDataset
Year
Gross Number of Collisions Normalized by 1,000 Street Mile
Value for TCC Site by Buffer
Size
Value for Controls by Buffer Size
Value for TCC Site by Buffer
Size
Value for Con-trols by Buffer
Size
0ft 50 ft 0ft 50 ft 0ft 50ft 0ft 50ft
Pedestrian Collision at Injury Level 1: Fatal
2019 2 2 10 13 21.5 21.5 21.3 27.7
2018 1 3 10 12 10.8 32.3 21.3 25.5
2017 1 1 5 8 10.8 10.8 10.6 17.0
2016 1 2 7 7 10.8 21.5 14.9 14.9
2015 0 0 7 9 0 0 14.9 19.2
2014 3 3 5 6 32.3 32.3 10.6 12.8
2013 2 2 4 6 21.5 21.5 8.5 12.8
Pedestrian Collision at Injury Level 2: Severe Injury
2019 6 7 14 15 64.5 75.3 29.8 31.9
2018 1 1 9 12 10.8 10.8 19.2 25.5
2017 1 1 14 19 10.8 10.8 29.8 40.4
2016 1 3 10 15 10.8 32.3 21.3 31.9
2015 3 4 7 8 32.3 43.0 14.9 17.0
2014 3 4 9 12 32.3 43.0 19.2 25.5
2013 0 0 7 8 0 0 14.9 17.0
Pedestrian Collision at Injury Level 3: Visible Injury
2019 7 7 23 28 75.3 75.3 49.0 59.6
2018 4 6 22 29 43.0 64.5 46.8 61.7
2017 3 5 23 27 32.3 53.8 49.0 57.5
2016 10 10 21 32 107.5 107.5 44.7 68.1
2015 6 8 25 29 64.5 86.0 53.2 61.7
2014 5 5 29 36 53.8 53.8 61.7 76.6
2013 7 7 17 24 75.3 75.3 36.2 51.1
Pedestrian Collision at Injury Level 4: Complaint of Pain
2019 3 4 22 27 32.3 43.0 46.8 57.5
2018 9 10 13 25 96.8 107.5 27.7 53.2
2017 5 5 22 30 53.8 53.8 46.8 63.9
2016 2 2 24 31 21.5 21.5 51.1 66.0
2015 7 8 23 34 75.3 86.0 49.0 72.4
2014 4 5 20 24 43.0 53.8 42.6 51.1
2013 3 3 17 22 32.3 32.3 36.2 46.8

70 | Ontario Together: 2021 Progress Report on Implementation of the TCC Grant
APPENDICESAPPENDICES APPENDICESAPPENDICES
IndicatorDataset
Year
Gross Number of Collisions Normalized by 1,000 Street Mile
Value for TCC Site by Buffer
Size
Value for Controls by Buffer Size
Value for TCC Site by Buffer
Size
Value for Con-trols by Buffer
Size
0ft 50 ft 0ft 50 ft 0ft 50ft 0ft 50ft
Combined Bicycle and Pedestrian Collision at Injury Level 1: Fatal
2019 0 0 0 0 0 0 0 0
2018 0 0 0 0 0 0 0 0
2017 0 0 0 0 0 0 0 0
2016 0 0 0 0 0 0 0 0
2015 0 0 0 0 0 0 0 0
2014 0 0 0 0 0 0 0 0
2013 0 0 0 0 0 0 0 0
Combined Bicycle and Pedestrian Collision at Injury Level 2: Severe Injury
2019 0 0 0 0 0 0 0 0
2018 0 0 0 0 0 0 0 0
2017 0 0 0 0 0 0 0 0
2016 0 0 0 0 0 0 0 0
2015 0 0 0 0 0 0 0 0
2014 0 0 0 0 0 0 0 0
2013 0 0 0 0 0 0 0 0
Combined Bicycle and Pedestrian at Injury Level 3: Visible Injury
2019 0 0 0 0 0 0 0 0
2018 0 0 1 1 0 0 2.1 2.1
2013 0 0 0 0 0 0 0 0
Combined Bicycle and Pedestrian at Injury Level 4: Complaint of Pain
2019 0 0 0 0 0 0 0 0
2018 0 0 0 0 0 0 0 0
2013 0 0 0 0 0 0 0 0

Ontario Together: 2021 Progress Report on Implementation of the TCC Grant | 71
APPENDICESAPPENDICES APPENDICESAPPENDICES
Time Period
(ACS 5-Yearsample)
Estimate for
TCC Tracts MOE
Estimate for
Control Tracts MOE
Estimate for San
Bernardino County MOE
Estimate for
California MOE
Percent renters (B25003) 2009-2013 58.0% 2.8% 46.4% 1.5% 38.1% 0.3% 44.7% 0.1%
2010-2014 61.3% 2.3% 46.9% 1.4% 39.1% 0.4% 45.2% 0.1%
2011-2015 61.9% 2.4% 48.0% 1.4% 40.3% 0.5% 45.7% 0.1%
2012-2016 62.8% 2.3% 48.5% 1.4% 40.9% 0.4% 45.9% 0.2%
2013-2017 62.7% 2.2% 47.6% 1.4% 40.8% 0.5% 45.5% 0.1%
2014-2018 61.7% 2.2% 47.4% 1.4% 40.7% 0.4% 45.4% 0.1%
2015-2019 60.6% 2.4% 48.1% 1.4% 40.2% 0.4% 45.2% 0.1%
Percent homeowners (B25003)
2009-2013 42.0% 2.8% 53.6% 1.4% 61.9% 0.4% 55.3% 0.3%
2010-2014 38.7% 2.4% 53.1% 1.3% 60.9% 0.5% 54.8% 0.3%
2011-2015 38.1% 2.3% 52.0% 1.3% 59.7% 0.5% 54.3% 0.3%
2012-2016 37.2% 2.2% 51.5% 1.3% 59.1% 0.5% 54.1% 0.3%
2013-2017 37.3% 2.1% 52.4% 1.4% 59.2% 0.5% 54.5% 0.3%
2014-2018 38.3% 2.1% 52.6% 1.3% 59.3% 0.4% 54.6% 0.3%
2015-2019 39.4% 2.3% 51.9% 1.3% 59.8% 0.5% 54.8% 0.3%
Percent of households paying ≥30% of income on rent (B25070)
2009-2013 62.1% 5.0% 65.4% 3.3% 56.8% 1.0% 54.1% 0.2%
2010-2014 61.7% 4.9% 64.1% 3.1% 57.0% 1.0% 54.2% 0.1%
2011-2015 59.9% 4.4% 61.3% 3.0% 56.8% 0.9% 54.0% 0.1%
2012-2016 60.9% 4.4% 59.8% 2.9% 56.3% 1.1% 53.6% 0.1%
2013-2017 61.4% 4.4% 58.5% 2.9% 55.5% 0.9% 53.1% 0.1%
2014-2018 60.2% 4.6% 58.1% 3.0% 55.5% 1.0% 52.6% 0.2%
2015-2019 58.3% 4.6% 56.0% 3.0% 54.6% 1.0% 52.1% 0.2%
Percent of households paying ≥50% of income on rent (B25070)
2009-2013 30.0% 3.7% 35.8% 2.7% 29.8% 0.7% 28.3% 0.1%
2010-2014 29.9% 3.6% 33.4% 2.4% 30.0% 0.7% 28.5% 0.1%
2011-2015 32.3% 3.4% 31.6% 2.3% 30.1% 0.7% 28.2% 0.2%
2012-2016 32.8% 3.5% 31.6% 2.2% 29.7% 0.9% 27.9% 0.1%
2013-2017 31.7% 3.3% 29.5% 2.1% 28.7% 0.7% 27.4% 0.1%
2014-2018 30.2% 3.4% 29.4% 2.2% 28.5% 0.7% 27.0% 0.2%
2015-2019 29.9% 3.4% 29.5% 2.3% 27.7% 0.8% 26.6% 0.2%
Appendix 6.6: Housing
Table A6.6.1: American Community Survey (ACS) Housing Indicators*
* MOEs for the county and the state are obtained directly from the U.S. Census Bureau. MOEs for TCC and control census tracts are de-rived by the UCLA Luskin Center for Innovation in accordance with the methods described by the U.S. Census Bureau in Understanding and Using American Community Survey Data: What All Data Users Need to Know (2018). All MOEs are reported at the 90% confidence.

72 | Ontario Together: 2021 Progress Report on Implementation of the TCC Grant
Time Period
(ACS 5-Yearsample)
Estimate for
TCC Tracts MOE
Estimate for
Control Tracts MOE
Estimate for San
Bernardino County MOE
Estimate for
California MOE
HOUSING-RELATED INDICATORS (CONTINUED)
Percent of households paying ≥30% of income on mortgage (B25091)
2009-2013 41.8% 5.4% 31.6% 2.3% 31.0% 0.6% 29.7% 0.1%
2010-2014 36.1% 5.1% 31.2% 2.3% 29.5% 0.6% 28.5% 0.0%
2011-2015 33.8% 4.6% 29.9% 2.1% 28.4% 0.6% 27.4% 0.2%
2012-2016 34.1% 4.4% 28.1% 2.0% 27.3% 0.5% 26.2% 0.2%
2013-2017 33.2% 4.6% 26.4% 2.0% 26.3% 0.5% 25.3% 0.0%
2014-2018 30.0% 4.4% 26.5% 2.0% 25.6% 0.5% 24.7% 0.0%
2015-2019 29.9% 4.3% 25.4% 2.0% 25.5% 0.6% 24.4% 0.0%
Percent of households paying ≥50% of income on mortgage (B25091)
2009-2013 12.0% 3.4% 8.1% 1.2% 7.4% 0.3% 7.2% 0.1%
2010-2014 9.0% 2.8% 7.2% 1.1% 6.9% 0.3% 6.7% 0.0%
2011-2015 7.8% 2.5% 6.9% 1.1% 6.4% 0.3% 6.2% 0.0%
2012-2016 6.5% 2.0% 6.6% 1.0% 6.0% 0.3% 5.8% 0.1%
2013-2017 7.1% 2.1% 6.5% 1.1% 5.8% 0.3% 5.5% 0.1%
2014-2018 6.7% 2.1% 6.0% 1.0% 5.6% 0.3% 5.4% 0.1%
2015-2019 6.5% 1.9% 6.2% 1.1% 5.5% 0.3% 5.3% 0.0%
Percent of households with more than one occupant per room (B25014)
2009-2013 18.9% 2.6% 19.1% 1.4% 8.9% 0.3% 8.2% 0.1%
2010-2014 18.7% 2.4% 18.1% 1.4% 8.8% 0.3% 8.2% 0.1%
2011-2015 16.8% 2.1% 17.7% 1.3% 8.6% 0.3% 8.2% 0.1%
2012-2016 17.2% 1.9% 16.8% 1.2% 8.8% 0.3% 8.2% 0.1%
2013-2017 17.0% 2.0% 17.0% 1.3% 8.8% 0.3% 8.2% 0.1%
2014-2018 17.4% 2.0% 17.8% 1.3% 9.0% 0.3% 8.2% 0.1%
2015-2019 16.7% 2.0% 18.3% 1.3% 8.8% 0.3% 8.2% 0.1%
Percent of households with more than one occupant per room (renters) (B25014)
2009-2013 13.3% 2.2% 11.4% 1.1% 5.4% 0.2% 6.0% 0.0%
2010-2014 12.9% 2.1% 11.1% 1.1% 5.4% 0.2% 6.0% 0.0%
2011-2015 12.0% 1.7% 11.2% 1.1% 5.5% 0.2% 6.0% 0.1%
2012-2016 12.7% 1.7% 10.9% 1.0% 5.6% 0.2% 6.1% 0.0%
2013-2017 12.6% 1.7% 11.0% 1.1% 5.5% 0.2% 6.0% 0.1%
2014-2018 12.7% 1.7% 11.5% 1.1% 5.7% 0.2% 6.0% 0.0%
2015-2019 12.0% 1.8% 11.7% 1.1% 5.6% 0.2% 6.0% 0.1%
Percent of households with more than one occupant per room (homeowners) (B25014)
2009-2013 5.6% 1.4% 7.7% 0.8% 3.4% 0.2% 2.3% 0.0%
2010-2014 5.8% 1.3% 7.0% 0.8% 3.4% 0.2% 2.2% 0.0%
2011-2015 4.8% 1.1% 6.5% 0.8% 3.2% 0.2% 2.2% 0.0%
2012-2016 4.5% 0.9% 5.9% 0.7% 3.2% 0.2% 2.1% 0.0%
2013-2017 4.4% 1.0% 6.0% 0.7% 3.2% 0.2% 2.2% 0.0%
2014-2018 4.7% 1.0% 6.3% 0.7% 3.3% 0.2% 2.2% 0.0%
2015-2019 4.7% 1.0% 6.6% 0.8% 3.2% 0.2% 2.2% 0.0%
APPENDICESAPPENDICES APPENDICESAPPENDICES

Ontario Together: 2021 Progress Report on Implementation of the TCC Grant | 73
Time Period
(ACS 5-Yearsample)
Estimate for
TCC Tracts MOE
Estimate for
Control Tracts MOE
Estimate for San
Bernardino County MOE
Estimate for
California MOE
HOUSING-RELATED INDICATORS (CONTINUED)
Percent of households in same house 1 year ago (renters) (B07013)
2009-2013 44.3% 3.8% 32.9% 1.7% 26.0% 0.4% 32.7% 0.2%
2010-2014 48.5% 3.5% 33.6% 1.7% 27.7% 0.5% 33.7% 0.2%
2011-2015 49.4% 3.2% 35.7% 1.6% 29.3% 0.6% 34.7% 0.2%
2012-2016 50.6% 2.8% 37.8% 1.7% 30.5% 0.5% 35.4% 0.2%
2013-2017 50.8% 2.8% 38.5% 1.7% 31.1% 0.5% 35.6% 0.2%
2014-2018 51.2% 3.0% 39.3% 1.7% 31.9% 0.5% 35.8% 0.2%
2015-2019 50.6% 3.0% 39.8% 1.8% 31.9% 0.5% 35.9% 0.2%
Percent of households in same house 1 year ago (homeowners) (B07013)
2009-2013 39.1% 3.1% 49.9% 1.5% 57.4% 0.5% 52.3% 0.3%
2010-2014 37.2% 2.8% 49.9% 1.6% 56.5% 0.6% 51.7% 0.3%
2011-2015 38.5% 2.8% 49.2% 1.5% 55.6% 0.6% 51.3% 0.3%
2012-2016 38.4% 2.5% 48.8% 1.5% 55.1% 0.6% 51.0% 0.3%
2013-2017 38.6% 2.6% 49.6% 1.4% 55.2% 0.5% 51.4% 0.2%
2014-2018 39.0% 2.5% 50.2% 1.5% 55.1% 0.5% 51.6% 0.2%
2015-2019 39.2% 2.8% 50.3% 1.5% 55.8% 0.5% 52.0% 0.3%
Percent of households in same house 1 year ago (w/ income of � $75k) (B07010)
2009-2013 2.7% 0.5% 2.7% 0.3% 8.1% NA 12.1% 0.1%
2010-2014 2.4% 0.5% 2.8% 0.3% 8.1% NA 12.3% 0.1%
2011-2015 2.9% 0.5% 2.9% 0.3% 8.0% NA 12.4% 0.1%
2012-2016 3.1% 0.6% 3.0% 0.3% 8.1% NA 13.0% 0.1%
2013-2017 3.8% 0.7% 3.4% 0.3% 8.7% NA 13.8% 0.1%
2014-2018 4.2% 0.7% 4.0% 0.3% 9.4% NA 14.8% 0.1%
2015-2019 4.8% 0.7% 4.5% 0.4% 10.2% 0.2% 16.0% 0.1%
% of households in same house 1 year ago (w/ in-come of < $75k) (B07010)
2009-2013 81.1% 1.9% 81.6% 1.2% 75.5% NA 72.2% 0.1%
2010-2014 83.4% 1.8% 81.9% 1.2% 76.2% NA 72.5% 0.1%
2011-2015 85.1% 1.7% 83.1% 1.2% 76.9% NA 72.9% 0.1%
2012-2016 85.6% 1.8% 84.7% 1.2% 77.2% NA 72.8% 0.1%
2013-2017 85.3% 2.0% 85.3% 1.3% 77.3% NA 72.4% 0.1%
2014-2018 85.4% 2.1% 85.9% 1.1% 77.2% NA 71.8% 0.1%
2015-2019 84.5% 2.3% 85.8% 1.2% 77.0% 0.5% 71.0% 0.1%
APPENDICESAPPENDICES APPENDICESAPPENDICES

74 | Ontario Together: 2021 Progress Report on Implementation of the TCC Grant
Time Period
(ACS 5-Yearsample)
Estimate for
TCC Tracts MOE
Estimate for
Control Tracts MOE
Estimate for San
Bernardino County MOE
Estimate for
California MOE
HOUSING-RELATED INDICATORS (CONTINUED)
Percent of housing units for rent that are vacant (B25002 and B25004)
2009-2013 3.8% 1.2% 3.2% 0.6% 2.5% 0.1% 2.1% 0.1%
2010-2014 2.6% 0.9% 2.9% 0.6% 2.4% 0.1% 2.0% 0.0%
2011-2015 2.3% 0.8% 2.7% 0.5% 2.2% 0.1% 1.8% 0.0%
2012-2016 2.0% 0.8% 2.4% 0.6% 2.1% 0.1% 1.7% 0.0%
2013-2017 1.4% 0.7% 1.7% 0.4% 1.8% 0.1% 1.6% 0.0%
2014-2018 1.0% 0.5% 1.6% 0.4% 1.6% 0.1% 1.5% 0.0%
2015-2019 1.1% 0.6% 1.4% 0.4% 1.5% 0.1% 1.6% 0.0%
Percent of housing units for sale that are vacant (B25002 and B25004)
2009-2013 1.7% 0.9% 1.4% 0.4% 1.6% 0.2% 0.9% 0.0%
2010-2014 0.8% 0.6% 1.3% 0.4% 1.5% 0.1% 0.8% 0.0%
2011-2015 0.8% 0.6% 0.9% 0.3% 1.3% 0.1% 0.7% 0.0%
2012-2016 0.6% 0.5% 0.6% 0.2% 1.1% 0.1% 0.6% 0.0%
2013-2017 0.9% 0.5% 0.5% 0.2% 1.0% 0.1% 0.6% 0.0%
2014-2018 0.6% 0.4% 0.5% 0.2% 1.0% 0.1% 0.6% 0.0%
2015-2019 0.7% 0.5% 0.4% 0.2% 0.9% 0.1% 0.6% 0.0%
APPENDICESAPPENDICES APPENDICESAPPENDICES

Ontario Together: 2021 Progress Report on Implementation of the TCC Grant | 75
Time Period
(ACS 5-Yearsample)
Estimate for
TCC Tracts MOE
Estimate for
Control Tracts MOE
Estimate for San
Bernardino County MOE
Estimate for
California MOE
Percent of households with a vehicle available (B08201)
2009-2013 34.7% 3.0% 31.1% 1.5% 29.6% 0.4% 32.3% 0.1%
2010-2014 36.0% 3.0% 32.5% 1.5% 30.2% 0.4% 32.2% 0.1%
2011-2015 38.0% 2.7% 32.2% 1.5% 30.3% 0.4% 32.1% 0.1%
2012-2016 37.1% 2.6% 31.8% 1.4% 29.8% 0.5% 31.7% 0.1%
2013-2017 35.5% 2.5% 31.2% 1.4% 29.1% 0.4% 31.2% 0.1%
2014-2018 32.7% 2.5% 29.2% 1.4% 27.7% 0.4% 30.8% 0.1%
2015-2019 31.9% 2.4% 27.8% 1.4% 26.9% 0.4% 30.4% 0.1%
Percent of workers commuting to work alone by car (B08301)
2009-2013 73.7% 2.5% 74.8% 1.3% 75.7% 0.4% 73.2% 0.1%
2010-2014 73.3% 2.3% 75.9% 1.2% 76.6% 0.3% 73.2% 0.1%
2011-2015 74.2% 1.9% 76.9% 1.2% 77.8% 0.4% 73.4% 0.1%
2012-2016 74.9% 1.8% 76.6% 1.3% 78.5% 0.3% 73.5% 0.0%
2013-2017 76.2% 1.9% 77.2% 1.2% 78.9% 0.4% 73.6% 0.1%
2014-2018 76.5% 2.2% 77.2% 1.3% 79.3% 0.2% 73.7% 0.0%
2015-2019 78.9% 1.7% 77.7% 1.2% 79.6% 0.4% 73.7% 0.0%
Percent of workers commuting to work by carpool (B08301)
2009-2013 17.6% 2.5% 17.5% 1.4% 15.2% 0.4% 11.3% 0.1%
2010-2014 17.8% 2.2% 16.4% 1.3% 14.6% 0.4% 11.1% 0.1%
2011-2015 17.1% 2.0% 15.1% 1.2% 13.3% 0.3% 10.8% 0.1%
2012-2016 16.5% 1.9% 14.8% 1.2% 12.5% 0.3% 10.6% 0.1%
2013-2017 14.9% 1.7% 13.8% 1.1% 12.0% 0.3% 10.4% 0.1%
2014-2018 14.8% 1.9% 13.0% 1.0% 11.5% 0.4% 10.3% 0.1%
2015-2019 12.6% 1.6% 12.6% 1.0% 11.0% 0.3% 10.1% 0.1%
Percent of workers commuting to work by public transit (B08301)
2009-2013 2.1% 0.8% 2.7% 0.5% 1.8% 0.1% 5.2% 0.0%
2010-2014 2.3% 0.8% 2.4% 0.5% 1.7% 0.1% 5.2% 0.0%
2011-2015 3.2% 1.0% 2.6% 0.5% 1.7% 0.1% 5.2% 0.0%
2012-2016 2.9% 0.9% 2.4% 0.5% 1.6% 0.1% 5.2% 0.0%
2013-2017 2.9% 0.9% 2.3% 0.5% 1.5% 0.1% 5.2% 0.0%
2014-2018 2.5% 0.8% 2.4% 0.5% 1.5% 0.1% 5.1% 0.0%
2015-2019 2.3% 0.8% 2.1% 0.5% 1.4% 0.1% 5.1% 0.0%
Appendix 6.7: Transportation
Table A6.7.1: American Community Survey (ACS) Transportation Indicators*
* MOEs for the county and the state are obtained directly from the U.S. Census Bureau. MOEs for TCC and control census tracts are de-rived by the UCLA Luskin Center for Innovation in accordance with the methods described by the U.S. Census Bureau in Understanding and Using American Community Survey Data: What All Data Users Need to Know (2018). All MOEs are reported at the 90% confidence.
APPENDICESAPPENDICES APPENDICESAPPENDICES

76 | Ontario Together: 2021 Progress Report on Implementation of the TCC Grant
Time Period
(ACS 5-Yearsample)
Estimate for
TCC Tracts MOE
Estimate for
Control Tracts MOE
Estimate for San
Bernardino County MOE
Estimate for
California MOE
TRANSPORTATION-RELATED INDICATORS (CONTINUED)
Percent of workers commuting to work by foot (B08301)
2009-2013 2.3% 1.5% 1.5% 0.4% 1.9% 0.1% 2.7% 0.0%
2010-2014 2.3% 1.4% 1.5% 0.4% 1.8% 0.1% 2.7% 0.0%
2011-2015 1.7% 0.6% 1.6% 0.4% 1.8% 0.1% 2.7% 0.0%
2012-2016 1.5% 0.5% 1.5% 0.4% 1.7% 0.1% 2.7% 0.0%
2013-2017 1.3% 0.6% 1.2% 0.3% 1.7% 0.1% 2.7% 0.0%
2014-2018 1.1% 0.4% 1.3% 0.3% 1.6% 0.1% 2.7% 0.0%
2015-2019 0.8% 0.4% 1.0% 0.3% 1.5% 0.1% 2.6% 0.0%
Percent of workers commuting to work by bike (B08301)
2009-2013 1.5% 1.0% 0.4% 0.2% 0.4% 0.1% 1.1% 0.0%
2010-2014 1.0% 0.8% 0.4% 0.2% 0.4% 0.1% 1.1% 0.0%
2011-2015 0.4% 0.3% 0.4% 0.2% 0.4% 0.1% 1.1% 0.0%
2012-2016 0.3% 0.3% 0.4% 0.2% 0.4% 0.1% 1.1% 0.0%
2013-2017 0.4% 0.3% 0.5% 0.2% 0.3% 0.0% 1.1% 0.0%
2014-2018 0.3% 0.3% 0.5% 0.2% 0.3% 0.0% 1.0% 0.0%
2015-2019 0.4% 0.3% 0.4% 0.2% 0.3% 0.0% 1.0% 0.0%
Percent of workers commuting to work by other modes: taxicab, motorcycle, and other (B08301)
2009-2013 1.1% 0.7% 0.6% 0.2% 1.0% 0.1% 1.3% 0.0%
2010-2014 0.8% 0.6% 0.6% 0.2% 0.9% 0.1% 1.3% 0.0%
2011-2015 0.9% 0.7% 0.5% 0.2% 0.9% 0.1% 1.4% 0.0%
2012-2016 0.7% 0.5% 0.8% 0.2% 0.9% 0.1% 1.4% 0.0%
2013-2017 0.8% 0.6% 0.9% 0.2% 0.9% 0.1% 1.5% 0.0%
2014-2018 0.9% 0.7% 1.0% 0.3% 0.9% 0.1% 1.6% 0.0%
2015-2019 0.9% 0.7% 1.0% 0.3% 1.0% 0.1% 1.6% 0.0%
APPENDICESAPPENDICES APPENDICESAPPENDICES

Ontario Together: 2021 Progress Report on Implementation of the TCC Grant | 77
Table A6.7.2: Plug-in Electric Vehicle (PEV) Registrations18
IndicatorDataset
Year
Gross Number Normalized per 10,000 Residents
TCC Census Tracts
Control Census Tracts
San Bernardino
County
TCC Census Tracts
Control Census Tracts
San Bernardino
County
Battery electric vehicle (BEV)
2019 86 134 4,997 17.5 7.2 23.3
2018 43 73 2,991 8.4 4.0 14.0
2017 25 54 2,186 5.0 3.0 10.3
2016 19 44 1,619 3.9 2.4 7.7
2015 10 33 1,224 2.1 1.8 5.8
Plug-in hybrid electric vehicle (PHEV)
2019 112 292 6,631 22.8 15.8 30.9
2018 66 200 5,022 13.0 11.0 23.5
2017 36 111 2,649 7.2 6.1 12.5
2016 29 95 2,465 6.0 5.3 11.7
2015 23 84 1,971 4.9 4.7 9.4
Fuel cell vehicle (FCEV)
2019 1 2 136 0.2 0.1 0.6
2018 0 2 103 0 0.1 0.5
2017 0 0 0 0 0 0
2016 0 0 13 0 0 0.1
2015 0 0 5 0 0 0
Total EVs
2019 199 428 11,764 40.6 23.1 54.7
2018 109 275 8,116 21.4 15.1 38.0
2017 61 165 4,840 12.2 9.1 22.8
2016 48 139 4,097 9.9 7.7 19.4
2015 33 117 3,195 7.0 6.5 15.2
18 EV registration data were obtained by request from the California Air Resources Boards (CARB) Online Fleet Database. The EV registration data were normalized with 2017 and 2015 five-year ACS data.
APPENDICESAPPENDICES APPENDICESAPPENDICES

78 | Ontario Together: 2021 Progress Report on Implementation of the TCC Grant
Table A6.7.3: Publicly Available Charging Infrastructure19
IndicatorDataset
Year
Gross Number Normalized per 10,000 Residents
TCC Census Tracts
Control Census Tracts
San Bernardino
County
TCC Census Tracts
Control Census Tracts
San Bernardino
County
Level 2 Stations
2020 3 8 149 0.6 0.4 0.7
2019 3 5 72 0.6 0.3 0.3
2018 3 4 80 0.6 0.2 0.4
2017 0 4 83 0 0.2 0.4
2016 1 3 69 0.2 0.2 0.3
2015 1 2 58 0.2 0.1 0.3
DC Fast-Charging Stations
2020 0 1 51 0 0.1 0.2
2019 0 1 31 0 0.1 0.1
2018 0 1 28 0 0.1 0.1
2017 0 1 25 0 0.1 0.1
2016 0 1 19 0 0.1 0.1
2015 0 0 16 0 0 0.1
19 Charging station data were obtained by request from the Alternative Fuels Data Center (AFDC), a resource administered by the U.S. Department of Energy’s Office of Energy Efficiency and Renewable Energy’s Vehicle Technologies Office. Each dataset includes active stations and does not include stations that have previously opened and closed. in other words, each dataset is a snapshot of currently active stations in that year (taken during fall of each year). The charging station data were normalized with five-year ACS data for the respective year.
APPENDICESAPPENDICES

Ontario Together: A Baseline and Progress Report on Early Implementation of the TCC Grant | 79