Embed Size (px)
Citation preview

Ontario Stroke Evaluation Report 2013
Spotlight on Secondary Stroke Prevention and CareSUPPLEMENT: ONTARIO STROKE REPORT CARDS
June 2013

Institute for Clinical Evaluative Sciences

Institute for Clinical Evaluative Sciences i
ONTARIO STROKE EVALUATION REPORT 2013: SPOTLIGHT ON SECONDARY STROKE PREVENTION AND CARE
Ontario Stroke Evaluation Report 2013
Spotlight on Secondary Stroke Prevention and CareSUPPLEMENT: ONTARIO STROKE REPORT CARDS
Authors
Ruth Hall, PhD Beth Linkewich, MPA, BScOT, OT Reg (Ont)Ferhana Khan, MPH Kathryn Hodwitz, BA Shudong Li, MSc Limei Zhou, MSc Shivali Kapila, BSc, CaPM Jim Lumsden, BScPT, MPACally Martin, BScPT, MScLinda Kelloway, RN, MN, CNN(c)Moira K. Kapral, MD, MSc, FRCPC Christina O’Callaghan, BAppSc (PT)Mark Bayley, MD, FRCPC

Institute for Clinical Evaluative Sciencesii
ONTARIO STROKE EVALUATION REPORT 2013: SPOTLIGHT ON SECONDARY STROKE PREVENTION AND CARE
Publication Information
Published by the Institute for Clinical EvaluativeSciences (ICES)
© 2013 Institute for Clinical Evaluative SciencesAll rights reserved. This publication may bereproduced in whole or in part for non-commercialpurposes only and on the condition that the originalcontent of the publication or portion of the publicationnot be altered in any way without the express writtenpermission of ICES. To seek this permission, pleasecontact [email protected].
The opinions, results and conclusions included in thisreport are those of the authors and are independentfrom the funding sources. No endorsement by theInstitute for Clinical Evaluative Sciences (ICES) orthe Ontario Ministry of Health and Long-Term Care(MOHLTC) is intended or should be inferred.
INSTITUTE FOR CLINICAL EVALUATIVE SCIENCESG1 06, 2075 Bayview AvenueToronto, ON M4N 3M5Telephone: 416-480-4055Email: [email protected]
Canadian cataloguing in publication data
Ontario Stroke Evaluation Report 2013:Spotlight on Secondary Stroke Prevention and Care. Supplement: Ontario Stroke Report Cards
Includes bibliographical references.
ISBN: 978-1-926850-42-9 (Print)ISBN: 978-1-926850-43-6 (PDF)
This document and the full report are available at www.ices.on.ca.
Contents
1 ONTARIO STROKE REPORT CARDS
32 APPENDICES33 A Indicator Definitions36 B Methodology38 C Contact Information for High-Performing
Facilities and Sub-LHINs by Indicator40 D Map of Ontario’s Local Health Integration
Networks, Stroke System Regions, Designated Centres and Secondary Prevention Clinics
41 E About the Organizations Involved in this Report

Institute for Clinical Evaluative Sciences 1
ONTARIO STROKE EVALUATION REPORT 2013: SPOTLIGHT ON SECONDARY STROKE PREVENTION AND CARE
Ontario Stroke Report Cards
The Ontario Stroke Report Cards were developed by the Ontario Stroke Evaluation and Quality Committee (SEQC) in 2009 to provide a concise mechanism for communicating stroke care performance in the province. The report cards serve as a valuable stakeholder communication tool that allows for consistent planning across the Ontario Stroke System, both regionally and provincially.
Fifteen report cards are produced annually, including an Ontario report card and a report card for each of the 14 Local Health Integration Networks (LHINs). This year a secondary prevention clinic report card was created for each LHIN, highlighting data collected from the 2011/12 Ontario Stroke Audit of Secondary Prevention Clinics.
The SEQC Knowledge Translation and Accountability Subcommittee established a strategy for disseminating the report cards. Packages containing the report cards and an accompanying interpretation document were distributed by the directors of the Ontario Regional Stroke Networks to each of the LHINs. The interpretation document highlights areas of progress, gaps identified, initiatives to address these gaps, and opportunities for stroke system/LHIN collaboration. Follow-up meetings were then scheduled with the LHINs to review the data and develop quality improvement plans.
The report cards and dissemination process have effectively engaged the Ontario Regional Stroke Networks in a dialogue relating to stroke system improvement.
Institute for Clinical Evaluative Sciences2
ONTARIO STROKE EVALUATION REPORT 2013: SPOTLIGHT ON SECONDARY STROKE PREVENTION AND CARE ONTARIO STROKE REPORT CARDS
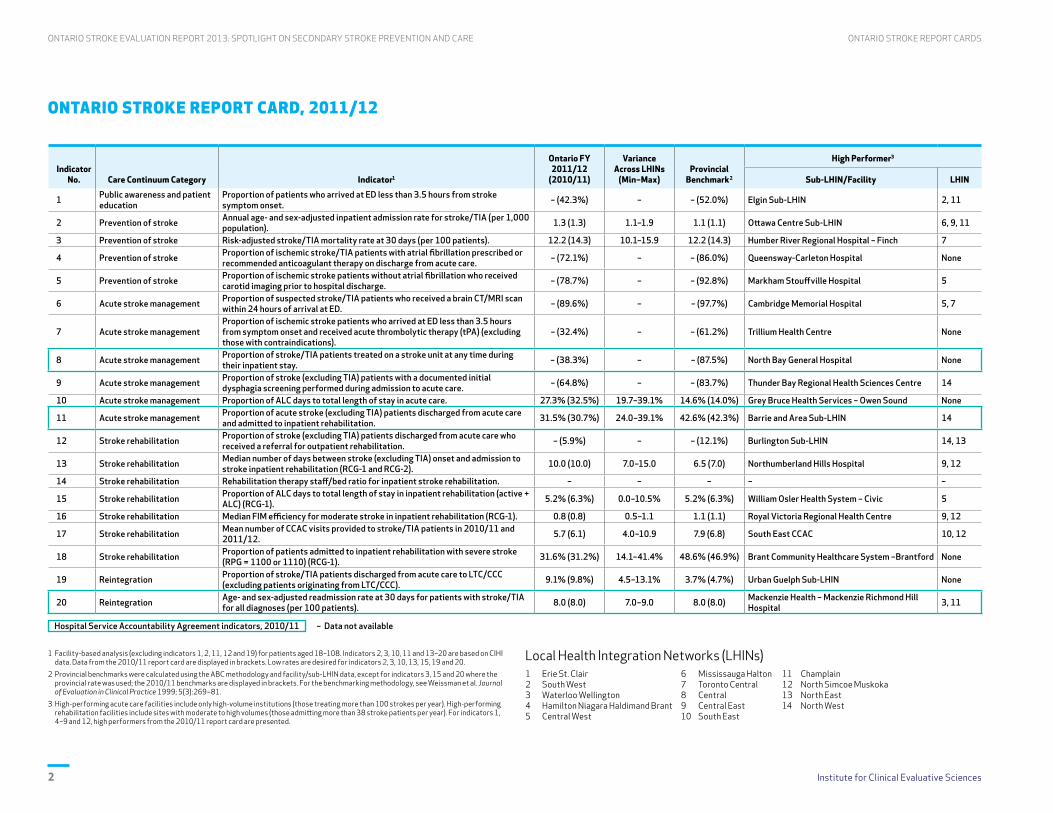
ONTARIO STROKE REPORT CARD, 2011/12
Indicator No. Care Continuum Category Indicator1
Ontario FY 2011/12
(2010/11)
VarianceAcross LHINs
(Min–Max)Provincial
Benchmark2
High Performer3
Sub-LHIN/Facility LHIN
1 Public awareness and patient education
Proportion of patients who arrived at ED less than 3.5 hours from stroke symptom onset. – (42.3%) – – (52.0%) Elgin Sub-LHIN 2, 11
2 Prevention of stroke Annual age- and sex-adjusted inpatient admission rate for stroke/TIA (per 1,000 population). 1.3 (1.3) 1.1–1.9 1.1 (1.1) Ottawa Centre Sub-LHIN 6, 9, 11
3 Prevention of stroke Risk-adjusted stroke/TIA mortality rate at 30 days (per 100 patients). 12.2 (14.3) 10.1–15.9 12.2 (14.3) Humber River Regional Hospital – Finch 7
4 Prevention of stroke Proportion of ischemic stroke/TIA patients with atrial fibrillation prescribed or recommended anticoagulant therapy on discharge from acute care. – (72.1%) – – (86.0%) Queensway-Carleton Hospital None
5 Prevention of stroke Proportion of ischemic stroke patients without atrial fibrillation who received carotid imaging prior to hospital discharge. – (78.7%) – – (92.8%) Markham Stouffville Hospital 5
6 Acute stroke management Proportion of suspected stroke/TIA patients who received a brain CT/MRI scan within 24 hours of arrival at ED. – (89.6%) – – (97.7%) Cambridge Memorial Hospital 5, 7
7 Acute stroke managementProportion of ischemic stroke patients who arrived at ED less than 3.5 hours from symptom onset and received acute thrombolytic therapy (tPA) (excluding those with contraindications).
– (32.4%) – – (61.2%) Trillium Health Centre None
8 Acute stroke management Proportion of stroke/TIA patients treated on a stroke unit at any time during their inpatient stay. – (38.3%) – – (87.5%) North Bay General Hospital None
9 Acute stroke management Proportion of stroke (excluding TIA) patients with a documented initial dysphagia screening performed during admission to acute care. – (64.8%) – – (83.7%) Thunder Bay Regional Health Sciences Centre 14
10 Acute stroke management Proportion of ALC days to total length of stay in acute care. 27.3% (32.5%) 19.7–39.1% 14.6% (14.0%) Grey Bruce Health Services – Owen Sound None
11 Acute stroke management Proportion of acute stroke (excluding TIA) patients discharged from acute care and admitted to inpatient rehabilitation. 31.5% (30.7%) 24.0–39.1% 42.6% (42.3%) Barrie and Area Sub-LHIN 14
12 Stroke rehabilitation Proportion of stroke (excluding TIA) patients discharged from acute care who received a referral for outpatient rehabilitation. – (5.9%) – – (12.1%) Burlington Sub-LHIN 14, 13
13 Stroke rehabilitation Median number of days between stroke (excluding TIA) onset and admission to stroke inpatient rehabilitation (RCG-1 and RCG-2). 10.0 (10.0) 7.0–15.0 6.5 (7.0) Northumberland Hills Hospital 9, 12
14 Stroke rehabilitation Rehabilitation therapy staff/bed ratio for inpatient stroke rehabilitation. – – – – –
15 Stroke rehabilitation Proportion of ALC days to total length of stay in inpatient rehabilitation (active + ALC) (RCG-1). 5.2% (6.3%) 0.0–10.5% 5.2% (6.3%) William Osler Health System – Civic 5
16 Stroke rehabilitation Median FIM efficiency for moderate stroke in inpatient rehabilitation (RCG-1). 0.8 (0.8) 0.5–1.1 1.1 (1.1) Royal Victoria Regional Health Centre 9, 12
17 Stroke rehabilitation Mean number of CCAC visits provided to stroke/TIA patients in 2010/11 and 2011/12. 5.7 (6.1) 4.0–10.9 7.9 (6.8) South East CCAC 10, 12
18 Stroke rehabilitation Proportion of patients admitted to inpatient rehabilitation with severe stroke (RPG = 1100 or 1110) (RCG-1). 31.6% (31.2%) 14.1–41.4% 48.6% (46.9%) Brant Community Healthcare System –Brantford None
19 Reintegration Proportion of stroke/TIA patients discharged from acute care to LTC/CCC (excluding patients originating from LTC/CCC). 9.1% (9.8%) 4.5–13.1% 3.7% (4.7%) Urban Guelph Sub-LHIN None
20 Reintegration Age- and sex-adjusted readmission rate at 30 days for patients with stroke/TIA for all diagnoses (per 100 patients). 8.0 (8.0) 7.0–9.0 8.0 (8.0) Mackenzie Health – Mackenzie Richmond Hill
Hospital 3, 11
Hospital Service Accountability Agreement indicators, 2010/11 – Data not available
1 Facility-based analysis (excluding indicators 1, 2, 11, 12 and 19) for patients aged 18–108. Indicators 2, 3, 10, 11 and 13–20 are based on CIHI data. Data from the 2010/11 report card are displayed in brackets. Low rates are desired for indicators 2, 3, 10, 13, 15, 19 and 20.
2 Provincial benchmarks were calculated using the ABC methodology and facility/sub-LHIN data, except for indicators 3, 15 and 20 where the provincial rate was used; the 2010/11 benchmarks are displayed in brackets. For the benchmarking methodology, see Weissman et al. Journal of Evaluation in Clinical Practice 1999; 5(3):269–81.
3 High-performing acute care facilities include only high-volume institutions (those treating more than 100 strokes per year). High-performing rehabilitation facilities include sites with moderate to high volumes (those admitting more than 38 stroke patients per year). For indicators 1, 4–9 and 12, high performers from the 2010/11 report card are presented.
Local Health Integration Networks (LHINs)1 Erie St. Clair 6 Mississauga Halton 11 Champlain2 South West 7 Toronto Central 12 North Simcoe Muskoka3 Waterloo Wellington 8 Central 13 North East4 Hamilton Niagara Haldimand Brant 9 Central East 14 North West5 Central West 10 South East

Institute for Clinical Evaluative Sciences 3
ONTARIO STROKE EVALUATION REPORT 2013: SPOTLIGHT ON SECONDARY STROKE PREVENTION AND CAREONTARIO STROKE REPORT CARDS
ONTARIO STROKE REPORT CARD, 2011/12: SECONDARY PREVENTION CLINICS
Indicator No. Care Continuum Category Indicator1 Ontario
Ontario Variance2
(Min–Max)
High Performer3
Facility LHIN
1 Prevention of stroke Proportion of ED visits for a suspected or confirmed stroke/TIA where the patient was discharged and had an initial SPC visit. 21.3% 4.7–29.7% Queensway-Carleton Hospital 14, 11
2 Prevention of stroke Proportion of emergent and urgent SPC visits where the patient was seen within recommended guidelines (24 hours and 72 hours, respectively). 16.0% 3.5–27.9% Niagara Health System – Greater Niagara
General 4, 13
3 Prevention of stroke Proportion of SPC visits where ischemic stroke/TIA patients had vascular imaging ordered or completed prior to or during the visit. 92.7% 85.1–99.5% Brant Community Healthcare System – Willet
Grey Bruce Health Services – Owen Sound 11, 9
4 Prevention of stroke Proportion of SPC visits where ischemic stroke/TIA patients with atrial fibrillation were prescribed and/or recommended anticoagulant therapy prior to or during the visit. 80.1% 57.4–89.3% Toronto Western Hospital 9, 7
5 Prevention of stroke Proportion of initial SPC visits where cognitive screening was performed. 10.4% 0.2–46.6% Pembroke Regional Hospital 6, 7
1 Facility-based analysis for patients aged 18–108. High rates are desired for all indicators.
2 Variance across the 14 LHINs.
3 Restricted to facilities/LHINs with at least 50 eligible patients for each indicator.
Local Health Integration Networks (LHINs)1 Erie St. Clair 6 Mississauga Halton 11 Champlain2 South West 7 Toronto Central 12 North Simcoe Muskoka3 Waterloo Wellington 8 Central 13 North East4 Hamilton Niagara Haldimand Brant 9 Central East 14 North West5 Central West 10 South East

Institute for Clinical Evaluative Sciences4
ONTARIO STROKE EVALUATION REPORT 2013: SPOTLIGHT ON SECONDARY STROKE PREVENTION AND CARE ONTARIO STROKE REPORT CARDS
ONTARIO STROKE REPORT CARD, 2011/12 Erie St. Clair Local Health Integration Network
Poor performance1 Acceptable performance2 Exemplary performance3 Benchmark not available4
Indicator No. Care Continuum Category Indicator5
LHIN FY 2011/12
(2010/11)Variance Within LHIN (Min–Max)
Provincial Benchmark6
High Performer7
Sub-LHIN/Facility LHIN
1 Public awareness and patient education
Proportion of patients who arrived at ED less than 3.5 hours from stroke symptom onset. – (44.8%) – – (52.0%) Elgin Sub-LHIN 2, 11
2 Prevention of stroke Annual age- and sex-adjusted inpatient admission rate for stroke/TIA (per 1,000 population). 1.4 (1.5) 1.4–1.9 1.1 (1.1) Ottawa Centre Sub-LHIN 6, 9, 11
3 Prevention of stroke Risk-adjusted stroke/TIA mortality rate at 30 days (per 100 patients). 11.3 (17.9) 0.0–16.4 12.2 (14.3) Humber River Regional Hospital – Finch 7
4 Prevention of stroke Proportion of ischemic stroke/TIA patients with atrial fibrillation prescribed or recommended anticoagulant therapy on discharge from acute care. – (70.5%) – – (86.0%) Queensway-Carleton Hospital None
5 Prevention of stroke Proportion of ischemic stroke patients without atrial fibrillation who received carotid imaging prior to hospital discharge. – (81.3%) – – (92.8%) Markham Stouffville Hospital 5
6 Acute stroke management Proportion of suspected stroke/TIA patients who received a brain CT/MRI within 24 hours of arrival at ED. – (88.2%) – – (97.7%) Cambridge Memorial Hospital 5, 7
7 Acute stroke managementProportion of ischemic stroke patients who arrived at ED less than 3.5 hours from symptom onset and received acute thrombolytic therapy (tPA) (excluding those with contraindications).
– (27.8%) – – (61.2%) Trillium Health Centre None
8 Acute stroke management Proportion of stroke/TIA patients treated on a stroke unit at any time during their inpatient stay. – (61.3%) – – (87.5%) North Bay General Hospital None
9 Acute stroke management Proportion of stroke (excluding TIA) patients with a documented initial dysphagia screening performed during admission to acute care. – (59.5%) – – (83.7%) Thunder Bay Regional Health Sciences Centre 14
10 Acute stroke management Proportion of ALC days to total length of stay in acute care. 23.4% (27.3%) 0.0–33.1% 14.6% (14.0%) Grey Bruce Health Services – Owen Sound None
11 Acute stroke management Proportion of acute stroke (excluding TIA) patients discharged from acute care and admitted to inpatient rehabilitation. 36.3% (38.7%) 33.4–41.4% 42.6% (42.3%) Barrie and Area Sub-LHIN 14
12 Stroke rehabilitation Proportion of stroke (excluding TIA) patients discharged from acute care who received a referral for outpatient rehabilitation. – (2.4%) – – (12.1%) Burlington Sub-LHIN 14, 13
13 Stroke rehabilitation Median number of days between stroke (excluding TIA) onset and admission to stroke inpatient rehabilitation (RCG-1 and RCG-2). 9.0 (9.0) 6.0–15.0 6.5 (7.0) Northumberland Hills Hospital 9, 12
14 Stroke rehabilitation Rehabilitation therapy staff/bed ratio for inpatient stroke rehabilitation. – – – – –
15 Stroke rehabilitation Proportion of ALC days to total length of stay in inpatient rehabilitation (Active + ALC) (RCG-1). 10.5% (8.2%) 0.0–17.3% 5.2% (6.3%) William Osler Health System – Civic 5
16 Stroke rehabilitation Median FIM efficiency for moderate stroke in inpatient rehabilitation (RCG-1). 0.8 (0.9) 0.6–1.4 1.1 (1.1) Royal Victoria Regional Health Centre 9, 12
17 Stroke rehabilitation Mean number of CCAC visits provided to stroke/TIA patients in 2010/11 and 2011/12. 5.4 (6.3) n/a 7.9 (6.8) South East CCAC 10, 12
18 Stroke rehabilitation Proportion of patients admitted to inpatient rehabilitation with severe strokes (RPG = 1100 or 1110) (RCG-1). 33.8% (39.8%) 8.3-43.4 48.6% (46.9%) Brant Community Healthcare System –Brantford None
19 Reintegration Proportion of stroke/TIA patients discharged from acute care to LTC/CCC (excluding patients originating from LTC/CCC). 9.0% (7.7%) 5.2-11.4% 3.7% (4.7%) Urban Guelph Sub-LHIN None
20 Reintegration Age- and sex-adjusted readmission rate at 30 days for patients with stroke/TIA for all diagnoses (per 100 patients). 7.9 (8.3) 0.0-11.9 8.0 (8.0) Mackenzie Health – Mackenzie Richmond Hill
Hospital 3, 11
Hospital Service Accountability Agreement indicators, 2010/11 – Data not available n/a Not applicable
1 Performance below the 50th percentile.
2 Performance at or above the 50th percentile and greater than 5% absolute/relative difference from the benchmark.
3 Benchmark achieved or performance within 5% absolute/relative difference from the benchmark.
4 Data not available or benchmark under development.
5 Facility-based analysis (excluding indicators 1, 2, 11, 12 and 19) for patients aged 18–108. Indicators 2, 3, 10, 11 and 13–20 are based on CIHI data. Data from the 2010/11 report card are displayed in brackets. For indicators 1, 4–9 and 12, performance ratings from the 2010/11 report card are presented. Low rates are desired for indicators 2, 3, 10, 13, 15, 19 and 20.
6 Provincial benchmarks were calculated using the ABC methodology and facility/sub-LHIN data, except for indicators 3, 15 and 20 where the provincial rate was used; 2010/11 benchmarks are displayed in brackets. For the benchmarking methodology, see Weissman et al. Journal of Evaluation in Clinical Practice 1999; 5(3):269-81.
7 High-performing acute care facilities include only high-volume institutions (those treating more than 100 strokes per year). High-performing rehabilitation facilities include sites with moderate to high volumes (those admitting more than 38 stroke patients per year). For indicators 1, 4–9 and 12, high performers from the 2010/11 report card are presented.

Institute for Clinical Evaluative Sciences 5
ONTARIO STROKE EVALUATION REPORT 2013: SPOTLIGHT ON SECONDARY STROKE PREVENTION AND CAREONTARIO STROKE REPORT CARDS
ONTARIO STROKE REPORT CARD, 2011/12: SECONDARY PREVENTION CLINICS Erie St. Clair Local Health Integration Network
Indicator No. Care Continuum Category Indicator1
Erie St. Clair LHIN Ontario
LHIN Variance2
(Min–Max)
Ontario Variance3
(Min–Max)
High Performer4
Facility LHIN
1 Prevention of stroke Proportion of ED visits for a suspected or confirmed stroke/TIA where the patient was discharged and had an initial SPC visit. 28.5% 21.3% 17.9–34.9% 4.7–29.7% Queensway-Carleton Hospital 14, 11
2 Prevention of strokeProportion of emergent and urgent SPC visits where the patient was seen within recommended guidelines (24 hours and 72 hours, respectively).
12.5% 16.0% 0.9–72.4% 3.5–27.9% Niagara Health System – Greater Niagara General 4, 13
3 Prevention of stroke Proportion of SPC visits where ischemic stroke/TIA patients had vascular imaging ordered or completed prior to or during the visit. 85.1% 92.7% 75.8–99.2% 85.1–99.5% Brant Community Healthcare System – Willet
Grey Bruce Health Services – Owen Sound 11, 9
4 Prevention of strokeProportion of SPC visits where ischemic stroke/TIA patients with atrial fibrillation were prescribed and/or recommended anticoagulant therapy prior to or during the visit.
79.7% 80.1% 75.0–85.7% 57.4–89.3% Toronto Western Hospital 9, 7
5 Prevention of stroke Proportion of initial SPC visits where cognitive screening was performed. 9.1% 10.4% 0.4–48.4% 0.2–46.6% Pembroke Regional Hospital 6, 7
1 Facility-based analysis for patients aged 18–108. High rates are desired for all indicators.
2 Variance within the LHIN (i.e., across facilities).
3 Variance across the 14 LHINs.
4 Restricted to facilities/LHINs with at least 50 eligible patients for each indicator.
Local Health Integration Networks (LHINs)1 Erie St. Clair 6 Mississauga Halton 11 Champlain2 South West 7 Toronto Central 12 North Simcoe Muskoka3 Waterloo Wellington 8 Central 13 North East4 Hamilton Niagara Haldimand Brant 9 Central East 14 North West5 Central West 10 South East

Institute for Clinical Evaluative Sciences6
ONTARIO STROKE EVALUATION REPORT 2013: SPOTLIGHT ON SECONDARY STROKE PREVENTION AND CARE ONTARIO STROKE REPORT CARDS
ONTARIO STROKE REPORT CARD, 2011/12 South West Local Health Integration Network
Poor performance1 Acceptable performance2 Exemplary performance3 Benchmark not available4
Indicator No. Care Continuum Category Indicator5
LHIN FY 2011/12
(2010/11)Variance Within LHIN (Min–Max)
Provincial Benchmark6
High Performer7
Sub-LHIN/Facility LHIN
1 Public awareness and patient education
Proportion of patients who arrived at ED less than 3.5 hours from stroke symptom onset. – (51.1%) – – (52.0%) Elgin Sub-LHIN 2, 11
2 Prevention of stroke Annual age- and sex-adjusted inpatient admission rate for stroke/TIA (per 1,000 population). 1.4 (1.4) 1.4–1.7 1.1 (1.1) Ottawa Centre Sub-LHIN 6, 9, 11
3 Prevention of stroke Risk-adjusted stroke/TIA mortality rate at 30 days (per 100 patients). 13.6 (15.1) 0.0–29.4 12.2 (14.3) Humber River Regional Hospital – Finch 7
4 Prevention of stroke Proportion of ischemic stroke/TIA patients with atrial fibrillation prescribed or recommended anticoagulant therapy on discharge from acute care. – (70.1%) – – (86.0%) Queensway-Carleton Hospital None
5 Prevention of stroke Proportion of ischemic stroke patients without atrial fibrillation who received carotid imaging prior to hospital discharge. – (72.8%) – – (92.8%) Markham Stouffville Hospital 5
6 Acute stroke management Proportion of suspected stroke/TIA patients who received a brain CT/MRI within 24 hours of arrival at ED. – (78.1%) – – (97.7%) Cambridge Memorial Hospital 5, 7
7 Acute stroke managementProportion of ischemic stroke patients who arrived at ED less than 3.5 hours from symptom onset and received acute thrombolytic therapy (tPA) (excluding those with contraindications).
– (18.9%) – – (61.2%) Trillium Health Centre None
8 Acute stroke management Proportion of stroke/TIA patients treated on a stroke unit at any time during their inpatient stay. – (44.6%) – – (87.5%) North Bay General Hospital None
9 Acute stroke management Proportion of stroke (excluding TIA) patients with a documented initial dysphagia screening performed during admission to acute care. – (57.4%) – – (83.7%) Thunder Bay Regional Health Sciences Centre 14
10 Acute stroke management Proportion of ALC days to total length of stay in acute care. 23.3% (19.0%) 0.0–64.9% 14.6% (14.0%) Grey Bruce Health Services – Owen Sound None
11 Acute stroke management Proportion of acute stroke (excluding TIA) patients discharged from acute care and admitted to inpatient rehabilitation. 33.5% (35.6%) 26.9–37.9% 42.6% (42.3%) Barrie and Area Sub-LHIN 14
12 Stroke rehabilitation Proportion of stroke (excluding TIA) patients discharged from acute care who received a referral for outpatient rehabilitation. – (3.8%) – – (12.1%) Burlington Sub-LHIN 14, 13
13 Stroke rehabilitation Median number of days between stroke (excluding TIA) onset and admission to stroke inpatient rehabilitation (RCG-1 and RCG-2). 10.0 (8.0) 6.5–31.1 6.5 (7.0) Northumberland Hills Hospital 9, 12
14 Stroke rehabilitation Rehabilitation therapy staff/bed ratio for inpatient stroke rehabilitation. – – – – –
15 Stroke rehabilitation Proportion of ALC days to total length of stay in inpatient rehabilitation (Active + ALC) (RCG-1). 8.9% (7.4%) 0.0–14.2% 5.2% (6.3%) William Osler Health System – Civic 5
16 Stroke rehabilitation Median FIM efficiency for moderate stroke in inpatient rehabilitation (RCG-1). 0.9 (0.9) 0.0–1.7 1.1 (1.1) Royal Victoria Regional Health Centre 9, 12
17 Stroke rehabilitation Mean number of CCAC visits provided to stroke/TIA patients in 2010/11 and 2011/12. 5.7 (5.8) n/a 7.9 (6.8) South East CCAC 10, 12
18 Stroke rehabilitation Proportion of patients admitted to inpatient rehabilitation with severe strokes (RPG = 1100 or 1110) (RCG-1). 37.8% (39.8%) 0.0–100.0% 48.6% (46.9%) Brant Community Healthcare System –Brantford None
19 Reintegration Proportion of stroke/TIA patients discharged from acute care to LTC/CCC (excluding patients originating from LTC/CCC). 5.5% (6.6%) 1.9–12.9% 3.7% (4.7%) Urban Guelph Sub-LHIN None
20 Reintegration Age- and sex-adjusted readmission rate at 30 days for patients with stroke/TIA for all diagnoses (per 100 patients). 8.0 (7.4) 0.0–21.6 8.0 (8.0) Mackenzie Health – Mackenzie Richmond Hill
Hospital 3, 11
Hospital Service Accountability Agreement indicators, 2010/11 – Data not available n/a Not applicable
1 Performance below the 50th percentile.
2 Performance at or above the 50th percentile and greater than 5% absolute/relative difference from the benchmark.
3 Benchmark achieved or performance within 5% absolute/relative difference from the benchmark.
4 Data not available or benchmark under development.
5 Facility-based analysis (excluding indicators 1, 2, 11, 12 and 19) for patients aged 18–108. Indicators 2, 3, 10, 11 and 13–20 are based on CIHI data. Data from the 2010/11 report card are displayed in brackets. For indicators 1, 4–9 and 12, performance ratings from the 2010/11 report card are presented. Low rates are desired for indicators 2, 3, 10, 13, 15, 19 and 20.
6 Provincial benchmarks were calculated using the ABC methodology and facility/sub-LHIN data, except for indicators 3, 15 and 20 where the provincial rate was used; 2010/11 benchmarks are displayed in brackets. For the benchmarking methodology, see Weissman et al. Journal of Evaluation in Clinical Practice 1999; 5(3):269-81.
7 High-performing acute care facilities include only high-volume institutions (those treating more than 100 strokes per year). High-performing rehabilitation facilities include sites with moderate to high volumes (those admitting more than 38 stroke patients per year). For indicators 1, 4–9 and 12, high performers from the 2010/11 report card are presented.

Institute for Clinical Evaluative Sciences 7
ONTARIO STROKE EVALUATION REPORT 2013: SPOTLIGHT ON SECONDARY STROKE PREVENTION AND CAREONTARIO STROKE REPORT CARDS
ONTARIO STROKE REPORT CARD, 2011/12: SECONDARY PREVENTION CLINICS South West Local Health Integration Network
Indicator No. Care Continuum Category Indicator1
South West LHIN Ontario
LHIN Variance2
(Min–Max)
Ontario Variance3
(Min–Max)
High Performer4
Facility LHIN
1 Prevention of stroke Proportion of ED visits for a suspected or confirmed stroke/TIA where the patient was discharged and had an initial SPC visit. 21.8% 21.3% 0.0–40.9% 4.7–29.7% Queensway-Carleton Hospital 14, 11
2 Prevention of strokeProportion of emergent and urgent SPC visits where the patient was seen within recommended guidelines (24 hours and 72 hours, respectively).
14.6% 16.0% 0.0–18.8% 3.5–27.9% Niagara Health System – Greater Niagara General 4, 13
3 Prevention of stroke Proportion of SPC visits where ischemic stroke/TIA patients had vascular imaging ordered or completed prior to or during the visit. 96.4% 92.7% 96.1–100.0% 85.1–99.5% Brant Community Healthcare System – Willet
Grey Bruce Health Services – Owen Sound 11, 9
4 Prevention of strokeProportion of SPC visits where ischemic stroke/TIA patients with atrial fibrillation were prescribed and/or recommended anticoagulant therapy prior to or during the visit.
79.5% 80.1% 76.8–100.0% 57.4–89.3% Toronto Western Hospital 9, 7
5 Prevention of stroke Proportion of initial SPC visits where cognitive screening was performed. 0.4% 10.4% 0.0–1.0% 0.2–46.6% Pembroke Regional Hospital 6, 7
1 Facility-based analysis for patients aged 18–108. High rates are desired for all indicators.
2 Variance within the LHIN (i.e., across facilities).
3 Variance across the 14 LHINs.
4 Restricted to facilities/LHINs with at least 50 eligible patients for each indicator.
Local Health Integration Networks (LHINs)1 Erie St. Clair 6 Mississauga Halton 11 Champlain2 South West 7 Toronto Central 12 North Simcoe Muskoka3 Waterloo Wellington 8 Central 13 North East4 Hamilton Niagara Haldimand Brant 9 Central East 14 North West5 Central West 10 South East

Institute for Clinical Evaluative Sciences8
ONTARIO STROKE EVALUATION REPORT 2013: SPOTLIGHT ON SECONDARY STROKE PREVENTION AND CARE ONTARIO STROKE REPORT CARDS
ONTARIO STROKE REPORT CARD, 2011/12 Waterloo Wellington Local Health Integration Network
Poor performance1 Acceptable performance2 Exemplary performance3 Benchmark not available4
Indicator No. Care Continuum Category Indicator5
LHIN FY 2011/12
(2010/11)Variance Within LHIN (Min–Max)
Provincial Benchmark6
High Performer7
Sub-LHIN/Facility LHIN
1 Public awareness and patient education
Proportion of patients who arrived at ED less than 3.5 hours from stroke symptom onset. – (44.5%) – – (52.0%) Elgin Sub-LHIN 2, 11
2 Prevention of stroke Annual age- and sex-adjusted inpatient admission rate for stroke/TIA (per 1,000 population). 1.4 (1.3) 1.2–1.5 1.1 (1.1) Ottawa Centre Sub-LHIN 6, 9, 11
3 Prevention of stroke Risk-adjusted stroke/TIA mortality rate at 30 days (per 100 patients). 10.3 (15.4) 0.0–28.0 12.2 (14.3) Humber River Regional Hospital – Finch 7
4 Prevention of stroke Proportion of ischemic stroke/TIA patients with atrial fibrillation prescribed or recommended anticoagulant therapy on discharge from acute care. – (63.6%) – – (86.0%) Queensway-Carleton Hospital None
5 Prevention of stroke Proportion of ischemic stroke patients without atrial fibrillation who received carotid imaging prior to hospital discharge. – (83.0%) – – (92.8%) Markham Stouffville Hospital 5
6 Acute stroke management Proportion of suspected stroke/TIA patients who received a brain CT/MRI within 24 hours of arrival at ED. – (90.8%) – – (97.7%) Cambridge Memorial Hospital 5, 7
7 Acute stroke managementProportion of ischemic stroke patients who arrived at ED less than 3.5 hours from symptom onset and received acute thrombolytic therapy (tPA) (excluding those with contraindications).
– (25.4%) – – (61.2%) Trillium Health Centre None
8 Acute stroke management Proportion of stroke/TIA patients treated on a stroke unit at any time during their inpatient stay. – (43.9%) – – (87.5%) North Bay General Hospital None
9 Acute stroke management Proportion of stroke (excluding TIA) patients with a documented initial dysphagia screening performed during admission to acute care. – (67.7%) – – (83.7%) Thunder Bay Regional Health Sciences Centre 14
10 Acute stroke management Proportion of ALC days to total length of stay in acute care. 31.8% (36.9%) 2.2–56.5% 14.6% (14.0%) Grey Bruce Health Services – Owen Sound None
11 Acute stroke management Proportion of acute stroke (excluding TIA) patients discharged from acute care and admitted to inpatient rehabilitation. 30.8% (29.4%) 16.7–42.0% 42.6% (42.3%) Barrie and Area Sub-LHIN 14
12 Stroke rehabilitation Proportion of stroke (excluding TIA) patients discharged from acute care who received a referral for outpatient rehabilitation. – (4.9%) – – (12.1%) Burlington Sub-LHIN 14, 13
13 Stroke rehabilitation Median number of days between stroke (excluding TIA) onset and admission to stroke inpatient rehabilitation (RCG-1 and RCG-2). 11.0 (11.0) 10.0–12.0 6.5 (7.0) Northumberland Hills Hospital 9, 12
14 Stroke rehabilitation Rehabilitation therapy staff/bed ratio for inpatient stroke rehabilitation. – – – – –
15 Stroke rehabilitation Proportion of ALC days to total length of stay in inpatient rehabilitation (Active + ALC) (RCG-1). 4.7% (14.4%) 2.5–8.8% 5.2% (6.3%) William Osler Health System – Civic 5
16 Stroke rehabilitation Median FIM efficiency for moderate stroke in inpatient rehabilitation (RCG-1). 0.8 (0.8) 0.7–1.2 1.1 (1.1) Royal Victoria Regional Health Centre 9, 12
17 Stroke rehabilitation Mean number of CCAC visits provided to stroke/TIA patients in 2010/11 and 2011/12. 6.0 (6.9) n/a 7.9 (6.8) South East CCAC 10, 12
18 Stroke rehabilitation Proportion of patients admitted to inpatient rehabilitation with severe strokes (RPG = 1100 or 1110) (RCG-1). 36.8% (27.4%) 29.3–73.7% 48.6% (46.9%) Brant Community Healthcare System –Brantford None
19 Reintegration Proportion of stroke/TIA patients discharged from acute care to LTC/CCC (excluding patients originating from LTC/CCC). 10.0% (13.0%) 1.6–12.7% 3.7% (4.7%) Urban Guelph Sub-LHIN None
20 Reintegration Age- and sex-adjusted readmission rate at 30 days for patients with stroke/TIA for all diagnoses (per 100 patients). 7.0 (6.6) 0.0–16.0 8.0 (8.0) Mackenzie Health – Mackenzie Richmond Hill
Hospital 3, 11
Hospital Service Accountability Agreement indicators, 2010/11 – Data not available n/a Not applicable
1 Performance below the 50th percentile.
2 Performance at or above the 50th percentile and greater than 5% absolute/relative difference from the benchmark.
3 Benchmark achieved or performance within 5% absolute/relative difference from the benchmark.
4 Data not available or benchmark under development.
5 Facility-based analysis (excluding indicators 1, 2, 11, 12 and 19) for patients aged 18–108. Indicators 2, 3, 10, 11 and 13–20 are based on CIHI data. Data from the 2010/11 report card are displayed in brackets. For indicators 1, 4–9 and 12, performance ratings from the 2010/11 report card are presented. Low rates are desired for indicators 2, 3, 10, 13, 15, 19 and 20.
6 Provincial benchmarks were calculated using the ABC methodology and facility/sub-LHIN data, except for indicators 3, 15 and 20 where the provincial rate was used; 2010/11 benchmarks are displayed in brackets. For the benchmarking methodology, see Weissman et al. Journal of Evaluation in Clinical Practice 1999; 5(3):269-81.
7 High-performing acute care facilities include only high-volume institutions (those treating more than 100 strokes per year). High-performing rehabilitation facilities include sites with moderate to high volumes (those admitting more than 38 stroke patients per year). For indicators 1, 4–9 and 12, high performers from the 2010/11 report card are presented.

Institute for Clinical Evaluative Sciences 9
ONTARIO STROKE EVALUATION REPORT 2013: SPOTLIGHT ON SECONDARY STROKE PREVENTION AND CAREONTARIO STROKE REPORT CARDS
ONTARIO STROKE REPORT CARD, 2011/12: SECONDARY PREVENTION CLINICS Waterloo Wellington Local Health Integration Network
Indicator No. Care Continuum Category Indicator1
Waterloo Wellington
LHIN Ontario
LHIN Variance2
(Min–Max)
Ontario Variance3
(Min–Max)
High Performer4
Facility LHIN
1 Prevention of stroke Proportion of ED visits for a suspected or confirmed stroke/TIA where the patient was discharged and had an initial SPC visit. 25.5% 21.3% 3.8–34.3% 4.7–29.7% Queensway-Carleton Hospital 14, 11
2 Prevention of strokeProportion of emergent and urgent SPC visits where the patient was seen within recommended guidelines (24 hours and 72 hours, respectively).
7.1% 16.0% 7.1–7.1% 3.5–27.9% Niagara Health System – Greater Niagara General 4, 13
3 Prevention of stroke Proportion of SPC visits where ischemic stroke/TIA patients had vascular imaging ordered or completed prior to or during the visit. 92.3% 92.7% 92.3–92.3% 85.1–99.5% Brant Community Healthcare System – Willet
Grey Bruce Health Services – Owen Sound 11, 9
4 Prevention of strokeProportion of SPC visits where ischemic stroke/TIA patients with atrial fibrillation were prescribed and/or recommended anticoagulant therapy prior to or during the visit.
57.4% 80.1% 57.4–57.4% 57.4–89.3% Toronto Western Hospital 9, 7
5 Prevention of stroke Proportion of initial SPC visits where cognitive screening was performed. 1.7% 10.4% 1.7–1.7% 0.2–46.6% Pembroke Regional Hospital 6, 7
1 Facility-based analysis for patients aged 18–108. High rates are desired for all indicators.
2 Variance within the LHIN (i.e., across facilities).
3 Variance across the 14 LHINs.
4 Restricted to facilities/LHINs with at least 50 eligible patients for each indicator.
Local Health Integration Networks (LHINs)1 Erie St. Clair 6 Mississauga Halton 11 Champlain2 South West 7 Toronto Central 12 North Simcoe Muskoka3 Waterloo Wellington 8 Central 13 North East4 Hamilton Niagara Haldimand Brant 9 Central East 14 North West5 Central West 10 South East
Institute for Clinical Evaluative Sciences10
ONTARIO STROKE EVALUATION REPORT 2013: SPOTLIGHT ON SECONDARY STROKE PREVENTION AND CARE ONTARIO STROKE REPORT CARDS
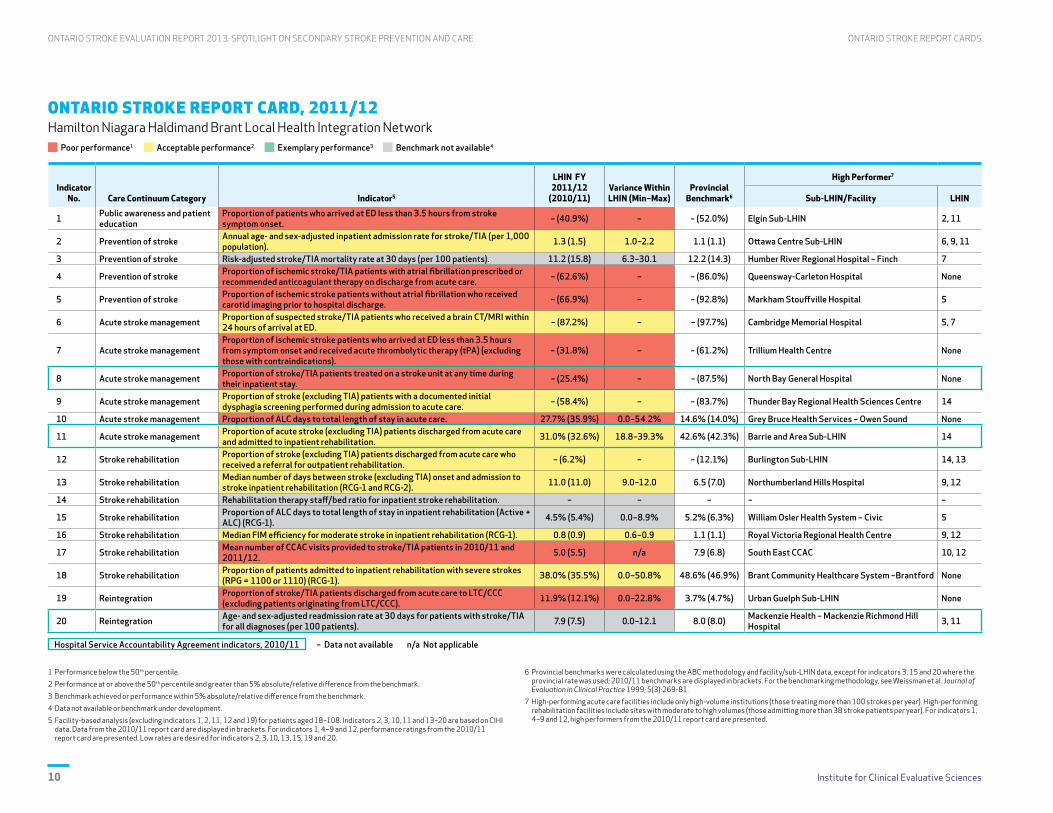
ONTARIO STROKE REPORT CARD, 2011/12 Hamilton Niagara Haldimand Brant Local Health Integration Network
Poor performance1 Acceptable performance2 Exemplary performance3 Benchmark not available4
Indicator No. Care Continuum Category Indicator5
LHIN FY 2011/12
(2010/11)Variance Within LHIN (Min–Max)
Provincial Benchmark6
High Performer7
Sub-LHIN/Facility LHIN
1 Public awareness and patient education
Proportion of patients who arrived at ED less than 3.5 hours from stroke symptom onset. – (40.9%) – – (52.0%) Elgin Sub-LHIN 2, 11
2 Prevention of stroke Annual age- and sex-adjusted inpatient admission rate for stroke/TIA (per 1,000 population). 1.3 (1.5) 1.0–2.2 1.1 (1.1) Ottawa Centre Sub-LHIN 6, 9, 11
3 Prevention of stroke Risk-adjusted stroke/TIA mortality rate at 30 days (per 100 patients). 11.2 (15.8) 6.3–30.1 12.2 (14.3) Humber River Regional Hospital – Finch 7
4 Prevention of stroke Proportion of ischemic stroke/TIA patients with atrial fibrillation prescribed or recommended anticoagulant therapy on discharge from acute care. – (62.6%) – – (86.0%) Queensway-Carleton Hospital None
5 Prevention of stroke Proportion of ischemic stroke patients without atrial fibrillation who received carotid imaging prior to hospital discharge. – (66.9%) – – (92.8%) Markham Stouffville Hospital 5
6 Acute stroke management Proportion of suspected stroke/TIA patients who received a brain CT/MRI within 24 hours of arrival at ED. – (87.2%) – – (97.7%) Cambridge Memorial Hospital 5, 7
7 Acute stroke managementProportion of ischemic stroke patients who arrived at ED less than 3.5 hours from symptom onset and received acute thrombolytic therapy (tPA) (excluding those with contraindications).
– (31.8%) – – (61.2%) Trillium Health Centre None
8 Acute stroke management Proportion of stroke/TIA patients treated on a stroke unit at any time during their inpatient stay. – (25.4%) – – (87.5%) North Bay General Hospital None
9 Acute stroke management Proportion of stroke (excluding TIA) patients with a documented initial dysphagia screening performed during admission to acute care. – (58.4%) – – (83.7%) Thunder Bay Regional Health Sciences Centre 14
10 Acute stroke management Proportion of ALC days to total length of stay in acute care. 27.7% (35.9%) 0.0–54.2% 14.6% (14.0%) Grey Bruce Health Services – Owen Sound None
11 Acute stroke management Proportion of acute stroke (excluding TIA) patients discharged from acute care and admitted to inpatient rehabilitation. 31.0% (32.6%) 18.8–39.3% 42.6% (42.3%) Barrie and Area Sub-LHIN 14
12 Stroke rehabilitation Proportion of stroke (excluding TIA) patients discharged from acute care who received a referral for outpatient rehabilitation. – (6.2%) – – (12.1%) Burlington Sub-LHIN 14, 13
13 Stroke rehabilitation Median number of days between stroke (excluding TIA) onset and admission to stroke inpatient rehabilitation (RCG-1 and RCG-2). 11.0 (11.0) 9.0–12.0 6.5 (7.0) Northumberland Hills Hospital 9, 12
14 Stroke rehabilitation Rehabilitation therapy staff/bed ratio for inpatient stroke rehabilitation. – – – – –
15 Stroke rehabilitation Proportion of ALC days to total length of stay in inpatient rehabilitation (Active + ALC) (RCG-1). 4.5% (5.4%) 0.0–8.9% 5.2% (6.3%) William Osler Health System – Civic 5
16 Stroke rehabilitation Median FIM efficiency for moderate stroke in inpatient rehabilitation (RCG-1). 0.8 (0.9) 0.6–0.9 1.1 (1.1) Royal Victoria Regional Health Centre 9, 12
17 Stroke rehabilitation Mean number of CCAC visits provided to stroke/TIA patients in 2010/11 and 2011/12. 5.0 (5.5) n/a 7.9 (6.8) South East CCAC 10, 12
18 Stroke rehabilitation Proportion of patients admitted to inpatient rehabilitation with severe strokes (RPG = 1100 or 1110) (RCG-1). 38.0% (35.5%) 0.0–50.8% 48.6% (46.9%) Brant Community Healthcare System –Brantford None
19 Reintegration Proportion of stroke/TIA patients discharged from acute care to LTC/CCC (excluding patients originating from LTC/CCC). 11.9% (12.1%) 0.0–22.8% 3.7% (4.7%) Urban Guelph Sub-LHIN None
20 Reintegration Age- and sex-adjusted readmission rate at 30 days for patients with stroke/TIA for all diagnoses (per 100 patients). 7.9 (7.5) 0.0–12.1 8.0 (8.0) Mackenzie Health – Mackenzie Richmond Hill
Hospital 3, 11
Hospital Service Accountability Agreement indicators, 2010/11 – Data not available n/a Not applicable
1 Performance below the 50th percentile.
2 Performance at or above the 50th percentile and greater than 5% absolute/relative difference from the benchmark.
3 Benchmark achieved or performance within 5% absolute/relative difference from the benchmark.
4 Data not available or benchmark under development.
5 Facility-based analysis (excluding indicators 1, 2, 11, 12 and 19) for patients aged 18–108. Indicators 2, 3, 10, 11 and 13–20 are based on CIHI data. Data from the 2010/11 report card are displayed in brackets. For indicators 1, 4–9 and 12, performance ratings from the 2010/11 report card are presented. Low rates are desired for indicators 2, 3, 10, 13, 15, 19 and 20.
6 Provincial benchmarks were calculated using the ABC methodology and facility/sub-LHIN data, except for indicators 3, 15 and 20 where the provincial rate was used; 2010/11 benchmarks are displayed in brackets. For the benchmarking methodology, see Weissman et al. Journal of Evaluation in Clinical Practice 1999; 5(3):269-81.
7 High-performing acute care facilities include only high-volume institutions (those treating more than 100 strokes per year). High-performing rehabilitation facilities include sites with moderate to high volumes (those admitting more than 38 stroke patients per year). For indicators 1, 4–9 and 12, high performers from the 2010/11 report card are presented.

Institute for Clinical Evaluative Sciences 11
ONTARIO STROKE EVALUATION REPORT 2013: SPOTLIGHT ON SECONDARY STROKE PREVENTION AND CAREONTARIO STROKE REPORT CARDS
ONTARIO STROKE REPORT CARD, 2011/12: SECONDARY PREVENTION CLINICS Hamilton Niagara Haldimand Brant Local Health Integration Network
Indicator No. Care Continuum Category Indicator1
Hamilton Niagara
Haldimand Brant LHIN Ontario
LHIN Variance2
(Min–Max)
Ontario Variance3
(Min–Max)
High Performer4
Facility LHIN
1 Prevention of stroke Proportion of ED visits for a suspected or confirmed stroke/TIA where the patient was discharged and had an initial SPC visit. 18.8% 21.3% 0.0–82.4% 4.7–29.7% Queensway-Carleton Hospital 14, 11
2 Prevention of strokeProportion of emergent and urgent SPC visits where the patient was seen within recommended guidelines (24 hours and 72 hours, respectively).
27.9% 16.0% 2.0–76.6% 3.5–27.9% Niagara Health System – Greater Niagara General 4, 13
3 Prevention of stroke Proportion of SPC visits where ischemic stroke/TIA patients had vascular imaging ordered or completed prior to or during the visit. 88.9% 92.7% 77.4–100.0% 85.1–99.5% Brant Community Healthcare System – Willet
Grey Bruce Health Services – Owen Sound 11, 9
4 Prevention of strokeProportion of SPC visits where ischemic stroke/TIA patients with atrial fibrillation were prescribed and/or recommended anticoagulant therapy prior to or during the visit.
69.4% 80.1% 48.6–88.9% 57.4–89.3% Toronto Western Hospital 9, 7
5 Prevention of stroke Proportion of initial SPC visits where cognitive screening was performed. 1.2% 10.4% 0.0–3.6% 0.2–46.6% Pembroke Regional Hospital 6, 7
1 Facility-based analysis for patients aged 18–108. High rates are desired for all indicators.
2 Variance within the LHIN (i.e., across facilities).
3 Variance across the 14 LHINs.
4 Restricted to facilities/LHINs with at least 50 eligible patients for each indicator.
Local Health Integration Networks (LHINs)1 Erie St. Clair 6 Mississauga Halton 11 Champlain2 South West 7 Toronto Central 12 North Simcoe Muskoka3 Waterloo Wellington 8 Central 13 North East4 Hamilton Niagara Haldimand Brant 9 Central East 14 North West5 Central West 10 South East
Institute for Clinical Evaluative Sciences12
ONTARIO STROKE EVALUATION REPORT 2013: SPOTLIGHT ON SECONDARY STROKE PREVENTION AND CARE ONTARIO STROKE REPORT CARDS
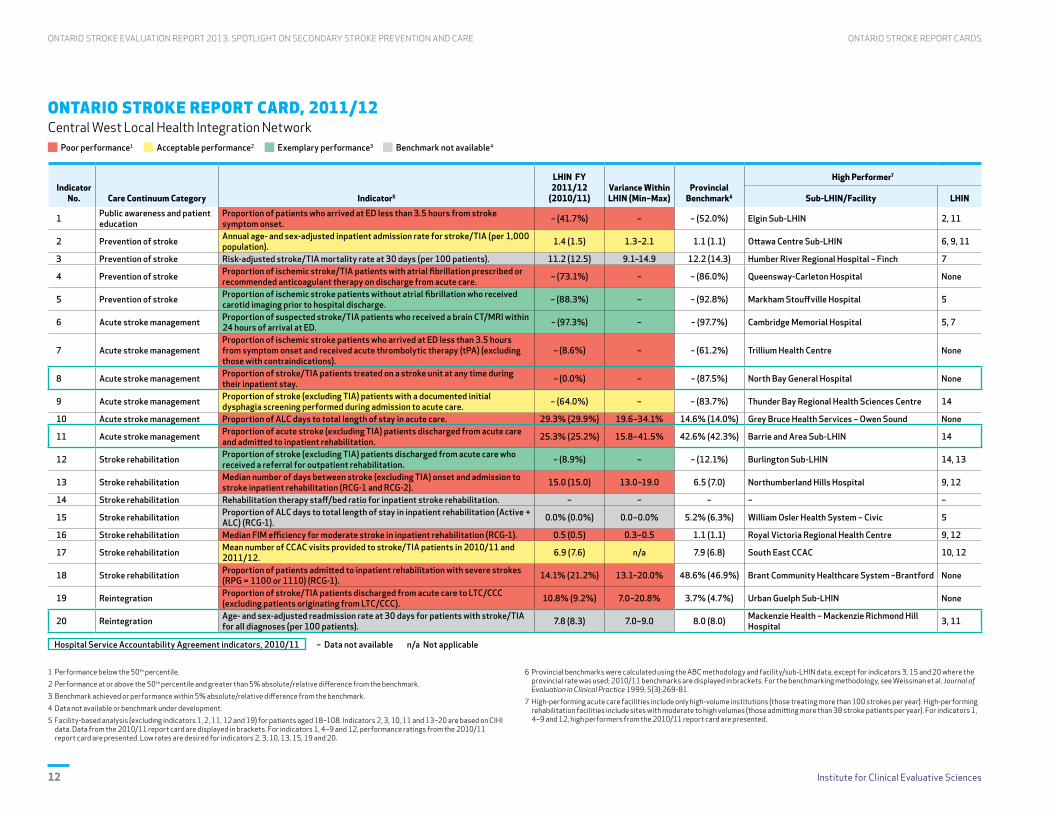
ONTARIO STROKE REPORT CARD, 2011/12 Central West Local Health Integration Network
Poor performance1 Acceptable performance2 Exemplary performance3 Benchmark not available4
Indicator No. Care Continuum Category Indicator5
LHIN FY 2011/12
(2010/11)Variance Within LHIN (Min–Max)
Provincial Benchmark6
High Performer7
Sub-LHIN/Facility LHIN
1 Public awareness and patient education
Proportion of patients who arrived at ED less than 3.5 hours from stroke symptom onset. – (41.7%) – – (52.0%) Elgin Sub-LHIN 2, 11
2 Prevention of stroke Annual age- and sex-adjusted inpatient admission rate for stroke/TIA (per 1,000 population). 1.4 (1.5) 1.3–2.1 1.1 (1.1) Ottawa Centre Sub-LHIN 6, 9, 11
3 Prevention of stroke Risk-adjusted stroke/TIA mortality rate at 30 days (per 100 patients). 11.2 (12.5) 9.1–14.9 12.2 (14.3) Humber River Regional Hospital – Finch 7
4 Prevention of stroke Proportion of ischemic stroke/TIA patients with atrial fibrillation prescribed or recommended anticoagulant therapy on discharge from acute care. – (73.1%) – – (86.0%) Queensway-Carleton Hospital None
5 Prevention of stroke Proportion of ischemic stroke patients without atrial fibrillation who received carotid imaging prior to hospital discharge. – (88.3%) – – (92.8%) Markham Stouffville Hospital 5
6 Acute stroke management Proportion of suspected stroke/TIA patients who received a brain CT/MRI within 24 hours of arrival at ED. – (97.3%) – – (97.7%) Cambridge Memorial Hospital 5, 7
7 Acute stroke managementProportion of ischemic stroke patients who arrived at ED less than 3.5 hours from symptom onset and received acute thrombolytic therapy (tPA) (excluding those with contraindications).
– (8.6%) – – (61.2%) Trillium Health Centre None
8 Acute stroke management Proportion of stroke/TIA patients treated on a stroke unit at any time during their inpatient stay. – (0.0%) – – (87.5%) North Bay General Hospital None
9 Acute stroke management Proportion of stroke (excluding TIA) patients with a documented initial dysphagia screening performed during admission to acute care. – (64.0%) – – (83.7%) Thunder Bay Regional Health Sciences Centre 14
10 Acute stroke management Proportion of ALC days to total length of stay in acute care. 29.3% (29.9%) 19.6–34.1% 14.6% (14.0%) Grey Bruce Health Services – Owen Sound None
11 Acute stroke management Proportion of acute stroke (excluding TIA) patients discharged from acute care and admitted to inpatient rehabilitation. 25.3% (25.2%) 15.8–41.5% 42.6% (42.3%) Barrie and Area Sub-LHIN 14
12 Stroke rehabilitation Proportion of stroke (excluding TIA) patients discharged from acute care who received a referral for outpatient rehabilitation. – (8.9%) – – (12.1%) Burlington Sub-LHIN 14, 13
13 Stroke rehabilitation Median number of days between stroke (excluding TIA) onset and admission to stroke inpatient rehabilitation (RCG-1 and RCG-2). 15.0 (15.0) 13.0–19.0 6.5 (7.0) Northumberland Hills Hospital 9, 12
14 Stroke rehabilitation Rehabilitation therapy staff/bed ratio for inpatient stroke rehabilitation. – – – – –
15 Stroke rehabilitation Proportion of ALC days to total length of stay in inpatient rehabilitation (Active + ALC) (RCG-1). 0.0% (0.0%) 0.0–0.0% 5.2% (6.3%) William Osler Health System – Civic 5
16 Stroke rehabilitation Median FIM efficiency for moderate stroke in inpatient rehabilitation (RCG-1). 0.5 (0.5) 0.3–0.5 1.1 (1.1) Royal Victoria Regional Health Centre 9, 12
17 Stroke rehabilitation Mean number of CCAC visits provided to stroke/TIA patients in 2010/11 and 2011/12. 6.9 (7.6) n/a 7.9 (6.8) South East CCAC 10, 12
18 Stroke rehabilitation Proportion of patients admitted to inpatient rehabilitation with severe strokes (RPG = 1100 or 1110) (RCG-1). 14.1% (21.2%) 13.1–20.0% 48.6% (46.9%) Brant Community Healthcare System –Brantford None
19 Reintegration Proportion of stroke/TIA patients discharged from acute care to LTC/CCC (excluding patients originating from LTC/CCC). 10.8% (9.2%) 7.0–20.8% 3.7% (4.7%) Urban Guelph Sub-LHIN None
20 Reintegration Age- and sex-adjusted readmission rate at 30 days for patients with stroke/TIA for all diagnoses (per 100 patients). 7.8 (8.3) 7.0–9.0 8.0 (8.0) Mackenzie Health – Mackenzie Richmond Hill
Hospital 3, 11
Hospital Service Accountability Agreement indicators, 2010/11 – Data not available n/a Not applicable
1 Performance below the 50th percentile.
2 Performance at or above the 50th percentile and greater than 5% absolute/relative difference from the benchmark.
3 Benchmark achieved or performance within 5% absolute/relative difference from the benchmark.
4 Data not available or benchmark under development.
5 Facility-based analysis (excluding indicators 1, 2, 11, 12 and 19) for patients aged 18–108. Indicators 2, 3, 10, 11 and 13–20 are based on CIHI data. Data from the 2010/11 report card are displayed in brackets. For indicators 1, 4–9 and 12, performance ratings from the 2010/11 report card are presented. Low rates are desired for indicators 2, 3, 10, 13, 15, 19 and 20.
6 Provincial benchmarks were calculated using the ABC methodology and facility/sub-LHIN data, except for indicators 3, 15 and 20 where the provincial rate was used; 2010/11 benchmarks are displayed in brackets. For the benchmarking methodology, see Weissman et al. Journal of Evaluation in Clinical Practice 1999; 5(3):269-81.
7 High-performing acute care facilities include only high-volume institutions (those treating more than 100 strokes per year). High-performing rehabilitation facilities include sites with moderate to high volumes (those admitting more than 38 stroke patients per year). For indicators 1, 4–9 and 12, high performers from the 2010/11 report card are presented.
Institute for Clinical Evaluative Sciences 13
ONTARIO STROKE EVALUATION REPORT 2013: SPOTLIGHT ON SECONDARY STROKE PREVENTION AND CAREONTARIO STROKE REPORT CARDS
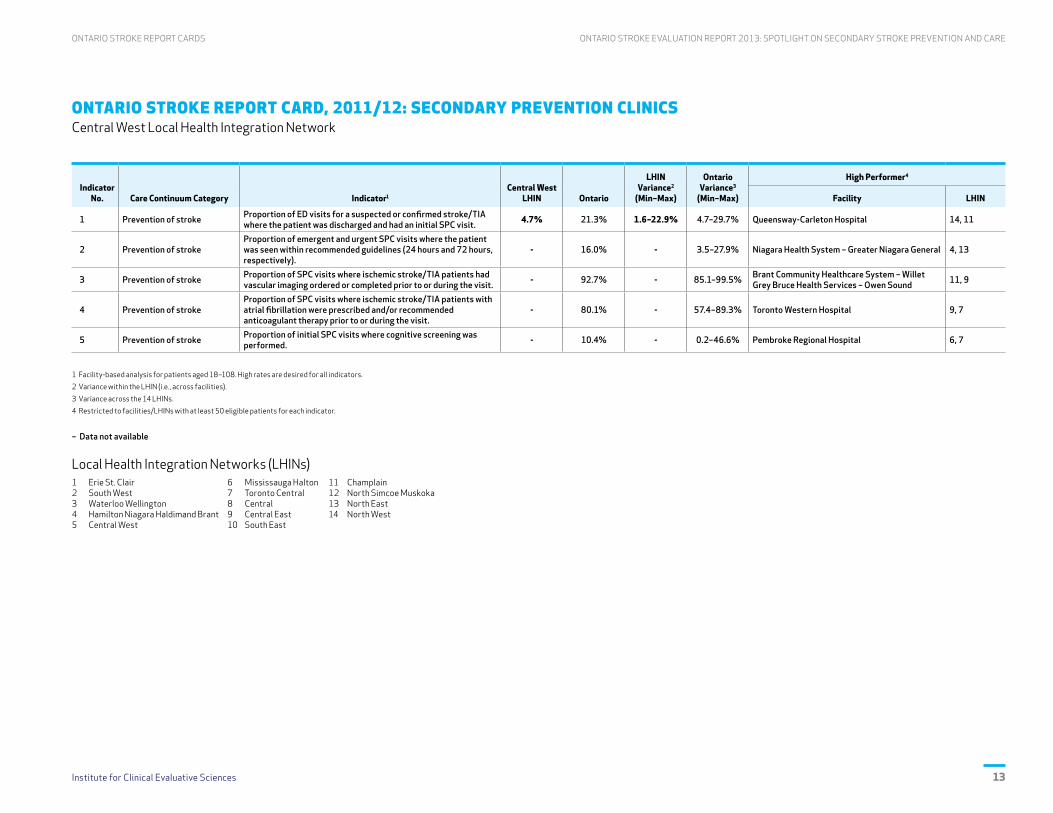
ONTARIO STROKE REPORT CARD, 2011/12: SECONDARY PREVENTION CLINICS Central West Local Health Integration Network
Indicator No. Care Continuum Category Indicator1
Central West LHIN Ontario
LHIN Variance2
(Min–Max)
Ontario Variance3
(Min–Max)
High Performer4
Facility LHIN
1 Prevention of stroke Proportion of ED visits for a suspected or confirmed stroke/TIA where the patient was discharged and had an initial SPC visit. 4.7% 21.3% 1.6–22.9% 4.7–29.7% Queensway-Carleton Hospital 14, 11
2 Prevention of strokeProportion of emergent and urgent SPC visits where the patient was seen within recommended guidelines (24 hours and 72 hours, respectively).
- 16.0% - 3.5–27.9% Niagara Health System – Greater Niagara General 4, 13
3 Prevention of stroke Proportion of SPC visits where ischemic stroke/TIA patients had vascular imaging ordered or completed prior to or during the visit. - 92.7% - 85.1–99.5% Brant Community Healthcare System – Willet
Grey Bruce Health Services – Owen Sound 11, 9
4 Prevention of strokeProportion of SPC visits where ischemic stroke/TIA patients with atrial fibrillation were prescribed and/or recommended anticoagulant therapy prior to or during the visit.
- 80.1% - 57.4–89.3% Toronto Western Hospital 9, 7
5 Prevention of stroke Proportion of initial SPC visits where cognitive screening was performed. - 10.4% - 0.2–46.6% Pembroke Regional Hospital 6, 7
1 Facility-based analysis for patients aged 18–108. High rates are desired for all indicators.
2 Variance within the LHIN (i.e., across facilities).
3 Variance across the 14 LHINs.
4 Restricted to facilities/LHINs with at least 50 eligible patients for each indicator.
– Data not available
Local Health Integration Networks (LHINs)1 Erie St. Clair 6 Mississauga Halton 11 Champlain2 South West 7 Toronto Central 12 North Simcoe Muskoka3 Waterloo Wellington 8 Central 13 North East4 Hamilton Niagara Haldimand Brant 9 Central East 14 North West5 Central West 10 South East

Institute for Clinical Evaluative Sciences14
ONTARIO STROKE EVALUATION REPORT 2013: SPOTLIGHT ON SECONDARY STROKE PREVENTION AND CARE ONTARIO STROKE REPORT CARDS
ONTARIO STROKE REPORT CARD, 2011/12 Mississauga Halton Local Health Integration Network
Poor performance1 Acceptable performance2 Exemplary performance3 Benchmark not available4
Indicator No. Care Continuum Category Indicator5
LHIN FY 2011/12
(2010/11)Variance Within LHIN (Min–Max)
Provincial Benchmark6
High Performer7
Sub-LHIN/Facility LHIN
1 Public awareness and patient education
Proportion of patients who arrived at ED less than 3.5 hours from stroke symptom onset. – (40.9%) – – (52.0%) Elgin Sub-LHIN 2, 11
2 Prevention of stroke Annual age- and sex-adjusted inpatient admission rate for stroke/TIA (per 1,000 population). 1.1 (1.2) 1.0–1.5 1.1 (1.1) Ottawa Centre Sub-LHIN 6, 9, 11
3 Prevention of stroke Risk-adjusted stroke/TIA mortality rate at 30 days (per 100 patients). 15.3 (14.4) 9.4–19.5 12.2 (14.3) Humber River Regional Hospital – Finch 7
4 Prevention of stroke Proportion of ischemic stroke/TIA patients with atrial fibrillation prescribed or recommended anticoagulant therapy on discharge from acute care. – (72.9%) – – (86.0%) Queensway-Carleton Hospital None
5 Prevention of stroke Proportion of ischemic stroke patients without atrial fibrillation who received carotid imaging prior to hospital discharge. – (82.9%) – – (92.8%) Markham Stouffville Hospital 5
6 Acute stroke management Proportion of suspected stroke/TIA patients who received a brain CT/MRI within 24 hours of arrival at ED. – (95.1%) – – (97.7%) Cambridge Memorial Hospital 5, 7
7 Acute stroke managementProportion of ischemic stroke patients who arrived at ED less than 3.5 hours from symptom onset and received acute thrombolytic therapy (tPA) (excluding those with contraindications).
– (51.7%) – – (61.2%) Trillium Health Centre None
8 Acute stroke management Proportion of stroke/TIA patients treated on a stroke unit at any time during their inpatient stay. – (40.2%) – – (87.5%) North Bay General Hospital None
9 Acute stroke management Proportion of stroke (excluding TIA) patients with a documented initial dysphagia screening performed during admission to acute care. – (70.2%) – – (83.7%) Thunder Bay Regional Health Sciences Centre 14
10 Acute stroke management Proportion of ALC days to total length of stay in acute care. 19.7% (24.6%) 3.5–22.8% 14.6% (14.0%) Grey Bruce Health Services – Owen Sound None
11 Acute stroke management Proportion of acute stroke (excluding TIA) patients discharged from acute care and admitted to inpatient rehabilitation. 35.9% (23.7%) 13.5–42.4% 42.6% (42.3%) Barrie and Area Sub-LHIN 14
12 Stroke rehabilitation Proportion of stroke (excluding TIA) patients discharged from acute care who received a referral for outpatient rehabilitation. – (6.5%) – – (12.1%) Burlington Sub-LHIN 14, 13
13 Stroke rehabilitation Median number of days between stroke (excluding TIA) onset and admission to stroke inpatient rehabilitation (RCG-1 and RCG-2). 9.0 (8.0) 8.0–12.5 6.5 (7.0) Northumberland Hills Hospital 9, 12
14 Stroke rehabilitation Rehabilitation therapy staff/bed ratio for inpatient stroke rehabilitation. – – – – –
15 Stroke rehabilitation Proportion of ALC days to total length of stay in inpatient rehabilitation (Active + ALC) (RCG-1). 1.4% (0.3%) 0.0–4.8% 5.2% (6.3%) William Osler Health System – Civic 5
16 Stroke rehabilitation Median FIM efficiency for moderate stroke in inpatient rehabilitation (RCG-1). 0.9 (1.0) 0.6–1.1 1.1 (1.1) Royal Victoria Regional Health Centre 9, 12
17 Stroke rehabilitation Mean number of CCAC visits provided to stroke/TIA patients in 2010/11 and 2011/12. 4.6 (5.8) n/a 7.9 (6.8) South East CCAC 10, 12
18 Stroke rehabilitation Proportion of patients admitted to inpatient rehabilitation with severe strokes (RPG = 1100 or 1110) (RCG-1). 39.5% (36.3%) 26.6–47.6% 48.6% (46.9%) Brant Community Healthcare System –Brantford None
19 Reintegration Proportion of stroke/TIA patients discharged from acute care to LTC/CCC (excluding patients originating from LTC/CCC). 8.5% (10.8%) 5.5–17.8% 3.7% (4.7%) Urban Guelph Sub-LHIN None
20 Reintegration Age- and sex-adjusted readmission rate at 30 days for patients with stroke/TIA for all diagnoses (per 100 patients). 8.4 (8.8) 1.5–15.3 8.0 (8.0) Mackenzie Health – Mackenzie Richmond Hill
Hospital 3, 11
Hospital Service Accountability Agreement indicators, 2010/11 – Data not available n/a Not applicable
1 Performance below the 50th percentile.
2 Performance at or above the 50th percentile and greater than 5% absolute/relative difference from the benchmark.
3 Benchmark achieved or performance within 5% absolute/relative difference from the benchmark.
4 Data not available or benchmark under development.
5 Facility-based analysis (excluding indicators 1, 2, 11, 12 and 19) for patients aged 18–108. Indicators 2, 3, 10, 11 and 13–20 are based on CIHI data. Data from the 2010/11 report card are displayed in brackets. For indicators 1, 4–9 and 12, performance ratings from the 2010/11 report card are presented. Low rates are desired for indicators 2, 3, 10, 13, 15, 19 and 20.
6 Provincial benchmarks were calculated using the ABC methodology and facility/sub-LHIN data, except for indicators 3, 15 and 20 where the provincial rate was used; 2010/11 benchmarks are displayed in brackets. For the benchmarking methodology, see Weissman et al. Journal of Evaluation in Clinical Practice 1999; 5(3):269-81.
7 High-performing acute care facilities include only high-volume institutions (those treating more than 100 strokes per year). High-performing rehabilitation facilities include sites with moderate to high volumes (those admitting more than 38 stroke patients per year). For indicators 1, 4–9 and 12, high performers from the 2010/11 report card are presented.

Institute for Clinical Evaluative Sciences 15
ONTARIO STROKE EVALUATION REPORT 2013: SPOTLIGHT ON SECONDARY STROKE PREVENTION AND CAREONTARIO STROKE REPORT CARDS
ONTARIO STROKE REPORT CARD, 2011/12: SECONDARY PREVENTION CLINICS Mississauga Halton Local Health Integration Network
Indicator No. Care Continuum Category Indicator1
Mississauga Halton LHIN Ontario
LHIN Variance2
(Min–Max)
Ontario Variance3
(Min–Max)
High Performer4
Facility LHIN
1 Prevention of stroke Proportion of ED visits for a suspected or confirmed stroke/TIA where the patient was discharged and had an initial SPC visit. 24.6% 21.3% 20.0–37.3% 4.7–29.7% Queensway-Carleton Hospital 14, 11
2 Prevention of strokeProportion of emergent and urgent SPC visits where the patient was seen within recommended guidelines (24 hours and 72 hours, respectively).
20.0% 16.0% 20.0–20.0% 3.5–27.9% Niagara Health System – Greater Niagara General 4, 13
3 Prevention of stroke Proportion of SPC visits where ischemic stroke/TIA patients had vascular imaging ordered or completed prior to or during the visit. 92.8% 92.7% 92.8–92.8% 85.1–99.5% Brant Community Healthcare System – Willet
Grey Bruce Health Services – Owen Sound 11, 9
4 Prevention of strokeProportion of SPC visits where ischemic stroke/TIA patients with atrial fibrillation were prescribed and/or recommended anticoagulant therapy prior to or during the visit.
82.6% 80.1% 82.6–82.6% 57.4–89.3% Toronto Western Hospital 9, 7
5 Prevention of stroke Proportion of initial SPC visits where cognitive screening was performed. 46.6% 10.4% 46.6–46.6% 0.2–46.6% Pembroke Regional Hospital 6, 7
1 Facility-based analysis for patients aged 18–108. High rates are desired for all indicators.
2 Variance within the LHIN (i.e., across facilities).
3 Variance across the 14 LHINs.
4 Restricted to facilities/LHINs with at least 50 eligible patients for each indicator.
Local Health Integration Networks (LHINs)1 Erie St. Clair 6 Mississauga Halton 11 Champlain2 South West 7 Toronto Central 12 North Simcoe Muskoka3 Waterloo Wellington 8 Central 13 North East4 Hamilton Niagara Haldimand Brant 9 Central East 14 North West5 Central West 10 South East

Institute for Clinical Evaluative Sciences16
ONTARIO STROKE EVALUATION REPORT 2013: SPOTLIGHT ON SECONDARY STROKE PREVENTION AND CARE ONTARIO STROKE REPORT CARDS
ONTARIO STROKE REPORT CARD, 2011/12 Toronto Central Local Health Integration Network
Poor performance1 Acceptable performance2 Exemplary performance3 Benchmark not available4
Indicator No. Care Continuum Category Indicator5
LHIN FY 2011/12
(2010/11)Variance Within LHIN (Min–Max)
Provincial Benchmark6
High Performer7
Sub-LHIN/Facility LHIN
1 Public awareness and patient education
Proportion of patients who arrived at ED less than 3.5 hours from stroke symptom onset. – (38.1%) – – (52.0%) Elgin Sub-LHIN 2, 11
2 Prevention of stroke Annual age- and sex-adjusted inpatient admission rate for stroke/TIA (per 1,000 population). 1.3 (1.3) 1.1–1.5 1.1 (1.1) Ottawa Centre Sub-LHIN 6, 9, 11
3 Prevention of stroke Risk-adjusted stroke/TIA mortality rate at 30 days (per 100 patients). 11.0 (12.7) 7.4–12.8 12.2 (14.3) Humber River Regional Hospital – Finch 7
4 Prevention of stroke Proportion of ischemic stroke/TIA patients with atrial fibrillation prescribed or recommended anticoagulant therapy on discharge from acute care. – (73.1%) – – (86.0%) Queensway-Carleton Hospital None
5 Prevention of stroke Proportion of ischemic stroke patients without atrial fibrillation who received carotid imaging prior to hospital discharge. – (87.4%) – – (92.8%) Markham Stouffville Hospital 5
6 Acute stroke management Proportion of suspected stroke/TIA patients who received a brain CT/MRI within 24 hours of arrival at ED. – (97.1%) – – (97.7%) Cambridge Memorial Hospital 5, 7
7 Acute stroke managementProportion of ischemic stroke patients who arrived at ED less than 3.5 hours from symptom onset and received acute thrombolytic therapy (tPA) (excluding those with contraindications).
– (45.5%) – – (61.2%) Trillium Health Centre None
8 Acute stroke management Proportion of stroke/TIA patients treated on a stroke unit at any time during their inpatient stay. – (35.8%) – – (87.5%) North Bay General Hospital None
9 Acute stroke management Proportion of stroke (excluding TIA) patients with a documented initial dysphagia screening performed during admission to acute care. – (69.6%) – – (83.7%) Thunder Bay Regional Health Sciences Centre 14
10 Acute stroke management Proportion of ALC days to total length of stay in acute care. 24.0% (28.8%) 13.3–39.3% 14.6% (14.0%) Grey Bruce Health Services – Owen Sound None
11 Acute stroke management Proportion of acute stroke (excluding TIA) patients discharged from acute care and admitted to inpatient rehabilitation. 29.1% (31.4%) 20.5–37.2% 42.6% (42.3%) Barrie and Area Sub-LHIN 14
12 Stroke rehabilitation Proportion of stroke (excluding TIA) patients discharged from acute care who received a referral for outpatient rehabilitation. – (5.2%) – – (12.1%) Burlington Sub-LHIN 14, 13
13 Stroke rehabilitation Median number of days between stroke (excluding TIA) onset and admission to stroke inpatient rehabilitation (RCG-1 and RCG-2). 12.0 (13.0) 9.5–16.0 6.5 (7.0) Northumberland Hills Hospital 9, 12
14 Stroke rehabilitation Rehabilitation therapy staff/bed ratio for inpatient stroke rehabilitation. – – – – –
15 Stroke rehabilitation Proportion of ALC days to total length of stay in inpatient rehabilitation (Active + ALC) (RCG-1). 4.7% (7.8%) 0.0–8.4% 5.2% (6.3%) William Osler Health System – Civic 5
16 Stroke rehabilitation Median FIM efficiency for moderate stroke in inpatient rehabilitation (RCG-1). 0.7 (0.6) 0.0–0.8 1.1 (1.1) Royal Victoria Regional Health Centre 9, 12
17 Stroke rehabilitation Mean number of CCAC visits provided to stroke/TIA patients in 2010/11 and 2011/12. 4.0 (4.7) n/a 7.9 (6.8) South East CCAC 10, 12
18 Stroke rehabilitation Proportion of patients admitted to inpatient rehabilitation with severe strokes (RPG = 1100 or 1110) (RCG-1). 22.0% (21.8%) 12.5–50.0% 48.6% (46.9%) Brant Community Healthcare System –Brantford None
19 Reintegration Proportion of stroke/TIA patients discharged from acute care to LTC/CCC (excluding patients originating from LTC/CCC). 13.1% (10.5%) 9.9–19.7% 3.7% (4.7%) Urban Guelph Sub-LHIN None
20 Reintegration Age- and sex-adjusted readmission rate at 30 days for patients with stroke/TIA for all diagnoses (per 100 patients). 8.5 (9.3) 0.0–9.7 8.0 (8.0) Mackenzie Health – Mackenzie Richmond Hill
Hospital 3, 11
Hospital Service Accountability Agreement indicators, 2010/11 – Data not available n/a Not applicable
1 Performance below the 50th percentile.
2 Performance at or above the 50th percentile and greater than 5% absolute/relative difference from the benchmark.
3 Benchmark achieved or performance within 5% absolute/relative difference from the benchmark.
4 Data not available or benchmark under development.
5 Facility-based analysis (excluding indicators 1, 2, 11, 12 and 19) for patients aged 18–108. Indicators 2, 3, 10, 11 and 13–20 are based on CIHI data. Data from the 2010/11 report card are displayed in brackets. For indicators 1, 4–9 and 12, performance ratings from the 2010/11 report card are presented. Low rates are desired for indicators 2, 3, 10, 13, 15, 19 and 20.
6 Provincial benchmarks were calculated using the ABC methodology and facility/sub-LHIN data, except for indicators 3, 15 and 20 where the provincial rate was used; 2010/11 benchmarks are displayed in brackets. For the benchmarking methodology, see Weissman et al. Journal of Evaluation in Clinical Practice 1999; 5(3):269-81.
7 High-performing acute care facilities include only high-volume institutions (those treating more than 100 strokes per year). High-performing rehabilitation facilities include sites with moderate to high volumes (those admitting more than 38 stroke patients per year). For indicators 1, 4–9 and 12, high performers from the 2010/11 report card are presented.

Institute for Clinical Evaluative Sciences 17
ONTARIO STROKE EVALUATION REPORT 2013: SPOTLIGHT ON SECONDARY STROKE PREVENTION AND CAREONTARIO STROKE REPORT CARDS
ONTARIO STROKE REPORT CARD, 2011/12: SECONDARY PREVENTION CLINICS Toronto Central Local Health Integration Network
Indicator No. Care Continuum Category Indicator1
Toronto Central LHIN Ontario
LHIN Variance2
(Min–Max)
Ontario Variance3
(Min–Max)
High Performer4
Facility LHIN
1 Prevention of stroke Proportion of ED visits for a suspected or confirmed stroke/TIA where the patient was discharged and had an initial SPC visit. 18.6% 21.3% 0.0–26.8% 4.7–29.7% Queensway-Carleton Hospital 14, 11
2 Prevention of strokeProportion of emergent and urgent SPC visits where the patient was seen within recommended guidelines (24 hours and 72 hours, respectively).
16.8% 16.0% 6.3–30.3% 3.5–27.9% Niagara Health System – Greater Niagara General 4, 13
3 Prevention of stroke Proportion of SPC visits where ischemic stroke/TIA patients had vascular imaging ordered or completed prior to or during the visit. 87.5% 92.7% 72.1–98.7% 85.1–99.5% Brant Community Healthcare System – Willet
Grey Bruce Health Services – Owen Sound 11, 9
4 Prevention of strokeProportion of SPC visits where ischemic stroke/TIA patients with atrial fibrillation were prescribed and/or recommended anticoagulant therapy prior to or during the visit.
85.9% 80.1% 82.9–87.5% 57.4–89.3% Toronto Western Hospital 9, 7
5 Prevention of stroke Proportion of initial SPC visits where cognitive screening was performed. 19.7% 10.4% 2.9–44.3% 0.2–46.6% Pembroke Regional Hospital 6, 7
1 Facility-based analysis for patients aged 18–108. High rates are desired for all indicators.
2 Variance within the LHIN (i.e., across facilities).
3 Variance across the 14 LHINs.
4 Restricted to facilities/LHINs with at least 50 eligible patients for each indicator.
Local Health Integration Networks (LHINs)1 Erie St. Clair 6 Mississauga Halton 11 Champlain2 South West 7 Toronto Central 12 North Simcoe Muskoka3 Waterloo Wellington 8 Central 13 North East4 Hamilton Niagara Haldimand Brant 9 Central East 14 North West5 Central West 10 South East

Institute for Clinical Evaluative Sciences18
ONTARIO STROKE EVALUATION REPORT 2013: SPOTLIGHT ON SECONDARY STROKE PREVENTION AND CARE ONTARIO STROKE REPORT CARDS
ONTARIO STROKE REPORT CARD, 2011/12 Central Local Health Integration Network
Poor performance1 Acceptable performance2 Exemplary performance3 Benchmark not available4
Indicator No. Care Continuum Category Indicator5
LHIN FY 2011/12
(2010/11)Variance Within LHIN (Min–Max)
Provincial Benchmark6
High Performer7
Sub-LHIN/Facility LHIN
1 Public awareness and patient education
Proportion of patients who arrived at ED less than 3.5 hours from stroke symptom onset. – (36.0%) – – (52.0%) Elgin Sub-LHIN 2, 11
2 Prevention of stroke Annual age- and sex-adjusted inpatient admission rate for stroke/TIA (per 1,000 population). 1.2 (1.2) 1.0–1.5 1.1 (1.1) Ottawa Centre Sub-LHIN 6, 9, 11
3 Prevention of stroke Risk-adjusted stroke/TIA mortality rate at 30 days (per 100 patients). 10.8 (14.2) 0.0–24.7 12.2 (14.3) Humber River Regional Hospital – Finch 7
4 Prevention of stroke Proportion of ischemic stroke/TIA patients with atrial fibrillation prescribed or recommended anticoagulant therapy on discharge from acute care. – (78.3%) – – (86.0%) Queensway-Carleton Hospital None
5 Prevention of stroke Proportion of ischemic stroke patients without atrial fibrillation who received carotid imaging prior to hospital discharge. – (82.4%) – – (92.8%) Markham Stouffville Hospital 5
6 Acute stroke management Proportion of suspected stroke/TIA patients who received a brain CT/MRI within 24 hours of arrival at ED. – (94.2%) – – (97.7%) Cambridge Memorial Hospital 5, 7
7 Acute stroke managementProportion of ischemic stroke patients who arrived at ED less than 3.5 hours from symptom onset and received acute thrombolytic therapy (tPA) (excluding those with contraindications).
– (23.6%) – – (61.2%) Trillium Health Centre None
8 Acute stroke management Proportion of stroke/TIA patients treated on a stroke unit at any time during their inpatient stay. – (40.5%) – – (87.5%) North Bay General Hospital None
9 Acute stroke management Proportion of stroke (excluding TIA) patients with a documented initial dysphagia screening performed during admission to acute care. – (58.7%) – – (83.7%) Thunder Bay Regional Health Sciences Centre 14
10 Acute stroke management Proportion of ALC days to total length of stay in acute care. 34.5% (38.1%) 24.4–39.5% 14.6% (14.0%) Grey Bruce Health Services – Owen Sound None
11 Acute stroke management Proportion of acute stroke (excluding TIA) patients discharged from acute care and admitted to inpatient rehabilitation. 24.0% (24.8%) 9.4–36.3% 42.6% (42.3%) Barrie and Area Sub-LHIN 14
12 Stroke rehabilitation Proportion of stroke (excluding TIA) patients discharged from acute care who received a referral for outpatient rehabilitation. – (8.2%) – – (12.1%) Burlington Sub-LHIN 14, 13
13 Stroke rehabilitation Median number of days between stroke (excluding TIA) onset and admission to stroke inpatient rehabilitation (RCG-1 and RCG-2). 10.0 (10.0) 7.5–15.0 6.5 (7.0) Northumberland Hills Hospital 9, 12
14 Stroke rehabilitation Rehabilitation therapy staff/bed ratio for inpatient stroke rehabilitation. – – – – –
15 Stroke rehabilitation Proportion of ALC days to total length of stay in inpatient rehabilitation (Active + ALC) (RCG-1). 1.9% (0.7%) 0.0–10.8% 5.2% (6.3%) William Osler Health System – Civic 5
16 Stroke rehabilitation Median FIM efficiency for moderate stroke in inpatient rehabilitation (RCG-1). 0.8 (0.7) 0.7–1.4 1.1 (1.1) Royal Victoria Regional Health Centre 9, 12
17 Stroke rehabilitation Mean number of CCAC visits provided to stroke/TIA patients in 2010/11 and 2011/12. 5.5 (6.5) n/a 7.9 (6.8) South East CCAC 10, 12
18 Stroke rehabilitation Proportion of patients admitted to inpatient rehabilitation with severe strokes (RPG = 1100 or 1110) (RCG-1). 16.5% (22.4%) 8.7–32.5% 48.6% (46.9%) Brant Community Healthcare System –Brantford None
19 Reintegration Proportion of stroke/TIA patients discharged from acute care to LTC/CCC (excluding patients originating from LTC/CCC). 11.5% (12.8%) 6.4–16.3% 3.7% (4.7%) Urban Guelph Sub-LHIN None
20 Reintegration Age- and sex-adjusted readmission rate at 30 days for patients with stroke/TIA for all diagnoses (per 100 patients). 7.8 (8.6) 4.5–18.3 8.0 (8.0) Mackenzie Health – Mackenzie Richmond Hill
Hospital 3, 11
Hospital Service Accountability Agreement indicators, 2010/11 – Data not available n/a Not applicable
1 Performance below the 50th percentile.
2 Performance at or above the 50th percentile and greater than 5% absolute/relative difference from the benchmark.
3 Benchmark achieved or performance within 5% absolute/relative difference from the benchmark.
4 Data not available or benchmark under development.
5 Facility-based analysis (excluding indicators 1, 2, 11, 12 and 19) for patients aged 18–108. Indicators 2, 3, 10, 11 and 13–20 are based on CIHI data. Data from the 2010/11 report card are displayed in brackets. For indicators 1, 4–9 and 12, performance ratings from the 2010/11 report card are presented. Low rates are desired for indicators 2, 3, 10, 13, 15, 19 and 20.
6 Provincial benchmarks were calculated using the ABC methodology and facility/sub-LHIN data, except for indicators 3, 15 and 20 where the provincial rate was used; 2010/11 benchmarks are displayed in brackets. For the benchmarking methodology, see Weissman et al. Journal of Evaluation in Clinical Practice 1999; 5(3):269-81.
7 High-performing acute care facilities include only high-volume institutions (those treating more than 100 strokes per year). High-performing rehabilitation facilities include sites with moderate to high volumes (those admitting more than 38 stroke patients per year). For indicators 1, 4–9 and 12, high performers from the 2010/11 report card are presented.

Institute for Clinical Evaluative Sciences 19
ONTARIO STROKE EVALUATION REPORT 2013: SPOTLIGHT ON SECONDARY STROKE PREVENTION AND CAREONTARIO STROKE REPORT CARDS
ONTARIO STROKE REPORT CARD, 2011/12: SECONDARY PREVENTION CLINICS Central Local Health Integration Network
Indicator No. Care Continuum Category Indicator1 Central LHIN Ontario
LHIN Variance2
(Min–Max)
Ontario Variance3
(Min–Max)
High Performer4
Facility LHIN
1 Prevention of stroke Proportion of ED visits for a suspected or confirmed stroke/TIA where the patient was discharged and had an initial SPC visit. 23.7% 21.3% 8.7–33.4% 4.7–29.7% Queensway-Carleton Hospital 14, 11
2 Prevention of strokeProportion of emergent and urgent SPC visits where the patient was seen within recommended guidelines (24 hours and 72 hours, respectively).
13.4% 16.0% 0.0–13.8% 3.5–27.9% Niagara Health System – Greater Niagara General 4, 13
3 Prevention of stroke Proportion of SPC visits where ischemic stroke/TIA patients had vascular imaging ordered or completed prior to or during the visit. 96.8% 92.7% 87.5–97.3% 85.1–99.5% Brant Community Healthcare System – Willet
Grey Bruce Health Services – Owen Sound 11, 9
4 Prevention of strokeProportion of SPC visits where ischemic stroke/TIA patients with atrial fibrillation were prescribed and/or recommended anticoagulant therapy prior to or during the visit.
82.9% 80.1% 66.7–88.0% 57.4–89.3% Toronto Western Hospital 9, 7
5 Prevention of stroke Proportion of initial SPC visits where cognitive screening was performed. 0.2% 10.4% 0.0–0.4% 0.2–46.6% Pembroke Regional Hospital 6, 7
1 Facility-based analysis for patients aged 18–108. High rates are desired for all indicators.
2 Variance within the LHIN (i.e., across facilities).
3 Variance across the 14 LHINs.
4 Restricted to facilities/LHINs with at least 50 eligible patients for each indicator.
Local Health Integration Networks (LHINs)1 Erie St. Clair 6 Mississauga Halton 11 Champlain2 South West 7 Toronto Central 12 North Simcoe Muskoka3 Waterloo Wellington 8 Central 13 North East4 Hamilton Niagara Haldimand Brant 9 Central East 14 North West5 Central West 10 South East

Institute for Clinical Evaluative Sciences20
ONTARIO STROKE EVALUATION REPORT 2013: SPOTLIGHT ON SECONDARY STROKE PREVENTION AND CARE ONTARIO STROKE REPORT CARDS
ONTARIO STROKE REPORT CARD, 2011/12 Central East Local Health Integration Network
Poor performance1 Acceptable performance2 Exemplary performance3 Benchmark not available4
Indicator No. Care Continuum Category Indicator5
LHIN FY 2011/12
(2010/11)Variance Within LHIN (Min–Max)
Provincial Benchmark6
High Performer7
Sub-LHIN/Facility LHIN
1 Public awareness and patient education
Proportion of patients who arrived at ED less than 3.5 hours from stroke symptom onset. – (39.0%) – – (52.0%) Elgin Sub-LHIN 2, 11
2 Prevention of stroke Annual age- and sex-adjusted inpatient admission rate for stroke/TIA (per 1,000 population). 1.1 (1.2) 1.1–1.3 1.1 (1.1) Ottawa Centre Sub-LHIN 6, 9, 11
3 Prevention of stroke Risk-adjusted stroke/TIA mortality rate at 30 days (per 100 patients). 11.6 (13.8) 0.0–23.2 12.2 (14.3) Humber River Regional Hospital – Finch 7
4 Prevention of stroke Proportion of ischemic stroke/TIA patients with atrial fibrillation prescribed or recommended anticoagulant therapy on discharge from acute care. – (75.4%) – – (86.0%) Queensway-Carleton Hospital None
5 Prevention of stroke Proportion of ischemic stroke patients without atrial fibrillation who received carotid imaging prior to hospital discharge. – (73.1%) – – (92.8%) Markham Stouffville Hospital 5
6 Acute stroke management Proportion of suspected stroke/TIA patients who received a brain CT/MRI within 24 hours of arrival at ED. – (88.2%) – – (97.7%) Cambridge Memorial Hospital 5, 7
7 Acute stroke managementProportion of ischemic stroke patients who arrived at ED less than 3.5 hours from symptom onset and received acute thrombolytic therapy (tPA) (excluding those with contraindications).
– (36.8%) – – (61.2%) Trillium Health Centre None
8 Acute stroke management Proportion of stroke/TIA patients treated on a stroke unit at any time during their inpatient stay. – (28.4%) – – (87.5%) North Bay General Hospital None
9 Acute stroke management Proportion of stroke (excluding TIA) patients with a documented initial dysphagia screening performed during admission to acute care. – (68.3%) – – (83.7%) Thunder Bay Regional Health Sciences Centre 14
10 Acute stroke management Proportion of ALC days to total length of stay in acute care. 23.5% (32.5%) 0.0–45.2% 14.6% (14.0%) Grey Bruce Health Services – Owen Sound None
11 Acute stroke management Proportion of acute stroke (excluding TIA) patients discharged from acute care and admitted to inpatient rehabilitation. 35.9% (33.4%) 25.2–44.6% 42.6% (42.3%) Barrie and Area Sub-LHIN 14
12 Stroke rehabilitation Proportion of stroke (excluding TIA) patients discharged from acute care who received a referral for outpatient rehabilitation. – (4.7%) – – (12.1%) Burlington Sub-LHIN 14, 13
13 Stroke rehabilitation Median number of days between stroke (excluding TIA) onset and admission to stroke inpatient rehabilitation (RCG-1 and RCG-2). 7.0 (7.0) 5.0–15.0 6.5 (7.0) Northumberland Hills Hospital 9, 12
14 Stroke rehabilitation Rehabilitation therapy staff/bed ratio for inpatient stroke rehabilitation. – – – – –
15 Stroke rehabilitation Proportion of ALC days to total length of stay in inpatient rehabilitation (Active + ALC) (RCG-1). 3.3% (3.7%) 0.0–6.8% 5.2% (6.3%) William Osler Health System – Civic 5
16 Stroke rehabilitation Median FIM efficiency for moderate stroke in inpatient rehabilitation (RCG-1). 1.1 (1.1) 0.7–1.7 1.1 (1.1) Royal Victoria Regional Health Centre 9, 12
17 Stroke rehabilitation Mean number of CCAC visits provided to stroke/TIA patients in 2010/11 and 2011/12. 5.3 (6.4) n/a 7.9 (6.8) South East CCAC 10, 12
18 Stroke rehabilitation Proportion of patients admitted to inpatient rehabilitation with severe strokes (RPG = 1100 or 1110) (RCG-1). 38.9% (36.1%) 17.9–57.1% 48.6% (46.9%) Brant Community Healthcare System –Brantford None
19 Reintegration Proportion of stroke/TIA patients discharged from acute care to LTC/CCC (excluding patients originating from LTC/CCC). 7.6% (8.7%) 4.6–10.1% 3.7% (4.7%) Urban Guelph Sub-LHIN None
20 Reintegration Age- and sex-adjusted readmission rate at 30 days for patients with stroke/TIA for all diagnoses (per 100 patients). 8.4 (7.5) 0.0–23.3 8.0 (8.0) Mackenzie Health – Mackenzie Richmond Hill
Hospital 3, 11
Hospital Service Accountability Agreement indicators, 2010/11 – Data not available n/a Not applicable
1 Performance below the 50th percentile.
2 Performance at or above the 50th percentile and greater than 5% absolute/relative difference from the benchmark.
3 Benchmark achieved or performance within 5% absolute/relative difference from the benchmark.
4 Data not available or benchmark under development.
5 Facility-based analysis (excluding indicators 1, 2, 11, 12 and 19) for patients aged 18–108. Indicators 2, 3, 10, 11 and 13–20 are based on CIHI data. Data from the 2010/11 report card are displayed in brackets. For indicators 1, 4–9 and 12, performance ratings from the 2010/11 report card are presented. Low rates are desired for indicators 2, 3, 10, 13, 15, 19 and 20.
6 Provincial benchmarks were calculated using the ABC methodology and facility/sub-LHIN data, except for indicators 3, 15 and 20 where the provincial rate was used; 2010/11 benchmarks are displayed in brackets. For the benchmarking methodology, see Weissman et al. Journal of Evaluation in Clinical Practice 1999; 5(3):269-81.
7 High-performing acute care facilities include only high-volume institutions (those treating more than 100 strokes per year). High-performing rehabilitation facilities include sites with moderate to high volumes (those admitting more than 38 stroke patients per year). For indicators 1, 4–9 and 12, high performers from the 2010/11 report card are presented.

Institute for Clinical Evaluative Sciences 21
ONTARIO STROKE EVALUATION REPORT 2013: SPOTLIGHT ON SECONDARY STROKE PREVENTION AND CAREONTARIO STROKE REPORT CARDS
ONTARIO STROKE REPORT CARD, 2011/12: SECONDARY PREVENTION CLINICS Central East Local Health Integration Network
Indicator No. Care Continuum Category Indicator1
Central East LHIN Ontario
LHIN Variance2
(Min–Max)
Ontario Variance3
(Min–Max)
High Performer4
Facility LHIN
1 Prevention of stroke Proportion of ED visits for a suspected or confirmed stroke/TIA where the patient was discharged and had an initial SPC visit. 16.6% 21.3% 1.5–36.9% 4.7–29.7% Queensway-Carleton Hospital 14, 11
2 Prevention of strokeProportion of emergent and urgent SPC visits where the patient was seen within recommended guidelines (24 hours and 72 hours, respectively).
13.8% 16.0% 0.0–17.9% 3.5–27.9% Niagara Health System – Greater Niagara General 4, 13
3 Prevention of stroke Proportion of SPC visits where ischemic stroke/TIA patients had vascular imaging ordered or completed prior to or during the visit. 98.0% 92.7% 93.6–99.4% 85.1–99.5% Brant Community Healthcare System – Willet
Grey Bruce Health Services – Owen Sound 11, 9
4 Prevention of strokeProportion of SPC visits where ischemic stroke/TIA patients with atrial fibrillation were prescribed and/or recommended anticoagulant therapy prior to or during the visit.
89.3% 80.1% 86.7–92.3% 57.4–89.3% Toronto Western Hospital 9, 7
5 Prevention of stroke Proportion of initial SPC visits where cognitive screening was performed. 2.5% 10.4% 0.0–10.5% 0.2–46.6% Pembroke Regional Hospital 6, 7
1 Facility-based analysis for patients aged 18–108. High rates are desired for all indicators.
2 Variance within the LHIN (i.e., across facilities).
3 Variance across the 14 LHINs.
4 Restricted to facilities/LHINs with at least 50 eligible patients for each indicator.
Local Health Integration Networks (LHINs)1 Erie St. Clair 6 Mississauga Halton 11 Champlain2 South West 7 Toronto Central 12 North Simcoe Muskoka3 Waterloo Wellington 8 Central 13 North East4 Hamilton Niagara Haldimand Brant 9 Central East 14 North West5 Central West 10 South East

Institute for Clinical Evaluative Sciences22
ONTARIO STROKE EVALUATION REPORT 2013: SPOTLIGHT ON SECONDARY STROKE PREVENTION AND CARE ONTARIO STROKE REPORT CARDS
ONTARIO STROKE REPORT CARD, 2011/12 South East Local Health Integration Network
Poor performance1 Acceptable performance2 Exemplary performance3 Benchmark not available4
Indicator No. Care Continuum Category Indicator5
LHIN FY 2011/12
(2010/11)Variance Within LHIN (Min–Max)
Provincial Benchmark6
High Performer7
Sub-LHIN/Facility LHIN
1 Public awareness and patient education
Proportion of patients who arrived at ED less than 3.5 hours from stroke symptom onset. – (37.0%) – – (52.0%) Elgin Sub-LHIN 2, 11
2 Prevention of stroke Annual age- and sex-adjusted inpatient admission rate for stroke/TIA (per 1,000 population). 1.3 (1.4) 0.5–2.1 1.1 (1.1) Ottawa Centre Sub-LHIN 6, 9, 11
3 Prevention of stroke Risk-adjusted stroke/TIA mortality rate at 30 days (per 100 patients). 13.8 (17.8) 0.0–22.7 12.2 (14.3) Humber River Regional Hospital – Finch 7
4 Prevention of stroke Proportion of ischemic stroke/TIA patients with atrial fibrillation prescribed or recommended anticoagulant therapy on discharge from acute care. – (71.5%) – – (86.0%) Queensway-Carleton Hospital None
5 Prevention of stroke Proportion of ischemic stroke patients without atrial fibrillation who received carotid imaging prior to hospital discharge. – (78.7%) – – (92.8%) Markham Stouffville Hospital 5
6 Acute stroke management Proportion of suspected stroke/TIA patients who received a brain CT/MRI within 24 hours of arrival at ED. – (81.9%) – – (97.7%) Cambridge Memorial Hospital 5, 7
7 Acute stroke managementProportion of ischemic stroke patients who arrived at ED less than 3.5 hours from symptom onset and received acute thrombolytic therapy (tPA) (excluding those with contraindications).
– (43.9%) – – (61.2%) Trillium Health Centre None
8 Acute stroke management Proportion of stroke/TIA patients treated on a stroke unit at any time during their inpatient stay. – (47.3%) – – (87.5%) North Bay General Hospital None
9 Acute stroke management Proportion of stroke (excluding TIA) patients with a documented initial dysphagia screening performed during admission to acute care. – (57.6%) – – (83.7%) Thunder Bay Regional Health Sciences Centre 14
10 Acute stroke management Proportion of ALC days to total length of stay in acute care. 20.3% (34.1%) 0.0–41.7% 14.6% (14.0%) Grey Bruce Health Services – Owen Sound None
11 Acute stroke management Proportion of acute stroke (excluding TIA) patients discharged from acute care and admitted to inpatient rehabilitation. 31.7% (29.4%) 6.7–50.0% 42.6% (42.3%) Barrie and Area Sub-LHIN 14
12 Stroke rehabilitation Proportion of stroke (excluding TIA) patients discharged from acute care who received a referral for outpatient rehabilitation. – (4.6%) – – (12.1%) Burlington Sub-LHIN 14, 13
13 Stroke rehabilitation Median number of days between stroke (excluding TIA) onset and admission to stroke inpatient rehabilitation (RCG-1 and RCG-2). 10.5 (13.0) 6.0–21.0 6.5 (7.0) Northumberland Hills Hospital 9, 12
14 Stroke rehabilitation Rehabilitation therapy staff/bed ratio for inpatient stroke rehabilitation. – – – – –
15 Stroke rehabilitation Proportion of ALC days to total length of stay in inpatient rehabilitation (Active + ALC) (RCG-1). 8.8% (6.9%) 4.3–14.8% 5.2% (6.3%) William Osler Health System – Civic 5
16 Stroke rehabilitation Median FIM efficiency for moderate stroke in inpatient rehabilitation (RCG-1). 0.9 (0.7) 0.4–1.1 1.1 (1.1) Royal Victoria Regional Health Centre 9, 12
17 Stroke rehabilitation Mean number of CCAC visits provided to stroke/TIA patients in 2010/11 and 2011/12. 10.9 (6.7) n/a 7.9 (6.8) South East CCAC 10, 12
18 Stroke rehabilitation Proportion of patients admitted to inpatient rehabilitation with severe strokes (RPG = 1100 or 1110) (RCG-1). 37.2% (36.7%) 29.8–56.3% 48.6% (46.9%) Brant Community Healthcare System –Brantford None
19 Reintegration Proportion of stroke/TIA patients discharged from acute care to LTC/CCC (excluding patients originating from LTC/CCC). 9.3% (11.2%) 0.0–17.4% 3.7% (4.7%) Urban Guelph Sub-LHIN None
20 Reintegration Age- and sex-adjusted readmission rate at 30 days for patients with stroke/TIA for all diagnoses (per 100 patients). 8.1 (5.6) 4.9–10.9 8.0 (8.0) Mackenzie Health – Mackenzie Richmond Hill
Hospital 3, 11
Hospital Service Accountability Agreement indicators, 2010/11 – Data not available n/a Not applicable
1 Performance below the 50th percentile.
2 Performance at or above the 50th percentile and greater than 5% absolute/relative difference from the benchmark.
3 Benchmark achieved or performance within 5% absolute/relative difference from the benchmark.
4 Data not available or benchmark under development.
5 Facility-based analysis (excluding indicators 1, 2, 11, 12 and 19) for patients aged 18–108. Indicators 2, 3, 10, 11 and 13–20 are based on CIHI data. Data from the 2010/11 report card are displayed in brackets. For indicators 1, 4–9 and 12, performance ratings from the 2010/11 report card are presented. Low rates are desired for indicators 2, 3, 10, 13, 15, 19 and 20.
6 Provincial benchmarks were calculated using the ABC methodology and facility/sub-LHIN data, except for indicators 3, 15 and 20 where the provincial rate was used; 2010/11 benchmarks are displayed in brackets. For the benchmarking methodology, see Weissman et al. Journal of Evaluation in Clinical Practice 1999; 5(3):269-81.
7 High-performing acute care facilities include only high-volume institutions (those treating more than 100 strokes per year). High-performing rehabilitation facilities include sites with moderate to high volumes (those admitting more than 38 stroke patients per year). For indicators 1, 4–9 and 12, high performers from the 2010/11 report card are presented.

Institute for Clinical Evaluative Sciences 23
ONTARIO STROKE EVALUATION REPORT 2013: SPOTLIGHT ON SECONDARY STROKE PREVENTION AND CAREONTARIO STROKE REPORT CARDS
ONTARIO STROKE REPORT CARD, 2011/12: SECONDARY PREVENTION CLINICS South East Local Health Integration Network
Indicator No. Care Continuum Category Indicator1
South East LHIN Ontario
LHIN Variance2
(Min–Max)
Ontario Variance3
(Min–Max)
High Performer4
Facility LHIN
1 Prevention of stroke Proportion of ED visits for a suspected or confirmed stroke/TIA where the patient was discharged and had an initial SPC visit. 26.9% 21.3% 17.7–35.1% 4.7–29.7% Queensway-Carleton Hospital 14, 11
2 Prevention of strokeProportion of emergent and urgent SPC visits where the patient was seen within recommended guidelines (24 hours and 72 hours, respectively).
7.1% 16.0% 0.0–40.0% 3.5–27.9% Niagara Health System – Greater Niagara General 4, 13
3 Prevention of stroke Proportion of SPC visits where ischemic stroke/TIA patients had vascular imaging ordered or completed prior to or during the visit. 91.4% 92.7% 89.2–96.7% 85.1–99.5% Brant Community Healthcare System – Willet
Grey Bruce Health Services – Owen Sound 11, 9
4 Prevention of strokeProportion of SPC visits where ischemic stroke/TIA patients with atrial fibrillation were prescribed and/or recommended anticoagulant therapy prior to or during the visit.
88.4% 80.1% 84.6–100.0% 57.4–89.3% Toronto Western Hospital 9, 7
5 Prevention of stroke Proportion of initial SPC visits where cognitive screening was performed. 1.3% 10.4% 0.0–3.0% 0.2–46.6% Pembroke Regional Hospital 6, 7
1 Facility-based analysis for patients aged 18–108. High rates are desired for all indicators.
2 Variance within the LHIN (i.e., across facilities).
3 Variance across the 14 LHINs.
4 Restricted to facilities/LHINs with at least 50 eligible patients for each indicator.
Local Health Integration Networks (LHINs)1 Erie St. Clair 6 Mississauga Halton 11 Champlain2 South West 7 Toronto Central 12 North Simcoe Muskoka3 Waterloo Wellington 8 Central 13 North East4 Hamilton Niagara Haldimand Brant 9 Central East 14 North West5 Central West 10 South East

Institute for Clinical Evaluative Sciences24
ONTARIO STROKE EVALUATION REPORT 2013: SPOTLIGHT ON SECONDARY STROKE PREVENTION AND CARE ONTARIO STROKE REPORT CARDS
ONTARIO STROKE REPORT CARD, 2011/12 Champlain Local Health Integration Network
Poor performance1 Acceptable performance2 Exemplary performance3 Benchmark not available4
Indicator No. Care Continuum Category Indicator5
LHIN FY 2011/12
(2010/11)Variance Within LHIN (Min–Max)
Provincial Benchmark6
High Performer7
Sub-LHIN/Facility LHIN
1 Public awareness and patient education
Proportion of patients who arrived at ED less than 3.5 hours from stroke symptom onset. – (48.4%) – – (52.0%) Elgin Sub-LHIN 2, 11
2 Prevention of stroke Annual age- and sex-adjusted inpatient admission rate for stroke/TIA (per 1,000 population). 1.1 (1.2) 0.9–1.9 1.1 (1.1) Ottawa Centre Sub-LHIN 6, 9, 11
3 Prevention of stroke Risk-adjusted stroke/TIA mortality rate at 30 days (per 100 patients). 12.0 (15.3) 0.0–28.5 12.2 (14.3) Humber River Regional Hospital – Finch 7
4 Prevention of stroke Proportion of ischemic stroke/TIA patients with atrial fibrillation prescribed or recommended anticoagulant therapy on discharge from acute care. – (80.4%) – – (86.0%) Queensway-Carleton Hospital None
5 Prevention of stroke Proportion of ischemic stroke patients without atrial fibrillation who received carotid imaging prior to hospital discharge. – (78.6%) – – (92.8%) Markham Stouffville Hospital 5
6 Acute stroke management Proportion of suspected stroke/TIA patients who received a brain CT/MRI within 24 hours of arrival at ED. – (92.8%) – – (97.7%) Cambridge Memorial Hospital 5, 7
7 Acute stroke managementProportion of ischemic stroke patients who arrived at ED less than 3.5 hours from symptom onset and received acute thrombolytic therapy (tPA) (excluding those with contraindications).
– (31.6%) – – (61.2%) Trillium Health Centre None
8 Acute stroke management Proportion of stroke/TIA patients treated on a stroke unit at any time during their inpatient stay. – (52.1%) – – (87.5%) North Bay General Hospital None
9 Acute stroke management Proportion of stroke (excluding TIA) patients with a documented initial dysphagia screening performed during admission to acute care. – (67.0%) – – (83.7%) Thunder Bay Regional Health Sciences Centre 14
10 Acute stroke management Proportion of ALC days to total length of stay in acute care. 28.1% (36.7%) 0.0–49.2% 14.6% (14.0%) Grey Bruce Health Services – Owen Sound None
11 Acute stroke management Proportion of acute stroke (excluding TIA) patients discharged from acute care and admitted to inpatient rehabilitation. 30.9% (30.2%) 4.8–39.1% 42.6% (42.3%) Barrie and Area Sub-LHIN 14
12 Stroke rehabilitation Proportion of stroke (excluding TIA) patients discharged from acute care who received a referral for outpatient rehabilitation. – (3.6%) – – (12.1%) Burlington Sub-LHIN 14, 13
13 Stroke rehabilitation Median number of days between stroke (excluding TIA) onset and admission to stroke inpatient rehabilitation (RCG-1 and RCG-2). 15.0 (13.0) 8.0–43.5 6.5 (7.0) Northumberland Hills Hospital 9, 12
14 Stroke rehabilitation Rehabilitation therapy staff/bed ratio for inpatient stroke rehabilitation. – – – – –
15 Stroke rehabilitation Proportion of ALC days to total length of stay in inpatient rehabilitation (Active + ALC) (RCG-1). 5.8% (5.8%) 0.0–9.3% 5.2% (6.3%) William Osler Health System – Civic 5
16 Stroke rehabilitation Median FIM efficiency for moderate stroke in inpatient rehabilitation (RCG-1). 0.7 (0.7) 0.1–1.1 1.1 (1.1) Royal Victoria Regional Health Centre 9, 12
17 Stroke rehabilitation Mean number of CCAC visits provided to stroke/TIA patients in 2010/11 and 2011/12. 5.1 (5.3) n/a 7.9 (6.8) South East CCAC 10, 12
18 Stroke rehabilitation Proportion of patients admitted to inpatient rehabilitation with severe strokes (RPG = 1100 or 1110) (RCG-1). 27.0% (25.9%) 0.0–41.7% 48.6% (46.9%) Brant Community Healthcare System –Brantford None
19 Reintegration Proportion of stroke/TIA patients discharged from acute care to LTC/CCC (excluding patients originating from LTC/CCC). 8.7% (11.6%) 5.7–10.0% 3.7% (4.7%) Urban Guelph Sub-LHIN None
20 Reintegration Age- and sex-adjusted readmission rate at 30 days for patients with stroke/TIA for all diagnoses (per 100 patients). 7.5 (7.3) 0.0–21.6 8.0 (8.0) Mackenzie Health – Mackenzie Richmond Hill
Hospital 3, 11
Hospital Service Accountability Agreement indicators, 2010/11 – Data not available n/a Not applicable
1 Performance below the 50th percentile.
2 Performance at or above the 50th percentile and greater than 5% absolute/relative difference from the benchmark.
3 Benchmark achieved or performance within 5% absolute/relative difference from the benchmark.
4 Data not available or benchmark under development.
5 Facility-based analysis (excluding indicators 1, 2, 11, 12 and 19) for patients aged 18–108. Indicators 2, 3, 10, 11 and 13–20 are based on CIHI data. Data from the 2010/11 report card are displayed in brackets. For indicators 1, 4–9 and 12, performance ratings from the 2010/11 report card are presented. Low rates are desired for indicators 2, 3, 10, 13, 15, 19 and 20.
6 Provincial benchmarks were calculated using the ABC methodology and facility/sub-LHIN data, except for indicators 3, 15 and 20 where the provincial rate was used; 2010/11 benchmarks are displayed in brackets. For the benchmarking methodology, see Weissman et al. Journal of Evaluation in Clinical Practice 1999; 5(3):269-81.
7 High-performing acute care facilities include only high-volume institutions (those treating more than 100 strokes per year). High-performing rehabilitation facilities include sites with moderate to high volumes (those admitting more than 38 stroke patients per year). For indicators 1, 4–9 and 12, high performers from the 2010/11 report card are presented.
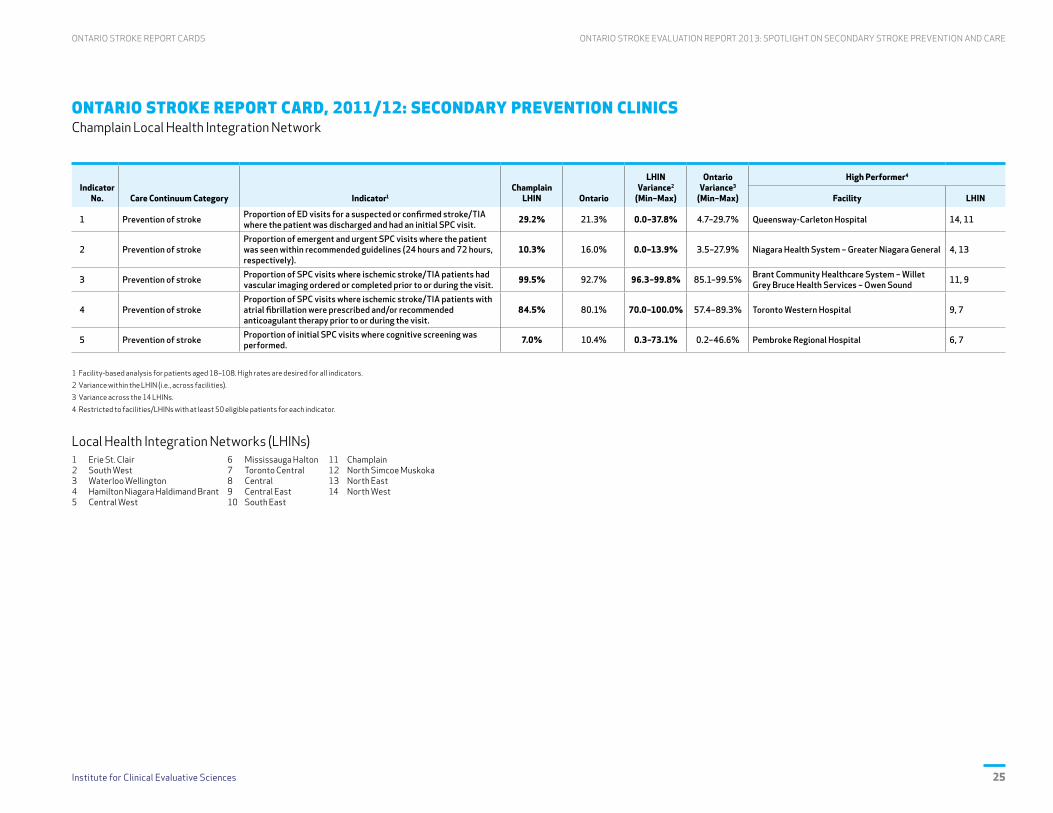
Institute for Clinical Evaluative Sciences 25
ONTARIO STROKE EVALUATION REPORT 2013: SPOTLIGHT ON SECONDARY STROKE PREVENTION AND CAREONTARIO STROKE REPORT CARDS
ONTARIO STROKE REPORT CARD, 2011/12: SECONDARY PREVENTION CLINICS Champlain Local Health Integration Network
Indicator No. Care Continuum Category Indicator1
Champlain LHIN Ontario
LHIN Variance2
(Min–Max)
Ontario Variance3
(Min–Max)
High Performer4
Facility LHIN
1 Prevention of stroke Proportion of ED visits for a suspected or confirmed stroke/TIA where the patient was discharged and had an initial SPC visit. 29.2% 21.3% 0.0–37.8% 4.7–29.7% Queensway-Carleton Hospital 14, 11
2 Prevention of strokeProportion of emergent and urgent SPC visits where the patient was seen within recommended guidelines (24 hours and 72 hours, respectively).
10.3% 16.0% 0.0–13.9% 3.5–27.9% Niagara Health System – Greater Niagara General 4, 13
3 Prevention of stroke Proportion of SPC visits where ischemic stroke/TIA patients had vascular imaging ordered or completed prior to or during the visit. 99.5% 92.7% 96.3–99.8% 85.1–99.5% Brant Community Healthcare System – Willet
Grey Bruce Health Services – Owen Sound 11, 9
4 Prevention of strokeProportion of SPC visits where ischemic stroke/TIA patients with atrial fibrillation were prescribed and/or recommended anticoagulant therapy prior to or during the visit.
84.5% 80.1% 70.0–100.0% 57.4–89.3% Toronto Western Hospital 9, 7
5 Prevention of stroke Proportion of initial SPC visits where cognitive screening was performed. 7.0% 10.4% 0.3–73.1% 0.2–46.6% Pembroke Regional Hospital 6, 7
1 Facility-based analysis for patients aged 18–108. High rates are desired for all indicators.
2 Variance within the LHIN (i.e., across facilities).
3 Variance across the 14 LHINs.
4 Restricted to facilities/LHINs with at least 50 eligible patients for each indicator.
Local Health Integration Networks (LHINs)1 Erie St. Clair 6 Mississauga Halton 11 Champlain2 South West 7 Toronto Central 12 North Simcoe Muskoka3 Waterloo Wellington 8 Central 13 North East4 Hamilton Niagara Haldimand Brant 9 Central East 14 North West5 Central West 10 South East

Institute for Clinical Evaluative Sciences26
ONTARIO STROKE EVALUATION REPORT 2013: SPOTLIGHT ON SECONDARY STROKE PREVENTION AND CARE ONTARIO STROKE REPORT CARDS
ONTARIO STROKE REPORT CARD, 2011/12 North Simcoe Muskoka Local Health Integration Network
Poor performance1 Acceptable performance2 Exemplary performance3 Benchmark not available4
Indicator No. Care Continuum Category Indicator5
LHIN FY 2011/12
(2010/11)Variance Within LHIN (Min–Max)
Provincial Benchmark6
High Performer7
Sub-LHIN/Facility LHIN
1 Public awareness and patient education
Proportion of patients who arrived at ED less than 3.5 hours from stroke symptom onset. – (41.9%) – – (52.0%) Elgin Sub-LHIN 2, 11
2 Prevention of stroke Annual age- and sex-adjusted inpatient admission rate for stroke/TIA (per 1,000 population). 1.4 (1.4) 1.4–1.8 1.1 (1.1) Ottawa Centre Sub-LHIN 6, 9, 11
3 Prevention of stroke Risk-adjusted stroke/TIA mortality rate at 30 days (per 100 patients). 13.9 (14.0) 9.5–19.3 12.2 (14.3) Humber River Regional Hospital – Finch 7
4 Prevention of stroke Proportion of ischemic stroke/TIA patients with atrial fibrillation prescribed or recommended anticoagulant therapy on discharge from acute care. – (71.9%) – – (86.0%) Queensway-Carleton Hospital None
5 Prevention of stroke Proportion of ischemic stroke patients without atrial fibrillation who received carotid imaging prior to hospital discharge. – (67.6%) – – (92.8%) Markham Stouffville Hospital 5
6 Acute stroke management Proportion of suspected stroke/TIA patients who received a brain CT/MRI within 24 hours of arrival at ED. – (89.9%) – – (97.7%) Cambridge Memorial Hospital 5, 7
7 Acute stroke managementProportion of ischemic stroke patients who arrived at ED less than 3.5 hours from symptom onset and received acute thrombolytic therapy (tPA) (excluding those with contraindications).
– (29.1%) – – (61.2%) Trillium Health Centre None
8 Acute stroke management Proportion of stroke/TIA patients treated on a stroke unit at any time during their inpatient stay. – (22.4%) – – (87.5%) North Bay General Hospital None
9 Acute stroke management Proportion of stroke (excluding TIA) patients with a documented initial dysphagia screening performed during admission to acute care. – (72.9%) – – (83.7%) Thunder Bay Regional Health Sciences Centre 14
10 Acute stroke management Proportion of ALC days to total length of stay in acute care. 28.6% (34.0%) 9.0–57.2% 14.6% (14.0%) Grey Bruce Health Services – Owen Sound None
11 Acute stroke management Proportion of acute stroke (excluding TIA) patients discharged from acute care and admitted to inpatient rehabilitation. 35.8% (27.9%) 23.3–46.7% 42.6% (42.3%) Barrie and Area Sub-LHIN 14
12 Stroke rehabilitation Proportion of stroke (excluding TIA) patients discharged from acute care who received a referral for outpatient rehabilitation. – (5.7%) – – (12.1%) Burlington Sub-LHIN 14, 13
13 Stroke rehabilitation Median number of days between stroke (excluding TIA) onset and admission to stroke inpatient rehabilitation (RCG-1 and RCG-2). 7.0 (8.0) 6.0–13.5 6.5 (7.0) Northumberland Hills Hospital 9, 12
14 Stroke rehabilitation Rehabilitation therapy staff/bed ratio for inpatient stroke rehabilitation. – – – – –
15 Stroke rehabilitation Proportion of ALC days to total length of stay in inpatient rehabilitation (Active + ALC) (RCG-1). 7.0% (4.9%) 0.0–27.1% 5.2% (6.3%) William Osler Health System – Civic 5
16 Stroke rehabilitation Median FIM efficiency for moderate stroke in inpatient rehabilitation (RCG-1). 1.1 (1.0) 0.4–1.5 1.1 (1.1) Royal Victoria Regional Health Centre 9, 12
17 Stroke rehabilitation Mean number of CCAC visits provided to stroke/TIA patients in 2010/11 and 2011/12. 8.6 (6.1) n/a 7.9 (6.8) South East CCAC 10, 12
18 Stroke rehabilitation Proportion of patients admitted to inpatient rehabilitation with severe strokes (RPG = 1100 or 1110) (RCG-1). 36.8% (36.6%) 8.8–49.4% 48.6% (46.9%) Brant Community Healthcare System –Brantford None
19 Reintegration Proportion of stroke/TIA patients discharged from acute care to LTC/CCC (excluding patients originating from LTC/CCC). 4.5% (7.6%) 2.5–8.5% 3.7% (4.7%) Urban Guelph Sub-LHIN None
20 Reintegration Age- and sex-adjusted readmission rate at 30 days for patients with stroke/TIA for all diagnoses (per 100 patients). 8.4 (8.7) 5.9–10.0 8.0 (8.0) Mackenzie Health – Mackenzie Richmond Hill
Hospital 3, 11
Hospital Service Accountability Agreement indicators, 2010/11 – Data not available n/a Not applicable
1 Performance below the 50th percentile.
2 Performance at or above the 50th percentile and greater than 5% absolute/relative difference from the benchmark.
3 Benchmark achieved or performance within 5% absolute/relative difference from the benchmark.
4 Data not available or benchmark under development.
5 Facility-based analysis (excluding indicators 1, 2, 11, 12 and 19) for patients aged 18–108. Indicators 2, 3, 10, 11 and 13–20 are based on CIHI data. Data from the 2010/11 report card are displayed in brackets. For indicators 1, 4–9 and 12, performance ratings from the 2010/11 report card are presented. Low rates are desired for indicators 2, 3, 10, 13, 15, 19 and 20.
6 Provincial benchmarks were calculated using the ABC methodology and facility/sub-LHIN data, except for indicators 3, 15 and 20 where the provincial rate was used; 2010/11 benchmarks are displayed in brackets. For the benchmarking methodology, see Weissman et al. Journal of Evaluation in Clinical Practice 1999; 5(3):269-81.
7 High-performing acute care facilities include only high-volume institutions (those treating more than 100 strokes per year). High-performing rehabilitation facilities include sites with moderate to high volumes (those admitting more than 38 stroke patients per year). For indicators 1, 4–9 and 12, high performers from the 2010/11 report card are presented.

Institute for Clinical Evaluative Sciences 27
ONTARIO STROKE EVALUATION REPORT 2013: SPOTLIGHT ON SECONDARY STROKE PREVENTION AND CAREONTARIO STROKE REPORT CARDS
ONTARIO STROKE REPORT CARD, 2011/12: SECONDARY PREVENTION CLINICS North Simcoe Muskoka Local Health Integration Network
Indicator No. Care Continuum Category Indicator1
North Simcoe Muskoka
LHIN Ontario
LHIN Variance2
(Min–Max)
Ontario Variance3
(Min–Max)
High Performer4
Facility LHIN
1 Prevention of stroke Proportion of ED visits for a suspected or confirmed stroke/TIA where the patient was discharged and had an initial SPC visit. 15.2% 21.3% 4.2–25.3% 4.7–29.7% Queensway-Carleton Hospital 14, 11
2 Prevention of strokeProportion of emergent and urgent SPC visits where the patient was seen within recommended guidelines (24 hours and 72 hours, respectively).
3.5% 16.0% 3.5–3.5% 3.5–27.9% Niagara Health System – Greater Niagara General 4, 13
3 Prevention of stroke Proportion of SPC visits where ischemic stroke/TIA patients had vascular imaging ordered or completed prior to or during the visit. 93.7% 92.7% 93.7–93.7% 85.1–99.5% Brant Community Healthcare System – Willet
Grey Bruce Health Services – Owen Sound 11, 9
4 Prevention of strokeProportion of SPC visits where ischemic stroke/TIA patients with atrial fibrillation were prescribed and/or recommended anticoagulant therapy prior to or during the visit.
85.7% 80.1% 85.7–85.7% 57.4–89.3% Toronto Western Hospital 9, 7
5 Prevention of stroke Proportion of initial SPC visits where cognitive screening was performed. 4.0% 10.4% 4.0–4.0% 0.2–46.6% Pembroke Regional Hospital 6, 7
1 Facility-based analysis for patients aged 18–108. High rates are desired for all indicators.
2 Variance within the LHIN (i.e., across facilities).
3 Variance across the 14 LHINs.
4 Restricted to facilities/LHINs with at least 50 eligible patients for each indicator.
Local Health Integration Networks (LHINs)1 Erie St. Clair 6 Mississauga Halton 11 Champlain2 South West 7 Toronto Central 12 North Simcoe Muskoka3 Waterloo Wellington 8 Central 13 North East4 Hamilton Niagara Haldimand Brant 9 Central East 14 North West5 Central West 10 South East

Institute for Clinical Evaluative Sciences28
ONTARIO STROKE EVALUATION REPORT 2013: SPOTLIGHT ON SECONDARY STROKE PREVENTION AND CARE ONTARIO STROKE REPORT CARDS
ONTARIO STROKE REPORT CARD, 2011/12 North East Local Health Integration Network
Poor performance1 Acceptable performance2 Exemplary performance3 Benchmark not available4
Indicator No. Care Continuum Category Indicator5
LHIN FY 2011/12
(2010/11)Variance Within LHIN (Min–Max)
Provincial Benchmark6
High Performer7
Sub-LHIN/Facility LHIN
1 Public awareness and patient education
Proportion of patients who arrived at ED less than 3.5 hours from stroke symptom onset. – (46.4%) – – (52.0%) Elgin Sub-LHIN 2, 11
2 Prevention of stroke Annual age- and sex-adjusted inpatient admission rate for stroke/TIA (per 1,000 population). 1.8 (1.8) 1.5–2.3 1.1 (1.1) Ottawa Centre Sub-LHIN 6, 9, 11
3 Prevention of stroke Risk-adjusted stroke/TIA mortality rate at 30 days (per 100 patients). 15.9 (17.0) 0.0–66.9 12.2 (14.3) Humber River Regional Hospital – Finch 7
4 Prevention of stroke Proportion of ischemic stroke/TIA patients with atrial fibrillation prescribed or recommended anticoagulant therapy on discharge from acute care. – (75.4%) – – (86.0%) Queensway-Carleton Hospital None
5 Prevention of stroke Proportion of ischemic stroke patients without atrial fibrillation who received carotid imaging prior to hospital discharge. – (84.5%) – – (92.8%) Markham Stouffville Hospital 5
6 Acute stroke management Proportion of suspected stroke/TIA patients who received a brain CT/MRI within 24 hours of arrival at ED. – (80.0%) – – (97.7%) Cambridge Memorial Hospital 5, 7
7 Acute stroke managementProportion of ischemic stroke patients who arrived at ED less than 3.5 hours from symptom onset and received acute thrombolytic therapy (tPA) (excluding those with contraindications).
– (25.7%) – – (61.2%) Trillium Health Centre None
8 Acute stroke management Proportion of stroke/TIA patients treated on a stroke unit at any time during their inpatient stay. – (41.4%) – – (87.5%) North Bay General Hospital None
9 Acute stroke management Proportion of stroke (excluding TIA) patients with a documented initial dysphagia screening performed during admission to acute care. – (64.8%) – – (83.7%) Thunder Bay Regional Health Sciences Centre 14
10 Acute stroke management Proportion of ALC days to total length of stay in acute care. 39.1% (37.4%) 0.0–97.7% 14.6% (14.0%) Grey Bruce Health Services – Owen Sound None
11 Acute stroke management Proportion of acute stroke (excluding TIA) patients discharged from acute care and admitted to inpatient rehabilitation. 31.3% (32.1%) 15.2–50.0% 42.6% (42.3%) Barrie and Area Sub-LHIN 14
12 Stroke rehabilitation Proportion of stroke (excluding TIA) patients discharged from acute care who received a referral for outpatient rehabilitation. – (9.8%) – – (12.1%) Burlington Sub-LHIN 14, 13
13 Stroke rehabilitation Median number of days between stroke (excluding TIA) onset and admission to stroke inpatient rehabilitation (RCG-1 and RCG-2). 9.0 (12.0) 7.0–39.0 6.5 (7.0) Northumberland Hills Hospital 9, 12
14 Stroke rehabilitation Rehabilitation therapy staff/bed ratio for inpatient stroke rehabilitation. – – – – –
15 Stroke rehabilitation Proportion of ALC days to total length of stay in inpatient rehabilitation (Active + ALC) (RCG-1). 5.3% (10.2%) 0.0–8.3% 5.2% (6.3%) William Osler Health System – Civic 5
16 Stroke rehabilitation Median FIM efficiency for moderate stroke in inpatient rehabilitation (RCG-1). 0.7 (0.6) 0.4–1.5 1.1 (1.1) Royal Victoria Regional Health Centre 9, 12
17 Stroke rehabilitation Mean number of CCAC visits provided to stroke/TIA patients in 2010/11 and 2011/12. 5.3 (6.4) n/a 7.9 (6.8) South East CCAC 10, 12
18 Stroke rehabilitation Proportion of patients admitted to inpatient rehabilitation with severe strokes (RPG = 1100 or 1110) (RCG-1). 23.1% (27.2%) 13.0–44.4% 48.6% (46.9%) Brant Community Healthcare System –Brantford None
19 Reintegration Proportion of stroke/TIA patients discharged from acute care to LTC/CCC (excluding patients originating from LTC/CCC). 5.8% (4.6%) 0.0–9.9% 3.7% (4.7%) Urban Guelph Sub-LHIN None
20 Reintegration Age- and sex-adjusted readmission rate at 30 days for patients with stroke/TIA for all diagnoses (per 100 patients). 9.0 (9.2) 0.0–20.0 8.0 (8.0) Mackenzie Health – Mackenzie Richmond Hill
Hospital 3, 11
Hospital Service Accountability Agreement indicators, 2010/11 – Data not available n/a Not applicable
1 Performance below the 50th percentile.
2 Performance at or above the 50th percentile and greater than 5% absolute/relative difference from the benchmark.
3 Benchmark achieved or performance within 5% absolute/relative difference from the benchmark.
4 Data not available or benchmark under development.
5 Facility-based analysis (excluding indicators 1, 2, 11, 12 and 19) for patients aged 18–108. Indicators 2, 3, 10, 11 and 13–20 are based on CIHI data. Data from the 2010/11 report card are displayed in brackets. For indicators 1, 4–9 and 12, performance ratings from the 2010/11 report card are presented. Low rates are desired for indicators 2, 3, 10, 13, 15, 19 and 20.
6 Provincial benchmarks were calculated using the ABC methodology and facility/sub-LHIN data, except for indicators 3, 15 and 20 where the provincial rate was used; 2010/11 benchmarks are displayed in brackets. For the benchmarking methodology, see Weissman et al. Journal of Evaluation in Clinical Practice 1999; 5(3):269-81.
7 High-performing acute care facilities include only high-volume institutions (those treating more than 100 strokes per year). High-performing rehabilitation facilities include sites with moderate to high volumes (those admitting more than 38 stroke patients per year). For indicators 1, 4–9 and 12, high performers from the 2010/11 report card are presented.

Institute for Clinical Evaluative Sciences 29
ONTARIO STROKE EVALUATION REPORT 2013: SPOTLIGHT ON SECONDARY STROKE PREVENTION AND CAREONTARIO STROKE REPORT CARDS
ONTARIO STROKE REPORT CARD, 2011/12: SECONDARY PREVENTION CLINICS North East Local Health Integration Network
Indicator No. Care Continuum Category Indicator1
North East LHIN Ontario
LHIN Variance2
(Min–Max)
Ontario Variance3
(Min–Max)
High Performer4
Facility LHIN
1 Prevention of stroke Proportion of ED visits for a suspected or confirmed stroke/TIA where the patient was discharged and had an initial SPC visit. 13.5% 21.3% 0.0–33.3% 4.7–29.7% Queensway-Carleton Hospital 14, 11
2 Prevention of strokeProportion of emergent and urgent SPC visits where the patient was seen within recommended guidelines (24 hours and 72 hours, respectively).
24.8% 16.0% 0.0–37.5% 3.5–27.9% Niagara Health System – Greater Niagara General 4, 13
3 Prevention of stroke Proportion of SPC visits where ischemic stroke/TIA patients had vascular imaging ordered or completed prior to or during the visit. 96.2% 92.7% 90.7–99.1% 85.1–99.5% Brant Community Healthcare System – Willet
Grey Bruce Health Services – Owen Sound 11, 9
4 Prevention of strokeProportion of SPC visits where ischemic stroke/TIA patients with atrial fibrillation were prescribed and/or recommended anticoagulant therapy prior to or during the visit.
75.9% 80.1% 71.4–80.0% 57.4–89.3% Toronto Western Hospital 9, 7
5 Prevention of stroke Proportion of initial SPC visits where cognitive screening was performed. 1.9% 10.4% 0.0–3.7% 0.2–46.6% Pembroke Regional Hospital 6, 7
1 Facility-based analysis for patients aged 18–108. High rates are desired for all indicators.
2 Variance within the LHIN (i.e., across facilities).
3 Variance across the 14 LHINs.
4 Restricted to facilities/LHINs with at least 50 eligible patients for each indicator.
Local Health Integration Networks (LHINs)1 Erie St. Clair 6 Mississauga Halton 11 Champlain2 South West 7 Toronto Central 12 North Simcoe Muskoka3 Waterloo Wellington 8 Central 13 North East4 Hamilton Niagara Haldimand Brant 9 Central East 14 North West5 Central West 10 South East

Institute for Clinical Evaluative Sciences30
ONTARIO STROKE EVALUATION REPORT 2013: SPOTLIGHT ON SECONDARY STROKE PREVENTION AND CARE ONTARIO STROKE REPORT CARDS
ONTARIO STROKE REPORT CARD, 2011/12 North West Local Health Integration Network
Poor performance1 Acceptable performance2 Exemplary performance3 Benchmark not available4
Indicator No. Care Continuum Category Indicator5
LHIN FY 2011/12
(2010/11)Variance Within LHIN (Min–Max)
Provincial Benchmark6
High Performer7
Sub-LHIN/Facility LHIN
1 Public awareness and patient education
Proportion of patients who arrived at ED less than 3.5 hours from stroke symptom onset. – (43.7%) – – (52.0%) Elgin Sub-LHIN 2, 11
2 Prevention of stroke Annual age- and sex-adjusted inpatient admission rate for stroke/TIA (per 1,000 population). 1.9 (1.9) 1.8–2.1 1.1 (1.1) Ottawa Centre Sub-LHIN 6, 9, 11
3 Prevention of stroke Risk-adjusted stroke/TIA mortality rate at 30 days (per 100 patients). 10.1 (11.9) 0.0–45.2 12.2 (14.3) Humber River Regional Hospital – Finch 7
4 Prevention of stroke Proportion of ischemic stroke/TIA patients with atrial fibrillation prescribed or recommended anticoagulant therapy on discharge from acute care. – (72.2%) – – (86.0%) Queensway-Carleton Hospital None
5 Prevention of stroke Proportion of ischemic stroke patients without atrial fibrillation who received carotid imaging prior to hospital discharge. – (85.4%) – – (92.8%) Markham Stouffville Hospital 5
6 Acute stroke management Proportion of suspected stroke/TIA patients who received a brain CT/MRI within 24 hours of arrival at ED. – (91.0%) – – (97.7%) Cambridge Memorial Hospital 5, 7
7 Acute stroke managementProportion of ischemic stroke patients who arrived at ED less than 3.5 hours from symptom onset and received acute thrombolytic therapy (tPA) (excluding those with contraindications).
– (31.5%) – – (61.2%) Trillium Health Centre None
8 Acute stroke management Proportion of stroke/TIA patients treated on a stroke unit at any time during their inpatient stay. – (70.1%) – – (87.5%) North Bay General Hospital None
9 Acute stroke management Proportion of stroke (excluding TIA) patients with a documented initial dysphagia screening performed during admission to acute care. – (88.9%) – – (83.7%) Thunder Bay Regional Health Sciences Centre 14
10 Acute stroke management Proportion of ALC days to total length of stay in acute care. 32.2% (42.8%) 0.0–86.3% 14.6% (14.0%) Grey Bruce Health Services – Owen Sound None
11 Acute stroke management Proportion of acute stroke (excluding TIA) patients discharged from acute care and admitted to inpatient rehabilitation. 39.1% (35.1%) 22.2–43.3% 42.6% (42.3%) Barrie and Area Sub-LHIN 14
12 Stroke rehabilitation Proportion of stroke (excluding TIA) patients discharged from acute care who received a referral for outpatient rehabilitation. – (16.1%) – – (12.1%) Burlington Sub-LHIN 14, 13
13 Stroke rehabilitation Median number of days between stroke (excluding TIA) onset and admission to stroke inpatient rehabilitation (RCG-1 and RCG-2). 10.5 (15.0) 10.5–10.5 6.5 (7.0) Northumberland Hills Hospital 9, 12
14 Stroke rehabilitation Rehabilitation therapy staff/bed ratio for inpatient stroke rehabilitation. – – – – –
15 Stroke rehabilitation Proportion of ALC days to total length of stay in inpatient rehabilitation (Active + ALC) (RCG-1). 7.8% (7.5%) 7.8–7.8% 5.2% (6.3%) William Osler Health System – Civic 5
16 Stroke rehabilitation Median FIM efficiency for moderate stroke in inpatient rehabilitation (RCG-1). 0.7 (0.7) 0.7–0.7 1.1 (1.1) Royal Victoria Regional Health Centre 9, 12
17 Stroke rehabilitation Mean number of CCAC visits provided to stroke/TIA patients in 2010/11 and 2011/12. 4.0 (4.8) n/a 7.9 (6.8) South East CCAC 10, 12
18 Stroke rehabilitation Proportion of patients admitted to inpatient rehabilitation with severe strokes (RPG = 1100 or 1110) (RCG-1). 41.4% (29.6%) 41.4–41.4% 48.6% (46.9%) Brant Community Healthcare System –Brantford None
19 Reintegration Proportion of stroke/TIA patients discharged from acute care to LTC/CCC (excluding patients originating from LTC/CCC). 5.3% (6.6%) 0.0–7.7% 3.7% (4.7%) Urban Guelph Sub-LHIN None
20 Reintegration Age- and sex-adjusted readmission rate at 30 days for patients with stroke/TIA for all diagnoses (per 100 patients). 8.2 (9.6) 0.0–24.1 8.0 (8.0) Mackenzie Health – Mackenzie Richmond Hill
Hospital 3, 11
Hospital Service Accountability Agreement indicators, 2010/11 – Data not available n/a Not applicable
1 Performance below the 50th percentile.
2 Performance at or above the 50th percentile and greater than 5% absolute/relative difference from the benchmark.
3 Benchmark achieved or performance within 5% absolute/relative difference from the benchmark.
4 Data not available or benchmark under development.
5 Facility-based analysis (excluding indicators 1, 2, 11, 12 and 19) for patients aged 18–108. Indicators 2, 3, 10, 11 and 13–20 are based on CIHI data. Data from the 2010/11 report card are displayed in brackets. For indicators 1, 4–9 and 12, performance ratings from the 2010/11 report card are presented. Low rates are desired for indicators 2, 3, 10, 13, 15, 19 and 20.
6 Provincial benchmarks were calculated using the ABC methodology and facility/sub-LHIN data, except for indicators 3, 15 and 20 where the provincial rate was used; 2010/11 benchmarks are displayed in brackets. For the benchmarking methodology, see Weissman et al. Journal of Evaluation in Clinical Practice 1999; 5(3):269-81.
7 High-performing acute care facilities include only high-volume institutions (those treating more than 100 strokes per year). High-performing rehabilitation facilities include sites with moderate to high volumes (those admitting more than 38 stroke patients per year). For indicators 1, 4–9 and 12, high performers from the 2010/11 report card are presented.

Institute for Clinical Evaluative Sciences 31
ONTARIO STROKE EVALUATION REPORT 2013: SPOTLIGHT ON SECONDARY STROKE PREVENTION AND CAREONTARIO STROKE REPORT CARDS
ONTARIO STROKE REPORT CARD, 2011/12: SECONDARY PREVENTION CLINICS North West Local Health Integration Network
Indicator No. Care Continuum Category Indicator1
North West LHIN Ontario
LHIN Variance2
(Min–Max)
Ontario Variance3
(Min–Max)
High Performer4
Facility LHIN
1 Prevention of stroke Proportion of ED visits for a suspected or confirmed stroke/TIA where the patient was discharged and had an initial SPC visit. 29.7% 21.3% 0.0–36.7% 4.7–29.7% Queensway-Carleton Hospital 14, 11
2 Prevention of strokeProportion of emergent and urgent SPC visits where the patient was seen within recommended guidelines (24 hours and 72 hours, respectively).
13.7% 16.0% 0.0–14.3% 3.5–27.9% Niagara Health System – Greater Niagara General 4, 13
3 Prevention of stroke Proportion of SPC visits where ischemic stroke/TIA patients had vascular imaging ordered or completed prior to or during the visit. 96.3% 92.7% 33.3–100.0% 85.1–99.5% Brant Community Healthcare System – Willet
Grey Bruce Health Services – Owen Sound 11, 9
4 Prevention of strokeProportion of SPC visits where ischemic stroke/TIA patients with atrial fibrillation were prescribed and/or recommended anticoagulant therapy prior to or during the visit.
75.8% 80.1% 75.0–100.0% 57.4–89.3% Toronto Western Hospital 9, 7
5 Prevention of stroke Proportion of initial SPC visits where cognitive screening was performed. 11.8% 10.4% 0.0–12.9% 0.2–46.6% Pembroke Regional Hospital 6, 7
1 Facility-based analysis for patients aged 18–108. High rates are desired for all indicators.
2 Variance within the LHIN (i.e., across facilities).
3 Variance across the 14 LHINs.
4 Restricted to facilities/LHINs with at least 50 eligible patients for each indicator.
Local Health Integration Networks (LHINs)1 Erie St. Clair 6 Mississauga Halton 11 Champlain2 South West 7 Toronto Central 12 North Simcoe Muskoka3 Waterloo Wellington 8 Central 13 North East4 Hamilton Niagara Haldimand Brant 9 Central East 14 North West5 Central West 10 South East

Institute for Clinical Evaluative Sciences32
ONTARIO STROKE EVALUATION REPORT 2013: SPOTLIGHT ON SECONDARY STROKE PREVENTION AND CARE
Appendices

Institute for Clinical Evaluative Sciences 33
APPENDICES ONTARIO STROKE EVALUATION REPORT 2013: SPOTLIGHT ON SECONDARY STROKE PREVENTION AND CARE
APPENDIX A Indicator Definitions
Through a series of internal reviews, and utilizing the Canadian Stroke Strategy’s 2008 Performance Measurement Manual, the Stroke Evaluation and Quality Committee (SEQC) identified a core set of 45 performance indicators and associated databases to evaluate how well the Ontario Stroke System provides care across the province. The SEQC also identified a subset of 20 key indicators considered integral to system efficiency and effectiveness to be
presented in the report cards. Five of the 20 indicators are population-based; the remainder are facility-based indicators. The majority (75%) of the indicators are process-based.
In 2011/12, a supplementary report card was produced to highlight data from the Ontario Stroke Audit of Secondary Prevention Clinics (OSA-SPC). The SEQC identified a core set of 16 SPC indicators obtained from the Canadian Stroke Strategy’s 2008
Performance Measurement Manual. From this list, the Ontario Stroke Network’s Acute and Secondary Prevention Best Practice Subcommittee ranked the top five indicators to be presented in an SPC report card. The SEQC selected four of these key indicators and added a fifth indicator as an emerging indicator of interest to be included in the SPC report card.
Indicator No. Definition Calculation Data Source
Public Awareness and Patient Education
1 Proportion of patients who arrived at ED less than 3.5 hours from stroke symptom onset
Numerator: Number of stroke/TIA patients arriving at an ED within 3.5 hours of stroke/TIA symptom onset (includes UTD)Denominator: Total number of patients admitted to an ED for suspected stroke/TIA (includes UTD)*Population-based analysis (patient’s LHIN)
OSA Acute
Prevention of Stroke
2 Annual age- and sex-adjusted inpatient admission rate for stroke/TIA (per 1,000 population)
Adult stroke/TIA admissions to acute care inpatient setting per 1,000 population*Population-based analysis (patient’s LHIN), standardized using Ontario’s 2003/04 population CIHI-DAD
3 Risk-adjusted stroke/TIA mortality rate at 30 days (per 100 patients)
Risk-adjusted mortality rate per 100 patients within 30 days of stroke/TIA index event between April 1, 2011 and February 29, 2012 (includes inpatients only)Risk-adjusted model: Age + sex + ambulance arrival + atrial fibrillation + stroke/TIA + coronary artery disease or percutaneous coronary intervention or coronary artery bypass graft + carotid disease or carotid endarterectomy/stent + diabetes + hypertension + peripheral vascular disease + hyperlipidemia + stroke type
CIHI-DAD, RPDB
4Proportion of ischemic stroke/TIA patients with atrial fibrillation prescribed or recommended anticoagulant therapy on discharge from acute care
Numerator: Number of ischemic stroke/TIA patients with a history of or new onset of atrial fibrillation prescribed or recommended (as part of short-term treatment plan but not prescribed) anticoagulant therapy on discharge from acute care Denominator: Total number of ischemic stroke/TIA patients with a diagnosis of atrial fibrillation (history of or new onset) discharged alive from an ED or inpatient acute care
OSA Acute
5Proportion of ischemic stroke patients without atrial fibrillation who received carotid imaging prior to hospital discharge
Numerator: Number of ischemic stroke inpatients without atrial fibrillation who had carotid imaging completed prior to hospital discharge (does NOT include patients where documentation indicated “booked”)Denominator: Total number of admitted ischemic stroke inpatients without atrial fibrillation (history of or new onset)
OSA Acute
Acute Stroke Management
6Proportion of suspected stroke/TIA patients who received a brain CT/MRI scan within 24 hours of arrival at ED
Numerator: Number of stroke/TIA/UTD patients who arrived at the ED and had an initial CT or MRI scan completed within 24 hours of arrival (includes UTD)Denominator: Total number of stroke/TIA/UTD patients admitted to an ED and/or inpatient care (excludes patients with missing scan time) OSA Acute
7Proportion of ischemic stroke patients who arrived at ED less than 3.5 hours from symptom onset and received acute thrombolytic therapy (tPA)
Numerator: Number of ischemic stroke patients who received thrombolytic therapyDenominator: Total number of ischemic stroke patients who arrived at an ED within 3.5 hours of stroke symptom onset (excludes patients with contraindications)
OSA Acute

Institute for Clinical Evaluative Sciences34
ONTARIO STROKE EVALUATION REPORT 2013: SPOTLIGHT ON SECONDARY STROKE PREVENTION AND CARE APPENDICES
8Proportion of stroke/TIA patients treated on a stroke unit at any time during their inpatient stay (HSAA indicator)
Numerator: Number of stroke/TIA inpatients treated in an acute care stroke unit at any time during hospital stayDenominator: Total number of stroke/TIA patients admitted to hospital*A stroke unit is a specialized, geographically-located hospital unit with a dedicated stroke team and stroke resources (e.g., care pathway, educational materials, monitored beds). The unit does not need to have all of these resources or be exclusively used for stroke patients, but it must be in one location in the hospital.
OSA Acute
9Proportion of stroke (excluding TIA) patients with a documented initial dysphagia screening performed during admission to acute care
Numerator: Number of stroke patients with a documented dysphagia screening or assessment performed within 72 hours of hospital arrivalDenominator: Total number of acute care stroke inpatients (excludes unconscious patients and TIA patients) OSA Acute
10 Proportion of Alternate Level of Care (ALC) days to total length of stay in acute care
Numerator: Sum of ALC daysDenominator: Total number of LOS days among stroke/TIA patients admitted to inpatient care CIHI-DAD
11Proportion of stroke (excluding TIA) patients discharged from acute care and admitted to inpatient rehabilitation (HSAA indicator)
Numerator: Number of stroke inpatients admitted to inpatient rehabilitationDenominator: Total number of stroke inpatients discharged alive from acute care (excludes TIA patients)*Population-based analysis (patient’s LHIN)
CIHI-DAD, CIHI-NRS
Stroke Rehabilitation
12Proportion of stroke (excluding TIA) patients discharged from acute care who received a referral for outpatient rehabilitation
Numerator: Number of stroke patients discharged alive from acute care and referred to outpatient rehabilitation Denominator: Total number of stroke patients discharged alive from acute care (excludes TIA patients)*Population-based analysis (patient’s LHIN)
OSA Acute
13Median number of days between stroke (excluding TIA) onset and admission to stroke inpatient rehabilitation
Median time from stroke onset to admission to inpatient rehabilitation for all stroke patients (RCG-1 and RCG-2) admitted to inpatient rehabilitation (excludes TIA patients)
CIHI-DAD, CIHI-NRS
14 Rehabilitation therapy staff/bed ratio for inpatient stroke rehabilitation Unavailable in 2010/11 Questionnaire
15 Proportion of ALC days to total length of stay in inpatient rehabilitation (active + ALC)
Numerator: Sum of ALC daysDenominator: Total number of LOS days among all stroke inpatient rehabilitation patients (RCG-1)
CIHI-DAD, CIHI-NRS
16 Median FIM efficiency for moderate stroke in inpatient rehabilitation
FIM efficiency = (FIM discharge – FIM admission)/LOS (includes all stroke patients with moderate disability (RCG-1) admitted to inpatient rehabilitation)* Moderate disability = RPGs 1120, 1130 and 1140 CIHI-NRS
17 Mean number of CCAC visits provided to stroke/TIA patients in 2010/11 and 2011/12
Numerator: Total number of rehabilitation services visits (involving physiotherapy, occupational therapy, speech language pathology, social work) within 180 days of discharge from inpatient care (HCD 2010/11 and 2011/12)Denominator: Total number of stroke/TIA patients who received a CCAC rehabilitation visit within 60 days of discharge from inpatient care (DAD 2010/11)
CIHI-DAD, HCD
System Integration
18 Proportion of patients admitted to inpatient rehabilitation with severe stroke
Numerator: Number of stroke patients with severe disability (RPG 1100 or 1110) in inpatient rehabilitationDenominator: Total number of stroke (RCG-1) patients admitted to inpatient rehabilitation CIHI-NRS
19Proportion of stroke/TIA patients discharged from acute care to LTC/CCC (excluding patients originating from LTC/CCC)
Numerator: Number of stroke/TIA patients discharged to LTC/CCCDenominator: Total number of stroke/TIA admitted patients discharged alive (excludes patients originating from LTC/nursing home/CCC)*Population-based analysis (patient’s LHIN)
CIHI-DAD
20Age- and sex-adjusted readmission rate at 30 days for patients with stroke/TIA for all diagnoses (per 100 patients) (HSAA indicator)
Numerator: Total number of non-elective readmissions to acute inpatient care due to any cause (CIHI-DAD only)Denominator: Total number of alive ED/DAD stroke separations between April 1, 2011 and February 29, 2012 (CIHI-DAD/NACRS) (excludes transfers and elective admissions)
CIHI-DAD, CIHI-NACRS
Prevention of Stroke
SPC 1Proportion of ED visits for a suspected or confirmed stroke/TIA where the patient was discharged and had an initial SPC visit
Numerator: Number of patients who had a completed referral and first clinic visit in an SPC. NACRS date should be same date or prior to referral date (includes multiple initial visits).Denominator: Total number of suspected stroke/TIA patients discharged alive directly from an ED between April 1, 2011 and March 31, 2012, to place of residence (e.g., home or retirement home) (includes multiple visits; excludes patients with a planned or scheduled ED visit)
CIHI-NACRS, OSA-SPC
SPC 2Proportion of emergent and urgent SPC visits where the patient was seen within recommended guidelines (24 hours and 72 hours, respectively)
Numerator: Number of first clinic visits completed for emergent and urgent cases within recommended guidelinesDenominator: Total number of first clinic visits completed for emergent and urgent cases (excludes visits in which the patient refused or rescheduled the first scheduled appointment or had missing referral dates)*Emergent = 24 hours, urgent = 72 hours of referral (emergent and urgent case assignment is determined by the triage level algorithm used in the OSA-SPC 2011/12 application)
OSA-SPC
SPC 3Proportion of SPC visits where ischemic stroke/TIA patients had vascular imaging ordered or completed prior to or during the visit
Numerator: Number of SPC visits with vascular imaging ordered at any time (prior to, at or after SPC visit). Imaging completed with an unknown date was combined.Denominator: Total number of completed first clinic visits with an initial SPC diagnosis of ischemic stroke or TIAVascular imaging = carotid Doppler, CT angiography, MRI angiography, catheter angiography, or transcranial Doppler
OSA-SPC

Institute for Clinical Evaluative Sciences 35
APPENDICES ONTARIO STROKE EVALUATION REPORT 2013: SPOTLIGHT ON SECONDARY STROKE PREVENTION AND CARE
SPC 4
Proportion of SPC visits where ischemic stroke/TIA patients with atrial fibrillation were prescribed and/or recommended anticoagulant therapy prior to or during the visit
Numerator: Number of SPC visits with ischemic stroke/TIA patients who had a history of atrial fibrillation and were prescribed or recommended anticoagulant therapy at any time (prior to initial SPC visit, at SPC visit, at both times, or at SPC follow-up visit if it occurred within 1 week of initial visit)Denominator: Total number of visits with an initial SPC diagnosis of ischemic stroke/TIA who had a history of or newly diagnosed (if follow-up occurred within 1 week of initial SPC visit) atrial fibrillation and were referred to an SPC and had a completed first clinic visit
OSA-SPC
SPC 5 Proportion of initial SPC visits where cognitive screening was performed
Numerator: Number of visits where a screen for cognitive functioning was performed with a validated toolDenominator: Total number of initial SPC visits OSA-SPC
CCAC = Community Care Access Centre
CCC = complex continuing care
CIHI-DAD = Canadian Institute for Health Information, Discharge Abstract Database
CIHI-NACRS = Canadian Institute for Health Information, National Ambulatory Care Reporting System
CIHI-NRS = Canadian Institute for Health Information, National Rehabilitation Reporting System
CT = computed tomography
ED = emergency department
HCD = Home Care Database
HSAA = Hospital Service Accountability Agreement
LHIN = Local Health Integration Network
LTC = long-term care
MRI = magnetic resonance imaging
OSA-SPC = Ontario Stroke Audit of Secondary Prevention Clinics
RCG = Rehabilitation Client Group (describes primary reason for admission to rehabilitation)
RPG = Rehabilitation Patient Group (describes stroke severity)
SPC = secondary stroke prevention clinic
TIA = transient ischemic attack
UTD = unable to determine (uncertain diagnosis or undetermined stroke type)

Institute for Clinical Evaluative Sciences36
ONTARIO STROKE EVALUATION REPORT 2013: SPOTLIGHT ON SECONDARY STROKE PREVENTION AND CARE APPENDICES
APPENDIX B Methodology
Indicator Performance
Performance was analyzed at the facility, sub-LHIN, LHIN and provincial level for those indicators with data available (indicators 2, 3, 10, 11, 13 and 15–20). Trends in performance were determined by comparing the performance results from the 2010/11 and 2011/12 report cards. This allows the LHINs to quickly compare their performance across years. The range of performance results (minimum and maximum) was also included for each indicator. The provincial report card includes the range of performance results across 14 LHINs and each LHIN report card includes the range of performance results across all facilities within the LHIN (including those with small sample sizes).
Benchmark Calculations
Provincial benchmarks were calculated for a subset of indicators presented in the Ontario Stroke Report Cards. These calculations followed the Achievable Benchmarks of Care (ABC) methodology,1 which summarizes the performance results of the top-ranked facilities representing at least 20% of all patients eligible for the appropriate care. The
calculations used demonstrated care data from a few facilities (i.e., not only the top-ranked facility), and therefore the resulting benchmarks were achievable.
The following steps were used to calculate each benchmark: 1. Rank the care providers (facilities or sub-LHINs) in
descending order of performance on the process indicator;
2. Beginning with the highest-performing care provider (note that low performance results are desired for indicators 2, 3, 10, 13, 15, 19 and 20), add providers until at least 20% of the total number of patients are represented (in the denominator); and
3. Calculate the benchmark using only the providers selected in step 2 (20%) by dividing the total number of patients who received appropriate care by the total number of patients eligible for the care in the subset.
To ensure that high-performing care providers with low numbers of patients did not unduly influence the benchmark rates, the performance results of facilities or sub-LHINs with small sample sizes and high performance levels were adjusted and rank order was based on the adjusted performance results. The
benchmarks were calculated by ranking sub-LHIN performance, not facilities, for population-based indicators (report card indicators 1, 2, 11, 12 and 19). Benchmarks for report card indicators 3, 15 and 20 did not use the ABC methodology; the provincial performance result was used.
Colour Banding
Red, green and yellow colour bands were used to rate regional performance relative to the benchmark for each indicator, with red representing poor performance (below the 50th percentile), green indicating exemplary performance (within 5% of the benchmark), and yellow representing acceptable performance (at or above the 50th percentile but beyond 5% of the benchmark). Colour bands were not assigned for indicators 3, 15 and 20, since ABC benchmark calculations were not feasible this year. The colour bands for indicators 1, 4–9 and 12 remain the same as for the 2010/11 report cards and reflect the 2010/11 OSA data and benchmarks.
1 Weissman NW, Allison JJ, Keife CI, et al. Achievable benchmarks of care: the ABCs of benchmarking. J Eval Clin Pract. 1999; 5(3): 269-81.

Institute for Clinical Evaluative Sciences 37
APPENDICES ONTARIO STROKE EVALUATION REPORT 2013: SPOTLIGHT ON SECONDARY STROKE PREVENTION AND CARE
High Performers
Facilities or sub-LHINs with the highest performance result were identified for each indicator in order to highlight achievements made across the province, facilitate dialogue among regions, and drive system improvement. In order to be considered a high-performing facility/region, acute care facilities had to have annual volumes of more than 100 stroke/TIA patients per year, and rehabilitation facilities had to have sample sizes greater than the median number of patients admitted to inpatient rehabilitation in that year (approximately 40 patients each year). High-performing sub-LHINs had to have sample sizes greater than the median sample size for each indicator. The two highest-performing LHINs for each indicator were also identified. These LHINs had performance rates within 5% of the provincial benchmark, with the exception of indicators 3 and 20, for which the highest-performing LHIN had a performance rate that was lower than the provincial average by a statistically significant amount. For some indicators, no single LHIN had exemplary performance, so in these cases no high-performing LHINs were identified. These results were not unexpected as each LHIN’s performance is an aggregate of the performance results of all facilities in the LHIN.

Institute for Clinical Evaluative Sciences38
ONTARIO STROKE EVALUATION REPORT 2013: SPOTLIGHT ON SECONDARY STROKE PREVENTION AND CARE APPENDICES
APPENDIX C Contact Information for High-Performing Facilities and Sub-LHINs by Indicator
IndicatorHigh-Performing Facility/Sub-LHIN Contact Information
Proportion of patients who arrived at ED less than 3.5 hours from stroke symptom onset
Elgin Sub-LHIN
Gwen StevensonDistrict Stroke Coordinator, Southwestern Ontario Stroke Network Prevention and Thames [email protected] ext. 32264
Age- and sex-adjusted inpatient admission rate for stroke/TIA (per 1,000 population)
Ottawa Centre Sub-LHIN
Jim LumsdenDirector, Champlain Regional Stroke [email protected] ext. 16167
Risk-adjusted stroke/TIA mortality rate at 30 days (per 100 patients)
Humber River Regional Hospital, Finch site
Shelley SharpRegional Director, Toronto West Stroke [email protected]
Proportion of ischemic stroke/TIA patients with atrial fibrillation prescribed or recommended anticoagulant therapy on discharge from acute care
Queensway-Carleton Hospital
Jim LumsdenDirector, Champlain Regional Stroke [email protected] ext. 16167
Proportion of ischemic stroke patients without atrial fibrillation who received carotid imaging prior to hospital discharge
Markham Stouffville Hospital
Judy MurrayDistrict Stroke Coordinator, Mackenzie [email protected] ext. 3882
Proportion of suspected stroke/TIA patients who received a brain CT/MRI scan within 24 hours of arrival at ED
Cambridge Memorial Hospital
Tammy TebbuttDistrict Stroke Coordinator, Grand River [email protected] ext. 2605
Proportion of ischemic stroke patients who arrived at ED less than 3.5 hours from symptom onset and received acute thrombolytic therapy (tPA)
Trillium Health Centre
Nicole PageauRegional Director, West GTA Stroke [email protected] ext. 5476
Proportion of stroke/TIA patients treated on a stroke unit at any time during their inpatient stay
North Bay General Hospital
Shelley HawtonDistrict Stroke Coordinator, North Bay Regional Health [email protected] ext. 3283
Proportion of stroke (excluding TIA) patients with a documented initial dysphagia screening performed during admission to acute care
Thunder Bay Regional Health Sciences Centre
Esme FrenchRegional Stroke Rehabilitation Specialist, Northwestern Ontario Regional Stroke [email protected]
Proportion of ALC days to total length of stay in acute care
Grey Bruce Health Services, Owen Sound
Joan Ruston BergeDistrict Stroke Coordinator, Grey-Bruce District of Southwestern Ontario Stroke [email protected] ext. 2920
IndicatorHigh-Performing Facility/Sub-LHIN Contact Information
Proportion of stroke (excluding TIA) patients discharged from acute care and admitted to inpatient rehabilitation
Barrie and Area Sub-LHIN
Cheryl MoherRegional Director, Central East Stroke NetworkRoyal Victoria Regional Health [email protected] ext. 46300
Proportion of stroke (excluding TIA) patients discharged from acute care who received a referral for outpatient rehabilitation
Burlington Sub-LHIN
Louise MacRaeRegional Director, Central South Stroke [email protected] ext. 46756
Median number of days between stroke (excluding TIA) onset and admission to stroke inpatient rehabilitation (RCG-1 and RCG-2)
Northumberland Hills Hospital
Jennifer WhiteDistrict Stroke Coordinator, Peterborough Regional Health [email protected] ext. 3946
Rehabilitation therapy staff/bed ratio for inpatient stroke rehabilitation N/A N/A
Proportion of ALC days to total length of stay in inpatient rehabilitation (active + ALC) (RCG-1)
William Osler Health System, Civic site
Nicole PageauRegional Director, West GTA Stroke [email protected] ext. 5476
Median FIM efficiency for moderate stroke in inpatient rehabilitation (RCG-1)
Royal Victoria Hospital
Cheryl MoherRegional Director, Central East Stroke NetworkRoyal Victoria Regional Health [email protected] ext. 46300
Mean number of CCAC visits provided to stroke/TIA patients in 2010/11 and 2011/12
South East Community Care Access Centre
Caryn LangstaffRegional Stroke Rehabilitation Coordinator, Southeastern Ontario Stroke [email protected] ext. 6841
Jo MatherClient Services Manager, South East Community Care Access [email protected] ext. 4112
Proportion of patients admitted to inpatient rehabilitation with severe stroke (RPG = 1100 or 1110) (RCG-1)
Brantford Healthcare
Wendy PomponioDistrict Stroke Coordinator, Brantford General [email protected] ext. 4451
Proportion of stroke/TIA patients discharged from acute care to LTC/ CCC (excluding patients originating from LTC/CCC)
Urban Guelph Sub-LHIN
Tammy TebbuttDistrict Stroke Coordinator, Grand River [email protected] ext. 2605

Institute for Clinical Evaluative Sciences 39
APPENDICES ONTARIO STROKE EVALUATION REPORT 2013: SPOTLIGHT ON SECONDARY STROKE PREVENTION AND CARE
IndicatorHigh-Performing Facility/Sub-LHIN Contact Information
Age- and sex-adjusted readmission rate at 30 days for patients with stroke/TIA for all diagnoses (per 100 patients)
Mackenzie Health – Mackenzie Richmond Hill Hospital
Judy MurrayDistrict Stroke Coordinator, Mackenzie [email protected] ext. 3882
Proportion of ED visits for a suspected or confirmed stroke/TIA where the patient was discharged and had an initial SPC visit
Queensway-Carleton Hospital
Jim LumsdenDirector, Champlain Regional Stroke [email protected] ext. 16167
Proportion of emergent and urgent SPC visits where the patient was seen within the recommended guidelines (24 hours and 72 hours, respectively)
Niagara Health System
Leanne HammondDistrict Stroke Coordinator, Niagara Health System – Niagara General [email protected] ext. 55557
Proportion of SPC visits where ischemic stroke/TIA patients had vascular imaging ordered or completed prior to or during the visit
Brantford General Hospital; Grey Bruce Health Services
Wendy PomponioDistrict Stroke Coordinator, Brantford General [email protected] ext. 4451
Proportion of SPC visits where ischemic stroke/TIA patients with atrial fibrillation were prescribed and/or recommended anticoagulant therapy prior to or during the visit
Toronto Western Hospital
Shelley SharpRegional Director, Toronto West Stroke [email protected]
Proportion of initial SPC visits where cognitive screening was performed
Pembroke Regional Hospital
Jim LumsdenDirector, Champlain Regional Stroke [email protected] ext. 16167

Institute for Clinical Evaluative Sciences40
ONTARIO STROKE EVALUATION REPORT 2013: SPOTLIGHT ON SECONDARY STROKE PREVENTION AND CARE APPENDICES
APPENDIX D Map of Ontario’s Local Health Integration Networks, Stroke System Regions, Designated Centres and Secondary Prevention Clinics
2
9
11
10
1
4
12
3
85
13
6
13
Perth
Sarnia LondonSimcoe
Barrie
Oshawa
Sudbury
WindsorChatham
Pembroke
Kingston
Cornwall
North Bay
Stratford
Owen Sound
Belleville
Brockville
Hawkesbury
Mississauga
Peterborough
Niagara Falls
O�awa
Markham
Hamilton
Brampton
Kitchener
NewmarketRichmond Hill
Paris
L AK
E
HU
RO
N
L A K E E R I E
L A K E O N T A R I O
Southern Ontario
0 10050 km
13
14
[10]
[11]
Timmins
Sudbury
Marathon
North Bay
Thunder Bay
Fort Frances
Sioux Lookout
Sault Ste. Marie
Kenora
H U D SO
N B
AY
L A K EN I P I G O N
L A K E S U P E R I O R
Northern Ontario
0 250 500 km
1 Erie St. Clair2 South West3 Waterloo Wellington4 Hamilton Niagara Haldimand Brant5 Central West6 Mississauga Halton7 Toronto Central
[5]
[4]
[6]
Toronto - St. Michael's Hosp
Toronto - Sunnybrook HSCToronto - East General Hosp
Toronto - North York General Hosp
Etobicoke
Downsview
Toronto - Hosp for Sick ChildrenToronto
(UHN)
Toronto and GTA**
0 5 10 km
*OSS Regions version 4.0**GTA = Greater Toronto Area
8 Central9 Central East10 South East11 Champlain12 North Simcoe Muskoka13 North East14 North West
Local Health Integration Networks (LHINs)
Ontario Stroke System (OSS) Regions[1] Southwest[2] Central South[3] West GTA[4] Toronto West
LHIN boundary
OSS boundary
Regional stroke centre SPCDistrict stroke centre SPCCommunity hospital SPC
[5] South East Toronto[6] North and East GTA[7] Central East[8] Southeast
[9] Champlain[10] Northeast[11] Northwest
OSS Stroke Centre Designations
Clinic not included in the 2011/12 audit of SPCs

Institute for Clinical Evaluative Sciences 41
APPENDICES ONTARIO STROKE EVALUATION REPORT 2013: SPOTLIGHT ON SECONDARY STROKE PREVENTION AND CARE
APPENDIX E About the Organizations Involved in this Report
Ontario Stroke Network
With its vision of Fewer Strokes, Better Outcomes, the mission of the Ontario Stroke Network (OSN) is to provide provincial leadership and planning for the 11 Ontario Regional Stroke Networks supporting the 14 Local Health Integration Networks (Ontario Stroke System) through: measuring and reporting on performance; partnering to achieve best practices; and, supporting innovations for stroke prevention, care, recovery and reintegration. The OSN delivers on its mission by establishing province-wide goals and initiatives to implement best practices across the stroke care continuum, evaluating and reporting on the progress of the Ontario Stroke System, and translating and exchanging knowledge. The OSN is funded by the Ontario Ministry of Health and Long-Term Care.
Ontario Stroke System
The Ontario Stroke System (OSS) is a client-centred collaboration of Ontario’s 11 Regional Stroke Networks supporting the 14 Local Health Integration Networks. Each region has a regional stroke centre and many have one or more district stroke centres. Each stroke network is a collaborative partnership of health care organizations and providers that spans the care continuum from prevention to community re-engagement. Regional stroke networks develop and implement plans and strategies to achieve equitable access and improve outcomes for stroke survivors and their families through the integration of stroke best practices across the care continuum.
Canadian Stroke Network
The Canadian Stroke Network (CSN), one of Canada’s Networks of Centres of Excellence, is a collaborative effort that brings together researchers, students, government, industry and the non-profit sector. First funded in 1999, the CSN is a not-for-profit corporation with headquarters at the University of Ottawa. The CSN in partnership with the OSN helped to fund the data collection for the Ontario Stroke Audit of Secondary Prevention Clinics as part of the Ontario Stroke Registry (formerly known as the Registry of the Canadian Stroke Network).
In partnership with the Heart and Stroke Foundation, the CSN established the Canadian Best Practice Recommendations for Stroke Care. This report presents high-quality, evidence-based stroke care recommendations in a standardized framework to support health care professionals in all disciplines. Implementation of these recommendations is expected to contribute to reducing practice variations and closing the gaps between evidence and practice.

Institute for Clinical Evaluative Sciences42
ONTARIO STROKE EVALUATION REPORT 2013: SPOTLIGHT ON SECONDARY STROKE PREVENTION AND CARE APPENDICES
Institute for Clinical Evaluative Sciences
The Institute for Clinical Evaluative Sciences (ICES) is an independent, non-profit organization that produces knowledge to enhance the effectiveness of health care for Ontarians. Internationally recognized for its innovative use of population-based health information, ICES’ evidence supports health policy development and guides changes to the organization and delivery of health care services.
Key to ICES’ work is its ability to link population-based health information, at the patient level, in a way that ensures the privacy and confidentiality of personal health information. Linked databases reflecting 13 million of 33 million Canadians allow researchers to follow patient populations through diagnosis and treatment, and to evaluate outcomes.
ICES receives core funding from the Ontario Ministry of Health and Long-Term Care. In addition, ICES faculty and staff compete for peer-reviewed grants from federal funding agencies, such as the Canadian Institutes of Health Research, and project-specific funds from provincial and national organizations. These combined sources enable ICES to have a large number of projects underway, covering a broad range of topics. The knowledge that arises from these efforts is always produced independently of funding bodies, which is critical to ICES’ success as Ontario’s objective, credible source of evidence guiding health care.


Institute for Clinical Evaluative Sciences G1 06, 2075 Bayview Avenue Toronto, Ontario M4N 3M5www.ices.on.ca
Evidence Guiding Health Care