Embed Size (px)
Citation preview
1
May 22, 2009
ONTARIO POWER GENERATION REPORTS 2009 FIRST QUARTER FINANCIAL RESULTS [Toronto]: Ontario Power Generation Inc. (“OPG” or the “Company”) today reported its financial and operating results for the three months ended March 31, 2009. Net loss for the first quarter of 2009 was $9 million compared to net income of $162 million for the same period in 2008.
“OPG’s results were significantly affected by a reduction in electricity generation, higher fuel prices, and an increase in expenses related to planned maintenance outages at our nuclear generating stations,” said President and CEO Jim Hankinson.
Total electricity generated in the first quarter of 2009 of 25.6 terawatt hours (“TWh”) was 13 percent lower than the first quarter 2008 production of 29.4 TWh. Nuclear production decreased by 1.0 TWh primarily as a result of planned maintenance outages. Hydroelectric production of 9.0 TWh was marginally lower than production of 9.1 TWh during the first quarter 2008. Electricity production from OPG’s fossil stations decreased to 4.3 TWh compared to 7.0 TWh in the first quarter of 2008, primarily due to lower electricity demand as a result of Ontario’s contracting economy, an increase in electricity production from other Ontario generators, and a significant reduction in natural gas prices compared to the cost of coal, which resulted in a displacement of coal-fired production.
OPG’s Darlington nuclear generating station continued to achieve exceptional reliability with a unit capability factor of 99.9 percent in the first quarter of 2009. The Pickering A nuclear generating station had a unit capability factor of 42.4 percent primarily due to planned outage maintenance work. The unit capability factor of 84.9 percent for the Pickering B nuclear station was marginally lower than in the first quarter of 2008. The availability of OPG’s regulated and unregulated hydroelectric generating stations remained at historically high levels. As a result of CO2 emission limits, the operating profile of the coal-fired generating stations has changed. The reliability of OPG’s fossil stations, now measured during the peak demand periods of January and February, and July and August, improved over the first quarter of 2008.
Income before interest and income taxes from OPG’s electricity generating segments of $243 million in the first quarter of 2009 decreased from $381 million for the three months ended March 31, 2008. Gross margin decreased as a result of lower fossil and nuclear generation, higher fuel costs, and lower non-electricity generation revenue. The unfavourable impact of these factors was partially offset by higher electricity sales prices reflecting the Ontario Energy Board’s (“OEB”) rate decision for OPG’s regulated hydroelectric and nuclear facilities, and revenues related to the contingency support agreement for the Nanticoke and Lambton generating stations.
2
Operations, Maintenance and Administration expenses increased by $51 million in the first quarter of 2009, compared to the same quarter in 2008. The increase was primarily due to an increase in planned outage and maintenance activities at OPG’s nuclear generating stations.
A loss before interest and income taxes of $164 million in the Regulated – Nuclear Waste Management segment for the three months ended March 31, 2009 was an improvement over the $185 million loss before interest and income taxes in the first quarter of 2008. The loss before interest and income taxes in the first quarter of 2009 primarily resulted from reductions in the Ontario Consumer Price Index, which negatively affected the guaranteed return on the Used Fuel Fund, and lower returns on the Decommissioning Fund. This loss was partially mitigated by the establishment by the OEB of a regulatory variance account associated with the stations leased to Bruce Power, since a portion of the losses from the Used Fuel and Decommissioning Segregated Funds are related to these stations.
During the first quarter of 2009, OPG advanced on a number of new generation projects aimed at significantly contributing to Ontario’s long-term electricity supply requirements:
Nuclear
The Province has announced that OPG will operate a new two-unit nuclear power plant at the Darlington site. Proposal submissions from all three respondents were received by Infrastructure Ontario at the end of February. It is expected that a preferred vendor will be selected by Infrastructure Ontario in the late spring of 2009. OPG has initiated activities related to an environmental assessment and licensing requirements.
Hydroelectric
With respect to the Niagara tunnel project, at March 31, 2009, the tunnel boring machine had advanced to 3,794 metres, which represents 37 percent of the tunnel length. It is now operating on a revised alignment that will minimize remaining excavation in the Queenston shale formation. OPG and the contractor are renegotiating the design build contract with a revised target cost and schedule. The contract includes incentives related to achieving the target cost and schedule. The original project cost was estimated at $985 million with a scheduled completion of June 2010, as approved by OPG’s Board of Directors. The revised project cost is estimated at $1.6 billion and the revised schedule targets completion by December 2013. This contract is expected to be finalized during the second quarter of 2009.
The Lac Seul generating station was declared in-service in February 2009 and has a capacity of 12.5 MW. OPG entered into a partnership agreement with the Lac Seul First Nations (“LSFN”) regarding this facility. OPG will have a 75 percent interest in the station, while the LSFN will have a 25 percent interest.
Project financing was completed for the Upper Mattagami and Hound Chute development projects in May 2009. Senior Notes totaling $200 million were issued by the UMH Energy Partnership, a general partnership between OPG and UMH Energy Inc., a wholly-owned subsidiary of OPG.
3
Natural Gas
The Portlands Energy Centre (“PEC”) is a 550 MW high-efficiency, combined cycle, natural gas generation plant designed to meet downtown Toronto’s need for electricity. PEC is a limited partnership between OPG and TransCanada Energy Ltd. PEC was declared in-service in a combined cycle mode in April 2009, earlier than the contractual in-service date of June 2009.
FINANCIAL AND OPERATIONAL HIGHLIGHTS
Three Months Ended March 31
(millions of dollars – except where noted) 2009 2008 Earnings Revenue after revenue limit rebate 1,481 1,563 Fuel expense 261 304 Gross margin 1,220 1,259 Operations, maintenance and administration expense 742 691 Depreciation and amortization 178 175 Accretion on fixed asset removal and nuclear waste management liabilities 159 135
Losses on nuclear fixed asset removal and nuclear waste management funds 6 51
Other net expenses 26 13 Income before interest and income taxes 109 194 Net interest expense 39 40 Income tax expenses (recoveries) 79 (8) Net (loss) income (9) 162 Cash flow Cash flow provided by operating activities 41 245 Income (loss) before interest and income taxes Generating segments 243 381 Nuclear Waste Management segment (164) (185) Other segment 30 (2) Total income before interest and income taxes 109 194 Electricity generation (TWh) Regulated – Nuclear 12.3 13.3 Regulated – Hydroelectric 4.7 4.6 Unregulated – Hydroelectric 4.3 4.5 Unregulated – Fossil-Fuelled 4.3 7.0 Total electricity generation 25.6 29.4
4
FINANCIAL AND OPERATIONAL HIGHLIGHTS
Three Months Ended March 31
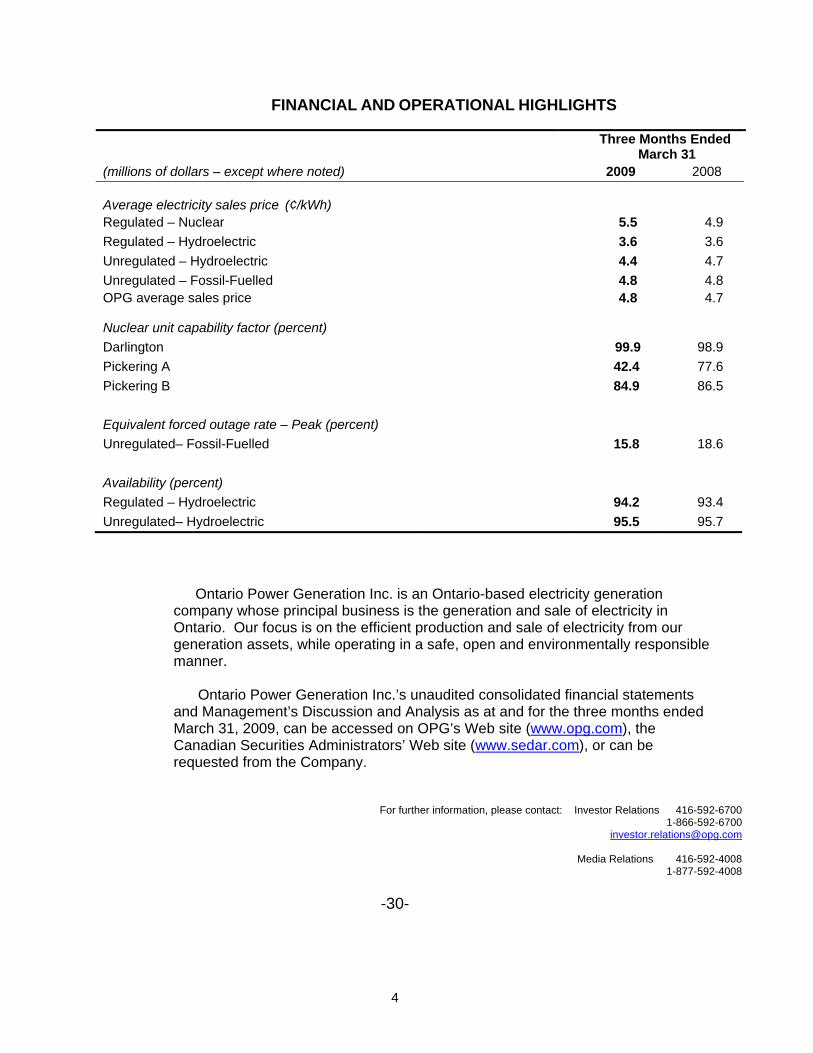
(millions of dollars – except where noted) 2009 2008 Average electricity sales price (¢/kWh)
Regulated – Nuclear 5.5 4.9 Regulated – Hydroelectric 3.6 3.6 Unregulated – Hydroelectric 4.4 4.7 Unregulated – Fossil-Fuelled 4.8 4.8 OPG average sales price 4.8 4.7
Nuclear unit capability factor (percent) Darlington 99.9 98.9 Pickering A 42.4 77.6 Pickering B 84.9 86.5 Equivalent forced outage rate – Peak (percent) Unregulated– Fossil-Fuelled 15.8 18.6 Availability (percent) Regulated – Hydroelectric 94.2 93.4 Unregulated– Hydroelectric 95.5 95.7
Ontario Power Generation Inc. is an Ontario-based electricity generation company whose principal business is the generation and sale of electricity in Ontario. Our focus is on the efficient production and sale of electricity from our generation assets, while operating in a safe, open and environmentally responsible manner.
Ontario Power Generation Inc.’s unaudited consolidated financial statements and Management’s Discussion and Analysis as at and for the three months ended March 31, 2009, can be accessed on OPG’s Web site (www.opg.com), the Canadian Securities Administrators’ Web site (www.sedar.com), or can be requested from the Company.
For further information, please contact: Investor Relations 416-592-6700 1-866-592-6700
Media Relations 416-592-4008 1-877-592-4008
-30-
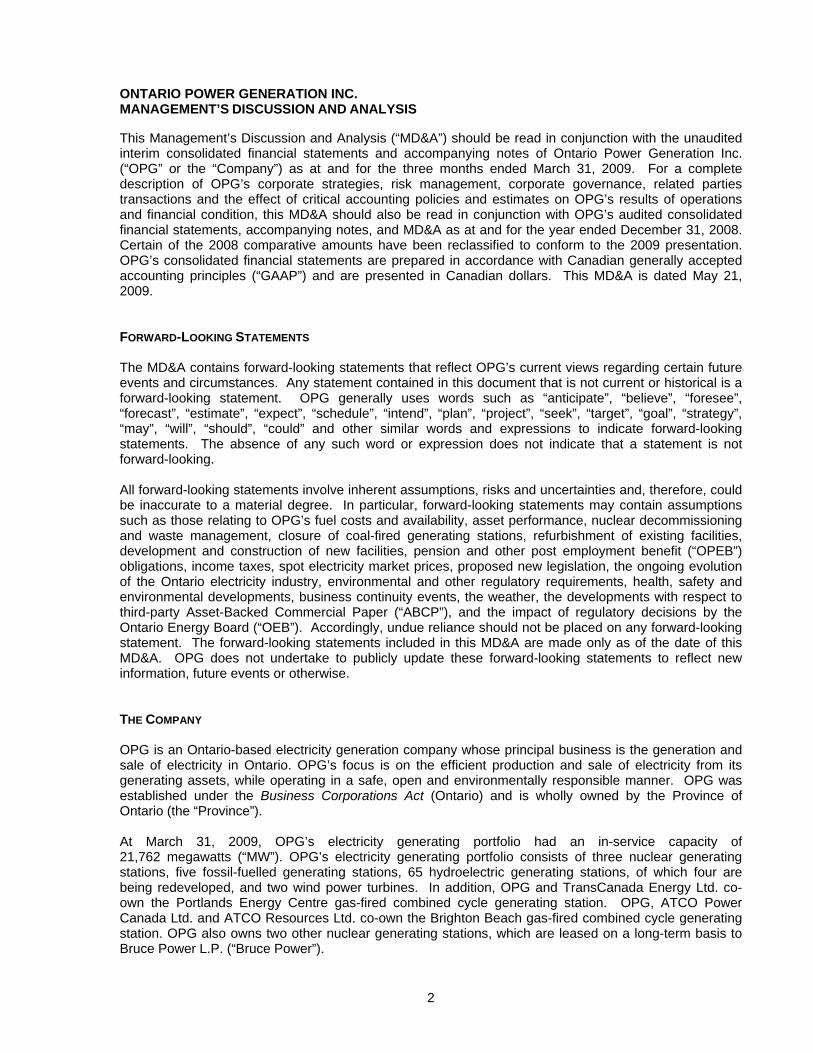
2009 FIRST QUARTER REPORT CONTENTS MANAGEMENT’S DISCUSSION AND ANALYSIS Forward-Looking Statements 2The Company 2Highlights 4Vision, Core Business and Strategy 10Ontario Electricity Market Trends 13Business Segments 14Key Generation and Financial Performance Indicators 14Discussion of Operating Results by Business Segment 15 Regulated – Nuclear Generation Segment 16 Regulated – Nuclear Waste Management Segment 18 Regulated – Hydroelectric Segment 21 Unregulated – Hydroelectric Segment 20 Unregulated – Fossil-Fuelled Segment 22 Other 23 Net Interest Expense 24 Income Taxes 24Liquidity and Capital Resources 25Balance Sheet Highlights 27Changes in Accounting Policies 29Risk Management 30Internal Controls over Financial Reporting and Disclosure Controls 33Quarterly Financial Highlights 33Supplemental Earnings Measures 34 UNAUDITED INTERIM CONSOLIDATED FINANCIAL STATEMENTS Unaudited Interim Consolidated Financial Statements 35Notes to the Unaudited Interim Consolidated Financial Statements 40
2
ONTARIO POWER GENERATION INC. MANAGEMENT’S DISCUSSION AND ANALYSIS This Management’s Discussion and Analysis (“MD&A”) should be read in conjunction with the unaudited interim consolidated financial statements and accompanying notes of Ontario Power Generation Inc. (“OPG” or the “Company”) as at and for the three months ended March 31, 2009. For a complete description of OPG’s corporate strategies, risk management, corporate governance, related parties transactions and the effect of critical accounting policies and estimates on OPG’s results of operations and financial condition, this MD&A should also be read in conjunction with OPG’s audited consolidated financial statements, accompanying notes, and MD&A as at and for the year ended December 31, 2008. Certain of the 2008 comparative amounts have been reclassified to conform to the 2009 presentation. OPG’s consolidated financial statements are prepared in accordance with Canadian generally accepted accounting principles (“GAAP”) and are presented in Canadian dollars. This MD&A is dated May 21, 2009. FORWARD-LOOKING STATEMENTS The MD&A contains forward-looking statements that reflect OPG’s current views regarding certain future events and circumstances. Any statement contained in this document that is not current or historical is a forward-looking statement. OPG generally uses words such as “anticipate”, “believe”, “foresee”, “forecast”, “estimate”, “expect”, “schedule”, “intend”, “plan”, “project”, “seek”, “target”, “goal”, “strategy”, “may”, “will”, “should”, “could” and other similar words and expressions to indicate forward-looking statements. The absence of any such word or expression does not indicate that a statement is not forward-looking. All forward-looking statements involve inherent assumptions, risks and uncertainties and, therefore, could be inaccurate to a material degree. In particular, forward-looking statements may contain assumptions such as those relating to OPG’s fuel costs and availability, asset performance, nuclear decommissioning and waste management, closure of coal-fired generating stations, refurbishment of existing facilities, development and construction of new facilities, pension and other post employment benefit (“OPEB”) obligations, income taxes, spot electricity market prices, proposed new legislation, the ongoing evolution of the Ontario electricity industry, environmental and other regulatory requirements, health, safety and environmental developments, business continuity events, the weather, the developments with respect to third-party Asset-Backed Commercial Paper (“ABCP”), and the impact of regulatory decisions by the Ontario Energy Board (“OEB”). Accordingly, undue reliance should not be placed on any forward-looking statement. The forward-looking statements included in this MD&A are made only as of the date of this MD&A. OPG does not undertake to publicly update these forward-looking statements to reflect new information, future events or otherwise. THE COMPANY OPG is an Ontario-based electricity generation company whose principal business is the generation and sale of electricity in Ontario. OPG’s focus is on the efficient production and sale of electricity from its generating assets, while operating in a safe, open and environmentally responsible manner. OPG was established under the Business Corporations Act (Ontario) and is wholly owned by the Province of Ontario (the “Province”). At March 31, 2009, OPG’s electricity generating portfolio had an in-service capacity of 21,762 megawatts (“MW”). OPG’s electricity generating portfolio consists of three nuclear generating stations, five fossil-fuelled generating stations, 65 hydroelectric generating stations, of which four are being redeveloped, and two wind power turbines. In addition, OPG and TransCanada Energy Ltd. co-own the Portlands Energy Centre gas-fired combined cycle generating station. OPG, ATCO Power Canada Ltd. and ATCO Resources Ltd. co-own the Brighton Beach gas-fired combined cycle generating station. OPG also owns two other nuclear generating stations, which are leased on a long-term basis to Bruce Power L.P. (“Bruce Power”).
3
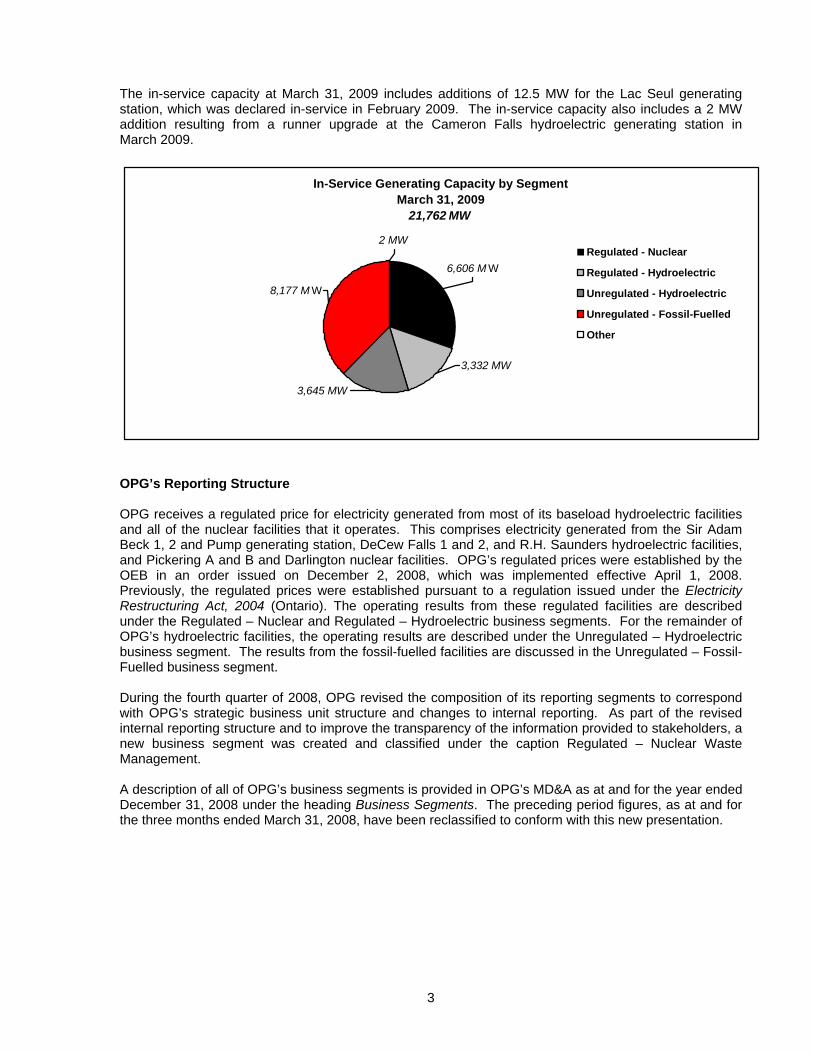
The in-service capacity at March 31, 2009 includes additions of 12.5 MW for the Lac Seul generating station, which was declared in-service in February 2009. The in-service capacity also includes a 2 MW addition resulting from a runner upgrade at the Cameron Falls hydroelectric generating station in March 2009.
In-Service Generating Capacity by SegmentMarch 31, 2009
21,762 MW
3,332 MW
8,177 M W
3,645 MW
6,606 M W
2 MW Regulated - Nuclear
Regulated - Hydroelectric
Unregulated - Hydroelectric
Unregulated - Fossil-Fuelled
Other
OPG’s Reporting Structure OPG receives a regulated price for electricity generated from most of its baseload hydroelectric facilities and all of the nuclear facilities that it operates. This comprises electricity generated from the Sir Adam Beck 1, 2 and Pump generating station, DeCew Falls 1 and 2, and R.H. Saunders hydroelectric facilities, and Pickering A and B and Darlington nuclear facilities. OPG’s regulated prices were established by the OEB in an order issued on December 2, 2008, which was implemented effective April 1, 2008. Previously, the regulated prices were established pursuant to a regulation issued under the Electricity Restructuring Act, 2004 (Ontario). The operating results from these regulated facilities are described under the Regulated – Nuclear and Regulated – Hydroelectric business segments. For the remainder of OPG’s hydroelectric facilities, the operating results are described under the Unregulated – Hydroelectric business segment. The results from the fossil-fuelled facilities are discussed in the Unregulated – Fossil-Fuelled business segment. During the fourth quarter of 2008, OPG revised the composition of its reporting segments to correspond with OPG’s strategic business unit structure and changes to internal reporting. As part of the revised internal reporting structure and to improve the transparency of the information provided to stakeholders, a new business segment was created and classified under the caption Regulated – Nuclear Waste Management. A description of all of OPG’s business segments is provided in OPG’s MD&A as at and for the year ended December 31, 2008 under the heading Business Segments. The preceding period figures, as at and for the three months ended March 31, 2008, have been reclassified to conform with this new presentation.
4
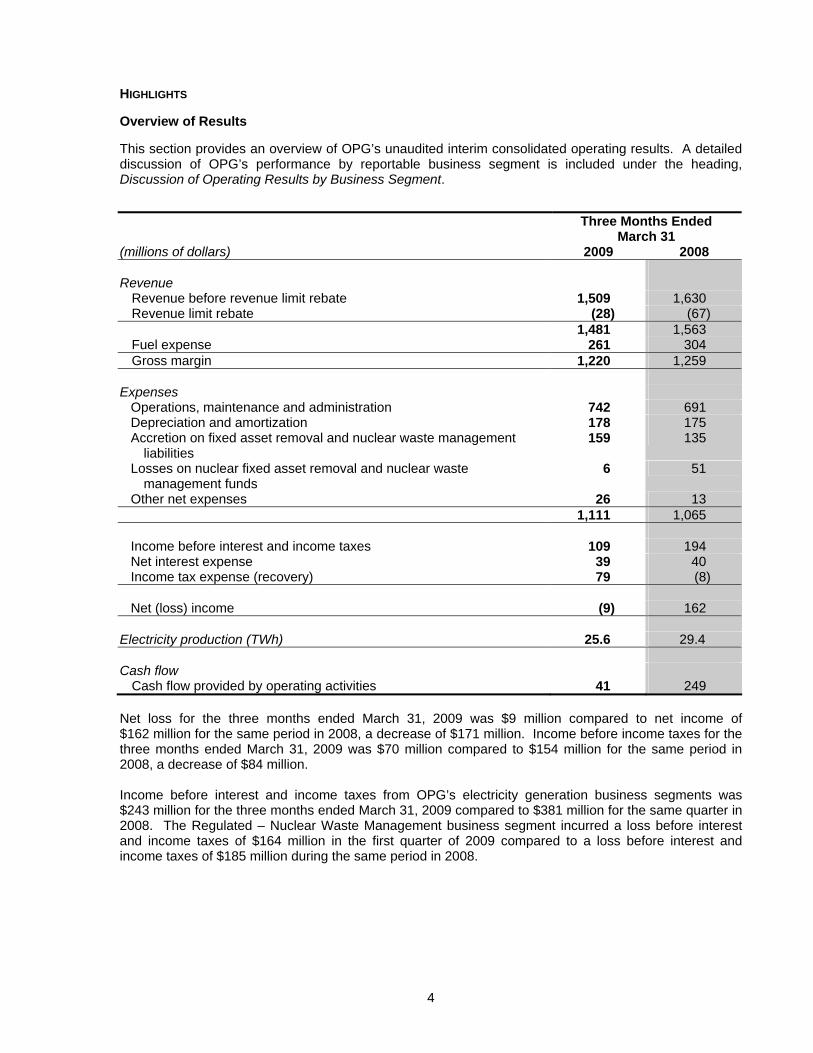
HIGHLIGHTS Overview of Results This section provides an overview of OPG’s unaudited interim consolidated operating results. A detailed discussion of OPG’s performance by reportable business segment is included under the heading, Discussion of Operating Results by Business Segment. Three Months Ended
March 31 (millions of dollars) 2009 2008 Revenue
Revenue before revenue limit rebate 1,509 1,630 Revenue limit rebate (28) (67) 1,481 1,563 Fuel expense 261 304 Gross margin 1,220 1,259
Expenses Operations, maintenance and administration 742 691 Depreciation and amortization 178 175 Accretion on fixed asset removal and nuclear waste management
liabilities 159 135
Losses on nuclear fixed asset removal and nuclear waste management funds
6 51
Other net expenses 26 13 1,111 1,065 Income before interest and income taxes 109 194 Net interest expense 39 40 Income tax expense (recovery) 79 (8) Net (loss) income (9) 162 Electricity production (TWh) 25.6 29.4 Cash flow
Cash flow provided by operating activities 41 249 Net loss for the three months ended March 31, 2009 was $9 million compared to net income of $162 million for the same period in 2008, a decrease of $171 million. Income before income taxes for the three months ended March 31, 2009 was $70 million compared to $154 million for the same period in 2008, a decrease of $84 million. Income before interest and income taxes from OPG’s electricity generation business segments was $243 million for the three months ended March 31, 2009 compared to $381 million for the same quarter in 2008. The Regulated – Nuclear Waste Management business segment incurred a loss before interest and income taxes of $164 million in the first quarter of 2009 compared to a loss before interest and income taxes of $185 million during the same period in 2008.
5
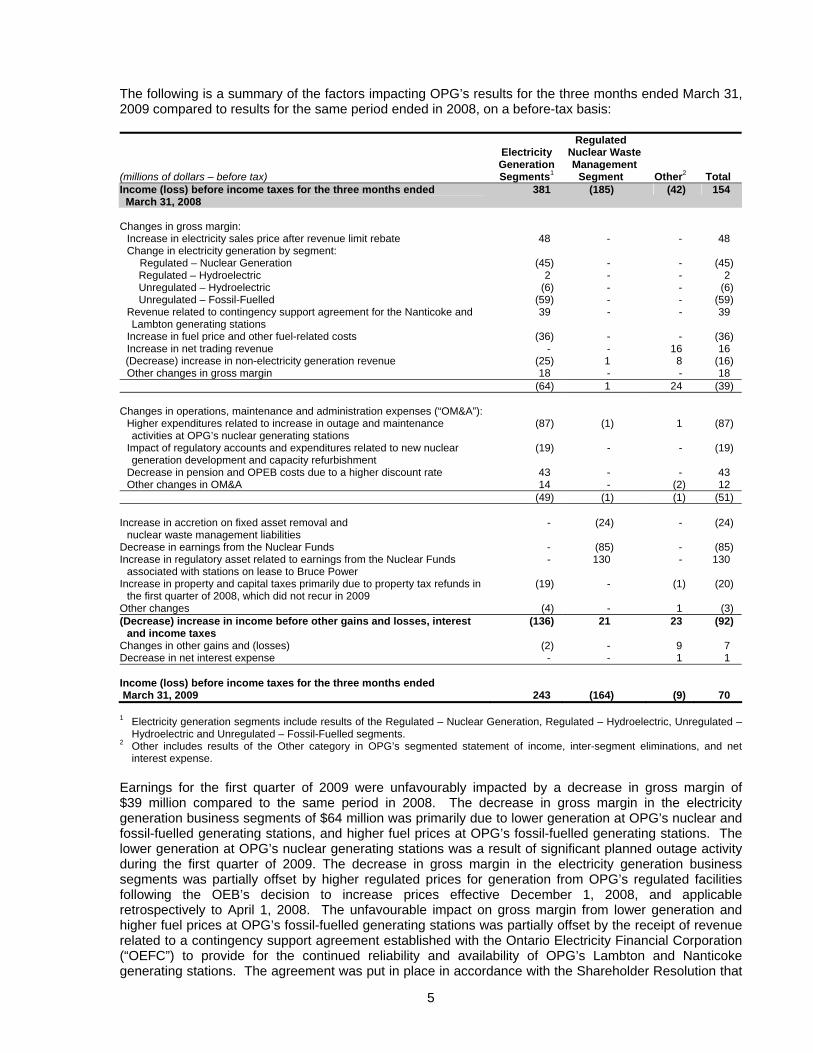
The following is a summary of the factors impacting OPG’s results for the three months ended March 31, 2009 compared to results for the same period ended in 2008, on a before-tax basis: Regulated (millions of dollars – before tax)
Electricity Generation Segments1
Nuclear Waste Management
Segment
Other2
Total Income (loss) before income taxes for the three months ended March 31, 2008
381 (185) (42) 154
Changes in gross margin: Increase in electricity sales price after revenue limit rebate 48 - - 48 Change in electricity generation by segment: Regulated – Nuclear Generation (45) - - (45) Regulated – Hydroelectric 2 - - 2 Unregulated – Hydroelectric (6) - - (6) Unregulated – Fossil-Fuelled (59) - - (59)
Revenue related to contingency support agreement for the Nanticoke and Lambton generating stations
39 - - 39
Increase in fuel price and other fuel-related costs (36) - - (36) Increase in net trading revenue - - 16 16 (Decrease) increase in non-electricity generation revenue (25) 1 8 (16) Other changes in gross margin 18 - - 18 (64) 1 24 (39) Changes in operations, maintenance and administration expenses (“OM&A”):
Higher expenditures related to increase in outage and maintenance activities at OPG’s nuclear generating stations
(87) (1) 1 (87)
Impact of regulatory accounts and expenditures related to new nuclear generation development and capacity refurbishment
(19) - - (19)
Decrease in pension and OPEB costs due to a higher discount rate 43 - - 43 Other changes in OM&A 14 - (2) 12
(49) (1) (1) (51) Increase in accretion on fixed asset removal and
nuclear waste management liabilities - (24) - (24)
Decrease in earnings from the Nuclear Funds - (85) - (85) Increase in regulatory asset related to earnings from the Nuclear Funds
associated with stations on lease to Bruce Power - 130 - 130
Increase in property and capital taxes primarily due to property tax refunds in the first quarter of 2008, which did not recur in 2009
(19) - (1) (20)
Other changes (4) - 1 (3) (Decrease) increase in income before other gains and losses, interest
and income taxes (136) 21 23 (92)
Changes in other gains and (losses) (2) - 9 7 Decrease in net interest expense - - 1 1 Income (loss) before income taxes for the three months ended March 31, 2009
243
(164)
(9)
70
1 Electricity generation segments include results of the Regulated – Nuclear Generation, Regulated – Hydroelectric, Unregulated – Hydroelectric and Unregulated – Fossil-Fuelled segments.
2 Other includes results of the Other category in OPG’s segmented statement of income, inter-segment eliminations, and net interest expense.
Earnings for the first quarter of 2009 were unfavourably impacted by a decrease in gross margin of $39 million compared to the same period in 2008. The decrease in gross margin in the electricity generation business segments of $64 million was primarily due to lower generation at OPG’s nuclear and fossil-fuelled generating stations, and higher fuel prices at OPG’s fossil-fuelled generating stations. The lower generation at OPG’s nuclear generating stations was a result of significant planned outage activity during the first quarter of 2009. The decrease in gross margin in the electricity generation business segments was partially offset by higher regulated prices for generation from OPG’s regulated facilities following the OEB’s decision to increase prices effective December 1, 2008, and applicable retrospectively to April 1, 2008. The unfavourable impact on gross margin from lower generation and higher fuel prices at OPG’s fossil-fuelled generating stations was partially offset by the receipt of revenue related to a contingency support agreement established with the Ontario Electricity Financial Corporation (“OEFC”) to provide for the continued reliability and availability of OPG’s Lambton and Nanticoke generating stations. The agreement was put in place in accordance with the Shareholder Resolution that
6
an appropriate recovery mechanism be established to enable OPG to recover the costs of its coal-fired generating stations following implementation of OPG’s carbon dioxide (“CO2“) reduction strategy. Operations, maintenance and administration (“OM&A”) expenses increased by $51 million in the first quarter of 2009, compared to the same quarter in 2008. This increase was primarily due to an increase in planned outage and maintenance activities at OPG’s nuclear generating stations. OM&A expenses during the three months ended March 31, 2009, were also impacted by higher expenses related to new nuclear generation development, and capacity refurbishment activities. The increase in OM&A was partially offset by lower pension and OPEB costs due primarily to a higher discount rate. Accretion expense increased in the first quarter of 2009 compared to the same quarter in 2008 primarily due to the discontinuance, effective April 1, 2008, of the deferral account associated with the increases in OPG’s liabilities for nuclear used fuel management and nuclear decommissioning and low and intermediate level waste management (“Nuclear Liabilities”) arising from the 2006 Approved Reference Plan, and the increase in the present value of the liability due to the passage of time. Accretion expense was reduced in the first quarter of 2008, through the deferral account, by $19 million. Losses from the Used Fuel Segregated Fund (“Used Fuel Fund”) and the Decommissioning Segregated Fund (“Decommissioning Fund”) (together “Nuclear Funds”) for the three months ended March 31, 2009 were $6 million compared to $51 million during the same period in 2008. The losses from the Nuclear Funds, before the mitigating impact of a variance account approved by the OEB to capture the differences between actual and forecast revenues and costs related to the nuclear generating stations on lease to Bruce Power (“Bruce variance account”), were $136 million for the first quarter of 2009, compared to losses of $51 million in the same quarter of 2008, an increase of $85 million. The increase in the losses of the Nuclear Funds was primarily due to reductions in the Ontario Consumer Price Index during the first quarter of 2009, which impacted the guaranteed return on the Used Fuel Fund. There were also lower returns from the Decommissioning Fund during the first quarter of 2009 compared to the same period last year as a result of significant reductions in trading levels of global financial markets, which reduced the current market value of the fund investments. The losses from the Nuclear Funds were partially mitigated by the establishment of the Bruce variance account, effective April 1, 2008, for the portion of the losses from the Nuclear Funds related to the nuclear generating stations on lease to Bruce Power. OPG recorded a regulatory asset of $130 million in this variance account related to the Nuclear Funds during the first quarter of 2009, which reduced the reported losses from the Nuclear Funds. The investments in the Nuclear Funds include a diversified portfolio of equities and fixed income securities that are invested across many geographic markets. The Nuclear Funds are invested to fund long-term liability requirements, and as such, the portfolio asset mix is structured to achieve the required return over a long-term horizon. While short-term fluctuations in market value will occur, managing the long-term return of the Nuclear Funds remains the primary goal. OPG’s earnings on the Used Fuel Fund are not subject to such capital market volatility since the rate of return on this fund is guaranteed by the Province, for the first 2.23 million used fuel bundles. Property and capital taxes for the three months ended March 31, 2009 were $26 million compared to $6 million for the same period in 2008. The increase in property and capital taxes was primarily due to a refund of property taxes in the amount of $17 million during the first quarter of 2008. For the three months ended March 31, 2009, income tax expense was $79 million compared to a tax recovery of $8 million for the same period in 2008. Income tax expense during the first quarter of 2008 was favourably impacted by a reduction in income tax liabilities as a result of the resolution of a number of tax uncertainties related to the audit of OPG’s 1999 taxation year.
7
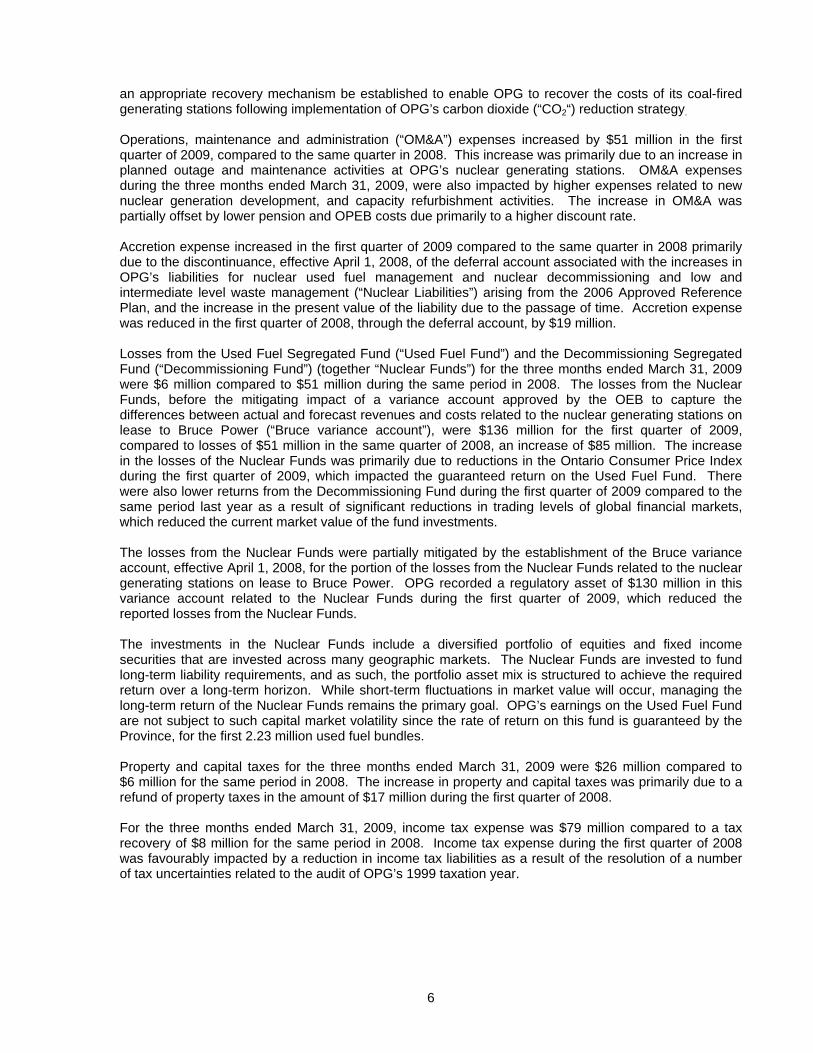
Average Sales Prices The weighted average Ontario spot electricity market price and OPG’s average sales prices by reportable electricity generation business segment, net of the revenue limit rebate for the three months ended March 31, 2009 and 2008, were as follows:
Three Months Ended March 31 (¢/kWh) 2009 2008 Weighted average hourly Ontario spot electricity market price 4.5 5.2 Regulated – Nuclear Generation 5.5 4.9 Regulated – Hydroelectric 3.6 3.6 Unregulated – Hydroelectric 4.4 4.7 Unregulated – Fossil-Fuelled 4.8 4.8
OPG’s average sales price 4.8 4.7 The weighted average hourly Ontario spot electricity market price was 4.5¢/kWh for the three months ended March 31, 2009 compared to 5.2¢/kWh for the same period in 2008. The decrease was primarily due to lower primary demand, higher nuclear generation in Ontario, and lower natural gas prices, partially offset by the impact of a weaker Canadian dollar. The average sales price for the Regulated – Nuclear Generation and Regulated – Hydroelectric segments for the three months ended March 31, 2009 compared to the same period in 2008 was impacted by the increase in the regulated prices effective April 1, 2008, resulting from the OEB’s decision in 2008. For the Regulated – Hydroelectric segment, the impact of the increase in regulated prices was primarily offset by the impact of electricity market prices on the revenue from the regulated hydroelectric incentive mechanism. The decrease in OPG’s average sales price for the Unregulated – Hydroelectric segment in the first quarter of 2009, compared to the same quarter in 2008, primarily reflected the impact of lower Ontario spot market prices and the revenue limit rebate. OPG’s average sales price for its unregulated fossil-fuelled generation, net of the revenue limit rebate, was unchanged at 4.8¢/kWh for the three month periods ended March 31, 2009 and 2008. An increase in the average sales price related to a CO2 emission adder, which was implemented as part of OPG’s strategy to meet the Provincial CO2 emission target in 2009, was offset by the impact of lower Ontario spot electricity market prices. The term of the revenue limit rebate ended April 30, 2009. Under the revenue limit rebate, 85 percent of the generation output from OPG’s unregulated hydroelectric and unregulated fossil-fuelled generating stations, excluding the Lennox Generation Station, stations whose generation output is subject to a Hydroelectric Energy Supply Agreement (“HESA”) with the Ontario Power Authority (“OPA”), and forward sales as of January 1, 2005, were subject to a revenue limit. The revenue limit was 4.7¢/kWh for the period May 1, 2007 to April 30, 2008, and increased to 4.8¢/kWh for the period May 1, 2008 to April 30, 2009.
8
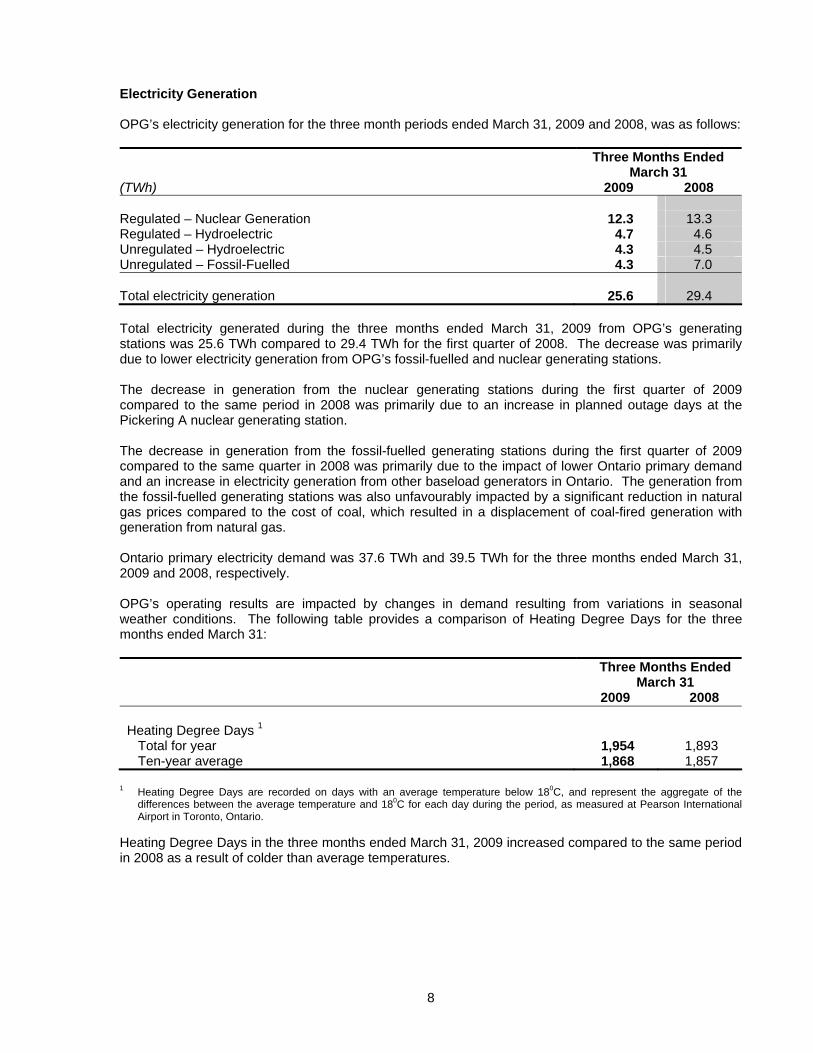
Electricity Generation OPG’s electricity generation for the three month periods ended March 31, 2009 and 2008, was as follows: Three Months Ended
March 31 (TWh) 2009 2008
Regulated – Nuclear Generation 12.3 13.3 Regulated – Hydroelectric 4.7 4.6 Unregulated – Hydroelectric 4.3 4.5 Unregulated – Fossil-Fuelled 4.3 7.0 Total electricity generation 25.6 29.4 Total electricity generated during the three months ended March 31, 2009 from OPG’s generating stations was 25.6 TWh compared to 29.4 TWh for the first quarter of 2008. The decrease was primarily due to lower electricity generation from OPG’s fossil-fuelled and nuclear generating stations. The decrease in generation from the nuclear generating stations during the first quarter of 2009 compared to the same period in 2008 was primarily due to an increase in planned outage days at the Pickering A nuclear generating station. The decrease in generation from the fossil-fuelled generating stations during the first quarter of 2009 compared to the same quarter in 2008 was primarily due to the impact of lower Ontario primary demand and an increase in electricity generation from other baseload generators in Ontario. The generation from the fossil-fuelled generating stations was also unfavourably impacted by a significant reduction in natural gas prices compared to the cost of coal, which resulted in a displacement of coal-fired generation with generation from natural gas. Ontario primary electricity demand was 37.6 TWh and 39.5 TWh for the three months ended March 31, 2009 and 2008, respectively. OPG’s operating results are impacted by changes in demand resulting from variations in seasonal weather conditions. The following table provides a comparison of Heating Degree Days for the three months ended March 31: Three Months Ended
March 31 2009 2008 Heating Degree Days 1 Total for year 1,954 1,893 Ten-year average 1,868 1,857
1 Heating Degree Days are recorded on days with an average temperature below 180C, and represent the aggregate of the
differences between the average temperature and 180C for each day during the period, as measured at Pearson International Airport in Toronto, Ontario.
Heating Degree Days in the three months ended March 31, 2009 increased compared to the same period in 2008 as a result of colder than average temperatures.
9
Recent Developments Portlands Energy Centre OPG has a partnership arrangement with TransCanada Energy Ltd., through the Portlands Energy Centre L.P. (“PEC”), to pursue the development and operation of a 550 MW gas-fired, combined cycle generating station on the site of the former R.L. Hearn generating station, near downtown Toronto. OPG has a 50 percent ownership interest in the joint venture. The PEC was declared in-service in a combined cycle mode in April 2009, earlier than its contractual in-service date of June 1, 2009. OPG's share of capital expenditures for the period ended March 31, 2009 was $12 million, and life-to-date expenditures were $372 million. Total project costs continue to be within the $730 million approved budget, excluding capitalized interest. OPG’s share of the project is debt financed through the OEFC. Recent System Conditions Excess baseload generation (“EBG”) was a significant concern to OPG for three successive weekends during late March to mid-April, 2009. EBG results in a requirement to spill water at OPG’s hydroelectric generating stations and the potential for reductions in output or shut down at OPG’s nuclear generating stations. Lower Ontario primary demand, together with additional wind generation and new gas generation, resulted in EBG conditions during many hours of low demand. The situation was further aggravated by an outage to the Ontario - New York intertie, which greatly reduced Ontario’s capability to export power during this period. An outage to the transmission lines joining Northwestern Ontario to Southern Ontario also impacted the situation but to a lesser extent. OPG was able to significantly reduce production during the hours of low demand. These efforts allowed OPG’s nuclear generating stations to avoid shutdowns, and maintain full output for all but two days during this period. OPG’s Motion to Vary the OEB’s 2008 Decision on Tax Losses / Mitigation During January 2009, OPG filed a motion to review, and vary, a portion of the OEB's 2008 decision establishing OPG’s current regulated prices as it pertains to the treatment of tax losses and their use for mitigation. In May 2009, the OEB issued a decision and order that varied the 2008 decision in the manner requested by OPG. As requested by OPG, the decision authorized the creation of a tax loss variance account effective April 1, 2008. In accordance with the OEB’s decision, the balance in this variance account will be determined based on the difference between regulatory tax losses for the period April 1, 2005 to April 1, 2008 calculated in accordance with the methodology specified in the OEB’s 2008 decision and the revenue requirement reduction reflected in current regulated prices. The balance in the variance account will be reviewed by the OEB as part of OPG’s next hearing. The variance account will result in an increase in regulatory assets and a corresponding increase in revenue. The regulatory asset to be recorded during the second quarter of 2009 will include approximately $160 million relating to the period April 1, 2008 to March 31, 2009. Proposed Green Energy and Green Economy Act In May 2009, the Province enacted a new legislation, the Green Energy and Green Economy Act, 2009 (“Green Energy Act”), that takes a two-pronged approach to creating a green economy; to bring more renewable energy sources to the Province; and the creation of more energy efficiency measures to help conserve energy. Under the Green Energy Act, there may not be any limit on the amount of non-dispatchable renewable resources that can be added to the electricity system. This could potentially impact OPG’s hydroelectric and nuclear operations due to potential excess baseload generation.
10
VISION, CORE BUSINESS AND STRATEGY OPG’s mandate is to cost-effectively produce electricity from its diversified generating assets, while operating in a safe, open, and environmentally responsible manner. OPG’s goal is to be a leader in clean energy generation and to have a major role in leading Ontario’s transition to a more sustainable energy future. OPG is focused on three corporate strategies: performance excellence; generation development; and developing and acquiring talent. In its 2008 year end MD&A dated February 12, 2009, OPG reported details of its progress toward accomplishing these strategies. OPG continued its progress on these strategies during the first quarter of 2009. The more significant developments are described in the following sections. Performance Excellence Generating Assets OPG’s Darlington nuclear generating station continued its excellent performance during the first quarter of 2009, with an equivalent forced outage rate of less than one percent. During the first quarter of 2009, OPG successfully executed critical inspection programs on reactor feeders, fuel channels, and steam generators during the planned outages at the Pickering A and B nuclear generation stations. Improvements in inspection technology and processes contributed to reductions in the duration of outage inspections in the first quarter of 2009. Several new initiatives were implemented by the Regulated-Nuclear business segment during the first quarter of 2009. A new maintenance strategy, which improved the scheduling of critical work orders and utilizes an equipment reliability index, is expected to increase the reliability of generation and predictability of plant equipment. Outage program initiatives, including improvements to training and qualifying outage teams, resulted in significant improvements being realized in preparation for the Darlington vacuum building outage to be undertaken in the second quarter of 2009. The excellent performance by the hydroelectric generating stations continued during the first quarter of 2009 with a combined availability of approximately 95 percent for both the regulated and unregulated operations. OPG deferred and re-scheduled some planned outages of its hydroelectric generating units to better utilize the higher water flows during the period. Major equipment overhauls and rehabilitation work was initiated at several hydroelectric generating stations during the first quarter of 2009 to sustain and enhance cost-effective hydroelectric generation, including an additional 2 MW resulting from the runner upgrade at Cameron Falls hydroelectric generating station. In May 2008, the Province announced new annual targets and limits on CO2 emissions from OPG’s coal-fired generating stations to ensure that such emissions are reduced by two-thirds of the 2003 levels by 2011. For 2009, OPG must restrict the CO2 emissions arising from its coal-fired generating stations to not more than 19.6 million metric tonnes. OPG’s strategy to meet this emission target for 2009 consists of four major elements. • Planned Outage Strategy: OPG designated three of the planned outages required by the coal-fired
fleet as CO2 outages in the first quarter of 2009. This meant the risk of moving these outages or recalling them would be limited to only those situations where system reliability issues existed, which could not be resolved with other available actions, and the designated outages proceed as planned.
• Operating Strategy: Operating and maintenance costs for a coal-fired unit increase with the number of starts the unit makes per year. In the context of the emission target, it may not be cost effective to offer all available units into the market, as that may increase the total number of starts for these units, as well as having a detrimental impact on reliability. Accordingly, OPG exercised its option to reduce the number of coal-fired units it offered into the electricity market, beginning the first quarter of 2009.
• Offer Strategy: OPG is following the standard practice of applying a uniform adder ($/MWh) to the offers for energy-limited resources in order to price these resources out of the market for a period of time, so that their total production does not exceed the target. The uniform adder approach results in
11
the energy-limited resources operating during the hours they are most needed by the Independent Electricity System Operator (“IESO”). The adder was $7.50/MWh during January, $1.00/MWh during February, and nil during March 2009. The weak economic conditions, and the reduction in natural gas prices and electricity demand is expected to result in coal-fired generation that is below the target for 2009, without the application of an adder. As such, these factors are expected to result in the adder being nil for the remainder of the year.
• Fuel Strategy: OPG contracted for sufficient quantities of fuel to permit production of the coal-fired energy associated with the target emissions of 19.6 million metric tonnes of CO2, which is equivalent to approximately 20 TWh. OPG is continuing to manage its coal purchases and inventory levels as a result of the decrease in coal-fired generation.
As a result of a change in the operating strategy for its fossil-fuelled generating stations, OPG has modified its key measure of reliability as discussed under the Key Generation and Financial Performance Indicators section. The reliability, when needed during the first quarter of 2009, of the fossil-fuelled generating stations improved compared to the first quarter of 2008. Safety
OPG’s safety culture is rooted in the belief that zero injuries can be a reality. Although OPG has received numerous recognitions for its safety performance, safety culture and safety management systems, OPG is committed to further reducing the number of workplace injuries through targeted risk reduction programs. For example, working with its unions, a Musculoskeletal Disorder (“MSD”) Prevention Program was developed to address the contribution of MSD events to safety performance. In 2009, OPG is continuing to implement MSD reduction initiatives in all of OPG’s business units, with a focus on ergonomic change and return-to-work improvement strategies.
Financial Sustainability In response to the economic downturn, OPG has imposed restraints on certain discretionary expenditures and continues to focus on efficiency improvements. In addition, OPG is reviewing planned facility improvements and projects to consider deferring work or reducing the scope of work without impacting health and safety. OPG is also ensuring that sufficient funds are available to achieve its strategic objectives while continuing to seek opportunities to diversify its sources of funding and increase its access to cost-effective capital, as discussed under the heading Liquidity and Capital Resources. Generation Development OPG’s major projects include nuclear plant refurbishment, new nuclear generation, new hydroelectric generation and plant upgrades, capitalizing on emerging biomass opportunities, and expansion into gas-fired generation for contingent electricity production. Significant progress was made during the first quarter of 2009 on a number of projects outlined below. New Nuclear Generating Units In March 2008, the Minister of Energy announced a two-phase competitive request for proposal (“RFP”) process to select a nuclear reactor vendor for two units of baseload generation to provide 2,000 MW to 3,500 MW of generating capacity to the Ontario electricity grid. The target in-service date, as stated by Infrastructure Ontario (“IO”), is mid-2018 for the first unit, and mid-2019 for the second unit. IO is managing the procurement process to select the nuclear reactor vendor. Phase one of the RFP process was aimed at assessing the ability of the invited vendors to support a successful construction licence application in compliance with Canadian regulatory requirements and to successfully deliver the overall project, as well as to ascertain their financial strength and legal position. Phase one was completed in June 2008 with Areva NP, Atomic Energy of Canada Limited, and Westinghouse Electric Company advancing to phase two. Phase two of the competitive RFP process was launched in June 2008 to select a nuclear reactor vendor. Proposal submissions were received by IO in February 2009 from the three respondents, followed by a
12
compliance review and an evaluation process, which is ongoing. A negotiation period to finalize details of a contract is expected to follow the evaluation process. Through the competitive process, IO will select a vendor to design, develop, construct, and provide licensing and commissioning support, and initial fuel supply, of a stand-alone two-unit nuclear power plant at the Darlington site. Respondents are being evaluated in three key areas: lifetime cost of power, ability to meet Ontario's timetable to bring new supply on line in 2018, and the level of investment in Ontario. It is expected that the preferred vendor will be announced by IO in the late spring of 2009. OPG, together with the Province, is pursuing options for financing the project and for the recovery of costs. Niagara Tunnel Progress of the tunnel boring machine continues to be slow due to significant overbreak caused by the rock conditions still being encountered in the Queenston shale formation. As of March 31, 2009, the machine had advanced 3,794 metres. In December 2008, the contractor initiated a realignment of the tunnel to minimize excavation in the Queenston shale formation. This realignment will reduce the tunnel length by about 200 metres, to 10.2 kilometres, and minimize remaining tunnel excavation in the Queenston shale. As a result of significantly slower than expected progress of the tunnel boring machine, costs incurred by the contractor have been significantly above the contract price. In accordance with the contract, a dispute review hearing process was conducted in June 2008 to review, among other things, the actual subsurface conditions compared to those that were anticipated as part of the design build contract. The dispute review board issued its non-binding recommendations in late August 2008. OPG assessed potential alternatives and concluded that a negotiated settlement following the dispute review board’s recommendations was the most prudent approach to settle the dispute, and ensure that the tunnel is completed both safely and expeditiously. As such, OPG and the contractor are renegotiating the design-build contract with a revised target cost and schedule. Going forward, the revised cost and schedule take into account the difficult rock conditions encountered and the parallel mining and liner installation work required for completion of the job. The contract includes incentives related to achieving the target cost and schedule. The original project cost was estimated at $985 million with a scheduled completion of June 2010, as approved by OPG’s Board of Directors. The revised project cost is estimated at $1.6 billion and the revised schedule targets completion by December 2013. The contract is expected to be finalized during the second quarter of 2009. There will continue to be some uncertainty with respect to the tunnel excavation cost and schedule. The capital project expenditures for the three months ended March 31, 2009 were $28 million and life-to-date capital expenditures were $463 million. The project is debt financed through the OEFC. Lac Seul The Lac Seul hydroelectric generating station was declared in-service in February 2009. The station has a capacity of 12.5 MW. As at March 31, 2009, life-to-date expenditures were $54 million. The project is debt financed through the OEFC. OPG has entered into a partnership agreement with the Lac Seul First Nations ("LSFN") regarding this facility. OPG will own a 75 percent interest in the station, while the LSFN will have a 25 percent interest. Upper Mattagami and Hound Chute Design and construction activities to replace four existing hydroelectric generating stations on the Upper Mattagami River continued during the first quarter of 2009. Project financing was completed in May 2009, and senior notes totalling $200 million were issued.
13
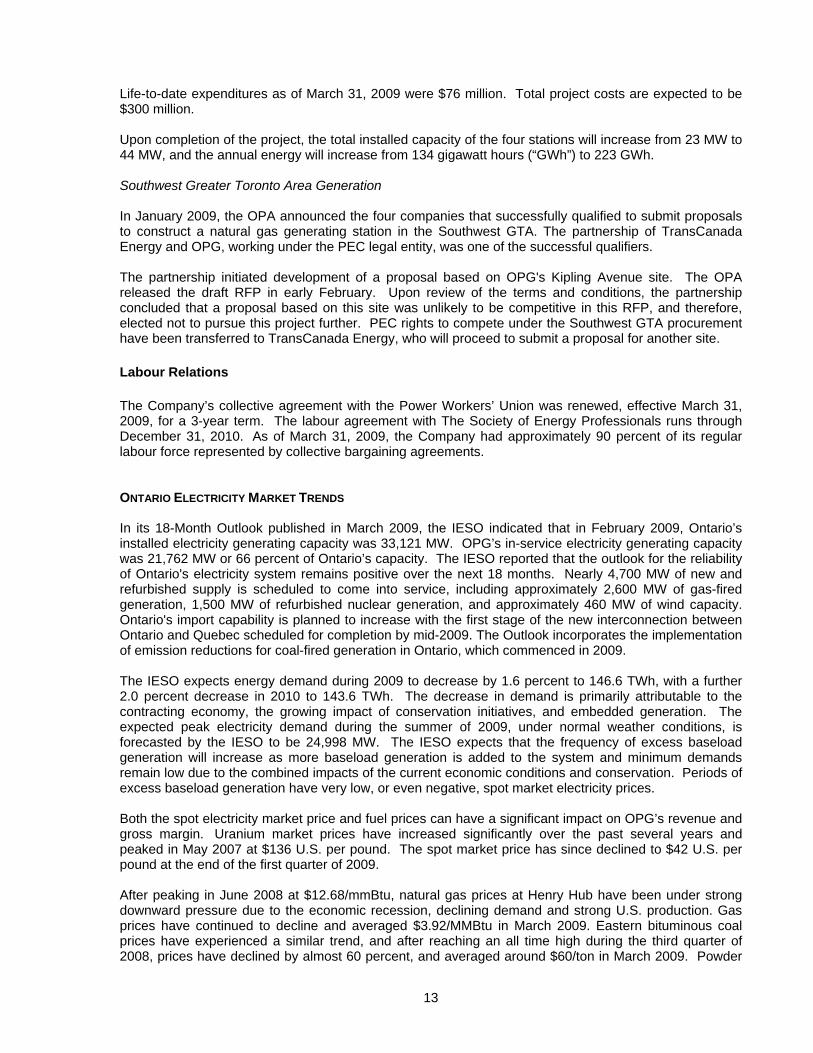
Life-to-date expenditures as of March 31, 2009 were $76 million. Total project costs are expected to be $300 million. Upon completion of the project, the total installed capacity of the four stations will increase from 23 MW to 44 MW, and the annual energy will increase from 134 gigawatt hours (“GWh”) to 223 GWh. Southwest Greater Toronto Area Generation In January 2009, the OPA announced the four companies that successfully qualified to submit proposals to construct a natural gas generating station in the Southwest GTA. The partnership of TransCanada Energy and OPG, working under the PEC legal entity, was one of the successful qualifiers. The partnership initiated development of a proposal based on OPG's Kipling Avenue site. The OPA released the draft RFP in early February. Upon review of the terms and conditions, the partnership concluded that a proposal based on this site was unlikely to be competitive in this RFP, and therefore, elected not to pursue this project further. PEC rights to compete under the Southwest GTA procurement have been transferred to TransCanada Energy, who will proceed to submit a proposal for another site. Labour Relations The Company’s collective agreement with the Power Workers’ Union was renewed, effective March 31, 2009, for a 3-year term. The labour agreement with The Society of Energy Professionals runs through December 31, 2010. As of March 31, 2009, the Company had approximately 90 percent of its regular labour force represented by collective bargaining agreements. ONTARIO ELECTRICITY MARKET TRENDS In its 18-Month Outlook published in March 2009, the IESO indicated that in February 2009, Ontario’s installed electricity generating capacity was 33,121 MW. OPG’s in-service electricity generating capacity was 21,762 MW or 66 percent of Ontario’s capacity. The IESO reported that the outlook for the reliability of Ontario's electricity system remains positive over the next 18 months. Nearly 4,700 MW of new and refurbished supply is scheduled to come into service, including approximately 2,600 MW of gas-fired generation, 1,500 MW of refurbished nuclear generation, and approximately 460 MW of wind capacity. Ontario's import capability is planned to increase with the first stage of the new interconnection between Ontario and Quebec scheduled for completion by mid-2009. The Outlook incorporates the implementation of emission reductions for coal-fired generation in Ontario, which commenced in 2009. The IESO expects energy demand during 2009 to decrease by 1.6 percent to 146.6 TWh, with a further 2.0 percent decrease in 2010 to 143.6 TWh. The decrease in demand is primarily attributable to the contracting economy, the growing impact of conservation initiatives, and embedded generation. The expected peak electricity demand during the summer of 2009, under normal weather conditions, is forecasted by the IESO to be 24,998 MW. The IESO expects that the frequency of excess baseload generation will increase as more baseload generation is added to the system and minimum demands remain low due to the combined impacts of the current economic conditions and conservation. Periods of excess baseload generation have very low, or even negative, spot market electricity prices. Both the spot electricity market price and fuel prices can have a significant impact on OPG’s revenue and gross margin. Uranium market prices have increased significantly over the past several years and peaked in May 2007 at $136 U.S. per pound. The spot market price has since declined to $42 U.S. per pound at the end of the first quarter of 2009. After peaking in June 2008 at $12.68/mmBtu, natural gas prices at Henry Hub have been under strong downward pressure due to the economic recession, declining demand and strong U.S. production. Gas prices have continued to decline and averaged $3.92/MMBtu in March 2009. Eastern bituminous coal prices have experienced a similar trend, and after reaching an all time high during the third quarter of 2008, prices have declined by almost 60 percent, and averaged around $60/ton in March 2009. Powder
14
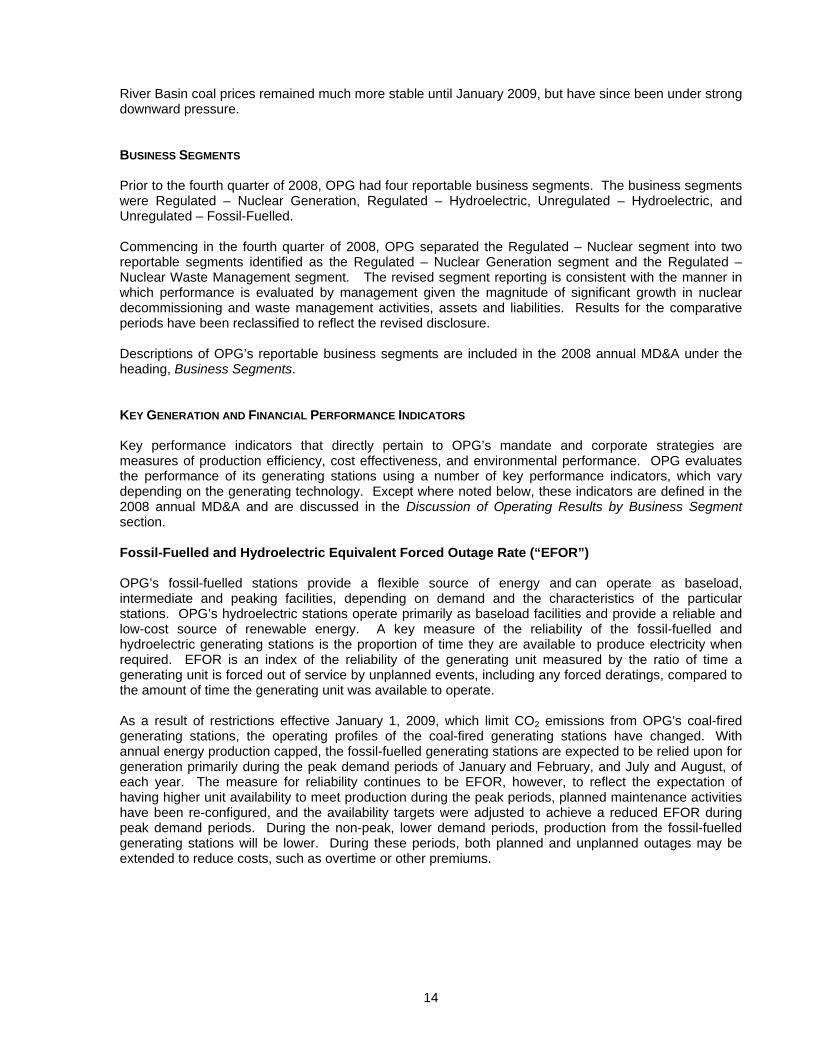
River Basin coal prices remained much more stable until January 2009, but have since been under strong downward pressure. BUSINESS SEGMENTS Prior to the fourth quarter of 2008, OPG had four reportable business segments. The business segments were Regulated – Nuclear Generation, Regulated – Hydroelectric, Unregulated – Hydroelectric, and Unregulated – Fossil-Fuelled. Commencing in the fourth quarter of 2008, OPG separated the Regulated – Nuclear segment into two reportable segments identified as the Regulated – Nuclear Generation segment and the Regulated – Nuclear Waste Management segment. The revised segment reporting is consistent with the manner in which performance is evaluated by management given the magnitude of significant growth in nuclear decommissioning and waste management activities, assets and liabilities. Results for the comparative periods have been reclassified to reflect the revised disclosure. Descriptions of OPG’s reportable business segments are included in the 2008 annual MD&A under the heading, Business Segments. KEY GENERATION AND FINANCIAL PERFORMANCE INDICATORS Key performance indicators that directly pertain to OPG’s mandate and corporate strategies are measures of production efficiency, cost effectiveness, and environmental performance. OPG evaluates the performance of its generating stations using a number of key performance indicators, which vary depending on the generating technology. Except where noted below, these indicators are defined in the 2008 annual MD&A and are discussed in the Discussion of Operating Results by Business Segment section. Fossil-Fuelled and Hydroelectric Equivalent Forced Outage Rate (“EFOR”) OPG’s fossil-fuelled stations provide a flexible source of energy and can operate as baseload, intermediate and peaking facilities, depending on demand and the characteristics of the particular stations. OPG’s hydroelectric stations operate primarily as baseload facilities and provide a reliable and low-cost source of renewable energy. A key measure of the reliability of the fossil-fuelled and hydroelectric generating stations is the proportion of time they are available to produce electricity when required. EFOR is an index of the reliability of the generating unit measured by the ratio of time a generating unit is forced out of service by unplanned events, including any forced deratings, compared to the amount of time the generating unit was available to operate. As a result of restrictions effective January 1, 2009, which limit CO2 emissions from OPG's coal-fired generating stations, the operating profiles of the coal-fired generating stations have changed. With annual energy production capped, the fossil-fuelled generating stations are expected to be relied upon for generation primarily during the peak demand periods of January and February, and July and August, of each year. The measure for reliability continues to be EFOR, however, to reflect the expectation of having higher unit availability to meet production during the peak periods, planned maintenance activities have been re-configured, and the availability targets were adjusted to achieve a reduced EFOR during peak demand periods. During the non-peak, lower demand periods, production from the fossil-fuelled generating stations will be lower. During these periods, both planned and unplanned outages may be extended to reduce costs, such as overtime or other premiums.
15
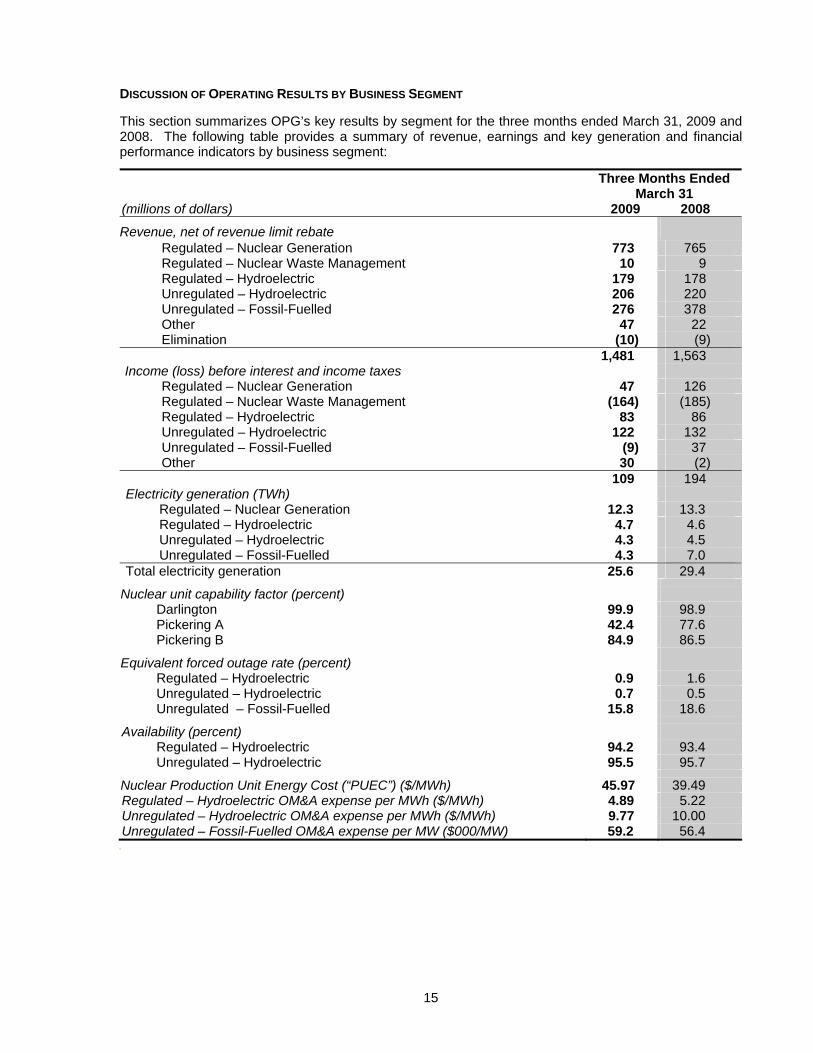
DISCUSSION OF OPERATING RESULTS BY BUSINESS SEGMENT This section summarizes OPG’s key results by segment for the three months ended March 31, 2009 and 2008. The following table provides a summary of revenue, earnings and key generation and financial performance indicators by business segment:
Three Months Ended March 31
(millions of dollars) 2009 2008 Revenue, net of revenue limit rebate
Regulated – Nuclear Generation 773 765 Regulated – Nuclear Waste Management 10 9 Regulated – Hydroelectric 179 178 Unregulated – Hydroelectric 206 220 Unregulated – Fossil-Fuelled 276 378 Other 47 22 Elimination (10) (9)
1,481 1,563 Income (loss) before interest and income taxes
Regulated – Nuclear Generation 47 126 Regulated – Nuclear Waste Management (164) (185) Regulated – Hydroelectric 83 86 Unregulated – Hydroelectric 122 132 Unregulated – Fossil-Fuelled (9) 37 Other 30 (2)
109 194 Electricity generation (TWh)
Regulated – Nuclear Generation 12.3 13.3 Regulated – Hydroelectric 4.7 4.6 Unregulated – Hydroelectric 4.3 4.5 Unregulated – Fossil-Fuelled 4.3 7.0
Total electricity generation 25.6 29.4
Nuclear unit capability factor (percent) Darlington 99.9 98.9 Pickering A 42.4 77.6 Pickering B 84.9 86.5
Equivalent forced outage rate (percent) Regulated – Hydroelectric 0.9 1.6 Unregulated – Hydroelectric 0.7 0.5 Unregulated – Fossil-Fuelled 15.8 18.6
Availability (percent) Regulated – Hydroelectric 94.2 93.4 Unregulated – Hydroelectric 95.5 95.7
Nuclear Production Unit Energy Cost (“PUEC”) ($/MWh) 45.97 39.49 Regulated – Hydroelectric OM&A expense per MWh ($/MWh) 4.89 5.22 Unregulated – Hydroelectric OM&A expense per MWh ($/MWh) 9.77 10.00 Unregulated – Fossil-Fuelled OM&A expense per MW ($000/MW) 59.2 56.4
0
16
Regulated – Nuclear Generation Segment Three Months Ended
March 31 (millions of dollars) 2009 2008 Regulated generation sales 674 654 Variance accounts 13 - Other 86 111 Total revenue 773 765 Fuel expense 49 41 Gross margin 724 724 Operations, maintenance and administration 552 499 Depreciation and amortization 114 106 Property and capital taxes 11 (7) Income before interest and income taxes
47
126
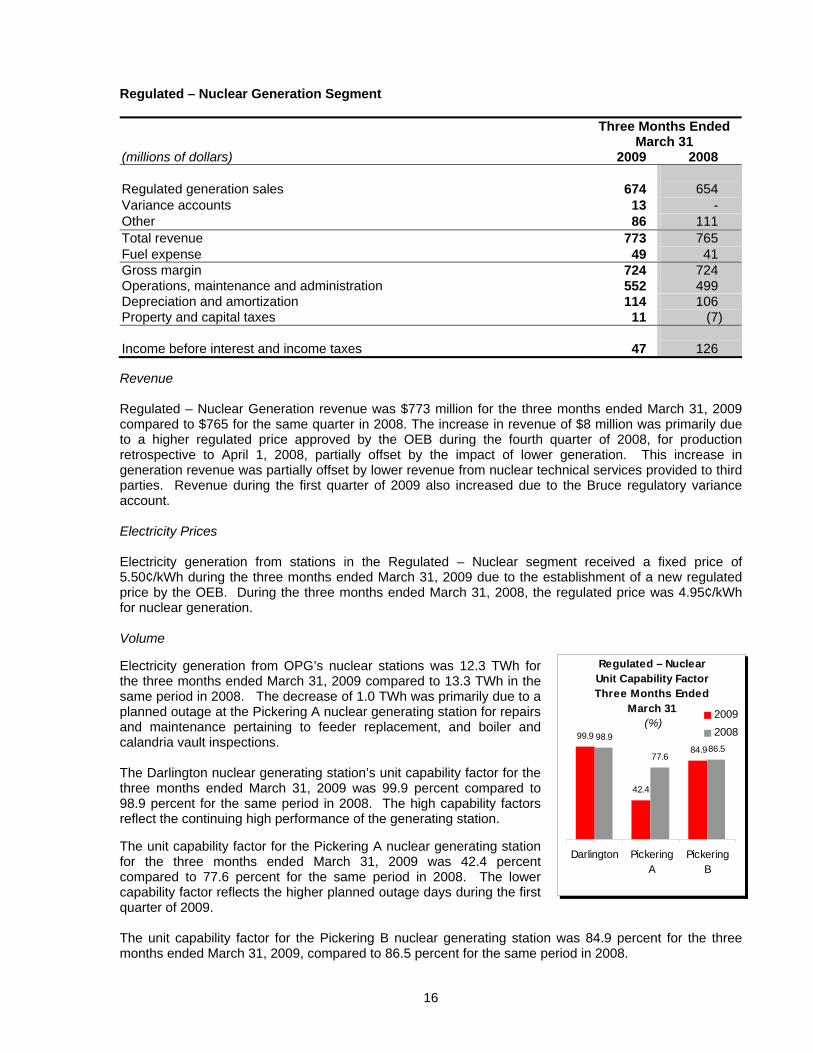
Revenue Regulated – Nuclear Generation revenue was $773 million for the three months ended March 31, 2009 compared to $765 for the same quarter in 2008. The increase in revenue of $8 million was primarily due to a higher regulated price approved by the OEB during the fourth quarter of 2008, for production retrospective to April 1, 2008, partially offset by the impact of lower generation. This increase in generation revenue was partially offset by lower revenue from nuclear technical services provided to third parties. Revenue during the first quarter of 2009 also increased due to the Bruce regulatory variance account. Electricity Prices Electricity generation from stations in the Regulated – Nuclear segment received a fixed price of 5.50¢/kWh during the three months ended March 31, 2009 due to the establishment of a new regulated price by the OEB. During the three months ended March 31, 2008, the regulated price was 4.95¢/kWh for nuclear generation. Volume Electricity generation from OPG’s nuclear stations was 12.3 TWh for the three months ended March 31, 2009 compared to 13.3 TWh in the same period in 2008. The decrease of 1.0 TWh was primarily due to a planned outage at the Pickering A nuclear generating station for repairs and maintenance pertaining to feeder replacement, and boiler and calandria vault inspections. The Darlington nuclear generating station’s unit capability factor for the three months ended March 31, 2009 was 99.9 percent compared to 98.9 percent for the same period in 2008. The high capability factors reflect the continuing high performance of the generating station. The unit capability factor for the Pickering A nuclear generating station for the three months ended March 31, 2009 was 42.4 percent compared to 77.6 percent for the same period in 2008. The lower capability factor reflects the higher planned outage days during the first quarter of 2009. The unit capability factor for the Pickering B nuclear generating station was 84.9 percent for the three months ended March 31, 2009, compared to 86.5 percent for the same period in 2008.
Regulated – Nuclear Unit Capability Factor Three Months Ended
March 31 (%)
84.9
42.4
99.986.5
77.6
98.9
Darlington PickeringA
PickeringB
20092008
17
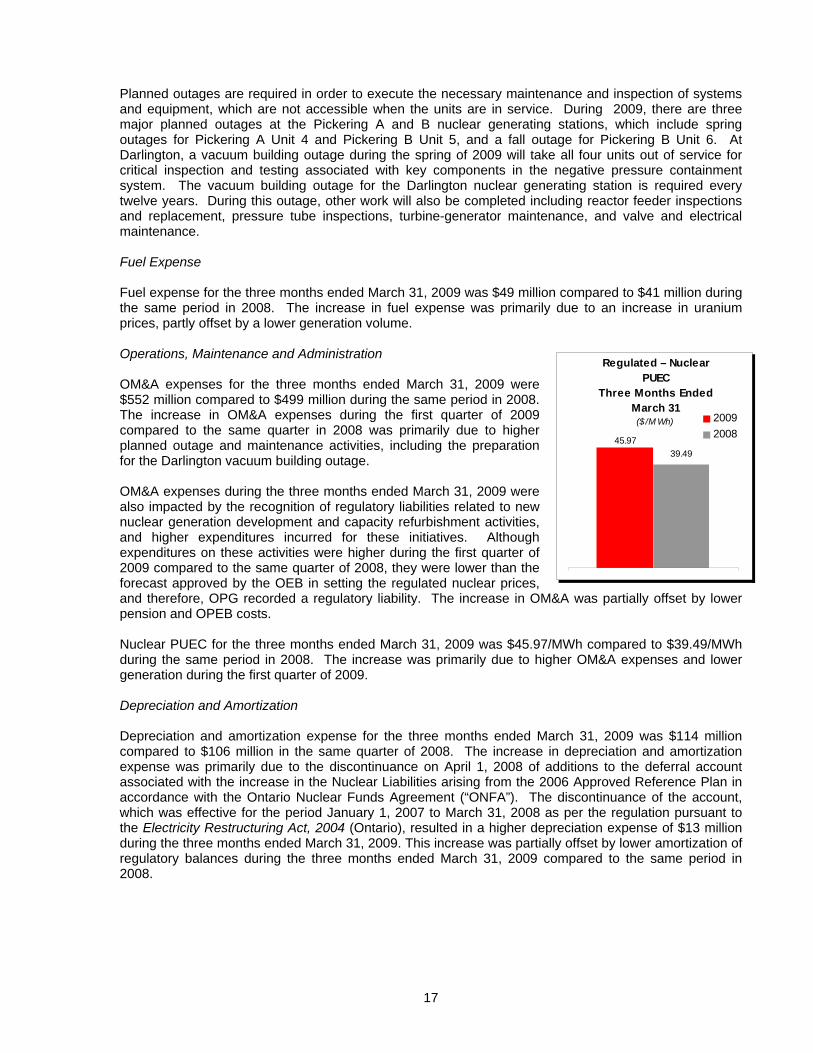
Planned outages are required in order to execute the necessary maintenance and inspection of systems and equipment, which are not accessible when the units are in service. During 2009, there are three major planned outages at the Pickering A and B nuclear generating stations, which include spring outages for Pickering A Unit 4 and Pickering B Unit 5, and a fall outage for Pickering B Unit 6. At Darlington, a vacuum building outage during the spring of 2009 will take all four units out of service for critical inspection and testing associated with key components in the negative pressure containment system. The vacuum building outage for the Darlington nuclear generating station is required every twelve years. During this outage, other work will also be completed including reactor feeder inspections and replacement, pressure tube inspections, turbine-generator maintenance, and valve and electrical maintenance. Fuel Expense Fuel expense for the three months ended March 31, 2009 was $49 million compared to $41 million during the same period in 2008. The increase in fuel expense was primarily due to an increase in uranium prices, partly offset by a lower generation volume. Operations, Maintenance and Administration OM&A expenses for the three months ended March 31, 2009 were $552 million compared to $499 million during the same period in 2008. The increase in OM&A expenses during the first quarter of 2009 compared to the same quarter in 2008 was primarily due to higher planned outage and maintenance activities, including the preparation for the Darlington vacuum building outage. OM&A expenses during the three months ended March 31, 2009 were also impacted by the recognition of regulatory liabilities related to new nuclear generation development and capacity refurbishment activities, and higher expenditures incurred for these initiatives. Although expenditures on these activities were higher during the first quarter of 2009 compared to the same quarter of 2008, they were lower than the forecast approved by the OEB in setting the regulated nuclear prices, and therefore, OPG recorded a regulatory liability. The increase in OM&A was partially offset by lower pension and OPEB costs. Nuclear PUEC for the three months ended March 31, 2009 was $45.97/MWh compared to $39.49/MWh during the same period in 2008. The increase was primarily due to higher OM&A expenses and lower generation during the first quarter of 2009. Depreciation and Amortization Depreciation and amortization expense for the three months ended March 31, 2009 was $114 million compared to $106 million in the same quarter of 2008. The increase in depreciation and amortization expense was primarily due to the discontinuance on April 1, 2008 of additions to the deferral account associated with the increase in the Nuclear Liabilities arising from the 2006 Approved Reference Plan in accordance with the Ontario Nuclear Funds Agreement (“ONFA”). The discontinuance of the account, which was effective for the period January 1, 2007 to March 31, 2008 as per the regulation pursuant to the Electricity Restructuring Act, 2004 (Ontario), resulted in a higher depreciation expense of $13 million during the three months ended March 31, 2009. This increase was partially offset by lower amortization of regulatory balances during the three months ended March 31, 2009 compared to the same period in 2008.
Regulated – Nuclear PUEC
Three Months EndedMarch 31 ($ /M Wh)
45.9739.49
20092008
18
Regulated – Nuclear Waste Management Segment
Three Months Ended March 31
(millions of dollars) 2009 2008 Revenue 10 9 Operations, maintenance and administration 11 10 Accretion on fixed asset removal and nuclear waste management liabilities 157 133 Loss on nuclear fixed asset removal and nuclear waste management funds 6 51 Loss before interest and income taxes
(164)
(185)
Accretion Accretion expense for the three months ended March 31, 2009 was $157 million compared to $133 million for the same period in 2008. The increase in accretion expense during the first quarter of 2009, compared to the same period in 2008, was primarily due to the discontinuance on April 1, 2008 of additions to the deferral account associated with the increase in the Nuclear Liabilities arising from the 2006 Approved Reference Plan. Accretion expense also increased due to the higher balance of Nuclear Liabilities, primarily as a result of the increase in the present value of the liabilities due to the passage of time. Losses on the Nuclear Fixed Asset Removal and Nuclear Waste Management Funds Losses from the Nuclear Funds for the three months ended March 31, 2009 were $6 million compared to $51 million during the first quarter of 2008. During the first quarter of 2009, before the mitigating impact of the Bruce variance account, there were losses from the Nuclear Funds of $136 million compared to $51 million during the same period in 2008. The increase in the losses from the Nuclear Funds of $85 million, before the impact of the regulatory asset, was primarily due to a lower consumer price index adjustment which affected the guaranteed return from the Used Fuel Fund, and lower returns on the Decommissioning Fund as a result of significant reductions in the trading levels of global financial markets, which reduced the current market value of the fund investments. A portion of the Nuclear Funds relates to OPG’s obligations with respect to decommissioning the nuclear generating stations on lease to Bruce Power, as well as managing nuclear used fuel and waste produced by these stations. As a result of the OEB’s decision, OPG established the Bruce variance account to capture the differences between actual and forecast revenues and costs associated with the Bruce nuclear generating stations. During the first quarter of 2009, OPG recorded a regulatory asset of $130 million related to the Nuclear Funds, which reduced the reported losses on the Nuclear Funds.
19
Regulated – Hydroelectric Segment
Three Months Ended March 31
(millions of dollars) 2009 2008 Regulated generation sales 170 164 Variance accounts (8) 1 Other 17 13 Revenue 179 178 Fuel expense 52 49 Gross margin 127 129 Operations, maintenance and administration 23 24 Depreciation and amortization 18 16 Property and capital taxes 3 3 Income before interest and income taxes 83 86
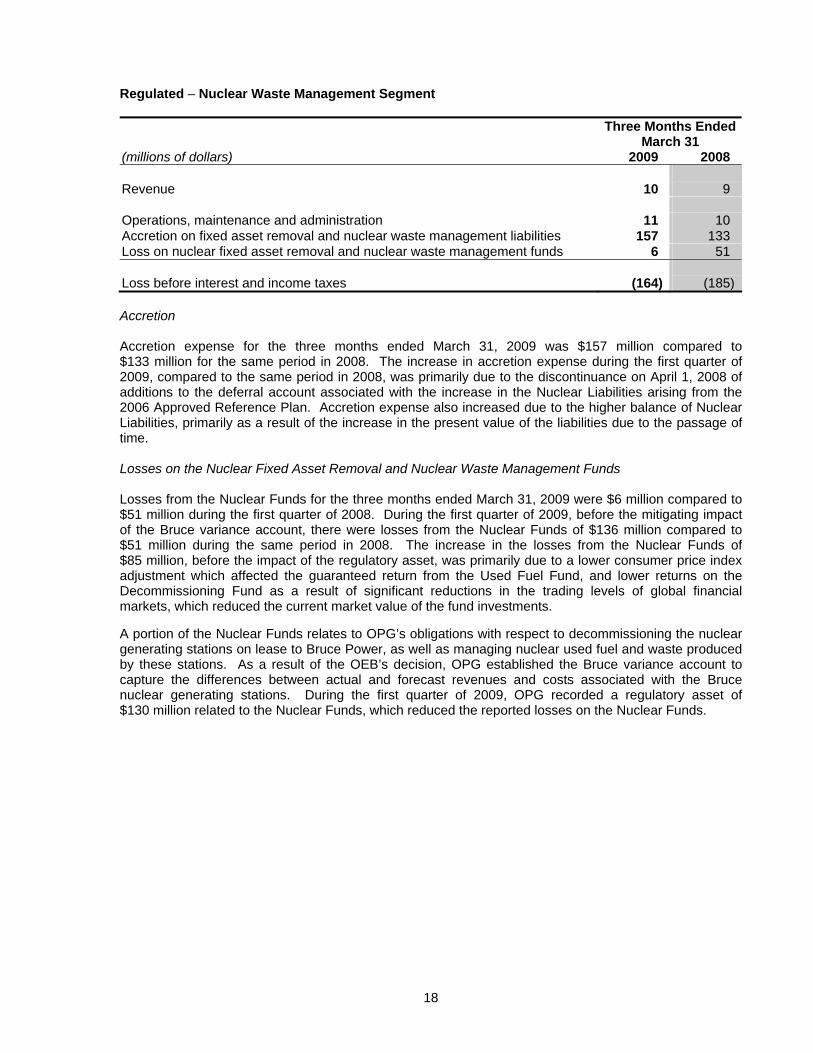
Revenue Regulated – Hydroelectric revenue was $179 million for the three months ended March 31, 2009 compared to $178 million during the same period in 2008. Electricity Prices For the three months ended March 31, 2009, electricity generation received a fixed price of 3.67¢/kWh, subject to a revised incentive mechanism. The OEB approved a revised incentive mechanism effective December 1, 2008. Under this mechanism, OPG receives the approved hydroelectric payment amount for the actual average hourly net energy production from the prescribed hydroelectric facilities in that month. In the hours when the net actual energy production in Ontario is greater or less than the average hourly net volume, OPG's revenues are adjusted by the difference between the average hourly net volume in the month and the actual net energy production multiplied by the market price. The revised incentive mechanism resulted in net revenue of $4 million during the first quarter of 2009. For the three months ended March 31, 2008, electricity generation up to 1,900 MWh in any hour from stations in the Regulated – Hydroelectric segment, received a fixed price of 3.3¢/kWh, and the spot electricity market price for generation above this level. The regulated generation sales for the three months ended March 31, 2008 included revenue of $41 million at the spot electricity market price. Volume Electricity generation volume for the three months ended March 31, 2009 and 2008 was 4.7 TWh and 4.6 TWh, respectively. The increase in volume was primarily due to higher availability and an increase in water flows. For the three months ended March 31, 2008, volume related to production levels above 1,900 MWh, in any hour, was 0.8 TWh.
Unregulated – Hydroelectric EFOR
Three Months EndedMarch 31
(%)
0.7
0.5
0.0
0.2
0.4
0.6
0.8
1.0
1.2
1.4
1.6
1.8
2.0
2009
2008
Regulated – HydroelectricAvailability
Three Months Ended March 31
(%)
94.2 93.4
20092008
20
For the three months ended March 31, 2009 and 2008, the EFOR for the Regulated – Hydroelectric stations was 0.9 percent and 1.6 percent, respectively. The availability for the Regulated – Hydroelectric stations was 94.2 percent for the first quarter of 2009 compared to 93.4 percent for the same quarter in 2008. The increase in availability and lower EFOR reflected the continuing strong performance of the hydroelectric stations. Fuel Expense Fuel expense was $52 million for the three months ended March 31, 2009 compared to $49 million in the same period during 2008. Variance Accounts During the three months ended March 31, 2009, OPG recorded a decrease in revenue of $8 million due to regulatory variance accounts that reflect the impact of differences between forecast and actual water conditions on hydroelectric production, and differences between forecast and actual ancillary services revenue. During the first quarter of 2008, OPG recorded an increase to revenue of $1 million related to these variance accounts. Operations, Maintenance and Administration OM&A expenses for the three months ended March 31, 2009 were $23 million compared to $24 million for the same period in 2008.
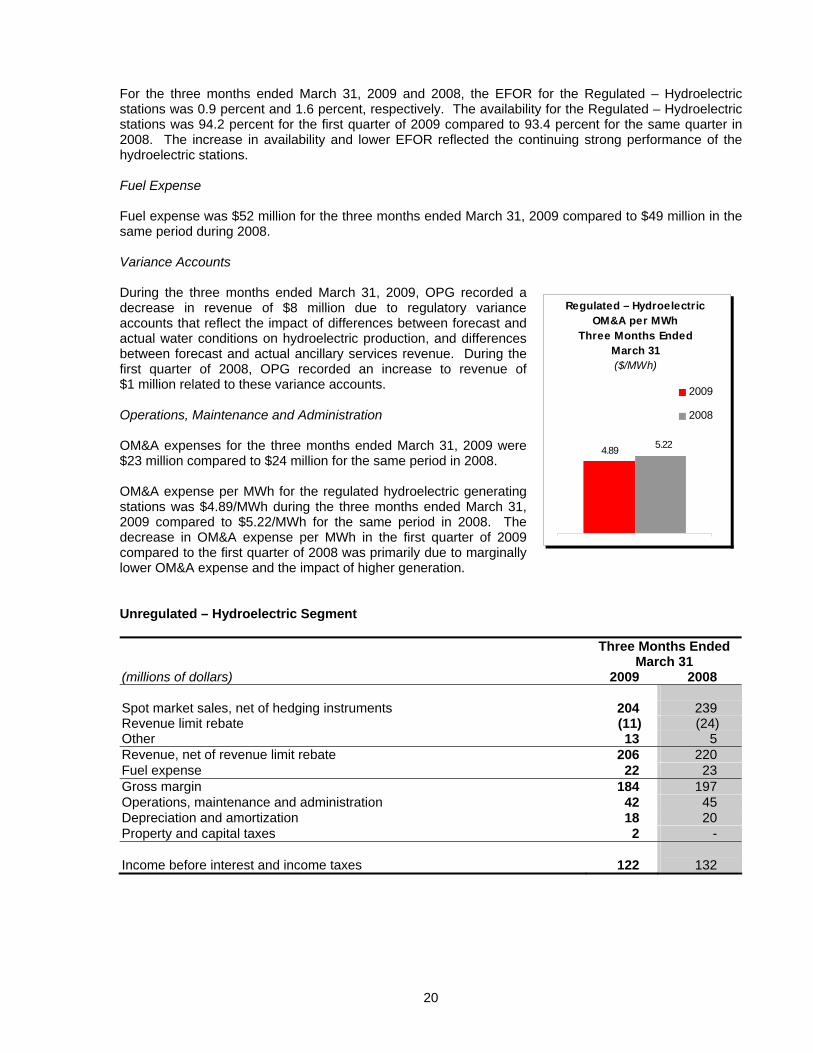
OM&A expense per MWh for the regulated hydroelectric generating stations was $4.89/MWh during the three months ended March 31, 2009 compared to $5.22/MWh for the same period in 2008. The decrease in OM&A expense per MWh in the first quarter of 2009 compared to the first quarter of 2008 was primarily due to marginally lower OM&A expense and the impact of higher generation. Unregulated – Hydroelectric Segment Three Months Ended
March 31 (millions of dollars) 2009 2008 Spot market sales, net of hedging instruments 204 239 Revenue limit rebate (11) (24) Other 13 5 Revenue, net of revenue limit rebate 206 220 Fuel expense 22 23 Gross margin 184 197 Operations, maintenance and administration 42 45 Depreciation and amortization 18 20 Property and capital taxes 2 - Income before interest and income taxes
122
132
Regulated – Hydroelectric OM&A per MWh
Three Months Ended March 31 ($/MWh)
4.89 5.22
2009
2008
21
Unregulated – Hydroelectric EFOR
Three Months EndedMarch 31
(%)
0.7
0.5
0.0
0.2
0.4
0.6
0.8
1.0
1.2
1.4
1.6
1.8
2.0
2009
2008
Unregulated – Hydroelectric Availability
Three Months Ended March 31
(%)
95.5 95.7
2009
2008
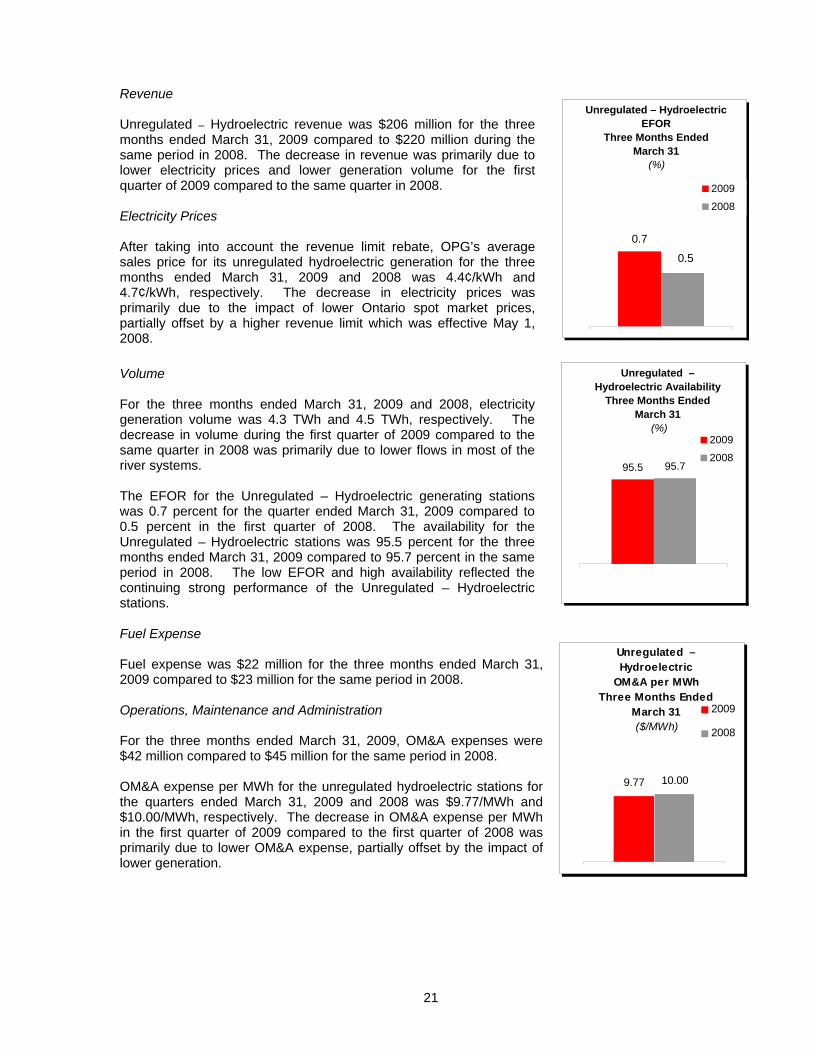
Revenue Unregulated – Hydroelectric revenue was $206 million for the three months ended March 31, 2009 compared to $220 million during the same period in 2008. The decrease in revenue was primarily due to lower electricity prices and lower generation volume for the first quarter of 2009 compared to the same quarter in 2008. Electricity Prices After taking into account the revenue limit rebate, OPG’s average sales price for its unregulated hydroelectric generation for the three months ended March 31, 2009 and 2008 was 4.4¢/kWh and 4.7¢/kWh, respectively. The decrease in electricity prices was primarily due to the impact of lower Ontario spot market prices, partially offset by a higher revenue limit which was effective May 1, 2008. Volume For the three months ended March 31, 2009 and 2008, electricity generation volume was 4.3 TWh and 4.5 TWh, respectively. The decrease in volume during the first quarter of 2009 compared to the same quarter in 2008 was primarily due to lower flows in most of the river systems. The EFOR for the Unregulated – Hydroelectric generating stations was 0.7 percent for the quarter ended March 31, 2009 compared to 0.5 percent in the first quarter of 2008. The availability for the Unregulated – Hydroelectric stations was 95.5 percent for the three months ended March 31, 2009 compared to 95.7 percent in the same period in 2008. The low EFOR and high availability reflected the continuing strong performance of the Unregulated – Hydroelectric stations. Fuel Expense Fuel expense was $22 million for the three months ended March 31, 2009 compared to $23 million for the same period in 2008. Operations, Maintenance and Administration For the three months ended March 31, 2009, OM&A expenses were $42 million compared to $45 million for the same period in 2008. OM&A expense per MWh for the unregulated hydroelectric stations for the quarters ended March 31, 2009 and 2008 was $9.77/MWh and $10.00/MWh, respectively. The decrease in OM&A expense per MWh in the first quarter of 2009 compared to the first quarter of 2008 was primarily due to lower OM&A expense, partially offset by the impact of lower generation.
Unregulated – Hydroelectric
OM&A per MWhThree Months Ended
March 31 ($/MWh)
9.77 10.00
2009
2008
22
Unregulated – Fossil-Fuelled Segment Three Months Ended
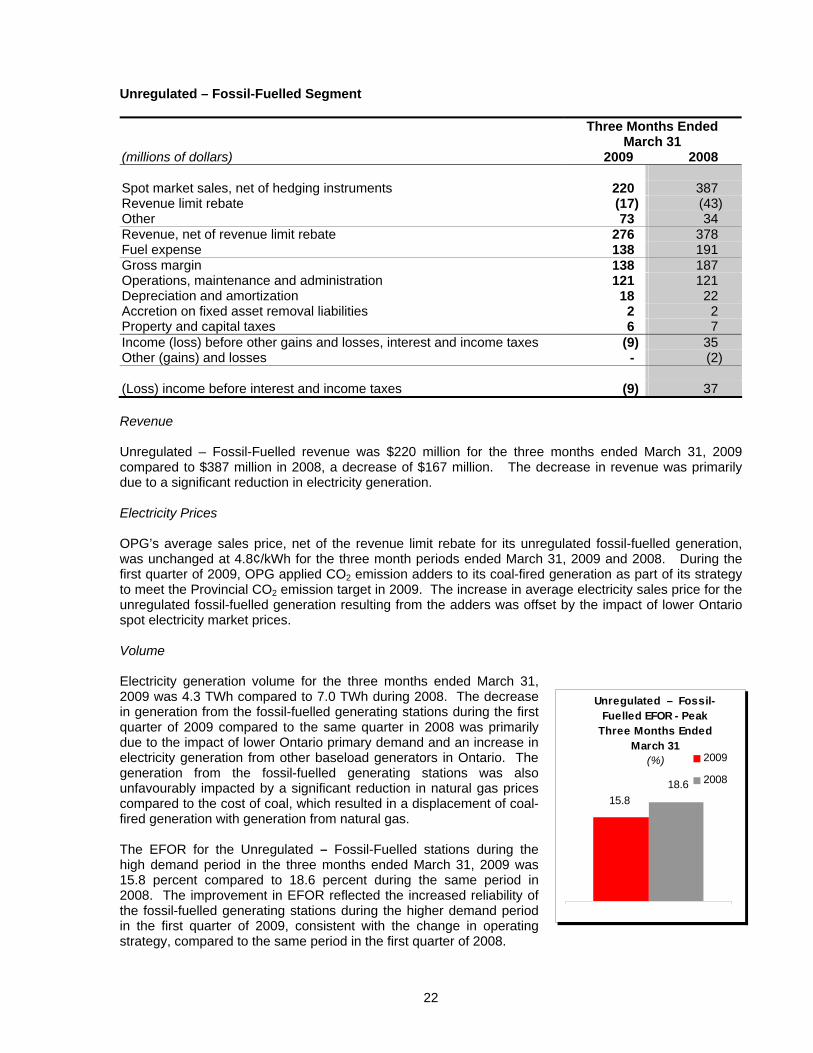
March 31 (millions of dollars) 2009 2008 Spot market sales, net of hedging instruments 220 387 Revenue limit rebate (17) (43) Other 73 34 Revenue, net of revenue limit rebate 276 378 Fuel expense 138 191 Gross margin 138 187 Operations, maintenance and administration 121 121 Depreciation and amortization 18 22 Accretion on fixed asset removal liabilities 2 2 Property and capital taxes 6 7 Income (loss) before other gains and losses, interest and income taxes (9) 35 Other (gains) and losses - (2) (Loss) income before interest and income taxes (9) 37 Revenue Unregulated – Fossil-Fuelled revenue was $220 million for the three months ended March 31, 2009 compared to $387 million in 2008, a decrease of $167 million. The decrease in revenue was primarily due to a significant reduction in electricity generation. Electricity Prices OPG’s average sales price, net of the revenue limit rebate for its unregulated fossil-fuelled generation, was unchanged at 4.8¢/kWh for the three month periods ended March 31, 2009 and 2008. During the first quarter of 2009, OPG applied CO2 emission adders to its coal-fired generation as part of its strategy to meet the Provincial CO2 emission target in 2009. The increase in average electricity sales price for the unregulated fossil-fuelled generation resulting from the adders was offset by the impact of lower Ontario spot electricity market prices. Volume Electricity generation volume for the three months ended March 31, 2009 was 4.3 TWh compared to 7.0 TWh during 2008. The decrease in generation from the fossil-fuelled generating stations during the first quarter of 2009 compared to the same quarter in 2008 was primarily due to the impact of lower Ontario primary demand and an increase in electricity generation from other baseload generators in Ontario. The generation from the fossil-fuelled generating stations was also unfavourably impacted by a significant reduction in natural gas prices compared to the cost of coal, which resulted in a displacement of coal-fired generation with generation from natural gas. The EFOR for the Unregulated – Fossil-Fuelled stations during the high demand period in the three months ended March 31, 2009 was 15.8 percent compared to 18.6 percent during the same period in 2008. The improvement in EFOR reflected the increased reliability of the fossil-fuelled generating stations during the higher demand period in the first quarter of 2009, consistent with the change in operating strategy, compared to the same period in the first quarter of 2008.
Unregulated – Fossil-Fuelled EFOR - Peak
Three Months Ended March 31
(%)
15.818.6
2009
2008
23
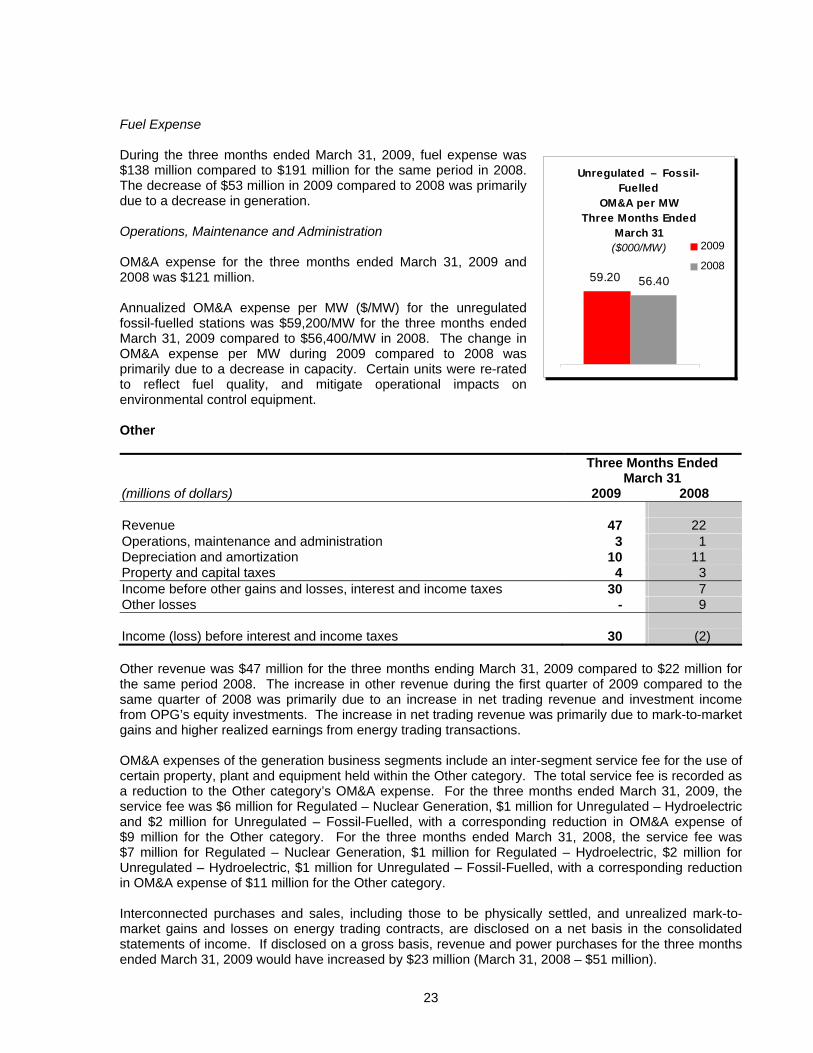
Fuel Expense During the three months ended March 31, 2009, fuel expense was $138 million compared to $191 million for the same period in 2008. The decrease of $53 million in 2009 compared to 2008 was primarily due to a decrease in generation. Operations, Maintenance and Administration OM&A expense for the three months ended March 31, 2009 and 2008 was $121 million. Annualized OM&A expense per MW ($/MW) for the unregulated fossil-fuelled stations was $59,200/MW for the three months ended March 31, 2009 compared to $56,400/MW in 2008. The change in OM&A expense per MW during 2009 compared to 2008 was primarily due to a decrease in capacity. Certain units were re-rated to reflect fuel quality, and mitigate operational impacts on environmental control equipment. Other Three Months Ended
March 31 (millions of dollars) 2009 2008 Revenue 47 22 Operations, maintenance and administration 3 1 Depreciation and amortization 10 11 Property and capital taxes 4 3 Income before other gains and losses, interest and income taxes 30 7 Other losses - 9 Income (loss) before interest and income taxes
30
(2)
Other revenue was $47 million for the three months ending March 31, 2009 compared to $22 million for the same period 2008. The increase in other revenue during the first quarter of 2009 compared to the same quarter of 2008 was primarily due to an increase in net trading revenue and investment income from OPG’s equity investments. The increase in net trading revenue was primarily due to mark-to-market gains and higher realized earnings from energy trading transactions. OM&A expenses of the generation business segments include an inter-segment service fee for the use of certain property, plant and equipment held within the Other category. The total service fee is recorded as a reduction to the Other category’s OM&A expense. For the three months ended March 31, 2009, the service fee was $6 million for Regulated – Nuclear Generation, $1 million for Unregulated – Hydroelectric and $2 million for Unregulated – Fossil-Fuelled, with a corresponding reduction in OM&A expense of $9 million for the Other category. For the three months ended March 31, 2008, the service fee was $7 million for Regulated – Nuclear Generation, $1 million for Regulated – Hydroelectric, $2 million for Unregulated – Hydroelectric, $1 million for Unregulated – Fossil-Fuelled, with a corresponding reduction in OM&A expense of $11 million for the Other category. Interconnected purchases and sales, including those to be physically settled, and unrealized mark-to-market gains and losses on energy trading contracts, are disclosed on a net basis in the consolidated statements of income. If disclosed on a gross basis, revenue and power purchases for the three months ended March 31, 2009 would have increased by $23 million (March 31, 2008 – $51 million).
Unregulated – Fossil-Fuelled
OM&A per MW Three Months Ended
March 31 ($000/MW)
59.20 56.40
2009
2008
24
The changes in the fair value of derivative instruments not qualifying for hedge accounting are recorded in Other revenue, and the fair value of derivative instruments are carried on the consolidated balance sheets as assets or liabilities at fair value. The carrying amounts and notional quantities of the derivative instruments are disclosed in Note 12 in the unaudited interim consolidated financial statements as at and for the three months ended March 31, 2009. Net Interest Expense Net interest expense for the three months ended March 31, 2009 was $39 million compared to $40 million for the same quarter in 2008. Income Taxes From April 1, 2005 to 2008, OPG followed the liability method of tax accounting for its unregulated operations and the taxes payable method for the rate regulated segments of its business. Under the liability method, future tax assets and liabilities are determined based on differences between the accounting and tax bases of assets and liabilities and measured using the substantively enacted tax rates and laws that will be in effect when the differences are expected to reverse. Under the taxes payable method, OPG does not recognize future income taxes relating to the rate regulated segments of its business to the extent those future income taxes are expected to be recovered or refunded through future regulated prices charged to customers. Accordingly, OPG did not record future tax recoveries of $24 million during the three months ended March 31, 2008, which would have been recorded had OPG accounted for income taxes for the regulated segments using the liability method. In December 2007, the Canadian Institute of Chartered Accountants (“CICA”) revised its guidance on accounting for rate regulated operations. The revision resulted in amendments to Handbook 3465, Income Taxes, and Accounting Guideline 19 (“AcG-19”), Disclosures by Entities Subject to Rate Regulation, as follows: • to amend Section 3465 to require, effective January 1, 2009, the recognition of future income tax
liabilities and assets as well as a separate regulatory asset or liability for the amount of future income taxes expected to be included in future rates and recovered from or paid to customers; and
• to amend AcG-19, as necessary, as a result of the amendment to Section 3465. Accordingly, on January 1, 2009, OPG recorded a future income tax liability of $340 million, being the cumulative future income tax liability on January 1, 2009 related to differences between the accounting and tax bases of assets and liabilities, measured using the substantively enacted tax rates and laws that will be in effect when the differences are expected to reverse and recorded a corresponding regulatory asset. OPG also recorded an additional future income tax liability and a corresponding regulatory asset of $126 million for future income taxes resulting from regulatory assets that were recorded due to amendments to Section 3465. Effective January 1, 2009, OPG follows the liability method of tax accounting for all its business segments and records a corresponding regulatory asset or liability for the future taxes relating to its rate regulated segment. For the three months ended March 31, 2009, income tax expense was $79 million compared to an income tax recovery of $8 million for the same period in 2008. Income tax expense during the first quarter of 2008 was favourably impacted by a reduction in income tax liabilities as a result of the resolution of a number of tax uncertainties related to the audit of OPG’s 1999 taxation year. Income tax expense during the first quarter of 2009 included income tax expense recorded as part of the Bruce variance account established by the OEB. The increase in income tax expense for the first quarter of 2009 compared to the same period in 2008 was partially offset by the impact of lower taxable income during the first quarter of 2009. The audit of OPG’s taxation years subsequent to 1999 has commenced in 2009. Should the outcome of the audit for subsequent years differ from OPG’s recorded income tax liabilities, the Company’s effective tax rate and its net income could be materially affected either negatively or positively in the period in which the matters are resolved.
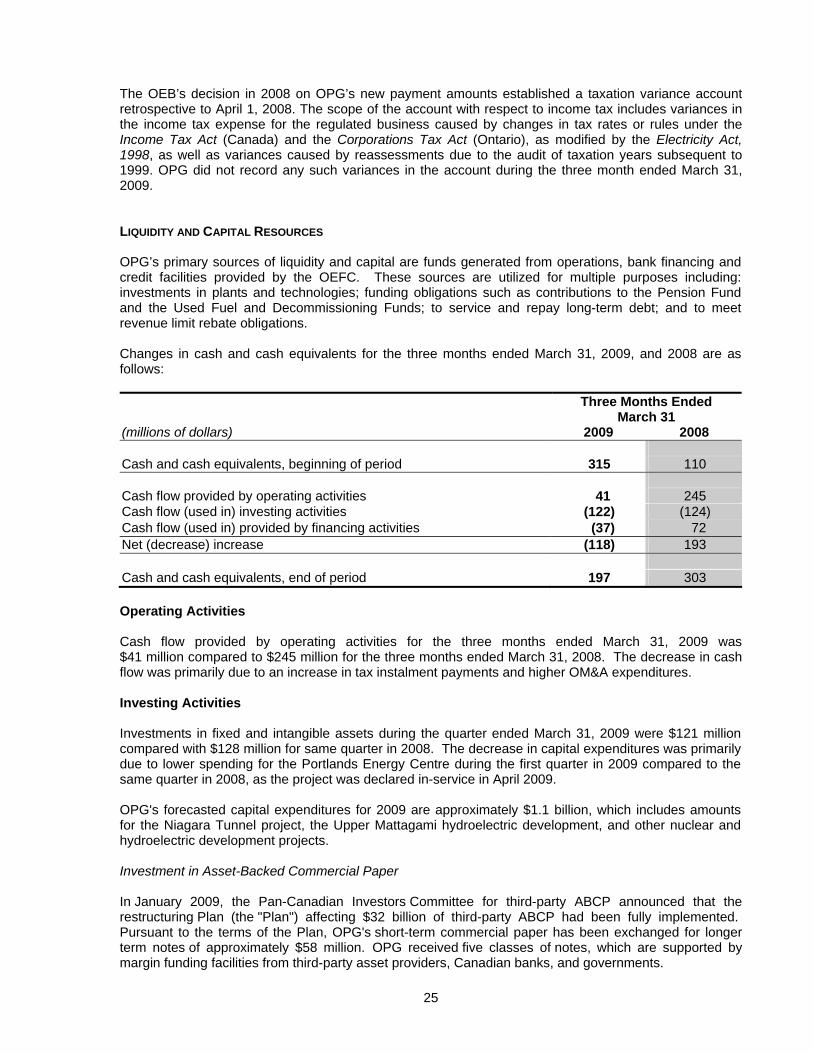
25
The OEB’s decision in 2008 on OPG’s new payment amounts established a taxation variance account retrospective to April 1, 2008. The scope of the account with respect to income tax includes variances in the income tax expense for the regulated business caused by changes in tax rates or rules under the Income Tax Act (Canada) and the Corporations Tax Act (Ontario), as modified by the Electricity Act, 1998, as well as variances caused by reassessments due to the audit of taxation years subsequent to 1999. OPG did not record any such variances in the account during the three month ended March 31, 2009. LIQUIDITY AND CAPITAL RESOURCES OPG’s primary sources of liquidity and capital are funds generated from operations, bank financing and credit facilities provided by the OEFC. These sources are utilized for multiple purposes including: investments in plants and technologies; funding obligations such as contributions to the Pension Fund and the Used Fuel and Decommissioning Funds; to service and repay long-term debt; and to meet revenue limit rebate obligations. Changes in cash and cash equivalents for the three months ended March 31, 2009, and 2008 are as follows: Three Months Ended
March 31 (millions of dollars) 2009 2008 Cash and cash equivalents, beginning of period 315 110 Cash flow provided by operating activities 41 245 Cash flow (used in) investing activities (122) (124) Cash flow (used in) provided by financing activities (37) 72 Net (decrease) increase (118) 193 Cash and cash equivalents, end of period 197 303 Operating Activities Cash flow provided by operating activities for the three months ended March 31, 2009 was $41 million compared to $245 million for the three months ended March 31, 2008. The decrease in cash flow was primarily due to an increase in tax instalment payments and higher OM&A expenditures. Investing Activities Investments in fixed and intangible assets during the quarter ended March 31, 2009 were $121 million compared with $128 million for same quarter in 2008. The decrease in capital expenditures was primarily due to lower spending for the Portlands Energy Centre during the first quarter in 2009 compared to the same quarter in 2008, as the project was declared in-service in April 2009. OPG's forecasted capital expenditures for 2009 are approximately $1.1 billion, which includes amounts for the Niagara Tunnel project, the Upper Mattagami hydroelectric development, and other nuclear and hydroelectric development projects. Investment in Asset-Backed Commercial Paper In January 2009, the Pan-Canadian Investors Committee for third-party ABCP announced that the restructuring Plan (the "Plan") affecting $32 billion of third-party ABCP had been fully implemented. Pursuant to the terms of the Plan, OPG's short-term commercial paper has been exchanged for longer term notes of approximately $58 million. OPG received five classes of notes, which are supported by margin funding facilities from third-party asset providers, Canadian banks, and governments.
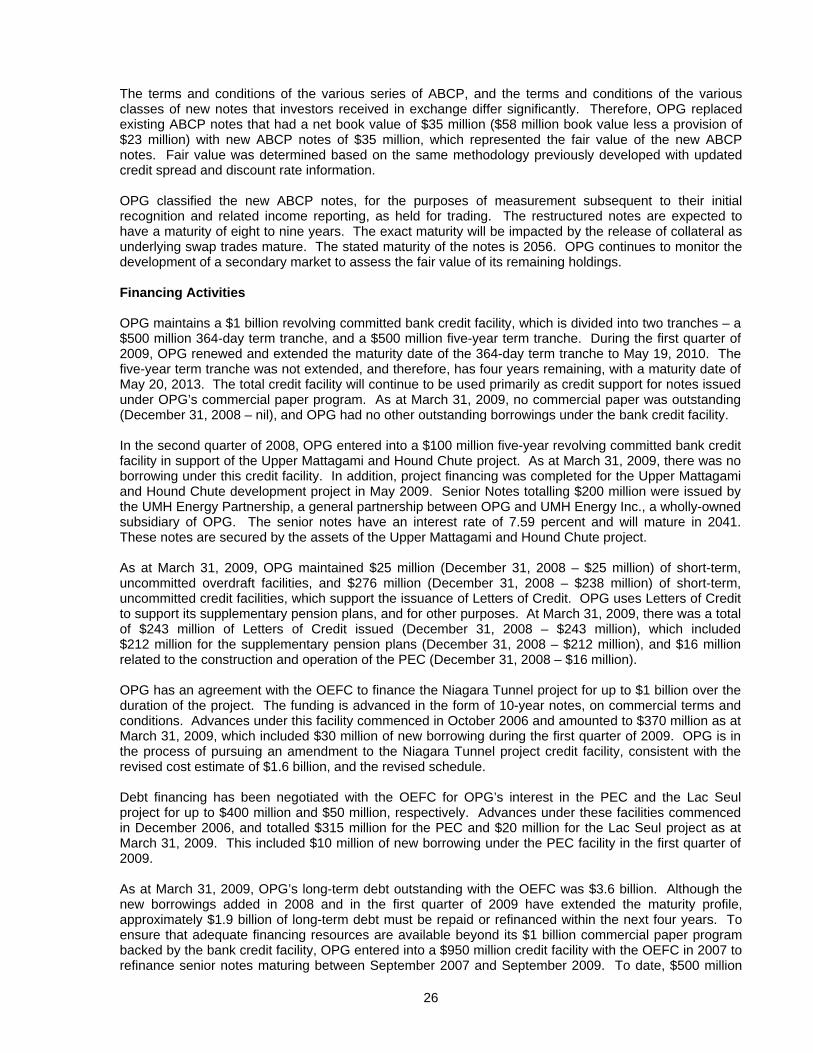
26
The terms and conditions of the various series of ABCP, and the terms and conditions of the various classes of new notes that investors received in exchange differ significantly. Therefore, OPG replaced existing ABCP notes that had a net book value of $35 million ($58 million book value less a provision of $23 million) with new ABCP notes of $35 million, which represented the fair value of the new ABCP notes. Fair value was determined based on the same methodology previously developed with updated credit spread and discount rate information. OPG classified the new ABCP notes, for the purposes of measurement subsequent to their initial recognition and related income reporting, as held for trading. The restructured notes are expected to have a maturity of eight to nine years. The exact maturity will be impacted by the release of collateral as underlying swap trades mature. The stated maturity of the notes is 2056. OPG continues to monitor the development of a secondary market to assess the fair value of its remaining holdings. Financing Activities OPG maintains a $1 billion revolving committed bank credit facility, which is divided into two tranches – a $500 million 364-day term tranche, and a $500 million five-year term tranche. During the first quarter of 2009, OPG renewed and extended the maturity date of the 364-day term tranche to May 19, 2010. The five-year term tranche was not extended, and therefore, has four years remaining, with a maturity date of May 20, 2013. The total credit facility will continue to be used primarily as credit support for notes issued under OPG’s commercial paper program. As at March 31, 2009, no commercial paper was outstanding (December 31, 2008 – nil), and OPG had no other outstanding borrowings under the bank credit facility. In the second quarter of 2008, OPG entered into a $100 million five-year revolving committed bank credit facility in support of the Upper Mattagami and Hound Chute project. As at March 31, 2009, there was no borrowing under this credit facility. In addition, project financing was completed for the Upper Mattagami and Hound Chute development project in May 2009. Senior Notes totalling $200 million were issued by the UMH Energy Partnership, a general partnership between OPG and UMH Energy Inc., a wholly-owned subsidiary of OPG. The senior notes have an interest rate of 7.59 percent and will mature in 2041. These notes are secured by the assets of the Upper Mattagami and Hound Chute project. As at March 31, 2009, OPG maintained $25 million (December 31, 2008 – $25 million) of short-term, uncommitted overdraft facilities, and $276 million (December 31, 2008 – $238 million) of short-term, uncommitted credit facilities, which support the issuance of Letters of Credit. OPG uses Letters of Credit to support its supplementary pension plans, and for other purposes. At March 31, 2009, there was a total of $243 million of Letters of Credit issued (December 31, 2008 – $243 million), which included $212 million for the supplementary pension plans (December 31, 2008 – $212 million), and $16 million related to the construction and operation of the PEC (December 31, 2008 – $16 million). OPG has an agreement with the OEFC to finance the Niagara Tunnel project for up to $1 billion over the duration of the project. The funding is advanced in the form of 10-year notes, on commercial terms and conditions. Advances under this facility commenced in October 2006 and amounted to $370 million as at March 31, 2009, which included $30 million of new borrowing during the first quarter of 2009. OPG is in the process of pursuing an amendment to the Niagara Tunnel project credit facility, consistent with the revised cost estimate of $1.6 billion, and the revised schedule. Debt financing has been negotiated with the OEFC for OPG’s interest in the PEC and the Lac Seul project for up to $400 million and $50 million, respectively. Advances under these facilities commenced in December 2006, and totalled $315 million for the PEC and $20 million for the Lac Seul project as at March 31, 2009. This included $10 million of new borrowing under the PEC facility in the first quarter of 2009. As at March 31, 2009, OPG’s long-term debt outstanding with the OEFC was $3.6 billion. Although the new borrowings added in 2008 and in the first quarter of 2009 have extended the maturity profile, approximately $1.9 billion of long-term debt must be repaid or refinanced within the next four years. To ensure that adequate financing resources are available beyond its $1 billion commercial paper program backed by the bank credit facility, OPG entered into a $950 million credit facility with the OEFC in 2007 to refinance senior notes maturing between September 2007 and September 2009. To date, $500 million
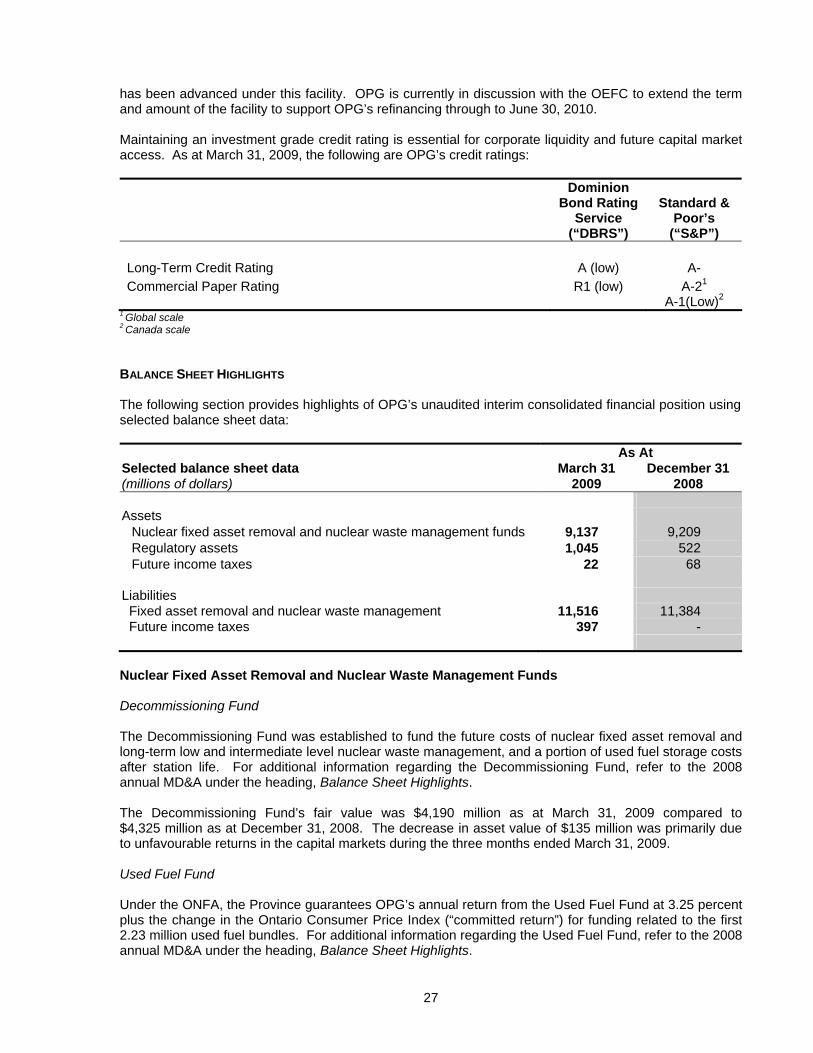
27
has been advanced under this facility. OPG is currently in discussion with the OEFC to extend the term and amount of the facility to support OPG’s refinancing through to June 30, 2010. Maintaining an investment grade credit rating is essential for corporate liquidity and future capital market access. As at March 31, 2009, the following are OPG’s credit ratings: Dominion
Bond Rating Service
(“DBRS”)
Standard &
Poor’s (“S&P”)
Long-Term Credit Rating A (low) A- Commercial Paper Rating R1 (low) A-21
A-1(Low)2 1 Global scale 2 Canada scale BALANCE SHEET HIGHLIGHTS The following section provides highlights of OPG’s unaudited interim consolidated financial position using selected balance sheet data: As At Selected balance sheet data March 31 December 31 (millions of dollars) 2009 2008 Assets
Nuclear fixed asset removal and nuclear waste management funds 9,137 9,209 Regulatory assets 1,045 522 Future income taxes 22 68
Liabilities Fixed asset removal and nuclear waste management 11,516 11,384 Future income taxes 397 - Nuclear Fixed Asset Removal and Nuclear Waste Management Funds Decommissioning Fund The Decommissioning Fund was established to fund the future costs of nuclear fixed asset removal and long-term low and intermediate level nuclear waste management, and a portion of used fuel storage costs after station life. For additional information regarding the Decommissioning Fund, refer to the 2008 annual MD&A under the heading, Balance Sheet Highlights. The Decommissioning Fund’s fair value was $4,190 million as at March 31, 2009 compared to $4,325 million as at December 31, 2008. The decrease in asset value of $135 million was primarily due to unfavourable returns in the capital markets during the three months ended March 31, 2009. Used Fuel Fund Under the ONFA, the Province guarantees OPG’s annual return from the Used Fuel Fund at 3.25 percent plus the change in the Ontario Consumer Price Index (“committed return”) for funding related to the first 2.23 million used fuel bundles. For additional information regarding the Used Fuel Fund, refer to the 2008 annual MD&A under the heading, Balance Sheet Highlights.
28
The Used Fuel Fund’s fair value was $4,947 million as at March 31, 2009 compared to $4,884 million as at December 31, 2008. The increase in asset value in the Used Fuel Fund of $63 million was due to the committed return and new contributions to the fund. The asset values as at March 31, 2009 and December 31, 2008, included a receivable from the Province of $579 million and $460 million, respectively. As required by the terms of the ONFA, the Province provides a Provincial Guarantee to the Canadian Nuclear Safety Commission (“CNSC”) on behalf of OPG. The Nuclear Safety and Control Act (Canada) requires OPG to have sufficient funds available to discharge the current nuclear decommissioning and waste management liabilities. The Provincial Guarantee provides for any shortfall between the long term liabilities and the current market value of the Used Fuel Fund and the Decommissioning Fund. As of March 31, 2009, the value of this guarantee was $760 million. It is expected that that the CNSC will require the guarantee to be increased to approximately $1.5 billion as a result of the market value losses experienced in the latter half of 2008. Regulatory Assets As at March 31, 2009, regulatory assets were $1,045 million compared to $522 million as at December 31, 2008. The increase in regulatory assets was primarily due to the recognition of regulatory assets as a result of adopting the liability method of accounting for income taxes for the rate regulated operations, effective January 1, 2009, as discussed under the heading, Income Taxes. OPG also recorded an additional regulatory asset of $107 million in the Bruce revenues and costs variance account during the first quarter of 2009. The increase in the balance of this variance account was primarily due to losses from the Nuclear Funds incurred during the first quarter of 2009 related to the Bruce generating stations. The increase in regulatory assets was partly offset by amortization expense of $21 million, primarily resulting from the recovery of regulatory assets through current regulated prices. Fixed Asset Removal and Nuclear Waste Management The liability for fixed asset removal of nuclear and fossil-fuelled generating stations and nuclear waste management as at March 31, 2009 was $11,516 million compared to $11,384 million as at December 31, 2008. The increase was primarily due to accretion of $159 million due to the passage of time, partially offset by expenditures of $38 million on nuclear waste management activities. Future Income Taxes As at March 31, 2009, net future income tax liabilities were $375 million compared to net future income tax assets of $68 million as at December 31, 2008. The increase in future income tax liabilities was primarily due to the recognition of future income tax liabilities of $430 million as a result of adopting an amendment to Section 3465, Income Taxes, of the CICA Handbook. The impact of adopting the amended handbook section is described under the heading, Income Taxes, in the Discussion of Operating Results by Business Segment section. Off-Balance Sheet Arrangements In the normal course of operations, OPG engages in a variety of transactions that, under Canadian GAAP, are either not recorded in the Company’s consolidated financial statements or are recorded in the Company’s consolidated financial statements using amounts that differ from the full contract amounts. Principal off-balance sheet activities that OPG undertakes include securitization of certain accounts receivable agreements, guarantees, which provide financial or performance assurance to third parties on behalf of certain subsidiaries, and long-term fixed price contracts.
29
Guarantees As part of normal business, OPG and certain of its subsidiaries and joint ventures enter into various agreements providing financial or performance assurance to third parties on behalf of certain subsidiaries and joint ventures. Such agreements include guarantees, stand-by Letters of Credit and surety bonds. CHANGES IN ACCOUNTING POLICIES AND ESTIMATES OPG’s significant accounting policies, including the impact of future accounting pronouncements, are outlined in Note 3 to the audited annual consolidated financial statements as at and for the year ended December 31, 2008. Certain of these policies are recognized as critical accounting policies by virtue of the subjective and complex judgments and estimates required around matters that are inherently uncertain, and could result in materially different amounts being reported under different conditions or assumptions. Accounting for Regulated Operations As a result of prospectively adopting changes to Section 3465, Income Taxes, on January 1, 2009, OPG recognized a future income tax liability of $466 million relating to its rate regulated operations for future income taxes expected to be recovered through future regulated prices, and also recognized a corresponding regulatory asset. The future income tax liability of $466 million includes future income taxes of $126 million resulting from the additional regulatory asset for future income taxes recognized as a result of the amendments to Section 3465. For the three months ended March 31, 2009, OPG recorded a reduction to the future income tax liability of $36 million, of which $10 million related to the reduction to the regulatory asset for future income taxes. The regulatory asset was also reduced by $36 million during the three months ended March 31, 2009. Intangible Assets In February 2008, the CICA adopted Handbook Section 3064, Goodwill and Intangible Assets, which replaces CICA Handbook Section 3062, Goodwill and Other Intangible Assets. The new guidance establishes standards for the recognition, measurement, presentation and disclosure of goodwill and intangible assets. This section applies to annual and interim financial statements relating to fiscal years beginning on or after October 1, 2008. OPG adopted the Handbook section effective January 1, 2009. The adoption of this standard did not have a significant impact on the Company’s financial position or results of operations. As at March 31, 2009 and December 31, 2008, OPG reported intangible assets of $56 million and $57 million, respectively. Conversion to International Financial Reporting Standards At the end of the first quarter of 2009, OPG’s project to convert to International Financial Reporting Standards (“IFRS”) continued on schedule. During the first quarter of 2009, OPG progressed on many areas including determining how best to have 2010 comparative IFRS information available for the 2011 reporting periods, and identifying the financial statement structure and disclosure requirements under IFRS. For the remainder of 2009, OPG will continue to consider the options available under IFRS 1, develop its significant accounting policies under IFRS, and finalize the determination of the systems, process and internal control impacts of converting to IFRS. A training plan has been developed and will be executed throughout 2009 and 2010 to ensure that OPG is well positioned to embed IFRS requirements within its underlying systems, processes and internal controls. As a number of the IFRS standards are changing, OPG will continue to assess the impact on its opening balance sheet on transition date and the ongoing financial statements and disclosures as additional information becomes available.
30
RISK MANAGEMENT A detailed discussion of OPG’s governance structure and inherent risks is included in the 2008 annual MD&A under the heading, Risk Management. The following discussion updates the annual disclosure. Risk Governance Structure Given the numerous major development projects OPG is undertaking, OPG issued a revised project risk management procedure in the first quarter of 2009 designed to facilitate a consistent approach to risk management within major projects. The approach for projects greater than $25 million mandates risk identification, mitigation, remediation and monitoring activities. Risk Management Activities The following discussion provides an update of OPG’s risk management activities that were disclosed in the 2008 annual MD&A under the heading Risk Management Activities. Enterprise-Wide Perspective The Company has designed a comprehensive framework that identifies and evaluates threats or risks on the basis of their potential impact on the Company’s capacity to achieve specific business plan objectives. The framework provides both senior management and the Board of Directors with detailed descriptions of various activities designed to mitigate the threats to the extent possible. For the purpose of this report, a number of key risks are presented in four main categories namely, operational, financial, regulatory and environmental. For each category, a number of key threats or risks are briefly described. Operational Risks Fossil-Fuelled Generating Stations The IESO has indicated that the need for a reliability must run contract with the Lennox generating station ceases after the current contract period ends September 30, 2009. The OPA will not be in a position to sign a new contract until its Integrated Power System Plan is approved by the OEB. OPG is seeking a Directive from the shareholder guiding the OPA to contract with OPG for the Lennox generating capacity for the period beyond October 1, 2009. Major Development Projects OPG is undertaking numerous projects designed to enhance and expand its electricity generating portfolio. The risks associated with these projects could adversely impact the Company’s financial performance. Major projects include new nuclear units at OPG’s Darlington site, potential refurbishment of existing nuclear generating stations, the Niagara Tunnel project, and other hydroelectric and fossil-fuelled projects. New Nuclear Units A decision by IO on the nuclear reactor vendor for the Province of Ontario is expected in the late spring of 2009. The choice of a nuclear reactor vendor will allow OPG to further identify risks associated with the project. Niagara Tunnel Project As of March 31, 2009, the tunnel boring machine has progressed much slower than expected compared to the original contractor schedule. Following the dispute review board recommendations, OPG and the contractor are negotiating a revised design build contract with a target schedule and target cost for the
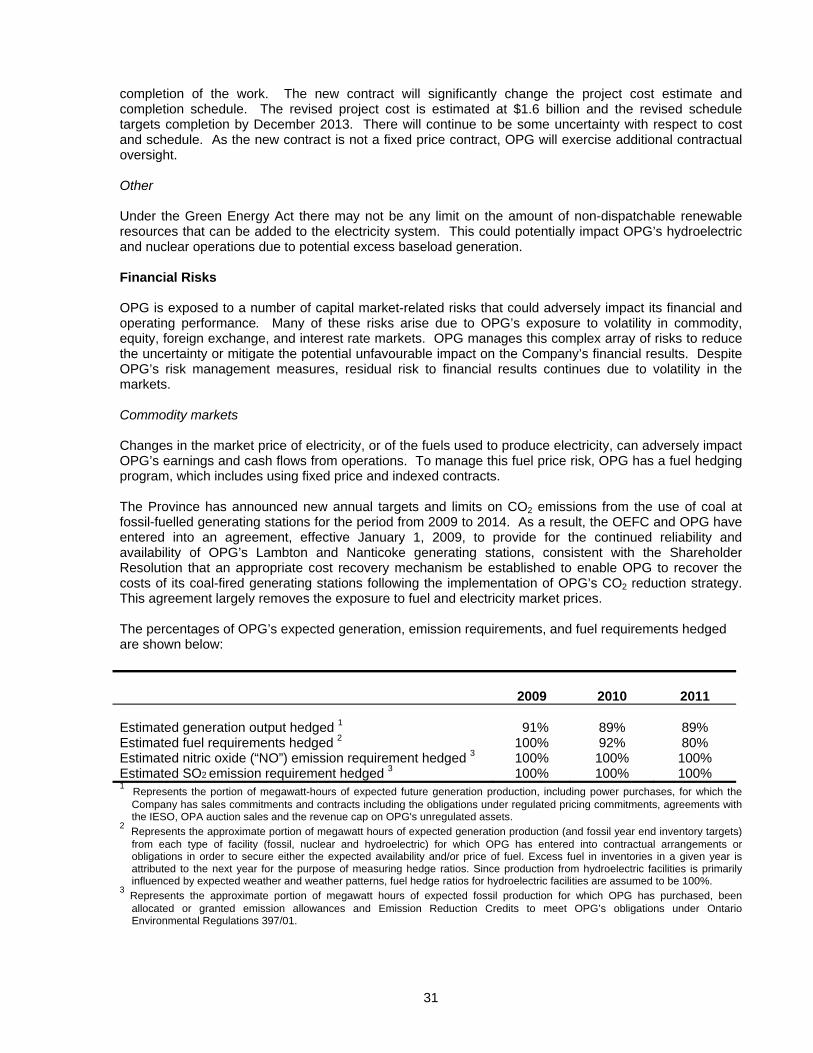
31
completion of the work. The new contract will significantly change the project cost estimate and completion schedule. The revised project cost is estimated at $1.6 billion and the revised schedule targets completion by December 2013. There will continue to be some uncertainty with respect to cost and schedule. As the new contract is not a fixed price contract, OPG will exercise additional contractual oversight. Other Under the Green Energy Act there may not be any limit on the amount of non-dispatchable renewable resources that can be added to the electricity system. This could potentially impact OPG’s hydroelectric and nuclear operations due to potential excess baseload generation. Financial Risks OPG is exposed to a number of capital market-related risks that could adversely impact its financial and operating performance. Many of these risks arise due to OPG’s exposure to volatility in commodity, equity, foreign exchange, and interest rate markets. OPG manages this complex array of risks to reduce the uncertainty or mitigate the potential unfavourable impact on the Company’s financial results. Despite OPG’s risk management measures, residual risk to financial results continues due to volatility in the markets. Commodity markets Changes in the market price of electricity, or of the fuels used to produce electricity, can adversely impact OPG’s earnings and cash flows from operations. To manage this fuel price risk, OPG has a fuel hedging program, which includes using fixed price and indexed contracts. The Province has announced new annual targets and limits on CO2 emissions from the use of coal at fossil-fuelled generating stations for the period from 2009 to 2014. As a result, the OEFC and OPG have entered into an agreement, effective January 1, 2009, to provide for the continued reliability and availability of OPG’s Lambton and Nanticoke generating stations, consistent with the Shareholder Resolution that an appropriate cost recovery mechanism be established to enable OPG to recover the costs of its coal-fired generating stations following the implementation of OPG’s CO2 reduction strategy. This agreement largely removes the exposure to fuel and electricity market prices. The percentages of OPG’s expected generation, emission requirements, and fuel requirements hedged are shown below:
2009 2010 2011
Estimated generation output hedged 1
Estimated fuel requirements hedged 2
Estimated nitric oxide (“NO”) emission requirement hedged 3
Estimated SO2 emission requirement hedged 3
91% 100% 100% 100%
89% 92%
100% 100%
89% 80%
100% 100%
1 Represents the portion of megawatt-hours of expected future generation production, including power purchases, for which the Company has sales commitments and contracts including the obligations under regulated pricing commitments, agreements with the IESO, OPA auction sales and the revenue cap on OPG's unregulated assets.
2 Represents the approximate portion of megawatt hours of expected generation production (and fossil year end inventory targets) from each type of facility (fossil, nuclear and hydroelectric) for which OPG has entered into contractual arrangements or obligations in order to secure either the expected availability and/or price of fuel. Excess fuel in inventories in a given year is attributed to the next year for the purpose of measuring hedge ratios. Since production from hydroelectric facilities is primarily influenced by expected weather and weather patterns, fuel hedge ratios for hydroelectric facilities are assumed to be 100%.
3 Represents the approximate portion of megawatt hours of expected fossil production for which OPG has purchased, been allocated or granted emission allowances and Emission Reduction Credits to meet OPG’s obligations under Ontario Environmental Regulations 397/01.
32
Foreign exchange and interest rate markets In order to manage foreign exchange risk OPG employs various financial instruments such as forwards and various forms of derivative contracts in accordance with approved risk management policies. As of March 31, 2009, OPG had total foreign exchange swap contracts outstanding with a notional principal of $62 million, with settlement between March 2009 and August 2009. OPG periodically uses interest rate swap agreements to mitigate elements of interest rate risk exposure associated with anticipated new financing. As of March 31, 2009, OPG had total forward start interest rate swap contracts outstanding with a notional principal of $235 million and a maturity schedule of ten to eleven years. Trading OPG’s trading operations are closely monitored, and total exposures are measured and reported to senior management on a daily basis. The metric used to measure the risk of this trading activity is known as “value at risk” or “VaR”, which is defined as the potential future loss, expressed in monetary terms, for a portfolio based on normal market conditions for a set period of time. The VaR limit for trading is $5 million, and VaR utilization ranged between $0.49 million and $2.46 million during the three months ended March 31, 2009, compared to $1.95 million and $3.72 million during the three months ended December 31, 2008. Credit OPG manages its exposure to various suppliers or “counterparties” by evaluating the financial condition of all counterparties and ensuring that appropriate collateral or other forms of security are held by OPG. OPG’s credit exposure as at March 31, 2009 was $535 million, including $415 million to the IESO. Over 85 percent of the remaining $120 million exposure was to investment grade counterparties. Regulatory Risks OPG is subject to regulation by entities including the OEB and the CNSC. The risks that arise from being a regulated entity include the inability to recover costs, reductions in revenue, increases in the cost of operations, and unexpected outages. These unfavourable impacts are mitigated by maintaining close contact with the regulators, and issuers of standards and codes, to ensure early identification and discussion of issues. Rate Regulation The prices for electricity generated from most of OPG’s baseload hydroelectric facilities and all of the nuclear facilities that it operates are determined by the OEB, based on a forecast cost of service methodology, and will remain in effect until the effective date of the OEB’s next order. As with any regulated price established using a forecast cost of service methodology, there is an inherent risk that the prices established by the regulator may not provide for recovery of all actual costs incurred by the regulated operations, or may result in the regulated operations not earning its allowed rate of return. Environmental Risks Changes to environmental laws, or delays in implementing the current timetable of the Province’s coal-fired generating station closure policy, could create compliance risks that may be addressed by the installation of additional equipment or control technologies, the purchase of additional emission reduction credits, or by constraining production from the fossil-fuelled generating stations. In addition, a failure to comply with applicable environmental laws may result in enforcement actions, including the potential for orders or charges. Further, some of OPG’s activities have the potential to cause contamination to land or water that may require remediation. The potential liability associated with any of these events could have a material adverse effect on the business.
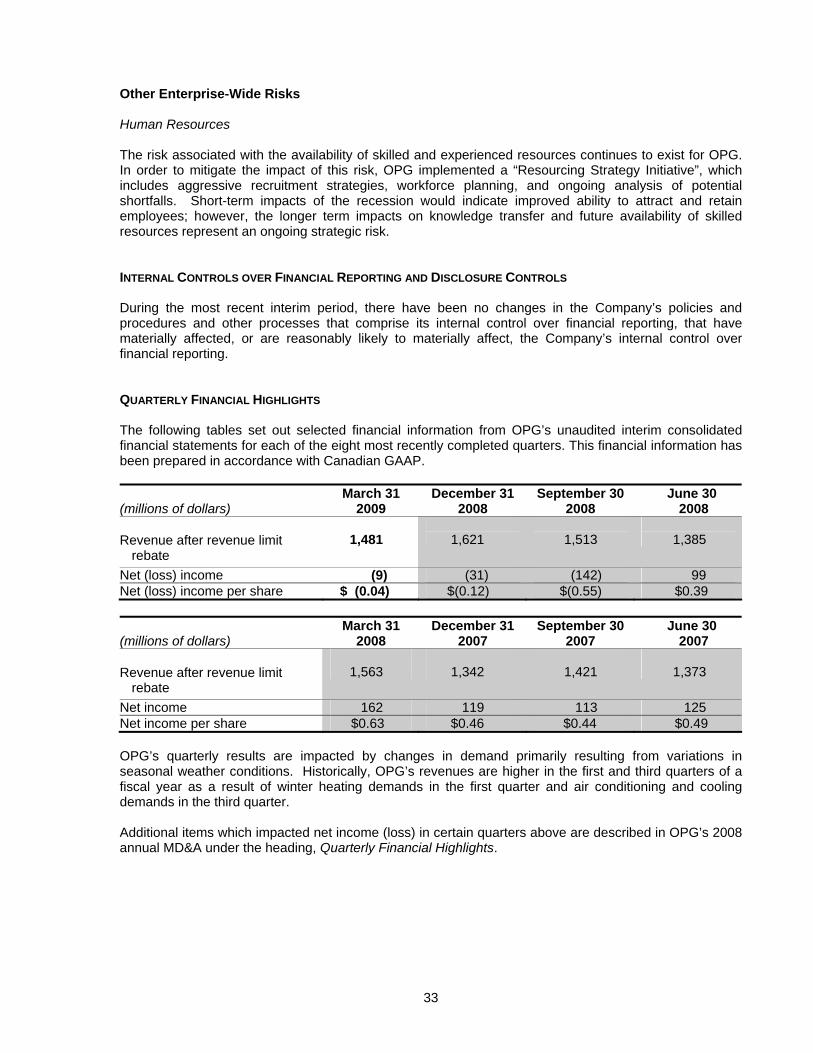
33
Other Enterprise-Wide Risks Human Resources The risk associated with the availability of skilled and experienced resources continues to exist for OPG. In order to mitigate the impact of this risk, OPG implemented a “Resourcing Strategy Initiative”, which includes aggressive recruitment strategies, workforce planning, and ongoing analysis of potential shortfalls. Short-term impacts of the recession would indicate improved ability to attract and retain employees; however, the longer term impacts on knowledge transfer and future availability of skilled resources represent an ongoing strategic risk. INTERNAL CONTROLS OVER FINANCIAL REPORTING AND DISCLOSURE CONTROLS During the most recent interim period, there have been no changes in the Company’s policies and procedures and other processes that comprise its internal control over financial reporting, that have materially affected, or are reasonably likely to materially affect, the Company’s internal control over financial reporting. QUARTERLY FINANCIAL HIGHLIGHTS The following tables set out selected financial information from OPG’s unaudited interim consolidated financial statements for each of the eight most recently completed quarters. This financial information has been prepared in accordance with Canadian GAAP. (millions of dollars)
March 31 2009
December 31 2008
September 30 2008
June 30 2008
Revenue after revenue limit rebate
1,481
1,621
1,513
1,385
Net (loss) income (9) (31) (142) 99 Net (loss) income per share $ (0.04) $(0.12) $(0.55) $0.39 (millions of dollars)
March 31 2008
December 31 2007
September 30 2007
June 30 2007
Revenue after revenue limit rebate
1,563
1,342
1,421
1,373
Net income 162 119 113 125 Net income per share $0.63 $0.46 $0.44 $0.49 OPG’s quarterly results are impacted by changes in demand primarily resulting from variations in seasonal weather conditions. Historically, OPG’s revenues are higher in the first and third quarters of a fiscal year as a result of winter heating demands in the first quarter and air conditioning and cooling demands in the third quarter. Additional items which impacted net income (loss) in certain quarters above are described in OPG’s 2008 annual MD&A under the heading, Quarterly Financial Highlights.
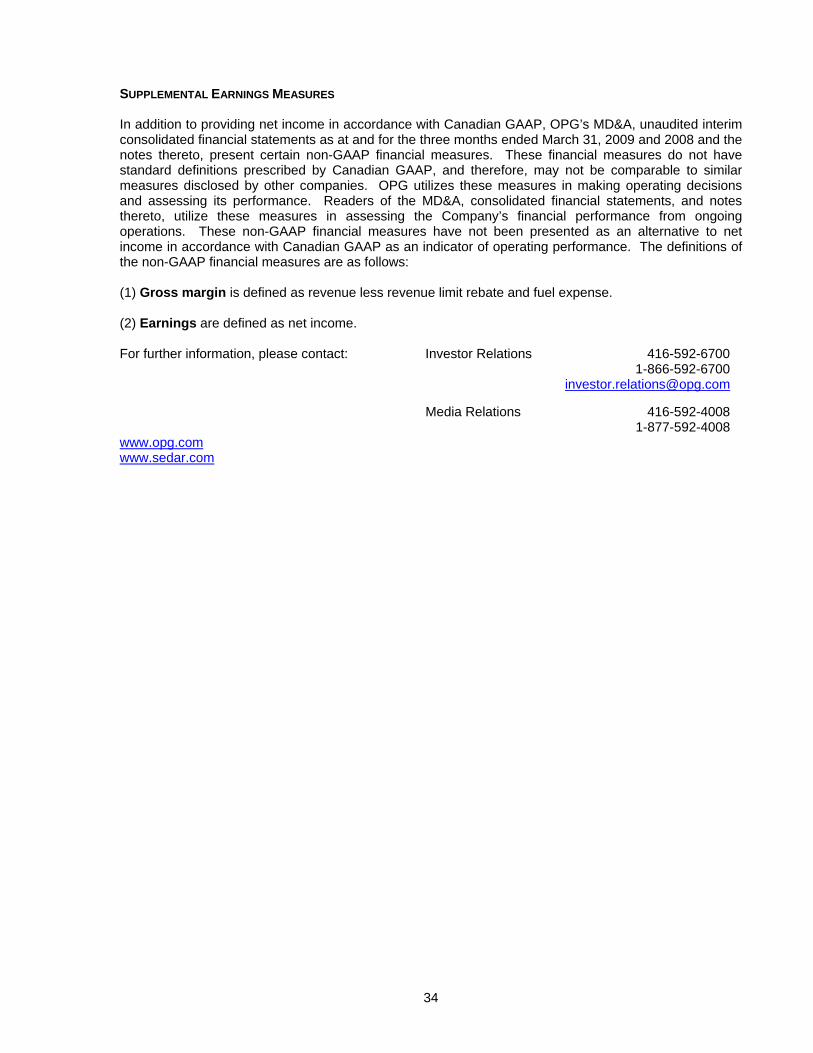
34
SUPPLEMENTAL EARNINGS MEASURES In addition to providing net income in accordance with Canadian GAAP, OPG’s MD&A, unaudited interim consolidated financial statements as at and for the three months ended March 31, 2009 and 2008 and the notes thereto, present certain non-GAAP financial measures. These financial measures do not have standard definitions prescribed by Canadian GAAP, and therefore, may not be comparable to similar measures disclosed by other companies. OPG utilizes these measures in making operating decisions and assessing its performance. Readers of the MD&A, consolidated financial statements, and notes thereto, utilize these measures in assessing the Company’s financial performance from ongoing operations. These non-GAAP financial measures have not been presented as an alternative to net income in accordance with Canadian GAAP as an indicator of operating performance. The definitions of the non-GAAP financial measures are as follows: (1) Gross margin is defined as revenue less revenue limit rebate and fuel expense. (2) Earnings are defined as net income. For further information, please contact: Investor Relations 416-592-6700 1-866-592-6700 [email protected] Media Relations 416-592-4008 1-877-592-4008 www.opg.com www.sedar.com
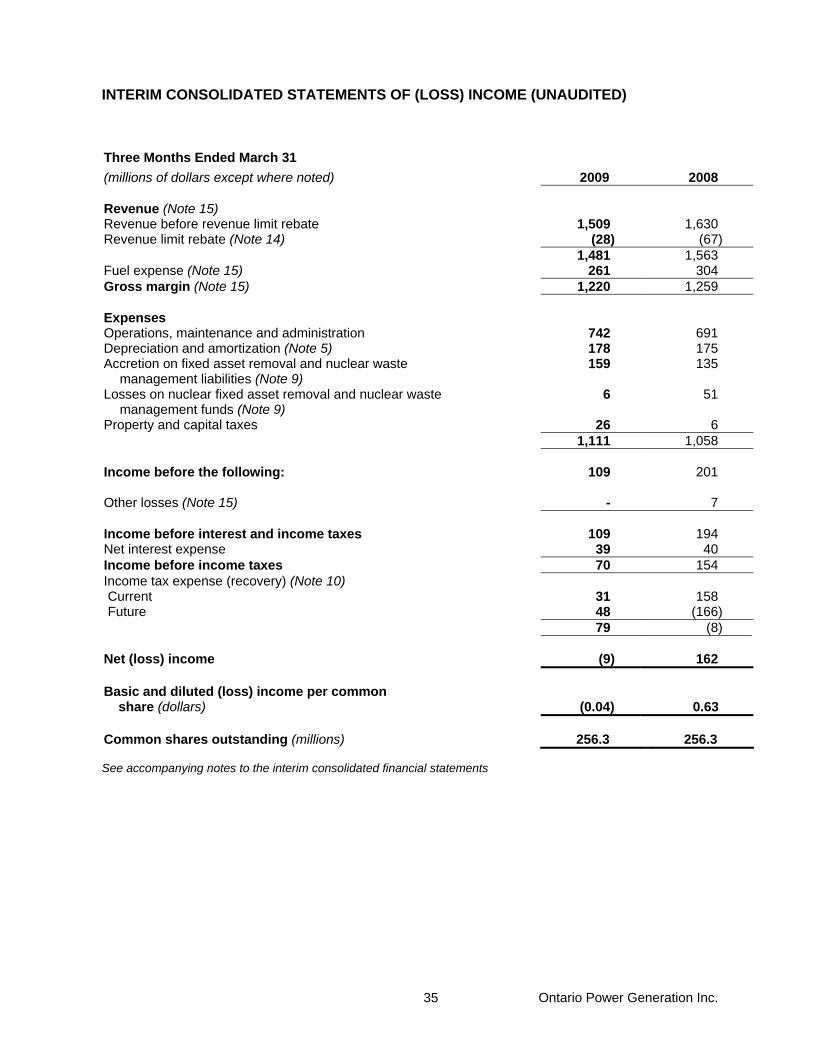
Ontario Power Generation Inc. 35
INTERIM CONSOLIDATED STATEMENTS OF (LOSS) INCOME (UNAUDITED)
Three Months Ended March 31 (millions of dollars except where noted) 2009 2008 Revenue (Note 15) Revenue before revenue limit rebate 1,509 1,630 Revenue limit rebate (Note 14) (28) (67) 1,481 1,563 Fuel expense (Note 15) 261 304 Gross margin (Note 15) 1,220 1,259 Expenses Operations, maintenance and administration 742 691 Depreciation and amortization (Note 5) 178 175 Accretion on fixed asset removal and nuclear waste
management liabilities (Note 9) 159 135
Losses on nuclear fixed asset removal and nuclear waste management funds (Note 9)
6 51
Property and capital taxes 26 6 1,111 1,058 Income before the following: 109 201 Other losses (Note 15) - 7 Income before interest and income taxes 109 194 Net interest expense 39 40 Income before income taxes 70 154 Income tax expense (recovery) (Note 10)
31 158 Current Future 48 (166)
79 (8) Net (loss) income (9) 162 Basic and diluted (loss) income per common share (dollars)
(0.04)
0.63
Common shares outstanding (millions) 256.3 256.3
See accompanying notes to the interim consolidated financial statements
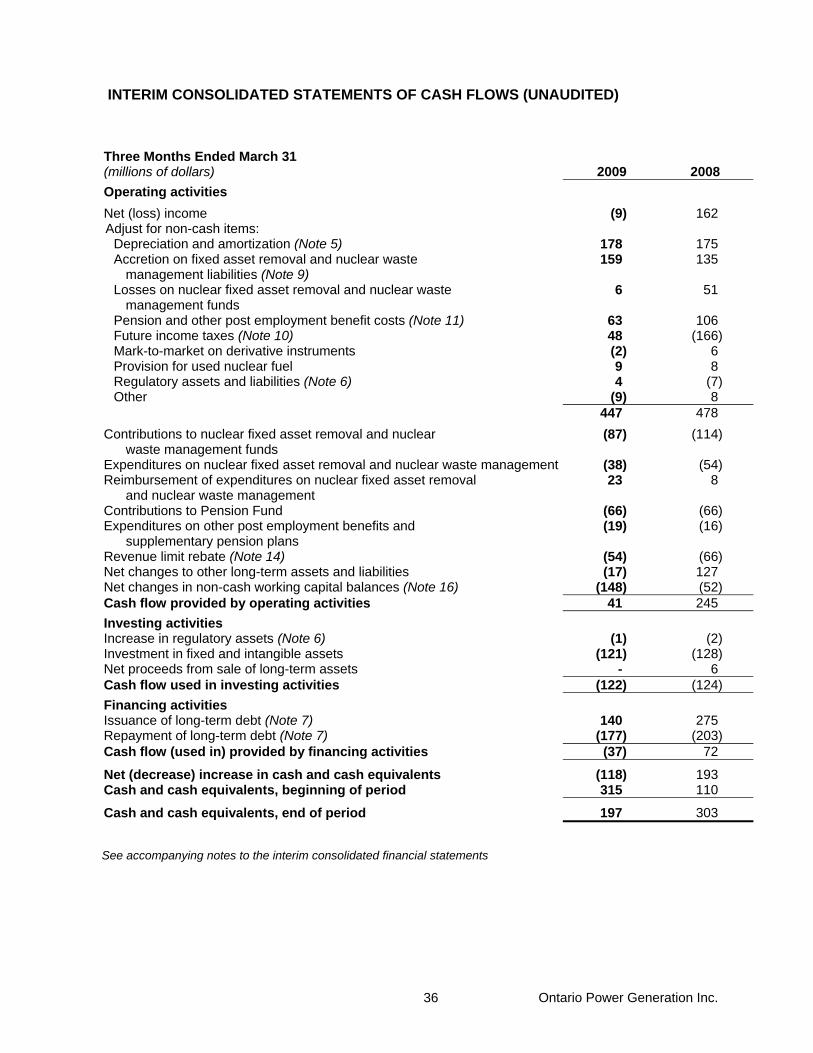
Ontario Power Generation Inc. 36
INTERIM CONSOLIDATED STATEMENTS OF CASH FLOWS (UNAUDITED) Three Months Ended March 31 (millions of dollars) 2009 2008 Operating activities Net (loss) income (9) 162 Adjust for non-cash items:
Depreciation and amortization (Note 5) 178 175 Accretion on fixed asset removal and nuclear waste
management liabilities (Note 9) 159 135
Losses on nuclear fixed asset removal and nuclear waste management funds
6 51
Pension and other post employment benefit costs (Note 11) 63 106 Future income taxes (Note 10) 48 (166) Mark-to-market on derivative instruments (2) 6 Provision for used nuclear fuel 9 8 Regulatory assets and liabilities (Note 6) 4 (7) Other (9) 8
447 478Contributions to nuclear fixed asset removal and nuclear
waste management funds (87) (114)
Expenditures on nuclear fixed asset removal and nuclear waste management (38) (54) Reimbursement of expenditures on nuclear fixed asset removal
and nuclear waste management 23 8
Contributions to Pension Fund (66) (66) Expenditures on other post employment benefits and
supplementary pension plans (19) (16)
Revenue limit rebate (Note 14) (54) (66) Net changes to other long-term assets and liabilities (17) 127 Net changes in non-cash working capital balances (Note 16) (148) (52) Cash flow provided by operating activities 41 245 Investing activities Increase in regulatory assets (Note 6) (1) (2) Investment in fixed and intangible assets (121) (128) Net proceeds from sale of long-term assets - 6 Cash flow used in investing activities (122) (124) Financing activities Issuance of long-term debt (Note 7) 140 275 Repayment of long-term debt (Note 7) (177) (203) Cash flow (used in) provided by financing activities (37) 72
Net (decrease) increase in cash and cash equivalents (118) 193 Cash and cash equivalents, beginning of period 315 110
Cash and cash equivalents, end of period 197 303
See accompanying notes to the interim consolidated financial statements
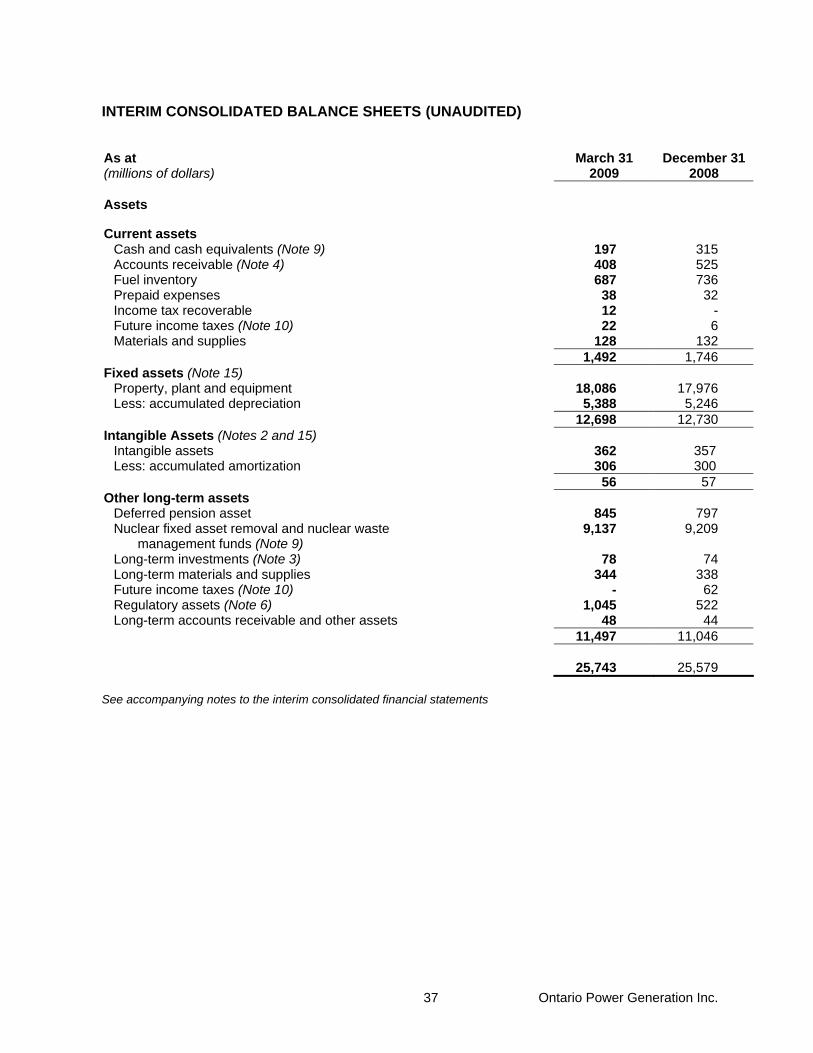
Ontario Power Generation Inc. 37
INTERIM CONSOLIDATED BALANCE SHEETS (UNAUDITED) As at March 31 December 31 (millions of dollars) 2009 2008
Assets
Current assets Cash and cash equivalents (Note 9) 197 315 Accounts receivable (Note 4) 408 525 Fuel inventory 687 736 Prepaid expenses 38 32 Income tax recoverable 12 - Future income taxes (Note 10) 22 6 Materials and supplies 128 132
1,492 1,746 Fixed assets (Note 15)
Property, plant and equipment 18,086 17,976 Less: accumulated depreciation 5,388 5,246
12,698 12,730 Intangible Assets (Notes 2 and 15)
Intangible assets 362 357 Less: accumulated amortization 306 300
56 57 Other long-term assets
Deferred pension asset 845 797 Nuclear fixed asset removal and nuclear waste
management funds (Note 9) 9,137 9,209
Long-term investments (Note 3) 78 74 Long-term materials and supplies 344 338 Future income taxes (Note 10) - 62 Regulatory assets (Note 6) 1,045 522 Long-term accounts receivable and other assets 48 44
11,497 11,046 25,743 25,579
See accompanying notes to the interim consolidated financial statements
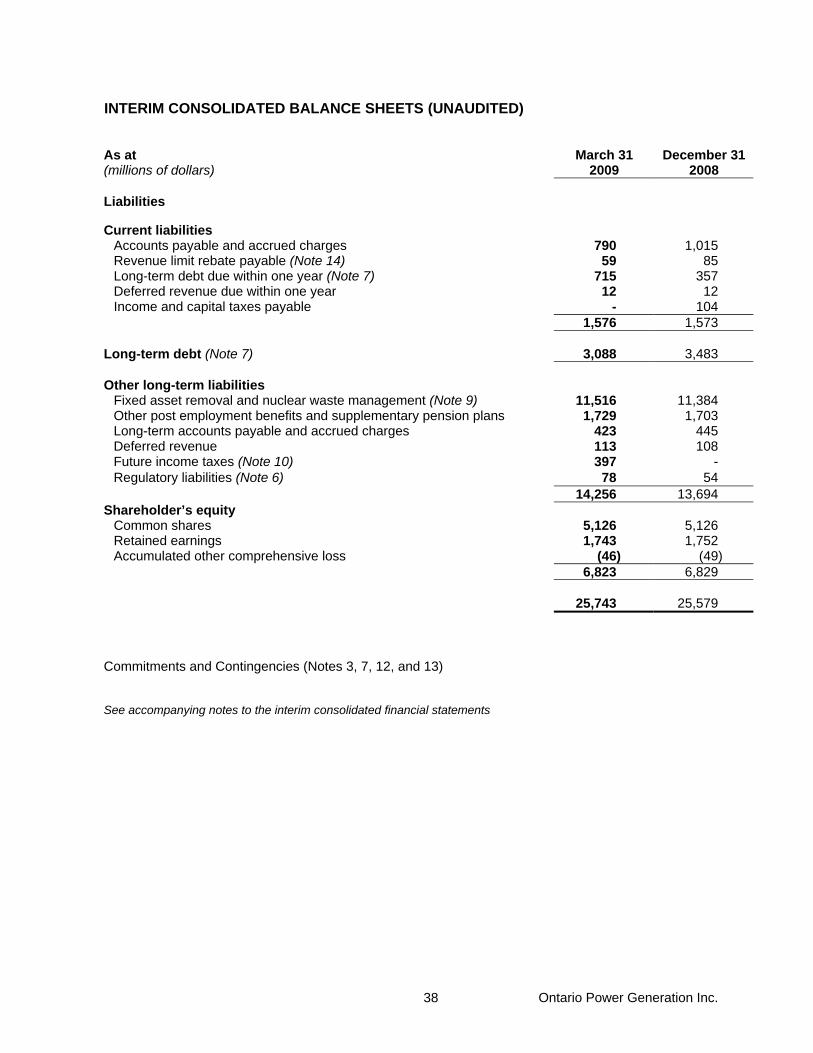
Ontario Power Generation Inc. 38
INTERIM CONSOLIDATED BALANCE SHEETS (UNAUDITED)
As at March 31 December 31 (millions of dollars) 2009 2008
Liabilities
Current liabilities Accounts payable and accrued charges 790 1,015 Revenue limit rebate payable (Note 14) 59 85 Long-term debt due within one year (Note 7) 715 357 Deferred revenue due within one year 12 12 Income and capital taxes payable - 104
1,576 1,573
Long-term debt (Note 7) 3,088 3,483
Other long-term liabilities Fixed asset removal and nuclear waste management (Note 9) 11,516 11,384 Other post employment benefits and supplementary pension plans 1,729 1,703 Long-term accounts payable and accrued charges 423 445 Deferred revenue 113 108 Future income taxes (Note 10) 397 - Regulatory liabilities (Note 6) 78 54
14,256 13,694 Shareholder’s equity
Common shares 5,126 5,126 Retained earnings 1,743 1,752 Accumulated other comprehensive loss (46) (49)
6,823 6,829 25,743 25,579
Commitments and Contingencies (Notes 3, 7, 12, and 13)
See accompanying notes to the interim consolidated financial statements
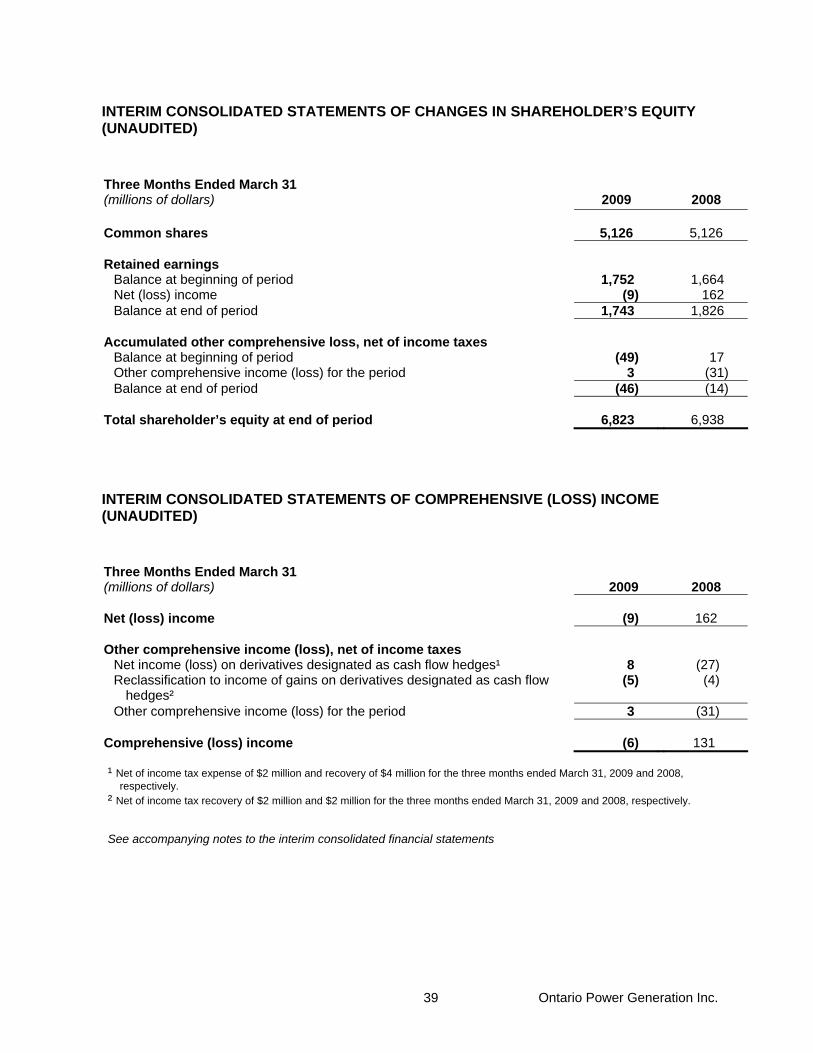
Ontario Power Generation Inc. 39
INTERIM CONSOLIDATED STATEMENTS OF CHANGES IN SHAREHOLDER’S EQUITY (UNAUDITED)
Three Months Ended March 31 (millions of dollars) 2009 2008
Common shares 5,126 5,126
Retained earnings Balance at beginning of period 1,752 1,664 Net (loss) income (9) 162 Balance at end of period 1,743 1,826
Accumulated other comprehensive loss, net of income taxes
Balance at beginning of period (49) 17 Other comprehensive income (loss) for the period 3 (31) Balance at end of period (46) (14)
Total shareholder’s equity at end of period 6,823 6,938
INTERIM CONSOLIDATED STATEMENTS OF COMPREHENSIVE (LOSS) INCOME (UNAUDITED)
Three Months Ended March 31 (millions of dollars) 2009 2008
Net (loss) income (9) 162
Other comprehensive income (loss), net of income taxes Net income (loss) on derivatives designated as cash flow hedges¹ 8 (27) Reclassification to income of gains on derivatives designated as cash flow
hedges² (5) (4)
Other comprehensive income (loss) for the period 3 (31)
Comprehensive (loss) income (6) 131 ¹ Net of income tax expense of $2 million and recovery of $4 million for the three months ended March 31, 2009 and 2008,
respectively. ² Net of income tax recovery of $2 million and $2 million for the three months ended March 31, 2009 and 2008, respectively. See accompanying notes to the interim consolidated financial statements
Ontario Power Generation Inc. 40
NOTES TO THE INTERIM CONSOLIDATED FINANCIAL STATEMENTS FOR THE THREE MONTHS ENDED MARCH 31, 2009 AND 2008 (UNAUDITED) 1. BASIS OF PRESENTATION These interim consolidated financial statements were prepared following the same accounting policies and methods as in the most recent annual consolidated financial statements, except as discussed in Note 2 to these interim consolidated financial statements. These interim consolidated financial statements do not contain all the disclosures required by Canadian generally accepted accounting principles (“GAAP”) for annual financial statements. Accordingly, these interim consolidated financial statements should be read in conjunction with the most recently prepared annual consolidated financial statements for the year ended December 31, 2008. The preparation of financial statements in conformity with Canadian generally accepted accounting principles requires management to make estimates and assumptions that affect the reported amounts of assets, liabilities, revenue and expenses, and the disclosure of contingent assets and liabilities. Actual results could differ from those estimates. Certain of the 2008 comparative amounts have been reclassified from financial statements previously presented to conform to the 2009 financial statement presentation. The interim consolidated financial statements include the accounts of Ontario Power Generation Inc. (“OPG” or the “Company”) and its subsidiaries. OPG accounts for its interests in jointly controlled entities using the proportionate consolidation method. All significant intercompany transactions have been eliminated on consolidation. 2. CHANGES IN ACCOUNTING POLICIES AND ESTIMATES Accounting for Regulated Operations The Canadian Institute of Chartered Accountants (“CICA”) revised its guidance on accounting for rate regulated operations, effective January 1, 2009, with amendments to Handbook Sections 1100, Generally Accepted Accounting Principles, and 3465, Income Taxes, and Accounting Guideline 19 (“AcG-19”), Disclosures by Entities Subject to Rate Regulation, as follows: • to remove the temporary exemption pertaining to the application of Section 1100 to rate regulated
operations, including the elimination of the opportunity to use industry practice as an acceptable basis for recognition and measurement of assets and liabilities arising from rate regulation;
• to amend Section 3465 to require the recognition of future income tax assets and liabilities as well as a separate regulatory asset or liability for the amount of future income taxes expected to be included in future rates and recovered from or paid to customers; and
• to amend AcG-19, as necessary, as a result of amendments to Sections 1100 and 3465. As a result of the changes to Section 3465, OPG is required to recognize future income taxes associated with its rate regulated operations. OPG applied the changes prospectively to interim and annual consolidated financial statements beginning January 1, 2009. The impact of the change is disclosed in Note 10, Income Taxes. In addition, effective January 1, 2009, with the removal of the temporary exemption in Section 1100, the Company must now apply Section 1100 to the recognition of assets and liabilities arising from rate regulation. Certain assets and liabilities arising from rate regulation continue to have specific guidance under a primary source of GAAP that applies only to the particular circumstances described therein, including those arising under Section 1600, Consolidated Financial Statements, Section 3061, Property, Plant and Equipment, Section 3465, and Section 3475, Disposal of Long-Lived Assets and Discontinued
Ontario Power Generation Inc. 41
Operations. Other assets and liabilities arising from rate regulation do not have specific guidance under a primary source of GAAP. Therefore, Section 1100 directs the Company to adopt accounting policies that are developed through the exercise of professional judgment and the application of concepts described in Section 1000, Financial Statement Concepts. In developing these accounting policies, the Company may consult other sources including pronouncements issued by bodies authorized to issue accounting standards in other jurisdictions. Therefore, in accordance with Section 1100, the Company has determined that these assets and liabilities qualify for recognition under GAAP and this recognition is consistent with the Financial Accounting Standards Board (“FASB”) Statement of Financial Accounting Standards No. 71, Accounting for the Effects of Certain Types of Regulation. As a result, there is no effect on the Company’s financial statements for the three months ended March 31, 2009, with the exception of the impact of the amendment to Section 3465, as discussed above. Intangible Assets In February 2008, the CICA adopted Handbook Section 3064, Goodwill and Intangible Assets, which replaces CICA Handbook Section 3062, Goodwill and Other Intangible Assets, and establishes standards for the recognition, measurement, presentation and disclosure of goodwill and intangible assets. This section applies to annual and interim financial statements relating to fiscal years beginning on or after October 1, 2008, with early adoption encouraged. OPG adopted the Handbook Section on January 1, 2009 and reclassified prior period comparative amounts from Property, Plant, and Equipment to Intangible Assets. The adoption of this standard did not have a significant impact on the Company’s financial position or results of operations. As at March 31, 2009 and December 31, 2008, OPG reported intangible assets of $56 million and $57 million, respectively. Intangible assets are amortized over a period of five years. 3. INVESTMENTS IN ASSET-BACKED COMMERCIAL PAPER On January 21, 2009, the Pan-Canadian Investors Committee for third-party asset-backed commercial paper (“ABCP”) announced that the restructuring Plan (the "Plan") affecting $32 billion of third-party ABCP had been fully implemented. Pursuant to the terms of the Plan, OPG's short-term commercial paper has been exchanged for longer term notes of approximately $58 million. OPG received five classes of notes, which are supported by margin funding facilities from third-party liquidity providers, Canadian banks and governments. The long term MAV II notes consist of $23 million Class A-1 notes, $21 million Class A-2 notes, $4 million Class B notes, $2 million Class C notes, $1 million Class 14, $2 million Class 15 and $5 million IA Tracking notes. The terms and conditions of the various series of ABCP and the terms and conditions of the various classes of new notes that investors received in exchange differ significantly. Therefore, OPG removed $35 million from its accounting records, which represented a book value of $58 million minus a total provision of $23 million. Furthermore, OPG recognized notes of $35 million, which represents the fair value of the new ABCP notes. There is a significant amount of uncertainty in estimating the amount and timing of cash flows associated with the notes. The Company estimates the fair value of the notes using a valuation technique which incorporates a probability weighted approach applied to the discounted estimated future cash flows, considering the terms of the notes and other available data regarding market conditions for such investments as at March 31, 2009. Fair value was determined based on the same methodology previously developed, but with updated credit spread and discount rate information. OPG classified the new ABCP notes for the purposes of measurement subsequent to their initial recognition and related income reporting as held for trading. The restructured notes are expected to have a maturity of eight to nine years. The exact maturity will be impacted by the release of collateral as underlying swap trades mature. The stated maturity of the notes is 2056. OPG continues to monitor the development of a secondary market to help assess the fair value of its remaining holdings.
Ontario Power Generation Inc. 42
4. SALE OF ACCOUNTS RECEIVABLE The Company has an agreement to sell an undivided co-ownership interest in its current and future accounts receivable (the “receivables”) to an independent trust. The Company also retains an undivided co-ownership interest in the receivables sold to the trust. Under the agreement, OPG continues to service the receivables. The accounts receivable reported and securitized by the Company are as follows: Principal Amount of
Receivables as at
March 31 December 31 (millions of dollars) 2009 2008 Total receivables portfolio 1 415 507 Receivables sold 300 300 Receivables retained
115
207
1 Amount represents receivables outstanding, including receivables that have been securitized, which the Company continues to service.
The pre-tax charges and average cost of funds are as follows: Three Months Ended March 31 (millions of dollars) 2009 2008 Pre-tax charges 2 3 Average cost of funds (percent) 2.5 4.6 5. DEPRECIATION AND AMORTIZATION Depreciation and amortization expense for the three months ended March 31, 2009 and 2008 consists of the following: Three Months Ended March 31 (millions of dollars) 2009 2008 Depreciation on fixed assets 149 139 Amortization on intangible assets 6 5 Amortization of regulatory assets and liabilities (Note 6) 21 29 Nuclear waste management costs 2 2 178 175 Interest capitalized to construction in progress at six percent during the three months ended March 31, 2009 (three months ended March 31, 2008 – six percent) was $17 million (three months ended March 31, 2008 – $13 million).
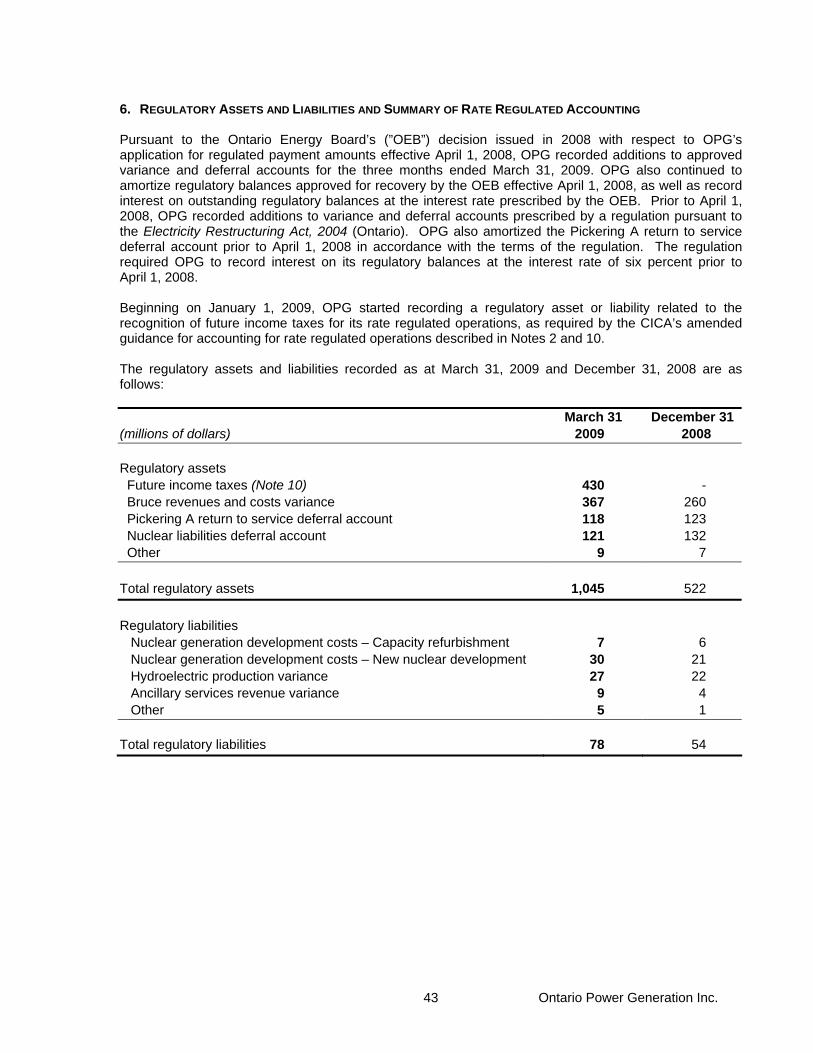
Ontario Power Generation Inc. 43
6. REGULATORY ASSETS AND LIABILITIES AND SUMMARY OF RATE REGULATED ACCOUNTING Pursuant to the Ontario Energy Board’s (”OEB”) decision issued in 2008 with respect to OPG’s application for regulated payment amounts effective April 1, 2008, OPG recorded additions to approved variance and deferral accounts for the three months ended March 31, 2009. OPG also continued to amortize regulatory balances approved for recovery by the OEB effective April 1, 2008, as well as record interest on outstanding regulatory balances at the interest rate prescribed by the OEB. Prior to April 1, 2008, OPG recorded additions to variance and deferral accounts prescribed by a regulation pursuant to the Electricity Restructuring Act, 2004 (Ontario). OPG also amortized the Pickering A return to service deferral account prior to April 1, 2008 in accordance with the terms of the regulation. The regulation required OPG to record interest on its regulatory balances at the interest rate of six percent prior to April 1, 2008. Beginning on January 1, 2009, OPG started recording a regulatory asset or liability related to the recognition of future income taxes for its rate regulated operations, as required by the CICA’s amended guidance for accounting for rate regulated operations described in Notes 2 and 10. The regulatory assets and liabilities recorded as at March 31, 2009 and December 31, 2008 are as follows: March 31 December 31 (millions of dollars) 2009 2008 Regulatory assets Future income taxes (Note 10) 430 - Bruce revenues and costs variance 367 260 Pickering A return to service deferral account 118 123 Nuclear liabilities deferral account 121 132 Other 9 7 Total regulatory assets 1,045 522 Regulatory liabilities Nuclear generation development costs – Capacity refurbishment 7 6 Nuclear generation development costs – New nuclear development 30 21 Hydroelectric production variance 27 22 Ancillary services revenue variance 9 4 Other 5 1 Total regulatory liabilities 78 54
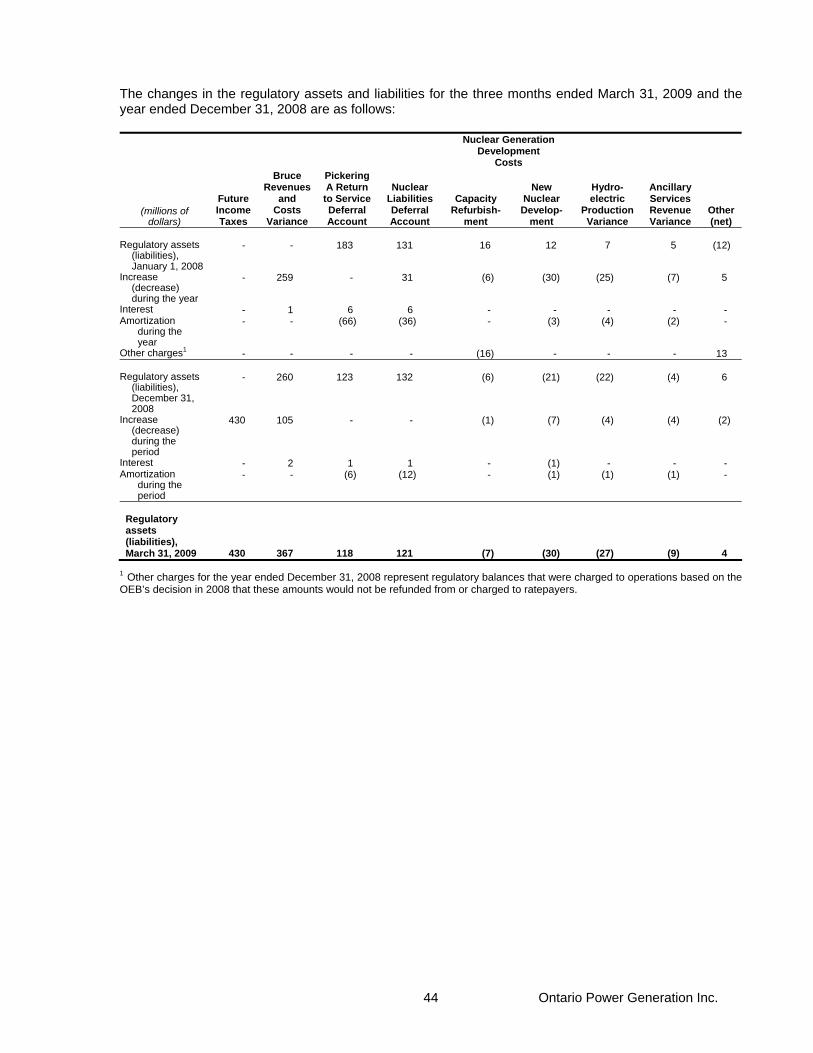
Ontario Power Generation Inc. 44
The changes in the regulatory assets and liabilities for the three months ended March 31, 2009 and the year ended December 31, 2008 are as follows:
Nuclear Generation Development
Costs
(millions of dollars)
Future Income Taxes
Bruce Revenues
and Costs
Variance
Pickering A Return
to Service Deferral Account
Nuclear Liabilities Deferral Account
Capacity Refurbish-
ment
New Nuclear Develop-
ment
Hydro- electric
Production Variance
Ancillary Services Revenue Variance
Other (net)
Regulatory assets
(liabilities), January 1, 2008
- - 183 131 16 12 7 5 (12)
Increase (decrease) during the year
- 259 - 31 (6) (30) (25) (7) 5
Interest - 1 6 6 - - - - - Amortization
during the year
- - (66) (36) - (3) (4) (2) -
Other charges1 - - - - (16) - - - 13 Regulatory assets
(liabilities), December 31, 2008
- 260 123 132 (6) (21) (22) (4) 6
Increase (decrease) during the period
430 105 - - (1) (7) (4) (4) (2)
Interest - 2 1 1 - (1) - - - Amortization
during the period
- - (6) (12) - (1) (1) (1) -
Regulatory assets (liabilities), March 31, 2009
430
367
118
121
(7)
(30)
(27)
(9)
4 1 Other charges for the year ended December 31, 2008 represent regulatory balances that were charged to operations based on the OEB’s decision in 2008 that these amounts would not be refunded from or charged to ratepayers.
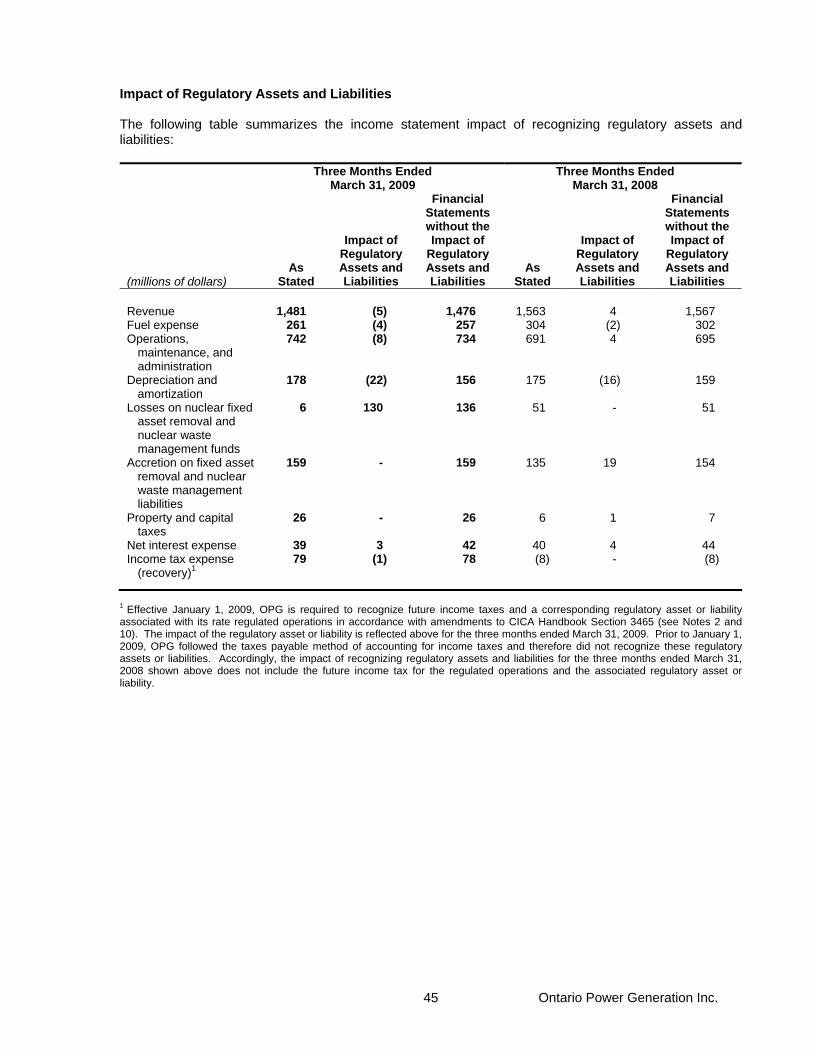
Ontario Power Generation Inc. 45
Impact of Regulatory Assets and Liabilities The following table summarizes the income statement impact of recognizing regulatory assets and liabilities: Three Months Ended
March 31, 2009 Three Months Ended
March 31, 2008
(millions of dollars) As
Stated
Impact of Regulatory Assets and Liabilities
Financial Statements without the Impact of
Regulatory Assets and Liabilities
As Stated
Impact of Regulatory Assets and Liabilities
Financial Statements without the Impact of
Regulatory Assets and Liabilities
Revenue 1,481 (5) 1,476 1,563 4 1,567 Fuel expense 261 (4) 257 304 (2) 302 Operations,
maintenance, and administration
742 (8) 734 691 4 695
Depreciation and amortization
178 (22) 156 175 (16) 159
Losses on nuclear fixed asset removal and nuclear waste management funds
6 130 136 51 - 51
Accretion on fixed asset removal and nuclear waste management liabilities
159 - 159 135 19 154
Property and capital taxes
26 - 26 6 1 7
Net interest expense 39 3 42 40 4 44 Income tax expense
(recovery)1 79 (1) 78 (8) - (8)
1 Effective January 1, 2009, OPG is required to recognize future income taxes and a corresponding regulatory asset or liability associated with its rate regulated operations in accordance with amendments to CICA Handbook Section 3465 (see Notes 2 and 10). The impact of the regulatory asset or liability is reflected above for the three months ended March 31, 2009. Prior to January 1, 2009, OPG followed the taxes payable method of accounting for income taxes and therefore did not recognize these regulatory assets or liabilities. Accordingly, the impact of recognizing regulatory assets and liabilities for the three months ended March 31, 2008 shown above does not include the future income tax for the regulated operations and the associated regulatory asset or liability.
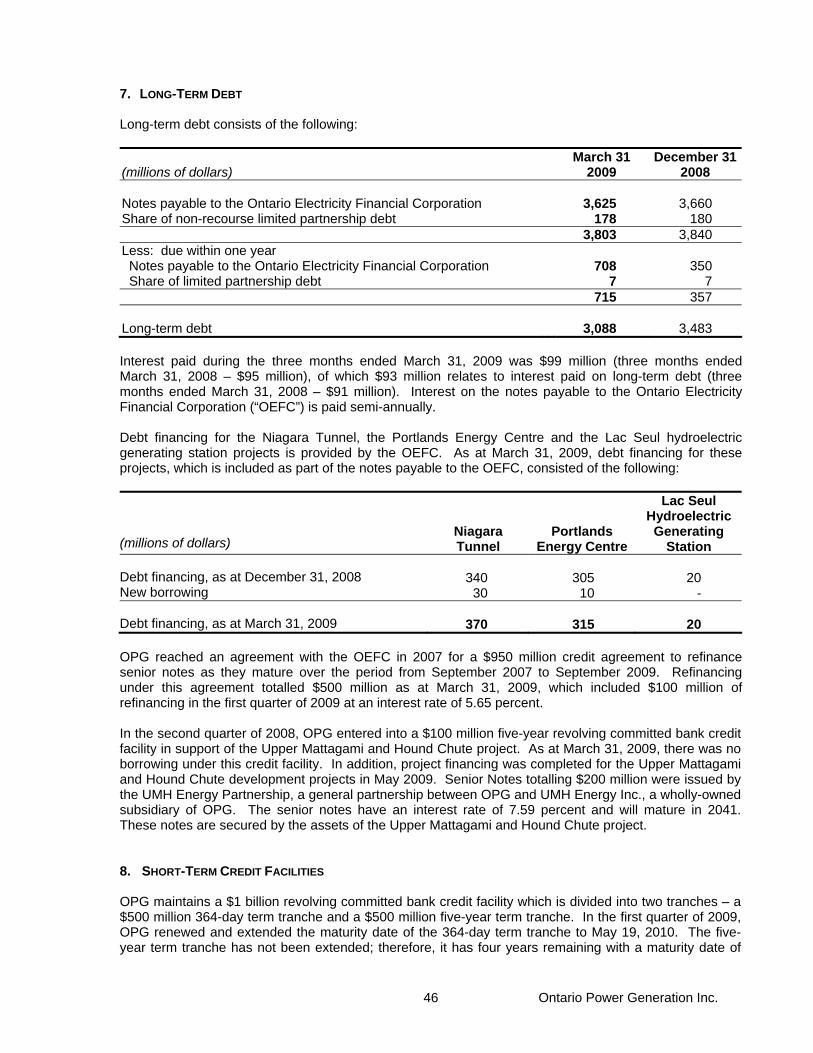
Ontario Power Generation Inc. 46
7. LONG-TERM DEBT Long-term debt consists of the following: March 31 December 31(millions of dollars) 2009 2008 Notes payable to the Ontario Electricity Financial Corporation 3,625 3,660 Share of non-recourse limited partnership debt 178 180 3,803 3,840 Less: due within one year Notes payable to the Ontario Electricity Financial Corporation 708 350 Share of limited partnership debt 7 7 715 357 Long-term debt 3,088 3,483 Interest paid during the three months ended March 31, 2009 was $99 million (three months ended March 31, 2008 – $95 million), of which $93 million relates to interest paid on long-term debt (three months ended March 31, 2008 – $91 million). Interest on the notes payable to the Ontario Electricity Financial Corporation (“OEFC”) is paid semi-annually. Debt financing for the Niagara Tunnel, the Portlands Energy Centre and the Lac Seul hydroelectric generating station projects is provided by the OEFC. As at March 31, 2009, debt financing for these projects, which is included as part of the notes payable to the OEFC, consisted of the following:
(millions of dollars) Niagara Tunnel
Portlands Energy Centre
Lac Seul Hydroelectric Generating
Station Debt financing, as at December 31, 2008 340 305 20 New borrowing 30 10 - Debt financing, as at March 31, 2009 370 315 20 OPG reached an agreement with the OEFC in 2007 for a $950 million credit agreement to refinance senior notes as they mature over the period from September 2007 to September 2009. Refinancing under this agreement totalled $500 million as at March 31, 2009, which included $100 million of refinancing in the first quarter of 2009 at an interest rate of 5.65 percent. In the second quarter of 2008, OPG entered into a $100 million five-year revolving committed bank credit facility in support of the Upper Mattagami and Hound Chute project. As at March 31, 2009, there was no borrowing under this credit facility. In addition, project financing was completed for the Upper Mattagami and Hound Chute development projects in May 2009. Senior Notes totalling $200 million were issued by the UMH Energy Partnership, a general partnership between OPG and UMH Energy Inc., a wholly-owned subsidiary of OPG. The senior notes have an interest rate of 7.59 percent and will mature in 2041. These notes are secured by the assets of the Upper Mattagami and Hound Chute project. 8. SHORT-TERM CREDIT FACILITIES OPG maintains a $1 billion revolving committed bank credit facility which is divided into two tranches – a $500 million 364-day term tranche and a $500 million five-year term tranche. In the first quarter of 2009, OPG renewed and extended the maturity date of the 364-day term tranche to May 19, 2010. The five-year term tranche has not been extended; therefore, it has four years remaining with a maturity date of
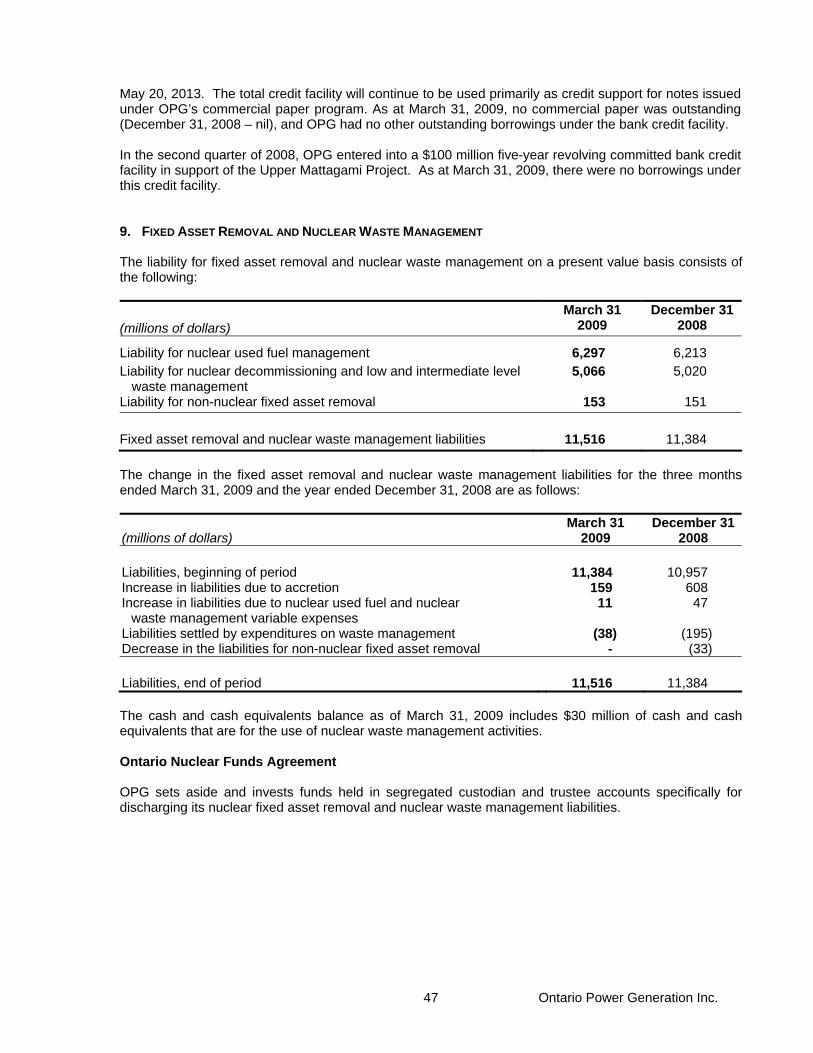
Ontario Power Generation Inc. 47
May 20, 2013. The total credit facility will continue to be used primarily as credit support for notes issued under OPG’s commercial paper program. As at March 31, 2009, no commercial paper was outstanding (December 31, 2008 – nil), and OPG had no other outstanding borrowings under the bank credit facility. In the second quarter of 2008, OPG entered into a $100 million five-year revolving committed bank credit facility in support of the Upper Mattagami Project. As at March 31, 2009, there were no borrowings under this credit facility. 9. FIXED ASSET REMOVAL AND NUCLEAR WASTE MANAGEMENT The liability for fixed asset removal and nuclear waste management on a present value basis consists of the following: (millions of dollars)
March 31 2009
December 31 2008
Liability for nuclear used fuel management 6,297 6,213 Liability for nuclear decommissioning and low and intermediate level
waste management 5,066 5,020
Liability for non-nuclear fixed asset removal 153 151 Fixed asset removal and nuclear waste management liabilities 11,516 11,384 The change in the fixed asset removal and nuclear waste management liabilities for the three months ended March 31, 2009 and the year ended December 31, 2008 are as follows: (millions of dollars)
March 31 2009
December 31 2008
Liabilities, beginning of period 11,384 10,957 Increase in liabilities due to accretion 159 608 Increase in liabilities due to nuclear used fuel and nuclear
waste management variable expenses 11 47
Liabilities settled by expenditures on waste management (38) (195) Decrease in the liabilities for non-nuclear fixed asset removal - (33) Liabilities, end of period 11,516 11,384 The cash and cash equivalents balance as of March 31, 2009 includes $30 million of cash and cash equivalents that are for the use of nuclear waste management activities. Ontario Nuclear Funds Agreement OPG sets aside and invests funds held in segregated custodian and trustee accounts specifically for discharging its nuclear fixed asset removal and nuclear waste management liabilities.
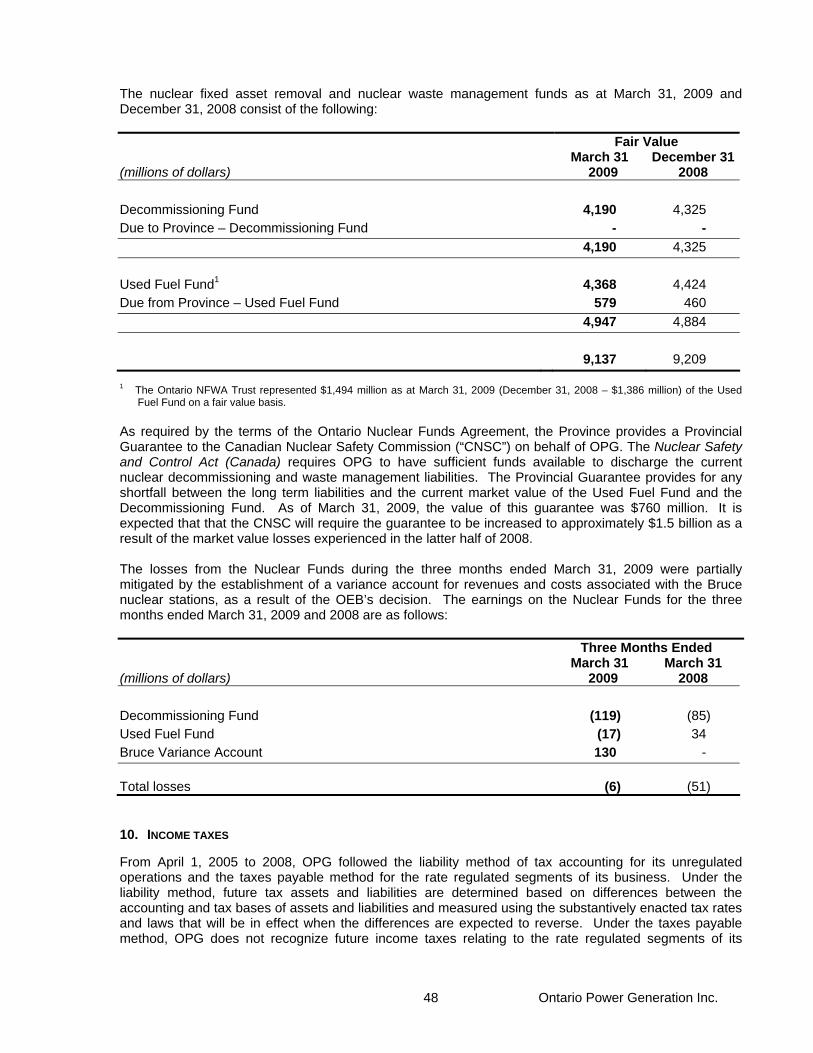
Ontario Power Generation Inc. 48
The nuclear fixed asset removal and nuclear waste management funds as at March 31, 2009 and December 31, 2008 consist of the following: Fair Value March 31 December 31(millions of dollars) 2009 2008 Decommissioning Fund 4,190 4,325 Due to Province – Decommissioning Fund - - 4,190 4,325 Used Fuel Fund1 4,368 4,424 Due from Province – Used Fuel Fund 579 460 4,947 4,884 9,137 9,209 1 The Ontario NFWA Trust represented $1,494 million as at March 31, 2009 (December 31, 2008 – $1,386 million) of the Used
Fuel Fund on a fair value basis. As required by the terms of the Ontario Nuclear Funds Agreement, the Province provides a Provincial Guarantee to the Canadian Nuclear Safety Commission (“CNSC”) on behalf of OPG. The Nuclear Safety and Control Act (Canada) requires OPG to have sufficient funds available to discharge the current nuclear decommissioning and waste management liabilities. The Provincial Guarantee provides for any shortfall between the long term liabilities and the current market value of the Used Fuel Fund and the Decommissioning Fund. As of March 31, 2009, the value of this guarantee was $760 million. It is expected that that the CNSC will require the guarantee to be increased to approximately $1.5 billion as a result of the market value losses experienced in the latter half of 2008. The losses from the Nuclear Funds during the three months ended March 31, 2009 were partially mitigated by the establishment of a variance account for revenues and costs associated with the Bruce nuclear stations, as a result of the OEB’s decision. The earnings on the Nuclear Funds for the three months ended March 31, 2009 and 2008 are as follows: Three Months Ended March 31 March 31 (millions of dollars) 2009 2008 Decommissioning Fund (119) (85) Used Fuel Fund (17) 34 Bruce Variance Account 130 - Total losses
(6)
(51)
10. INCOME TAXES From April 1, 2005 to 2008, OPG followed the liability method of tax accounting for its unregulated operations and the taxes payable method for the rate regulated segments of its business. Under the liability method, future tax assets and liabilities are determined based on differences between the accounting and tax bases of assets and liabilities and measured using the substantively enacted tax rates and laws that will be in effect when the differences are expected to reverse. Under the taxes payable method, OPG does not recognize future income taxes relating to the rate regulated segments of its
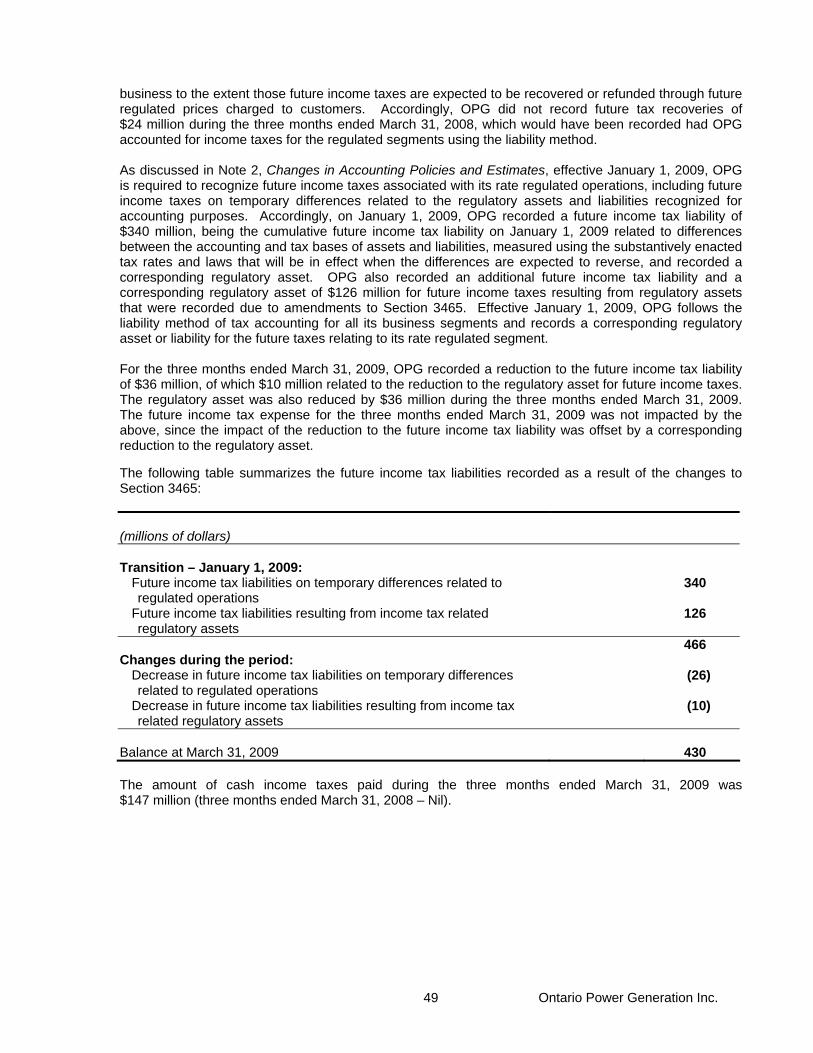
Ontario Power Generation Inc. 49
business to the extent those future income taxes are expected to be recovered or refunded through future regulated prices charged to customers. Accordingly, OPG did not record future tax recoveries of $24 million during the three months ended March 31, 2008, which would have been recorded had OPG accounted for income taxes for the regulated segments using the liability method. As discussed in Note 2, Changes in Accounting Policies and Estimates, effective January 1, 2009, OPG is required to recognize future income taxes associated with its rate regulated operations, including future income taxes on temporary differences related to the regulatory assets and liabilities recognized for accounting purposes. Accordingly, on January 1, 2009, OPG recorded a future income tax liability of $340 million, being the cumulative future income tax liability on January 1, 2009 related to differences between the accounting and tax bases of assets and liabilities, measured using the substantively enacted tax rates and laws that will be in effect when the differences are expected to reverse, and recorded a corresponding regulatory asset. OPG also recorded an additional future income tax liability and a corresponding regulatory asset of $126 million for future income taxes resulting from regulatory assets that were recorded due to amendments to Section 3465. Effective January 1, 2009, OPG follows the liability method of tax accounting for all its business segments and records a corresponding regulatory asset or liability for the future taxes relating to its rate regulated segment. For the three months ended March 31, 2009, OPG recorded a reduction to the future income tax liability of $36 million, of which $10 million related to the reduction to the regulatory asset for future income taxes. The regulatory asset was also reduced by $36 million during the three months ended March 31, 2009. The future income tax expense for the three months ended March 31, 2009 was not impacted by the above, since the impact of the reduction to the future income tax liability was offset by a corresponding reduction to the regulatory asset. The following table summarizes the future income tax liabilities recorded as a result of the changes to Section 3465: (millions of dollars) Transition – January 1, 2009:
Future income tax liabilities on temporary differences related to regulated operations
340
Future income tax liabilities resulting from income tax related regulatory assets
126
466 Changes during the period:
Decrease in future income tax liabilities on temporary differences related to regulated operations
(26)
Decrease in future income tax liabilities resulting from income tax related regulatory assets
(10)
Balance at March 31, 2009 430 The amount of cash income taxes paid during the three months ended March 31, 2009 was $147 million (three months ended March 31, 2008 – Nil).
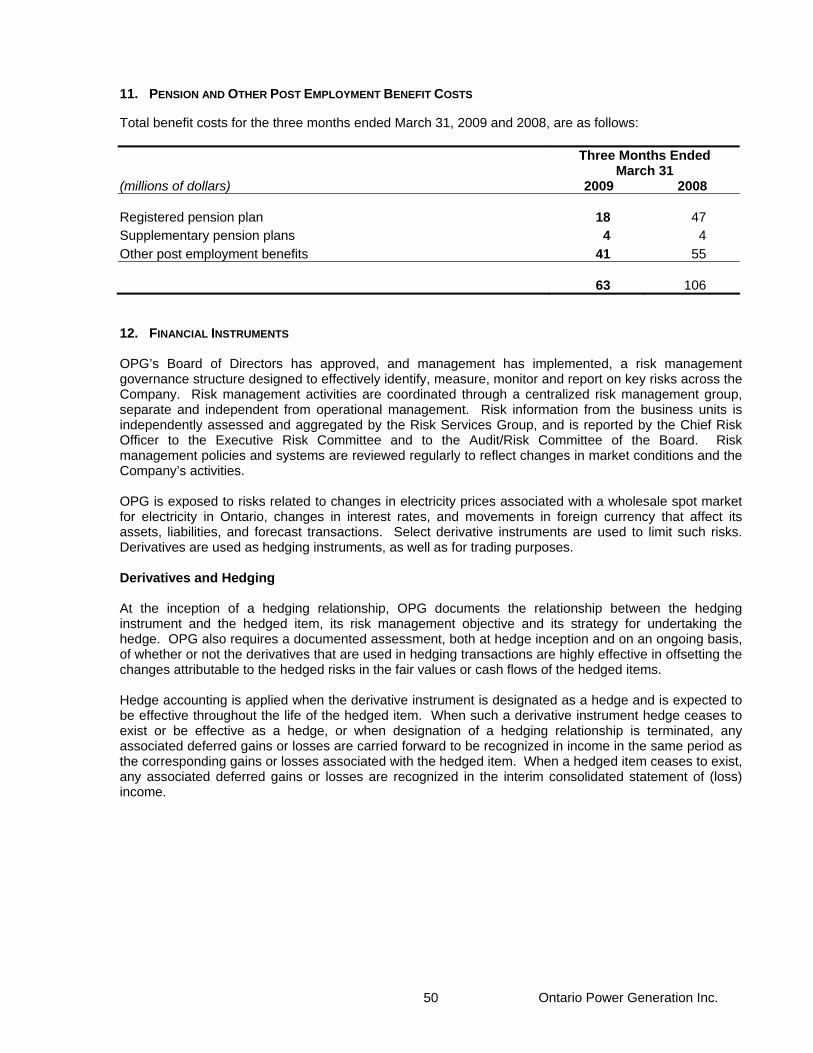
Ontario Power Generation Inc. 50
11. PENSION AND OTHER POST EMPLOYMENT BENEFIT COSTS Total benefit costs for the three months ended March 31, 2009 and 2008, are as follows: Three Months Ended March 31 (millions of dollars) 2009 2008 Registered pension plan 18 47 Supplementary pension plans 4 4 Other post employment benefits 41 55
63
106 12. FINANCIAL INSTRUMENTS OPG’s Board of Directors has approved, and management has implemented, a risk management governance structure designed to effectively identify, measure, monitor and report on key risks across the Company. Risk management activities are coordinated through a centralized risk management group, separate and independent from operational management. Risk information from the business units is independently assessed and aggregated by the Risk Services Group, and is reported by the Chief Risk Officer to the Executive Risk Committee and to the Audit/Risk Committee of the Board. Risk management policies and systems are reviewed regularly to reflect changes in market conditions and the Company’s activities. OPG is exposed to risks related to changes in electricity prices associated with a wholesale spot market for electricity in Ontario, changes in interest rates, and movements in foreign currency that affect its assets, liabilities, and forecast transactions. Select derivative instruments are used to limit such risks. Derivatives are used as hedging instruments, as well as for trading purposes. Derivatives and Hedging At the inception of a hedging relationship, OPG documents the relationship between the hedging instrument and the hedged item, its risk management objective and its strategy for undertaking the hedge. OPG also requires a documented assessment, both at hedge inception and on an ongoing basis, of whether or not the derivatives that are used in hedging transactions are highly effective in offsetting the changes attributable to the hedged risks in the fair values or cash flows of the hedged items. Hedge accounting is applied when the derivative instrument is designated as a hedge and is expected to be effective throughout the life of the hedged item. When such a derivative instrument hedge ceases to exist or be effective as a hedge, or when designation of a hedging relationship is terminated, any associated deferred gains or losses are carried forward to be recognized in income in the same period as the corresponding gains or losses associated with the hedged item. When a hedged item ceases to exist, any associated deferred gains or losses are recognized in the interim consolidated statement of (loss) income.
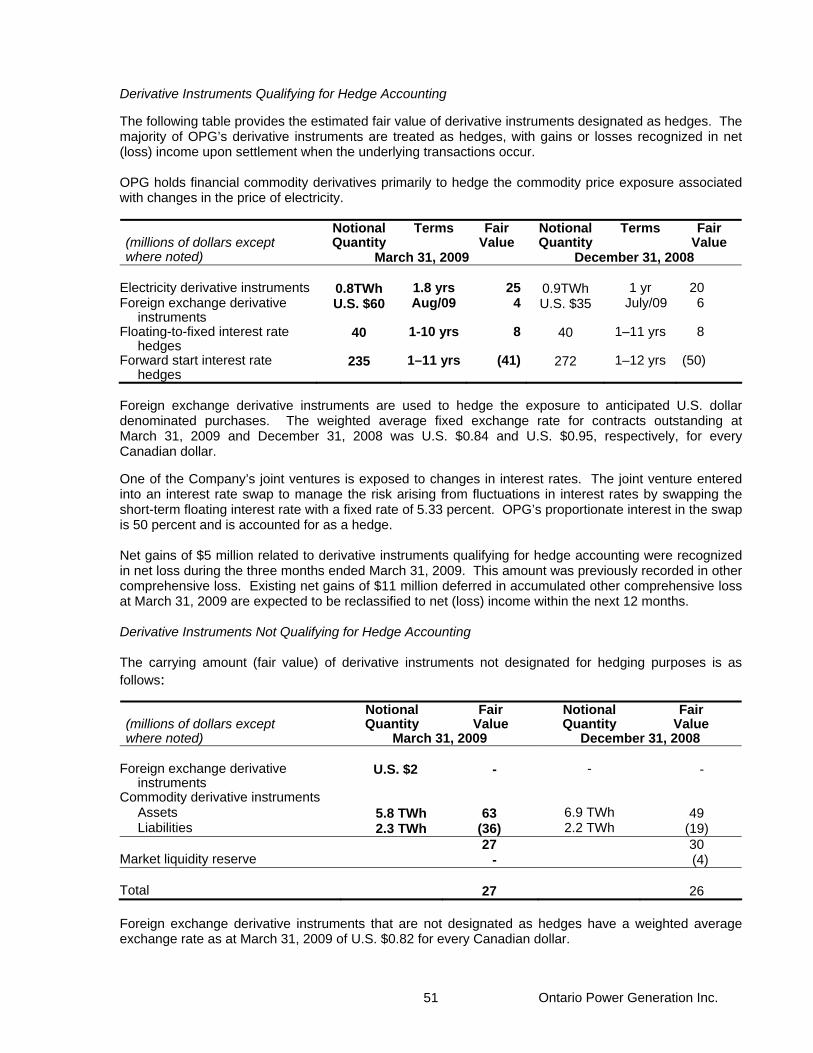
Ontario Power Generation Inc. 51
Derivative Instruments Qualifying for Hedge Accounting The following table provides the estimated fair value of derivative instruments designated as hedges. The majority of OPG’s derivative instruments are treated as hedges, with gains or losses recognized in net (loss) income upon settlement when the underlying transactions occur. OPG holds financial commodity derivatives primarily to hedge the commodity price exposure associated with changes in the price of electricity.
Notional Quantity
Terms Fair Value
Notional Quantity
Terms Fair Value
(millions of dollars except where noted) March 31, 2009 December 31, 2008
Electricity derivative instruments 0.8TWh 1.8 yrs 25 0.9TWh 1 yr 20 Foreign exchange derivative
instruments U.S. $60 Aug/09 4 U.S. $35 July/09 6
Floating-to-fixed interest rate hedges
40 1-10 yrs 8 40 1–11 yrs 8
Forward start interest rate hedges
235 1–11 yrs (41) 272 1–12 yrs (50)
Foreign exchange derivative instruments are used to hedge the exposure to anticipated U.S. dollar denominated purchases. The weighted average fixed exchange rate for contracts outstanding at March 31, 2009 and December 31, 2008 was U.S. $0.84 and U.S. $0.95, respectively, for every Canadian dollar. One of the Company’s joint ventures is exposed to changes in interest rates. The joint venture entered into an interest rate swap to manage the risk arising from fluctuations in interest rates by swapping the short-term floating interest rate with a fixed rate of 5.33 percent. OPG’s proportionate interest in the swap is 50 percent and is accounted for as a hedge. Net gains of $5 million related to derivative instruments qualifying for hedge accounting were recognized in net loss during the three months ended March 31, 2009. This amount was previously recorded in other comprehensive loss. Existing net gains of $11 million deferred in accumulated other comprehensive loss at March 31, 2009 are expected to be reclassified to net (loss) income within the next 12 months. Derivative Instruments Not Qualifying for Hedge Accounting The carrying amount (fair value) of derivative instruments not designated for hedging purposes is as follows:
Notional Quantity
Fair Value
Notional Quantity
Fair Value
(millions of dollars except where noted) March 31, 2009 December 31, 2008
Foreign exchange derivative instruments
U.S. $2 - - -
Commodity derivative instruments Assets 5.8 TWh 63 6.9 TWh 49 Liabilities 2.3 TWh (36) 2.2 TWh (19)
27 30 Market liquidity reserve - (4)
Total 27 26 Foreign exchange derivative instruments that are not designated as hedges have a weighted average exchange rate as at March 31, 2009 of U.S. $0.82 for every Canadian dollar.
Ontario Power Generation Inc. 52
Fair Value Fair value is the value that a financial instrument can be closed out or sold, in a transaction with a willing and knowledgeable counterparty. The fair value of financial assets and liabilities, including exchange traded derivatives and other financial instruments for which quoted prices are available in an active market, are determined directly from those quoted market prices. For financial instruments which do not have quoted market prices directly available, fair values are estimated using forward price curves developed from observable market prices or rates which may include the use of valuation techniques or models, based, wherever possible, on assumptions supported by observable market prices or rates prevailing at the dates of the interim consolidated balance sheets. This is the case for over-the-counter derivatives and securities, which include energy commodity derivatives, foreign exchange derivatives, interest rate swap derivatives, and ABCP issued by third-party trusts. Valuation models use general assumptions and market data and therefore do not reflect the specific risks and other factors that would affect a particular instrument’s fair value. The methodologies used for calculating the fair value adjustments are reviewed on an ongoing basis to ensure that they remain appropriate. 13. COMMITMENTS AND CONTINGENCIES Litigation Various legal proceedings are pending against OPG or its subsidiaries covering a wide range of matters that arise in the ordinary course of its business activities. In August 2006, a Notice of Action and Statement of Claim in the amount of $500 million (the "Claim") was served on OPG and Bruce Power L.P. by British Energy Limited and British Energy International Holdings Limited ("British Energy"), claiming that OPG is liable to them for breach of contract and negligence. OPG leased the Bruce nuclear generating stations to Bruce Power L.P. in 2001. British Energy was an investor in Bruce Power L.P. In 2003, British Energy sold its interest in Bruce Power L.P. to a group of investors (the "Purchasers"). The Purchasers are claiming that British Energy is liable to them with respect to this purchase transaction. Their claim is currently the subject of an arbitration proceeding (the "Arbitration"). British Energy is therefore suing OPG in order to preserve any similar claim it may have against OPG pursuant to the 2001 lease transaction. British Energy has indicated that it does not require OPG to actively defend the Claim at this point in time as British Energy is defending the Arbitration commenced by the Purchasers. The Arbitration is scheduled to proceed in September 2009. It may narrow or eliminate the claims or damages British Energy has, so as to narrow or eliminate the need to continue the Claim against OPG. British Energy has reserved the right to require OPG to defend the Claim prior to the conclusion of the Arbitration should British Energy at some point believe there is some advantage in doing so. In September 2008, a certain First Nation has served a Notice of Action against Canada, Ontario, OPG and the OEFC claiming damages in the amount of $200 million arising from breach of contract, fiduciary duty, trespass to property, negligence, nuisance, misrepresentation, breach of riparian rights and unlawful and unjustifiable infringement of the aboriginal and treaty rights and $0.5 million in special damages. A Notice of Arbitration was served at the same time upon OPG pursuant to an agreement between OPG and the said First Nations to address OPG’s role in the sharing of benefits related to hydro development. While OPG assesses the merits of the litigation, neither the arbitration nor the claim is likely to have any material impact on the Company's financial position, and therefore, OPG has minimal exposure with respect to this claim. Certain First Nations have commenced actions for interference with reserve and traditional land rights. The claims by some of these First Nations total $45 million and claims by others are for unspecified amounts.
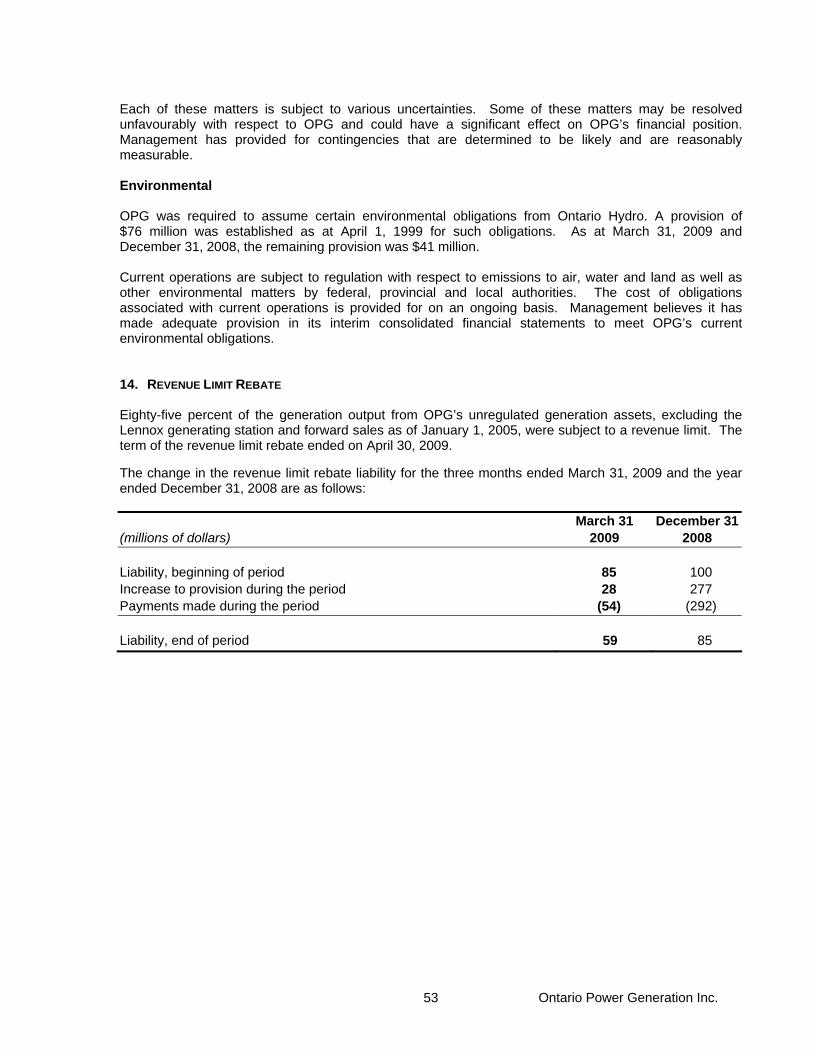
Ontario Power Generation Inc. 53
Each of these matters is subject to various uncertainties. Some of these matters may be resolved unfavourably with respect to OPG and could have a significant effect on OPG’s financial position. Management has provided for contingencies that are determined to be likely and are reasonably measurable. Environmental OPG was required to assume certain environmental obligations from Ontario Hydro. A provision of $76 million was established as at April 1, 1999 for such obligations. As at March 31, 2009 and December 31, 2008, the remaining provision was $41 million. Current operations are subject to regulation with respect to emissions to air, water and land as well as other environmental matters by federal, provincial and local authorities. The cost of obligations associated with current operations is provided for on an ongoing basis. Management believes it has made adequate provision in its interim consolidated financial statements to meet OPG’s current environmental obligations. 14. REVENUE LIMIT REBATE Eighty-five percent of the generation output from OPG’s unregulated generation assets, excluding the Lennox generating station and forward sales as of January 1, 2005, were subject to a revenue limit. The term of the revenue limit rebate ended on April 30, 2009. The change in the revenue limit rebate liability for the three months ended March 31, 2009 and the year ended December 31, 2008 are as follows: March 31 December 31(millions of dollars) 2009 2008 Liability, beginning of period 85 100 Increase to provision during the period 28 277 Payments made during the period (54) (292) Liability, end of period 59 85
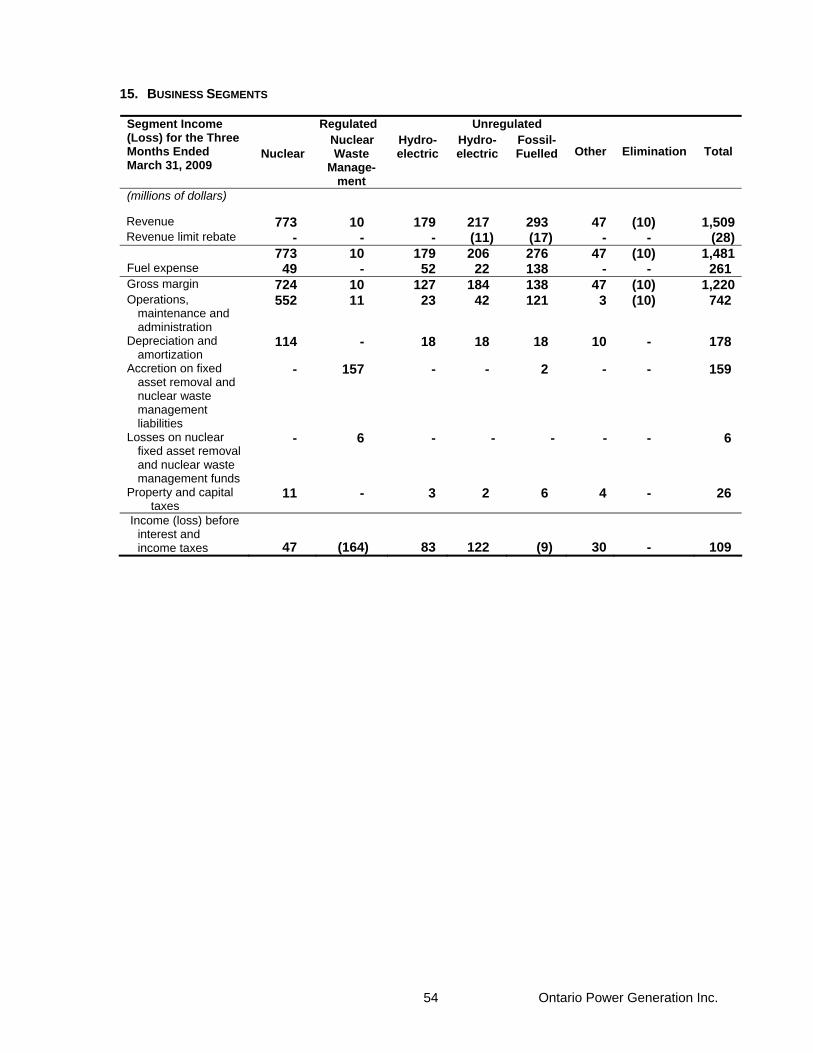
Ontario Power Generation Inc. 54
15. BUSINESS SEGMENTS
Regulated Unregulated Segment Income (Loss) for the Three Months Ended March 31, 2009
Nuclear
Nuclear Waste
Manage-ment
Hydro- electric
Hydro- electric
Fossil- Fuelled
Other
Elimination
Total
(millions of dollars)
Revenue 773 10 179 217 293 47 (10) 1,509 Revenue limit rebate - - - (11) (17) - - (28)
773 10 179 206 276 47 (10) 1,481Fuel expense 49 - 52 22 138 - - 261 Gross margin 724 10 127 184 138 47 (10) 1,220Operations,
maintenance and administration
552 11 23 42 121 3 (10) 742
Depreciation and amortization
114 - 18 18 18 10 - 178
Accretion on fixed asset removal and nuclear waste management liabilities
- 157 - - 2 - - 159
Losses on nuclear fixed asset removal and nuclear waste management funds
- 6 - - - - - 6
Property and capital taxes
11 - 3 2 6 4 - 26
Income (loss) before interest and income taxes
47
(164)
83
122
(9)
30
-
109
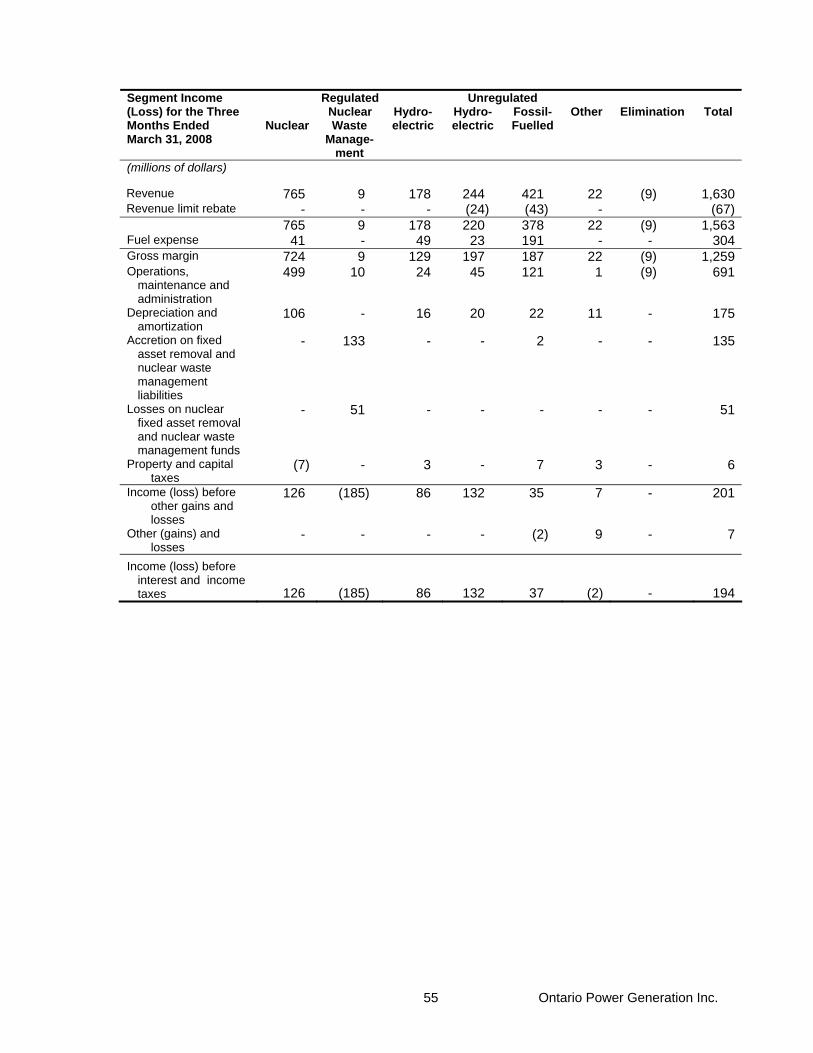
Ontario Power Generation Inc. 55
Regulated Unregulated Segment Income (Loss) for the Three Months Ended March 31, 2008
Nuclear
Nuclear Waste
Manage-ment
Hydro- electric
Hydro- electric
Fossil- Fuelled
Other Elimination Total
(millions of dollars)
Revenue 765 9 178 244 421 22 (9) 1,630 Revenue limit rebate - - - (24) (43) - (67)
765 9 178 220 378 22 (9) 1,563Fuel expense 41 - 49 23 191 - - 304Gross margin 724 9 129 197 187 22 (9) 1,259Operations,
maintenance and administration
499 10 24 45 121 1 (9) 691
Depreciation and amortization
106 - 16 20 22 11 - 175
Accretion on fixed asset removal and nuclear waste management liabilities
- 133 - - 2 - - 135
Losses on nuclear fixed asset removal and nuclear waste management funds
- 51 - - - - - 51
Property and capital taxes
(7) - 3 - 7 3 - 6
Income (loss) before other gains and losses
126 (185) 86 132 35 7 - 201
Other (gains) and losses
- - - - (2) 9 - 7
Income (loss) before interest and income taxes
126
(185)
86
132
37
(2)
-
194
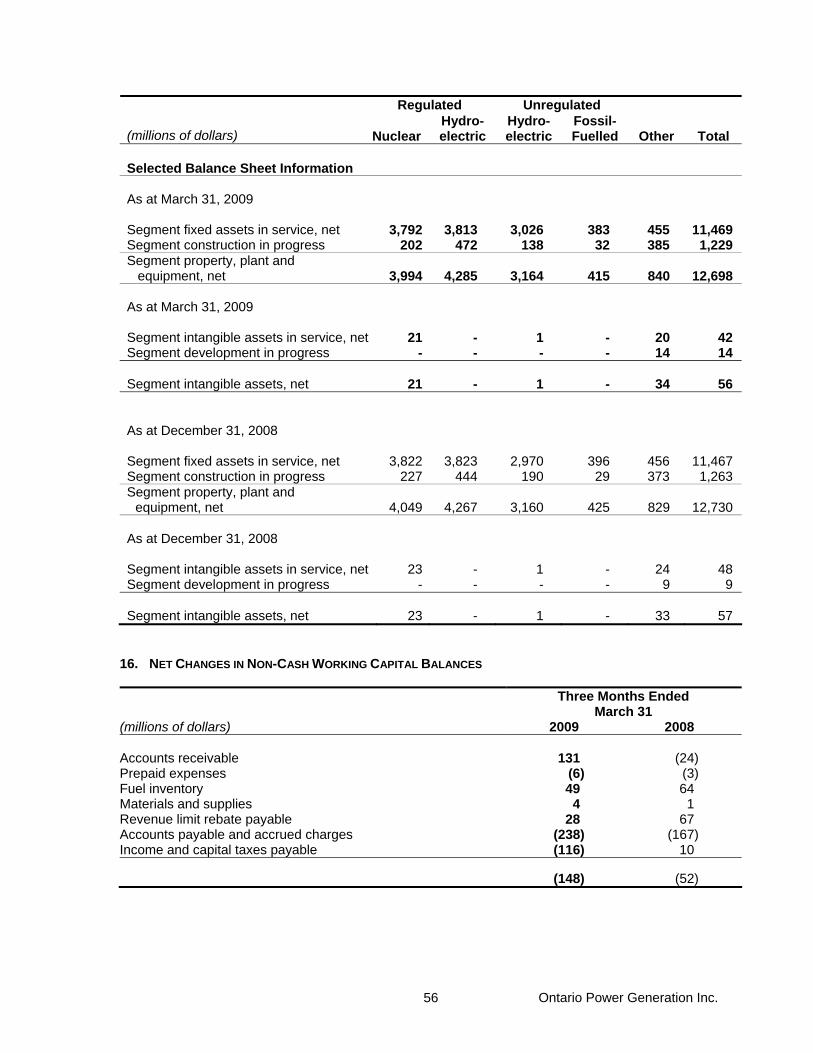
Ontario Power Generation Inc. 56
Regulated Unregulated (millions of dollars)
Nuclear
Hydro- electric
Hydro- electric
Fossil- Fuelled
Other
Total
Selected Balance Sheet Information As at March 31, 2009 Segment fixed assets in service, net Segment construction in progress
3,792202
3,813 472
3,026 138
383 32
455 385
11,469 1,229
Segment property, plant and equipment, net 3,994
4,285
3,164
415
840
12,698
As at March 31, 2009 Segment intangible assets in service, net Segment development in progress
21-
- -
1 -
- -
20 14
42 14
Segment intangible assets, net 21
-
1
-
34
56
As at December 31, 2008 Segment fixed assets in service, net Segment construction in progress
3,822 227
3,823 444
2,970 190
396 29
456 373
11,467 1,263
Segment property, plant and equipment, net
4,049
4,267
3,160
425
829
12,730
As at December 31, 2008 Segment intangible assets in service, net Segment development in progress
23 -
- -
1 -
- -
24 9
48 9
Segment intangible assets, net
23
-
1
-
33
57
16. NET CHANGES IN NON-CASH WORKING CAPITAL BALANCES Three Months Ended March 31 (millions of dollars) 2009 2008 Accounts receivable 131 (24) Prepaid expenses (6) (3) Fuel inventory 49 64 Materials and supplies 4 1 Revenue limit rebate payable 28 67 Accounts payable and accrued charges (238) (167) Income and capital taxes payable (116) 10 (148) (52)
Ontario Power Generation Inc. 57
17. SEASONAL OPERATIONS OPG’s quarterly results are impacted by changes in demand resulting from variations in seasonal weather conditions. Historically, OPG’s revenues are higher in the first and third quarters of a fiscal year as a result of winter heating demands in the first quarter and air conditioning/cooling demands in the third quarter. Regulated prices for most of OPG’s baseload hydroelectric facilities and all of the nuclear facilities that OPG operates, the revenue limit related to the generation from OPG’s other generating assets and OPG’s hedging strategies significantly reduced the impact of seasonal price fluctuations on the results of operations. 18. SUBSEQUENT EVENT During January 2009, OPG filed a motion to review, and vary, a portion of the OEB's 2008 decision establishing OPG’s current regulated prices as it pertains to the treatment of tax losses and their use for mitigation. In May 2009, the OEB issued a decision and order that varied the 2008 decision in the manner requested by OPG. As requested by OPG, the decision authorized the creation of a tax loss variance account effective April 1, 2008. In accordance with the OEB’s decision, the balance in this variance account will be determined based on the difference between regulatory tax losses for the period April 1, 2005 to April 1, 2008 calculated in accordance with the methodology specified in the OEB’s 2008 decision and the revenue requirement reduction reflected in current regulated prices. The balance in the variance account will be reviewed by the OEB as part of OPG’s next hearing. The variance account will result in an increase in regulatory assets and a corresponding increase in revenue. The regulatory asset to be recorded during the second quarter of 2009 will include approximately $160 million relating to the period April 1, 2008 to March 31, 2009.


![ONTARIO POWER GENERATION REPORTS 2008 FINANCIAL RESULTS Reports... · 2019-04-12 · ONTARIO POWER GENERATION REPORTS 2008 FINANCIAL RESULTS [Toronto]: Ontario Power Generation Inc](https://img.pdfslide.us/doc/110x75/5f0cf1577e708231d437e555/ontario-power-generation-reports-2008-financial-results-reports-2019-04-12.jpg)