Embed Size (px)
Citation preview
ONTARIO FINANCES 2006-07 THIRD QUARTER QUARTERLY UPDATE – DECEMBER 31, 2006 MINISTRY OF FINANCE
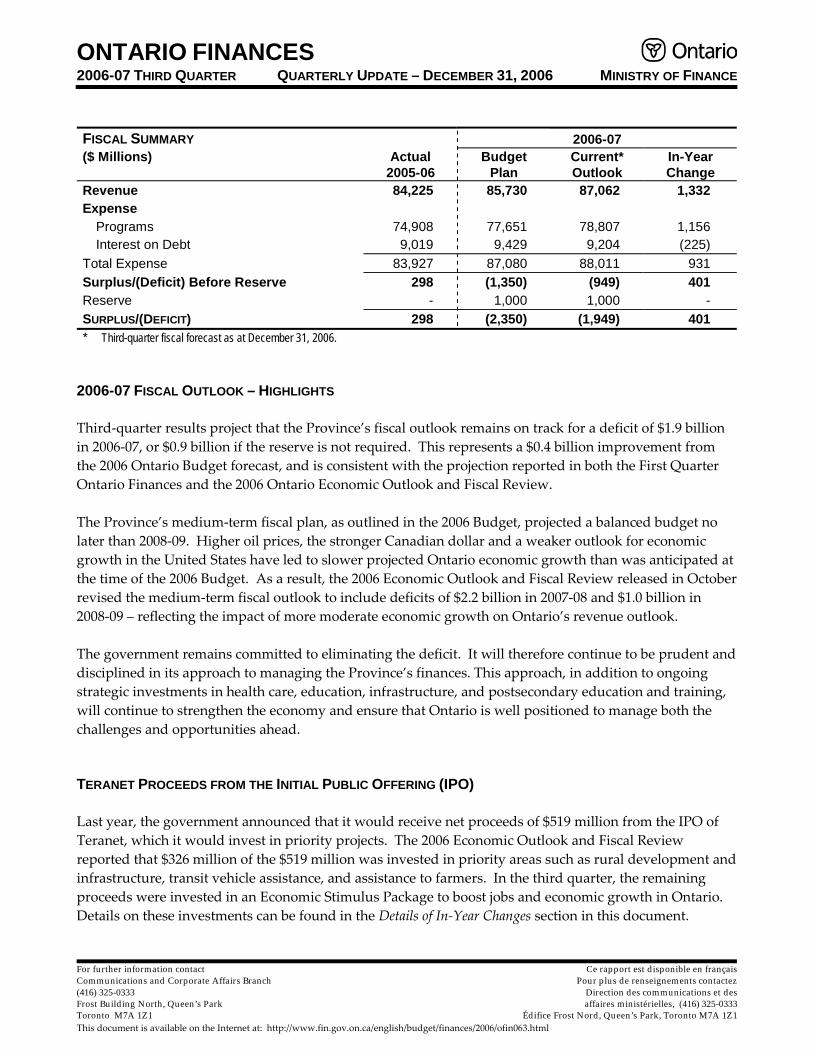
FISCAL SUMMARY 2006-07 ($ Millions) Actual Budget Current* In-Year
2005-06 Plan Outlook Change Revenue 84,225 85,730 87,062 1,332 Expense Programs 74,908 77,651 78,807 1,156
Interest on Debt 9,019 9,429 9,204 (225) Total Expense 83,927 87,080 88,011 931 Surplus/(Deficit) Before Reserve 298 (1,350) (949) 401 Reserve - 1,000 1,000 -SURPLUS/(DEFICIT) 298 (2,350) (1,949) 401 * Third-quarter fiscal forecast as at December 31, 2006.
2006-07 FISCAL OUTLOOK – HIGHLIGHTS
Third-quarter results project that the Province’s fiscal outlook remains on track for a deficit of $1.9 billion in 2006-07, or $0.9 billion if the reserve is not required. This represents a $0.4 billion improvement from the 2006 Ontario Budget forecast, and is consistent with the projection reported in both the First Quarter Ontario Finances and the 2006 Ontario Economic Outlook and Fiscal Review.
The Province’s medium-term fiscal plan, as outlined in the 2006 Budget, projected a balanced budget no later than 2008-09. Higher oil prices, the stronger Canadian dollar and a weaker outlook for economic growth in the United States have led to slower projected Ontario economic growth than was anticipated at the time of the 2006 Budget. As a result, the 2006 Economic Outlook and Fiscal Review released in October revised the medium-term fiscal outlook to include deficits of $2.2 billion in 2007-08 and $1.0 billion in 2008-09 – reflecting the impact of more moderate economic growth on Ontario’s revenue outlook.
The government remains committed to eliminating the deficit. It will therefore continue to be prudent and disciplined in its approach to managing the Province’s finances. This approach, in addition to ongoing strategic investments in health care, education, infrastructure, and postsecondary education and training, will continue to strengthen the economy and ensure that Ontario is well positioned to manage both the challenges and opportunities ahead.
TERANET PROCEEDS FROM THE INITIAL PUBLIC OFFERING (IPO)
Last year, the government announced that it would receive net proceeds of $519 million from the IPO of Teranet, which it would invest in priority projects. The 2006 Economic Outlook and Fiscal Review reported that $326 million of the $519 million was invested in priority areas such as rural development and infrastructure, transit vehicle assistance, and assistance to farmers. In the third quarter, the remaining proceeds were invested in an Economic Stimulus Package to boost jobs and economic growth in Ontario. Details on these investments can be found in the Details of In-Year Changes section in this document.
For further information contact Ce rapport est disponible en françaisCommunications and Corporate Affairs Branch Pour plus de renseignements contactez(416) 325-0333 Direction des communications et des Frost Building North, Queen’s Park affaires ministérielles, (416) 325-0333 Toronto M7A 1Z1 Édifice Frost Nord, Queen’s Park, Toronto M7A 1Z1 This document is available on the Internet at: http://www.fin.gov.on.ca/english/budget/finances/2006/ofin063.html

ONTARIO FINANCES DETAILS OF IN-YEAR CHANGES
REVENUE AT $87.1 BILLION
The 2006-07 revenue outlook, at $87,062 million, is up $18 million from the forecast in the 2006 Economic Outlook and Fiscal Review. This increase is due to higher federal transfers related to the Official Languages in Education program. This is fully offset by higher spending in this program.
The 2006-07 outlook maintains the prudent approach adopted in the 2006 Economic Outlook and Fiscal Review. Revenue information received to-date suggests the potential for higher Personal Income Tax revenues in 2006-07 based on processing 2005 tax returns. Since the 2006 Economic Outlook and Fiscal Review, Ontario economic growth, notably corporate profits, has been weaker than forecast. In addition, critical revenue information that could materially affect the forecast is not expected until later in the fiscal year, notably receipt of final 2006 Corporations Tax instalment payments from most of the non-financial sector. Given continued risks and uncertainties over the remainder of the fiscal year, the 2006-07 taxation revenue outlook remains unchanged at this time.
TOTAL EXPENSE AT $88.0 BILLION
The 2006-07 total expense outlook, at $88,011 million, is up a net $18 million from the 2006 Economic Outlook and Fiscal Review, mainly due to additional in-year expense increases related to the Official Languages in Education program, fully offset by an increase of $18 million in revenue due to higher federal payments related to this program. Ministry program expense changes this quarter, and corresponding offsets, include:
♦ Ministry of Community and Social Services: An increase of $18 million to support the placement of individuals with developmental disabilities into community-based care, fully offset from the Operating Contingency Fund.
♦ Ministry of Community Safety and Correctional Services: An increase of $20 million for the Ontario Provincial Police’s extraordinary policing costs in the Town of Caledonia, fully offset from the Operating Contingency Fund.
♦ Ministry of Education: An additional $10 million was provided in-year for the Official Languages in Education program, which supports the delivery of minority-language education and second-language instruction at the elementary and secondary levels, fully offset by revenues from the federal government.
♦ Ministry of Energy: An increase of $7 million as part of the Ethanol Manufacturer's Agreement between Ontario and Suncor, which will provide a stable environment for investment in ethanol, fully offset from the Operating Contingency Fund.
♦ Ministry of the Environment: An additional $4 million, fully offset from the Operating Contingency Fund, to support climate change and clean air measures; increase the efficiency of environmental assessments; improve information for waste management; and help sustain the province's source water supplies.
♦ Ministry of Finance: An increase of $22 million for the Ontario Municipal Partnership Fund to provide municipalities with additional funding to assist with increased social programs and policing costs, fully offset from the Operating Contingency Fund.
♦ Ministry of Finance – Operating Contingency Fund: A decrease of $111 million in the Operating Contingency Fund that was allocated to fund ministries’ expense changes as outlined.
2
ONTARIO FINANCES DETAILS OF IN-YEAR CHANGES
IN-YEAR EXPENSE CHANGES, CONTINUED
♦ Ministry of Government Services: An increase of $1 million to support the management of four main projects (ServiceOntario, e-Ontario, OSS Transactional Services and OSS Supply Chain Management) and the OPS-wide Accessibility Leadership Strategy, fully offset from the Operating Contingency Fund.
♦ Ministry of Municipal Affairs and Housing: An increase of $1 million is supporting disaster relief assistance to the Township of Madawaska Valley for clean up and recovery following the August 2, 2006, tornado, fully offset from the Operating Contingency Fund.
♦ Ministry of Natural Resources: An additional $28 million for the creation of the Northern Pulp and Paper Mill Electricity Transition program, fully offset from the Operating Contingency Fund. This new program will provide up to $140 million over the next three years in electricity rebates to pulp and paper mills located in northern Ontario.
♦ Ministry of Public Infrastructure Renewal – Capital Contingency Fund: A decrease of $1 million in the Capital Contingency Fund was allocated to the Ministry of Tourism for Old Fort William flood repairs.
♦ Ministry of Tourism: An increase of $1 million to provide additional funding for rehabilitation of Old Fort William as a result of flooding, fully offset from the Capital Contingency Fund.
♦ Ministry of Training, Colleges and Universities: An increase of $10 million was provided in-year to colleges to supplement quality improvement and enhancement funding, fully offset from the Operating Contingency Fund; and an additional $8 million for colleges and universities was provided in-year for the Official Languages in Education program, which supports the delivery of minority-language education and second-language instruction at the postsecondary level, fully offset by revenues from the federal government.
ECONOMIC STIMULUS PACKAGE
To assist Ontario workers and communities most affected by slower growth in the economy, the government allocated more than $190 million from the net proceeds of the Teranet IPO remaining in the Operating Contingency Fund to an Economic Stimulus Package. The following are details of the ministry expense changes this quarter that were funded as part of the Economic Stimulus Package:
♦ Ministry of Agriculture, Food and Rural Affairs: An increase of $3 million to support infrastructure in rural Ontario.
♦ Ministry of the Attorney General: An increase of $4 million to conduct repairs and minor renovations to courthouses in smaller communities to address security, health, safety, accessibility and capacity issues.
♦ Ministry of Citizenship and Immigration: An additional $2 million for infrastructure projects and other improvements to citizenship and social infrastructure, and $1 million to support additional bridge-training programs and other services for newcomers.
♦ Ministry of Children and Youth Services: An increase of $37 million for deferred maintenance for not-for-profit agencies that provide services to vulnerable populations.
3

ONTARIO FINANCES DETAILS OF IN-YEAR CHANGES
IN-YEAR EXPENSE CHANGES, CONTINUED
♦ Ministry of Community and Social Services: An increase of $36 million for deferred maintenance for not-for-profit agencies that provide services to vulnerable populations.
♦ Ministry of Community Safety and Correctional Services: An increase of $1 million to address security, capacity and accessibility issues in two regional coroners’ facilities.
♦ Ministry of Culture: An increase of $7 million to assist over 20 arts and heritage facilities across the province in refurbishing and restoring the sites’ physical assets.
♦ Ministry of Economic Development and Trade: An additional $2 million to support communities and people that are affected by slower economic growth; and to strengthen inter-provincial trade to match Ontario’s industrial capacity to the industrial needs in Alberta.
♦ Ministry of Finance – Operating Contingency Fund: A decrease of $170 million from the Teranet IPO proceeds in the Operating Contingency Fund, which was allocated to ministries as part of the Economic Stimulus Package.
♦ Ministry of Health Promotion: An increase of $26 million for community infrastructure and multi-use facilities to promote physical activity, sport, and wellness in various communities throughout Ontario.
♦ Ministry of Tourism: An increase of $22 million to encourage tourism in Ontario.
♦ Ministry of Training, Colleges and Universities: An additional $20 million in-year to enhance the existing Adjustment Advisory Program by providing focused training and job services for laid-off workers and apprentices where plants have closed in communities most affected by slower growth in the economy; and $9 million to colleges for new construction, renovations and deferred maintenance projects in 2006-07, with the remaining total cost estimated at $21 million, amortized over 20 years.
Interest on debt expense for the year remains unchanged from the 2006 Economic Outlook and Fiscal Review at $9,204 million. This is $225 million lower than the 2006 Budget forecast due to cost-effective debt management and lower-than-forecast long-term interest rates.
RESERVE AT $1.0 BILLION
The current fiscal outlook maintains a $1.0 billion reserve to help achieve the government’s overall fiscal objectives, and to protect against unexpected and adverse changes in the economic and fiscal outlook.
4
ONTARIO FINANCES FISCAL PERFORMANCE
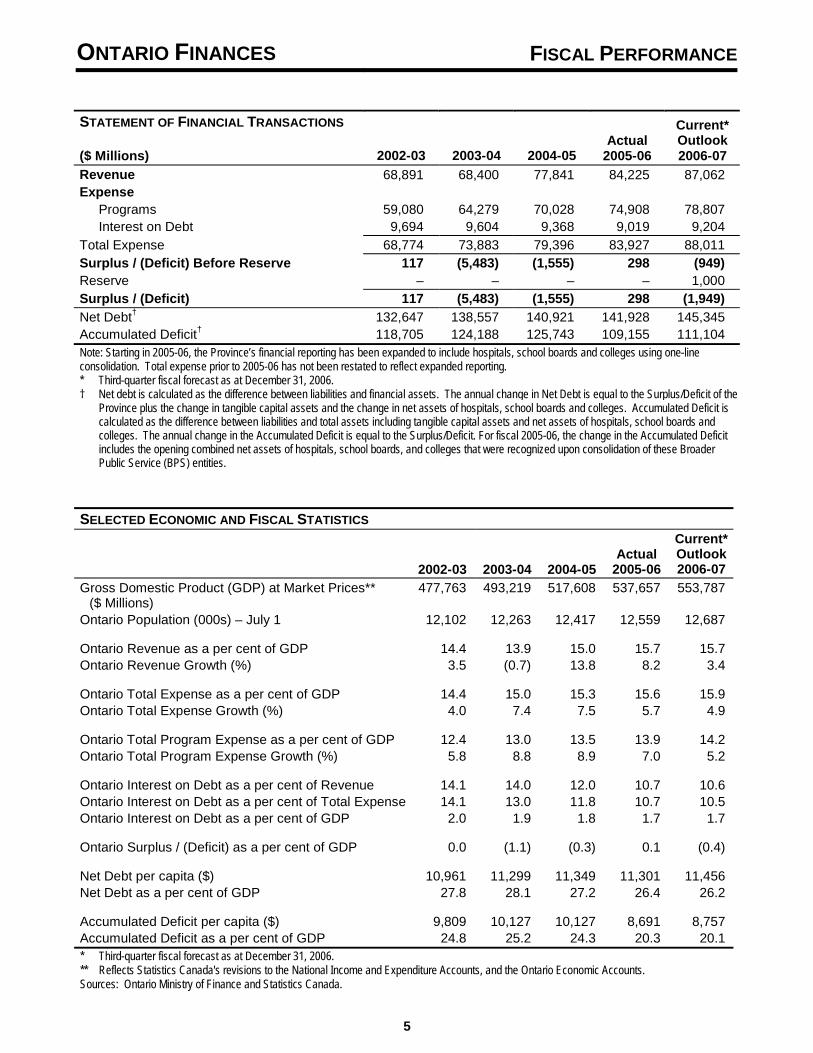
STATEMENT OF FINANCIAL TRANSACTIONS Current* Actual Outlook
($ Millions) 2002-03 2003-04 2004-05 2005-06 2006-07 Revenue 68,891 68,400 77,841 84,225 87,062 Expense
Programs 59,080 64,279 70,028 74,908 78,807 Interest on Debt 9,694 9,604 9,368 9,019 9,204
Total Expense 68,774 73,883 79,396 83,927 88,011 Surplus / (Deficit) Before Reserve 117 (5,483) (1,555) 298 (949) Reserve – – – – 1,000 Surplus / (Deficit) 117 (5,483) (1,555) 298 (1,949) Net Debt† 132,647 138,557 140,921 141,928 145,345 Accumulated Deficit† 118,705 124,188 125,743 109,155 111,104 Note: Starting in 2005-06, the Province’s financial reporting has been expanded to include hospitals, school boards and colleges using one-line consolidation. Total expense prior to 2005-06 has not been restated to reflect expanded reporting. * Third-quarter fiscal forecast as at December 31, 2006. † Net debt is calculated as the difference between liabilities and financial assets. The annual change in Net Debt is equal to the Surplus/Deficit of the
Province plus the change in tangible capital assets and the change in net assets of hospitals, school boards and colleges. Accumulated Deficit is calculated as the difference between liabilities and total assets including tangible capital assets and net assets of hospitals, school boards and colleges. The annual change in the Accumulated Deficit is equal to the Surplus/Deficit. For fiscal 2005-06, the change in the Accumulated Deficit includes the opening combined net assets of hospitals, school boards, and colleges that were recognized upon consolidation of these Broader Public Service (BPS) entities.
SELECTED ECONOMIC AND FISCAL STATISTICS
Current* Actual Outlook
2002-03 2003-04 2004-05 2005-06 2006-07 Gross Domestic Product (GDP) at Market Prices** 477,763 493,219 517,608 537,657 553,787
($ Millions) Ontario Population (000s) – July 1 12,102 12,263 12,417 12,559 12,687
Ontario Revenue as a per cent of GDP 14.4 13.9 15.0 15.7 15.7 Ontario Revenue Growth (%) 3.5 (0.7) 13.8 8.2 3.4
Ontario Total Expense as a per cent of GDP 14.4 15.0 15.3 15.6 15.9 Ontario Total Expense Growth (%) 4.0 7.4 7.5 5.7 4.9
Ontario Total Program Expense as a per cent of GDP 12.4 13.0 13.5 13.9 14.2 Ontario Total Program Expense Growth (%) 5.8 8.8 8.9 7.0 5.2
Ontario Interest on Debt as a per cent of Revenue 14.1 14.0 12.0 10.7 10.6 Ontario Interest on Debt as a per cent of Total Expense 14.1 13.0 11.8 10.7 10.5 Ontario Interest on Debt as a per cent of GDP 2.0 1.9 1.8 1.7 1.7
Ontario Surplus / (Deficit) as a per cent of GDP 0.0 (1.1) (0.3) 0.1 (0.4)
Net Debt per capita ($) 10,961 11,299 11,349 11,301 11,456 Net Debt as a per cent of GDP 27.8 28.1 27.2 26.4 26.2
Accumulated Deficit per capita ($) 9,809 10,127 10,127 8,691 8,757 Accumulated Deficit as a per cent of GDP 24.8 25.2 24.3 20.3 20.1 * Third-quarter fiscal forecast as at December 31, 2006. ** Reflects Statistics Canada's revisions to the National Income and Expenditure Accounts, and the Ontario Economic Accounts.Sources: Ontario Ministry of Finance and Statistics Canada.
5
ONTARIO FINANCES ECONOMIC PERFORMANCE
ONTARIO ECONOMIC OUTLOOK
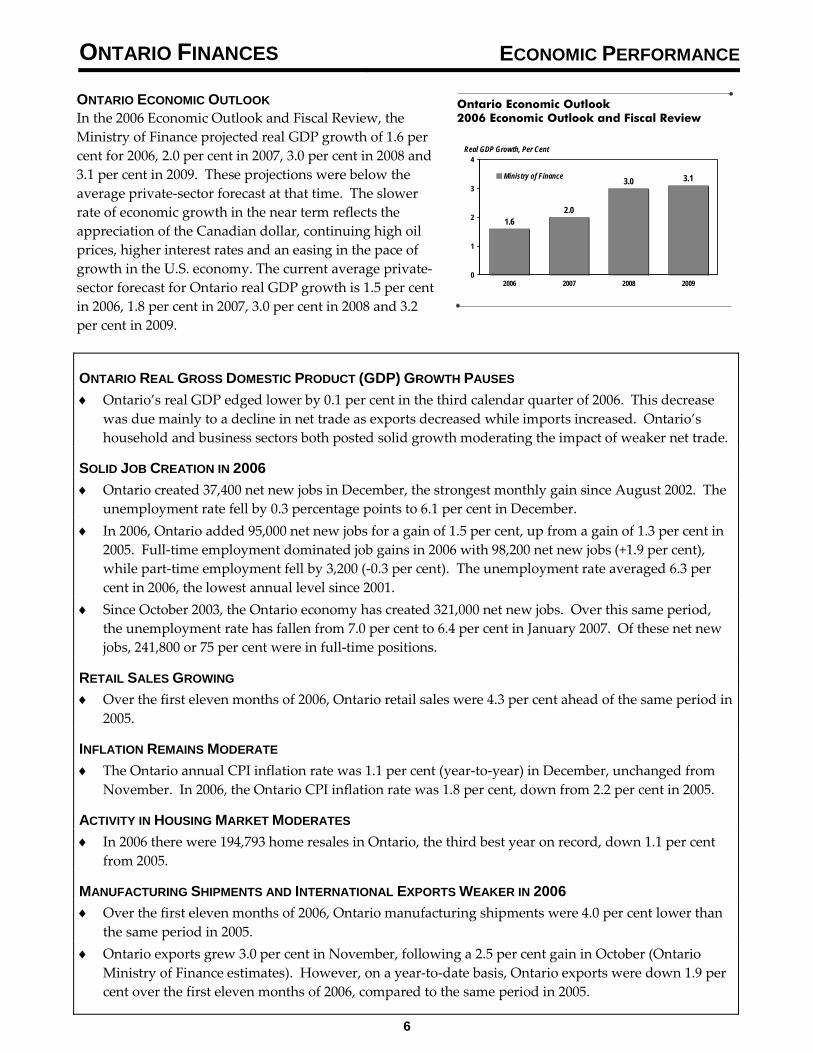
In the 2006 Economic Outlook and Fiscal Review, the Ministry of Finance projected real GDP growth of 1.6 per cent for 2006, 2.0 per cent in 2007, 3.0 per cent in 2008 and 3.1 per cent in 2009. These projections were below the average private-sector forecast at that time. The slower rate of economic growth in the near term reflects the appreciation of the Canadian dollar, continuing high oil prices, higher interest rates and an easing in the pace of growth in the U.S. economy. The current average private-sector forecast for Ontario real GDP growth is 1.5 per cent in 2006, 1.8 per cent in 2007, 3.0 per cent in 2008 and 3.2 per cent in 2009.
Ontario Economic Outlook 2006 Economic Outlook and Fiscal Review
Real GDP Growth, Per Cent 4
3
2
1
02006 2007 2008 2009
1.6 2.0
3.0 3.1 Ministry of Finance
ONTARIO REAL GROSS DOMESTIC PRODUCT (GDP) GROWTH PAUSES
♦ Ontario’s real GDP edged lower by 0.1 per cent in the third calendar quarter of 2006. This decrease was due mainly to a decline in net trade as exports decreased while imports increased. Ontario’s household and business sectors both posted solid growth moderating the impact of weaker net trade.
SOLID JOB CREATION IN 2006 ♦ Ontario created 37,400 net new jobs in December, the strongest monthly gain since August 2002. The
unemployment rate fell by 0.3 percentage points to 6.1 per cent in December. ♦ In 2006, Ontario added 95,000 net new jobs for a gain of 1.5 per cent, up from a gain of 1.3 per cent in
2005. Full-time employment dominated job gains in 2006 with 98,200 net new jobs (+1.9 per cent), while part-time employment fell by 3,200 (-0.3 per cent). The unemployment rate averaged 6.3 per cent in 2006, the lowest annual level since 2001.
♦ Since October 2003, the Ontario economy has created 321,000 net new jobs. Over this same period, the unemployment rate has fallen from 7.0 per cent to 6.4 per cent in January 2007. Of these net new jobs, 241,800 or 75 per cent were in full-time positions.
RETAIL SALES GROWING
♦ Over the first eleven months of 2006, Ontario retail sales were 4.3 per cent ahead of the same period in 2005.
INFLATION REMAINS MODERATE
♦ The Ontario annual CPI inflation rate was 1.1 per cent (year-to-year) in December, unchanged from November. In 2006, the Ontario CPI inflation rate was 1.8 per cent, down from 2.2 per cent in 2005.
ACTIVITY IN HOUSING MARKET MODERATES
♦ In 2006 there were 194,793 home resales in Ontario, the third best year on record, down 1.1 per cent from 2005.
MANUFACTURING SHIPMENTS AND INTERNATIONAL EXPORTS WEAKER IN 2006 ♦ Over the first eleven months of 2006, Ontario manufacturing shipments were 4.0 per cent lower than
the same period in 2005. ♦ Ontario exports grew 3.0 per cent in November, following a 2.5 per cent gain in October (Ontario
Ministry of Finance estimates). However, on a year-to-date basis, Ontario exports were down 1.9 per cent over the first eleven months of 2006, compared to the same period in 2005.
6

ONTARIO FINANCES ECONOMIC TRENDS AND PERFORMANCE
KEY ECONOMIC INDICATORS(Per Cent Change from previous period, unless indicated otherwise)
Annual Annual Quarterly
2004 2005 05:3 05:4 06:1 06:2 06:3 Output (Seasonally Adjusted at Annual Rates)
Real GDP Ontario 3.2 2.8 0.5 0.3 0.4 0.2 (0.1) Nominal GDP Ontario 4.9 3.9 1.3 0.3 0.7 0.6 0.1
Annual Annual Monthly 2006
2005 2006 Aug Sep Oct Nov Dec Other Indicators (Seasonally Adjusted) Labour Markets
Labour Force (Change in 000s) 74 78 (24) 7 (16) 21 18 Employment (Change in 000s) 81 95 (15) (6) 2 18 37 Unemployment Rate (%) 6.6 6.3 6.4 6.6 6.3 6.4 6.1
Household Sector Retail Sales 4.7 N/A 1.1 (1.7) (0.6) 0.7 N/A
Housing Starts (000s)* 78.8 73.4 66.8 63.8 69.8 68.1 65.9 MLS Home Resales** (0.2) (1.1) (7.3) (7.9) (1.3) (5.0) 6.4
Manufacturing Shipments (1.4) N/A (0.0) (4.0) (0.4) 3.7 N/A Transportation Equipment (0.9) N/A (2.4) (5.4) (0.5) 10.2 N/A
Consumer Price Index** 2.2 1.8 1.5 0.2 0.6 1.1 1.1 Sources: Statistics Canada, Ontario Ministry of Finance, Canada Mortgage and Housing Corporation, Canadian Real Estate Association. * Monthly housing starts are expressed at a seasonally adjusted annual rate.** Per cent change from a year earlier. N/A = Data not available.
7

8

ONTARIO FINANCES FINANCIAL TABLES
9

650
REVENUE
($ Millions) 2006-07 Actual Budget Current* In-Year
2005-06 Plan Outlook Change Taxation Revenue Personal Income Tax 21,041 Retail Sales Tax 15,554 Corporations Tax 9,984 Employer Health Tax 4,197 Ontario Health Premium 2,350 Gasoline Tax 2,281 Fuel Tax 729 Tobacco Tax 1,379 Land Transfer Tax 1,159 Electricity Payments-In-Lieu of Taxes 951 Other Taxes 292
59,917
21,671 22,321 16,165 16,165 – 9,845 9,585 (260) 4,314 4,299 (15) 2,551 2,541 (10) 2,303 2,303 –
742 742 – 1,485 1,405 (80) 1,125 1,125 –
790 790 – 283 283 –
61,274 61,559 Government of Canada Canada Health Transfer (CHT) 7,148 Canada Social Transfer (CST) 3,324 CHST Supplements 584 Social Housing 520 Infrastructure Programs 285 Wait Times Reduction Fund 243 Medical Equipment Funds 194 Canada-Ontario Agreement 2 2006 Federal Budget Trusts – Other Government of Canada 951
13,251
7,619 7,619 – 3,420 3,420 –
– – – 530 530 – 359 359 – 467 467 –
– – – 285 285 –
– 456 456 902 920 18
13,582 14,056 474
1,743 1,743 – 1,254 1,254 –
919 919 – 4 4 –
3,920 3,920 –
Income from Investment in Government Business Enterprises Ontario Lottery and Gaming Corporation 2,027 Liquor Control Board of Ontario 1,197 Ontario Power Generation Inc. and Hydro One Inc. 1,107 Other Government Enterprises (23)
4,308 Other Non-Tax Revenue Reimbursements 1,295 Electricity Debt Retirement Charge 1,021 Vehicle and Driver Registration Fees 763 Power Sales 779 Other Fees and Licences 550 Liquor Licence Revenue 516 Net Reduction of Power Purchase Contract Liability 396 Sales and Rentals 465 Royalties 191 Miscellaneous Other Non-Tax Revenue 773
6,749
1,358 1,358 – 1,027 1,027 – 1,021 1,021 –
988 988 – 556 556 – 453 453 – 412 412 – 396 969 243 243 – 500 500 –
6,954 7,527 TOTAL REVENUE 84,225 85,730 87,062 1,332 * Third-quarter fiscal forecast as at December 31, 2006.
10
285
573
573

TOTAL EXPENSE
($ Millions) 2006-07 Actual Budget Current* In-Year
Ministry 2005-06 Plan Outlook Change Agriculture, Food and Rural Affairs** 865 880 880 –
One-Time and Extraordinary Assistance 282 16 125 109 Attorney General 1,291 1,301 1,305 4 Board of Internal Economy 150 169 169 – Children and Youth Services 3,330 3,264 3,316 52 Citizenship and Immigration 93 91 94 3 Community and Social Services 6,737 7,045 7,124 79 Community Safety and Correctional Services 1,767 1,887 1,908 21 Culture 475 366 373 7 Democratic Renewal Secretariat 2 10 10 – Economic Development and Trade 202 351 355 4 Education 418 438 446 8 School Boards† 10,886 11,182 11,229 47
Teachers’ Pension Plan (TPP) 295 408 408 – Energy 207 229 249 20 Environment 275 302 306 4 Executive Offices 19 19 19 – Finance 1,034 1,060 1,167 107
Interest on Debt 9,019 9,429 9,204 (225) Community Reinvestment Fund / Ontario Municipal 714 731 753 22
Partnership Fund Power Purchases 803 988 988 –
Operating Contingency Fund – 995 1,011 16 Government Services 562 736 812 76
Pension and Other Employee Future Benefits Health and Long-Term Care††
Hospitals†,††
729 17,722 14,816
594 18,682 16,359
594 18,687 16,463
– 5
104 Health Promotion 296 363 389 26 Intergovernmental Affairs 10 9 9 – Labour 141 150 150 – Municipal Affairs and Housing 928 693 694 1 Natural Resources 632 682 834 152 Northern Development and Mines 337 347 347 – Office of Francophone Affairs 4 4 4 – Public Infrastructure Renewal** 107 114 190 76
Capital Contingency Fund – 175 168 (7) Research and Innovation 370 345 345 – Secretariat for Aboriginal Affairs 50 21 21 – Tourism 210 161 184 23 Training, Colleges and Universities
Colleges† 3,529 1,185
3,876 1,359
3,899 1,383
23 24
Transportation 2,203 1,943 2,093 150 Move Ontario 1,232 6 6 –
Year-End Savings – (700) (700) – TOTAL EXPENSE 83,927 87,080 88,011 931 * Third-quarter fiscal forecast as at December 31, 2006. ** The 2006-07 in-year change for Public Infrastructure Renewal includes a re-allocation of $70 million for rural infrastructure spending that was
reported in Agriculture, Food and Rural Affairs in the 2006 Economic Outlook and Fiscal Review. † Starting in 2005-06 the Province’s financial reporting has been expanded to include hospitals, school boards and colleges using one-line
consolidation. As a result, these amounts reflect the net expense of these sectors. †† The Budget Plan figures have been restated to reflect a change in the presentation of expense in the Health Sector to be consistent with the
2005-06 Public Accounts. This change in presentation does not affect total expense, or the surplus/deficit of the Province.
11

2006–07 INFRASTRUCTURE EXPENDITURES
($ Millions) 2006-07* Total Transfers
Infrastructure Investment and Other Total Expenditures in Capital Expenditures in Infrastructure
2005-06 Actual Assets Infrastructure** Expenditures Transportation Transit 1,541 546 547 1,093 Highways 1,237 1,295 116 1,411 Other Transportation 494 2 60 62 Health Hospitals 296 305 – 305 Other Health 166 32 172 204 Education School Boards 949 – 1,110 1,110 Colleges 44 34 9 43 Universities 88 – 27 27 Water/Environment 342 10 229 239 Municipal and Local Infrastructure† 455 2 486 488 Justice 84 64 57 121 Other 468 290 306 596 TOTAL
†† 6,164 2,580 3,119 5,699 * Third-quarter fiscal forecast as at December 31, 2006. ** Mainly consists of transfers for capital purposes to municipalities and universities, expenditures for servicing capital-related debt of schools, and
expenditures for the repair and rehabilitation of schools. These expenditures are included in the Province’s Total Expenses in the Total Expense Table.
† Municipal and local water and wastewater infrastructure investments are included in the Water/Environment sector. †† Total expenditures include $36 million in flow-throughs in Investment in Capital Assets (for provincial highways) and $208 million in flow-throughs
in Transfers and Other Expenditures in Infrastructure ($31 million in Transportation, $26 million in Water/Environment, $150 million in Municipal and Local Infrastructure, and $1 million in Other Infrastructure).
12

ONTARIO’S 2006-07 FINANCING PROGRAM
CONSOLIDATED PROVINCE AND ONTARIO ELECTRICITY FINANCIAL CORPORATION
($ Millions) 2006-07
Actual 2005-06
Budget Plan
Current* Outlook
In-Year Change
Deficit/(Surplus) (298) 2,350 1,949 (401) Adjustments for:
Non-Cash Items Included in Deficit 3,887 1,058 428 (630) Amortization of Major Tangible Capital Assets (815) (2,228) (2,277) (49)
Investment in Capital Assets 1,675 2,544 2,580 36 Debt Maturities 19,805 15,140 14,627 (513) Debt Redemptions 1,134 700 1,041 341 Canada Pension Plan Borrowing (996) (351) (185) 166 Increase/(Decrease) in Cash and Cash Equivalents (788) – – – Decrease/(Increase) in Short-Term Borrowing (1,771) 1,371 1,517 146 Other Uses/(Sources) of Cash 2,014 247 743 496 Total Long-Term Public Borrowing Requirement 23,847 20,831 20,423 (408) * Third-quarter fiscal forecast as at December 31, 2006.
BORROWING PROGRAM STATUS (AS AT DECEMBER 31, 2006) ($ Billions)
Completed Remaining Total Province 13.7 3.2 16.9 Ontario Electricity Financial Corporation 2.3 1.2 3.5 TOTAL 16.0 4.4 20.4
Numbers may not add due to rounding.
♦ Long-Term Public Borrowing undertaken as at December 31, 2006, was $16.0 billion as follows:
($ Billions) Ontario Savings Bonds 1.4 Domestic Issues 10.1 Global/US Dollar Issues 4.1 Euro Medium-Term Notes 0.4
16.0
♦ The $630 million decline in non-cash items included in the deficit is a result of the net impact of the $1.1 billion cash transfer from the federal trusts.
♦ The $49 million decline in amortization of major tangible capital assets is due to lower amortization for hospitals.
♦ The $36 million increase in investments in capital assets reflects higher-than-expected acquisition of land and buildings.
13
ONTARIO’S 2006-07 FINANCING PROGRAM
♦ The $513 million decline in Debt Maturities is mainly due to debt issues with callable or extendible features that were shifted into future years.
♦ The $341 million increase in Debt Redemptions is a result of higher-than-forecast redemptions of Ontario Savings Bonds.
♦ $166 million in Canada Pension Plan (CPP) borrowing was used by the Province to repurchase outstanding debt and was therefore unavailable for long-term public borrowing.
♦ The $146 million decrease in short-term borrowing is mainly due to a decline in Treasury Bills outstanding.
♦ The $496 million increase in other uses of cash is mainly attributable to new loans to school boards, partially offset by other items such as lower-than-planned Ontario Power Generation loan utilization, and a reduced drawdown on the Ontario Power Authority line of credit.
14