Embed Size (px)
Citation preview
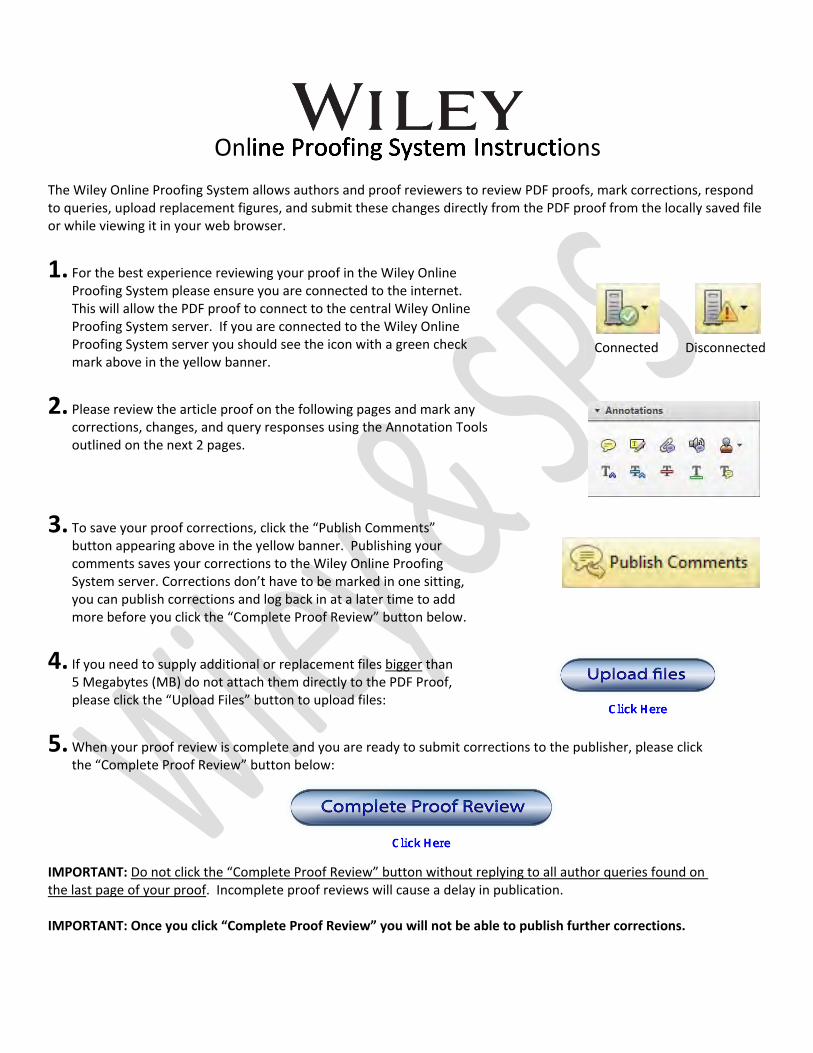
Online Proofing System Instructions The Wiley Online Proofing System allows authors and proof reviewers to review PDF proofs, mark corrections, respond to queries, upload replacement figures, and submit these changes directly from the PDF proof from the locally saved file or while viewing it in your web browser.
1. For the best experience reviewing your proof in the Wiley Online Proofing System please ensure you are connected to the internet. This will allow the PDF proof to connect to the central Wiley Online Proofing System server. If you are connected to the Wiley Online Proofing System server you should see the icon with a green check mark above in the yellow banner.
2. Please review the article proof on the following pages and mark any corrections, changes, and query responses using the Annotation Tools outlined on the next 2 pages.
3. To save your proof corrections, click the “Publish Comments” button appearing above in the yellow banner. Publishing your comments saves your corrections to the Wiley Online Proofing System server. Corrections don’t have to be marked in one sitting, you can publish corrections and log back in at a later time to add more before you click the “Complete Proof Review” button below.
4. If you need to supply additional or replacement files bigger than 5 Megabytes (MB) do not attach them directly to the PDF Proof, please click the “Upload Files” button to upload files:
5. When your proof review is complete and you are ready to submit corrections to the publisher, please click the “Complete Proof Review” button below:
IMPORTANT: Do not click the “Complete Proof Review” button without replying to all author queries found on the last page of your proof. Incomplete proof reviews will cause a delay in publication.
IMPORTANT: Once you click “Complete Proof Review” you will not be able to publish further corrections.
Online Proofing System Instructions
Connected Disconnected
USING e-ANNOTATION TOOLS FOR ELECTRONIC PROOF CORRECTION
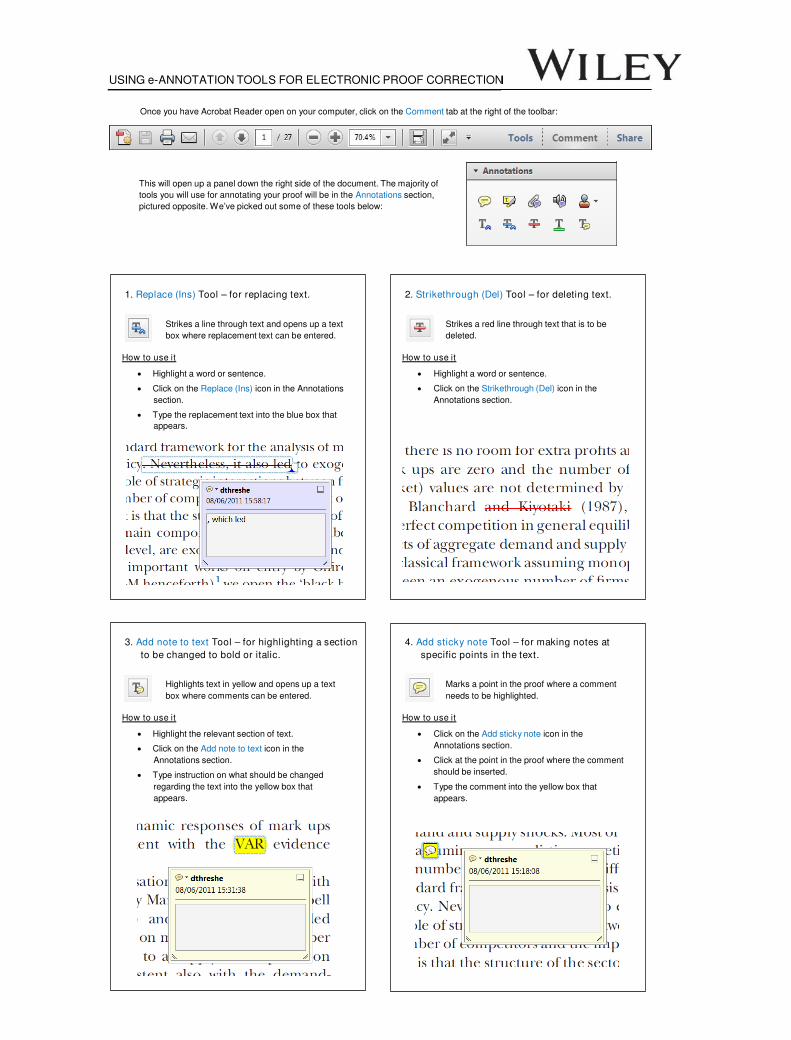
Once you have Acrobat Reader open on your computer, click on the Comment tab at the right of the toolbar:
This will open up a panel down the right side of the document. The majority of
tools you will use for annotating your proof will be in the Annotations section,
pictured opposite. We’ve picked out some of these tools below:
1. Replace (Ins) Tool – for replacing text.
Strikes a line through text and opens up a text
box where replacement text can be entered.
How to use it
‚ Highlight a word or sentence.
‚ Click on the Replace (Ins) icon in the Annotations
section.
‚ Type the replacement text into the blue box that
appears.
2. Strikethrough (Del) Tool – for deleting text.
Strikes a red line through text that is to be
deleted.
How to use it
‚ Highlight a word or sentence.
‚ Click on the Strikethrough (Del) icon in the
Annotations section.
3. Add note to text Tool – for highlighting a section
to be changed to bold or italic.
Highlights text in yellow and opens up a text
box where comments can be entered.
How to use it
‚ Highlight the relevant section of text.
‚ Click on the Add note to text icon in the
Annotations section.
‚ Type instruction on what should be changed
regarding the text into the yellow box that
appears.
4. Add sticky note Tool – for making notes at
specific points in the text.
Marks a point in the proof where a comment
needs to be highlighted.
How to use it
‚ Click on the Add sticky note icon in the
Annotations section.
‚ Click at the point in the proof where the comment
should be inserted.
‚ Type the comment into the yellow box that
appears.
USING e-ANNOTATION TOOLS FOR ELECTRONIC PROOF CORRECTION
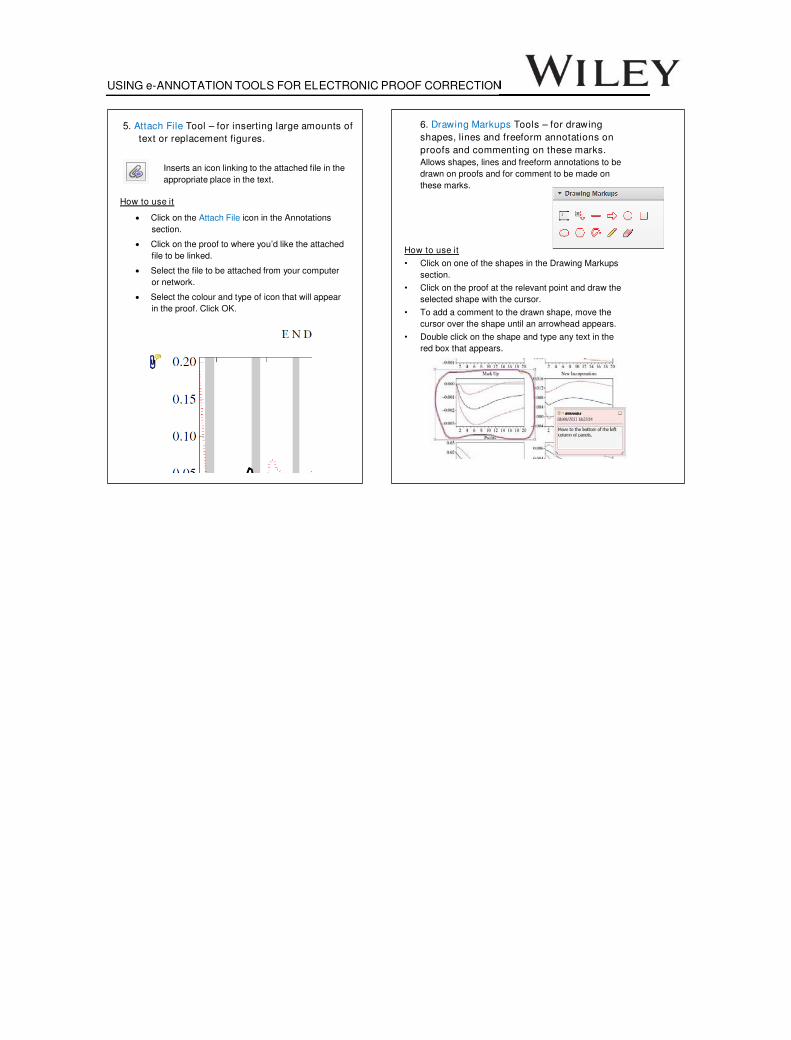
5. Attach File Tool – for inserting large amounts of
text or replacement figures.
Inserts an icon linking to the attached file in the
appropriate place in the text.
How to use it
‚ Click on the Attach File icon in the Annotations
section.
‚ Click on the proof to where you’d like the attached
file to be linked.
‚ Select the file to be attached from your computer
or network.
‚ Select the colour and type of icon that will appear
in the proof. Click OK.
6. Drawing Markups Tools – for drawing
shapes, lines and freeform annotations on
proofs and commenting on these marks.
Allows shapes, lines and freeform annotations to be
drawn on proofs and for comment to be made on
these marks.
How to use it
" Click on one of the shapes in the Drawing Markups
section.
" Click on the proof at the relevant point and draw the
selected shape with the cursor.
" To add a comment to the drawn shape, move the
cursor over the shape until an arrowhead appears.
" Double click on the shape and type any text in the
red box that appears.
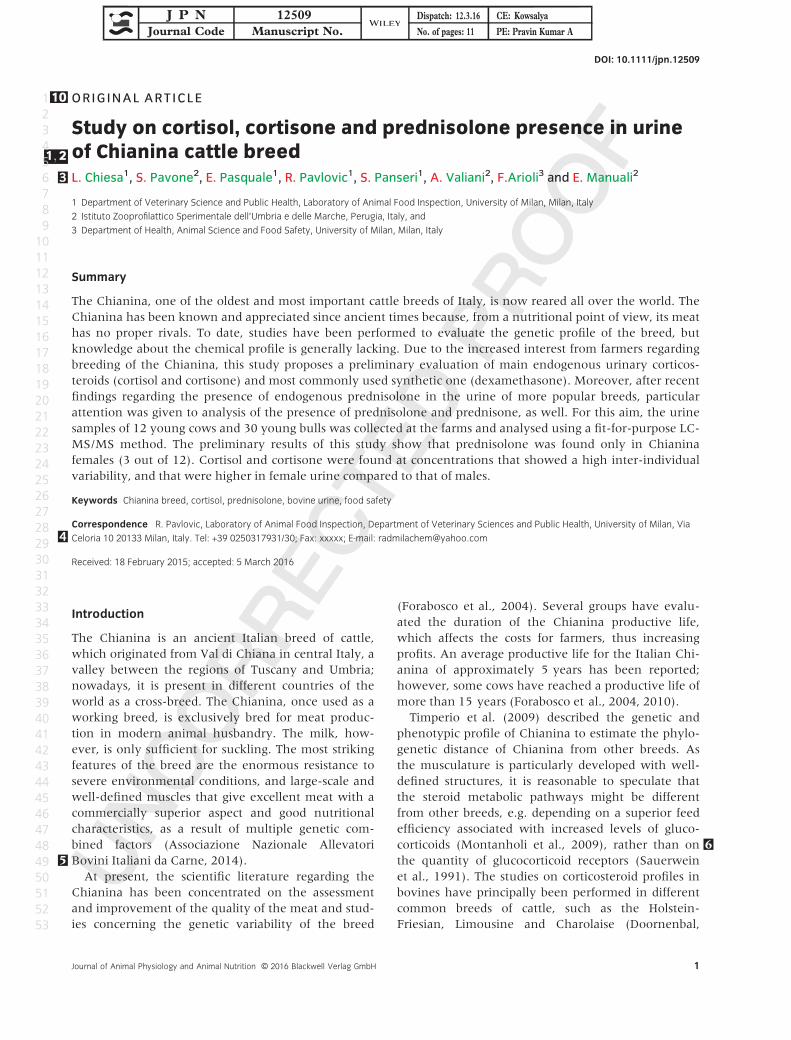
ORIGINAL ARTICLE10
Study on cortisol, cortisone and prednisolone presence in urine
of Chianina cattle breed1;21;2
L. Chiesa1, S. Pavone2, E. Pasquale1, R. Pavlovic1, S. Panseri1, A. Valiani2, F.Arioli3 and E. Manuali23
1 Department of Veterinary Science and Public Health, Laboratory of Animal Food Inspection, University of Milan, Milan, Italy
2 Istituto Zooprofilattico Sperimentale dell’Umbria e delle Marche, Perugia, Italy, and
3 Department of Health, Animal Science and Food Safety, University of Milan, Milan, Italy
Summary
The Chianina, one of the oldest and most important cattle breeds of Italy, is now reared all over the world. The
Chianina has been known and appreciated since ancient times because, from a nutritional point of view, its meat
has no proper rivals. To date, studies have been performed to evaluate the genetic profile of the breed, but
knowledge about the chemical profile is generally lacking. Due to the increased interest from farmers regarding
breeding of the Chianina, this study proposes a preliminary evaluation of main endogenous urinary corticos-
teroids (cortisol and cortisone) and most commonly used synthetic one (dexamethasone). Moreover, after recent
findings regarding the presence of endogenous prednisolone in the urine of more popular breeds, particular
attention was given to analysis of the presence of prednisolone and prednisone, as well. For this aim, the urine
samples of 12 young cows and 30 young bulls was collected at the farms and analysed using a fit-for-purpose LC-
MS/MS method. The preliminary results of this study show that prednisolone was found only in Chianina
females (3 out of 12). Cortisol and cortisone were found at concentrations that showed a high inter-individual
variability, and that were higher in female urine compared to that of males.
Keywords Chianina breed, cortisol, prednisolone, bovine urine, food safety
Correspondence R. Pavlovic, Laboratory of Animal Food Inspection, Department of Veterinary Sciences and Public Health, University of Milan, Via
Celoria 10 20133 Milan, Italy. Tel: +39 0250317931/30; Fax: xxxxx; E-mail: [email protected]
Received: 18 February 2015; accepted: 5 March 2016
Introduction
The Chianina is an ancient Italian breed of cattle,
which originated from Val di Chiana in central Italy, a
valley between the regions of Tuscany and Umbria;
nowadays, it is present in different countries of the
world as a cross-breed. The Chianina, once used as a
working breed, is exclusively bred for meat produc-
tion in modern animal husbandry. The milk, how-
ever, is only sufficient for suckling. The most striking
features of the breed are the enormous resistance to
severe environmental conditions, and large-scale and
well-defined muscles that give excellent meat with a
commercially superior aspect and good nutritional
characteristics, as a result of multiple genetic com-
bined factors (Associazione Nazionale Allevatori
Bovini Italiani da Carne, 2014)5 .
At present, the scientific literature regarding the
Chianina has been concentrated on the assessment
and improvement of the quality of the meat and stud-
ies concerning the genetic variability of the breed
(Forabosco et al., 2004). Several groups have evalu-
ated the duration of the Chianina productive life,
which affects the costs for farmers, thus increasing
profits. An average productive life for the Italian Chi-
anina of approximately 5 years has been reported;
however, some cows have reached a productive life of
more than 15 years (Forabosco et al., 2004, 2010).
Timperio et al. (2009) described the genetic and
phenotypic profile of Chianina to estimate the phylo-
genetic distance of Chianina from other breeds. As
the musculature is particularly developed with well-
defined structures, it is reasonable to speculate that
the steroid metabolic pathways might be different
from other breeds, e.g. depending on a superior feed
efficiency associated with increased levels of gluco-
corticoids (Montanholi et al., 2009) 6, rather than on
the quantity of glucocorticoid receptors (Sauerwein
et al., 1991). The studies on corticosteroid profiles in
bovines have principally been performed in different
common breeds of cattle, such as the Holstein-
Friesian, Limousine and Charolaise (Doornenbal,
1
2
3
4
5
6
7
8
9
10
11
12
13
14
15
16
17
18
19
20
21
22
23
24
25
26
27
28
29
30
31
32
33
34
35
36
37
38
39
40
41
42
43
44
45
46
47
48
49
50
51
52
53
Journal of Animal Physiology and Animal Nutrition © 2016 Blackwell Verlag GmbH 1
DOI: 10.1111/jpn.12509
J P N 12509 Dispatch: 12.3.16 CE: Kowsalya
Journal Code Manuscript No. No. of pages: 11 PE: Pravin Kumar A
1977;7 Ferranti et al., 2011; Pegolo et al., 2012; Ber-
tocchi et al., 2013; Pavlovic et al., 2013). However,
there is a lack of knowledge about the steroid profile
in particular breeds of cattle, including the ancient
Italian Chianina.
The corticosteroids, peculiarly glucocorticoids, are a
class of steroid hormones that are synthesized and
secreted by the zona fasciculata of the adrenal cortex.
Cortisol (CL) is the most important glucocorticoid,
exhibiting important immunological, cardiovascular,
homeostatic and metabolic functions, and is converted
into the inactive metabolite, cortisone (CN), mainly in
the liver (Osamu, 2001; Shimada et al., 2001). Besides
this, CL, measured in different matrices and in various
species, is frequently considered a stress-sensitive
marker (Carlsson et al., 2007; Mongillo et al., 2014;
Ott et al., 2014). In the European Union (UE), corti-
costeroid use in cattle is permitted only for therapeutic
aims. However, their illegal use as growth promoters,
either alone or in association with anabolic steroids, to
improve the quality and quantity of meat in young
bull and beef, cannot be excluded. Uncontrolled
administration of these substances could be a risk for
meat consumers due to the intense pharmacological
activities of these compounds (Courtheyn et al.,
2002).
Therefore, the use of these compounds is strictly
regulated by European legislation: the Commission
Regulation (EEC) No 37/2010 establishes maximum
residue limits (MRLs) for betamethasone, dexametha-
sone (DX), methylprednisolone and prednisolone (PL)
in milk and tissues intended for human consumption.
Corticosteroids are allocated in the group B2f (other
pharmacologically active substances) by the EU Coun-
cil Directive 96/23/EC as amended. Monitoring of
corticosteroids in livestock, as with other pharmacolog-
ically substances, is usually carried out both in the farm
and at the slaughterhouse, as stated e.g. by the Italian
National Residue Control Plan (Italian Ministry of
Health; Dept. of Food Safety and Veterinary Public
Health, 2014)8 . On farms, the controls should be per-
formed through the analysis of urine, while the matri-
ces sampled at the slaughterhouse are urine and liver,
a tissue for which MRLs are set.
Over the past 5 years, a strong debate has arisen
regarding the origin of PL. As a matter of fact, a signifi-
cant increase of PL positive cases has been observed in
cattle (European Commission Staff Working Docu-
ment, 2010), and its endogenous presence has been
shown in horses (Fidani et al., 2012); also, it was
recently reported in the urine of pigs (mainly sampled
at the slaughterhouse) by different Member States of
the European Union (De Rijke et al., 2014)9 .
On the basis of these results, the unique exoge-
nous origin of PL in urine has been questioned. PL
could naturally occur in the urine as a result of
microbial contamination from faecal or environ-
mental origin due to poor collection and storage
operations (Arioli et al., 2010) or due to stressful
conditions to which bovines are exposed during
transport and slaughtering (Pompa et al., 2011).
Those authors indubitably demonstrated the favour-
able influence of stress to the presence of urine PL
by an in vivo experiment where the samples were
collected taking into consideration all the safety
precautions to have the stress as single variable.
Particularly, the production of PL was examined
after its pharmacological induction given by the
treatment with a synthetic analogue of adrenocorti-
cotropic hormone, and taking into account the
stress related to transport and slaughter procedures.
All urine samples collected after the treatment and
at the slaughter presented PL. The presence of PL
was also evaluated in the adrenal glands, responsi-
ble for the production of the corticosteroids, but
contrary with expectations, the glands seem to have
a secondary role in the production of PL (Bertocchi
et al., 2013). In the same article, author brought a
hypothesis regarding the PL production in the gut
by the intestinal microflora activities. Nevertheless,
a satisfied explanation on the metabolic pathway
implicated in the mechanism of synthesis of PL has
not yet been provided (Nebbia et al., 2014).
Highly significant data arises from the study
recently published by De Rijke et al. (2014). The
authors demonstrated that CL could be in vitro
transformed into PL by action of S9 fraction of liver
enzymes. This fraction of liver homogenate con-
tains: the microsomal compartment with enzymes
that are implied in phase I metabolism (i.e. cyto-
chrome P450 isoforms) and the cytosolic portion
that contains transferases, enzymes involved in
phase II metabolism. It remains to be established
which of those enzymes is responsible for introduc-
tion of double bond into C1-C2 position of CL A
ring.
Furthermore, treatment with synthetic glucocorti-
coids could interfere with the production and
release of endogenous ones (Mazzarino et al.,
2006). On the other hand, limited information is
available regarding the endogenous glucocorticoid
profile in bovine urine samples, and only a few
studies have been undertaken to analyse natural
corticosteroids in the urine of untreated bovines or
in those treated with synthetic corticosteroids (Savu
et al., 1996; Capolongo et al., 2007; Ferranti et al.,
Journal of Animal Physiology and Animal Nutrition © 2016 Blackwell Verlag GmbH2
Corticosteroids in urine of Chianina cattle breed L. Chiesa et al.
1
2
3
4
5
6
7
8
9
10
11
12
13
14
15
16
17
18
19
20
21
22
23
24
25
26
27
28
29
30
31
32
33
34
35
36
37
38
39
40
41
42
43
44
45
46
47
48
49
50
51
52
53
2011; Vincenti et al., 2012; Leporati et al., 2013;
Nebbia et al., 2014). The inhibitory effects of PL
and dexamethasone could eventually be evaluated
by analysis of the ratio of CL to CN. Therefore, the
evaluation of natural corticosteroids may be consid-
ered a tool for defining a condition regarding the
abuse of therapeutic agents (Pavlovic et al., 2012).
Because the literature on the characterisation of
corticosteroids in Chianina urine is not yet available,
the main objective of our study was to obtain a pre-
liminary evaluation of the physiological levels of CL
and CN in the urine of Chianina young bulls and
young cows. To this aim, a fit-for-purpose LC-MS/MS
method was developed and applied. Moreover, PL was
examined to check the possibility of its endogenous
presence. Additionally, eventual illicit treatments
either with prednisone (PN), the oxidised PL metabo-
lite, or with DX (the most frequently used synthetic
corticosteroid), could also be accessed by our LC-MS/
MS method.
Materials and methods
Chemicals and reagents
CL, CN, PL, PN and DX were purchased from Sigma-
Aldrich (St. Louis, MO, USA). The internal standard
prednisolone-d6 was from CDN Isotopes (Pointe-
Claire, Quebec, Canada). All other chemicals were
from Fluka Chemie GmbH (Buchs, Switzerland).
Ultrapure water was obtained through a Milli-Q sys-
tem (Millipore, Molsheim, France). Standard stock
solutions were prepared in methanol (1 mg/ml) and
stored at �40 °C. Working solutions were prepared
daily by diluting the stock solutions with methanol/
water (50:50, v/v).
Sample preparation
The following extraction procedure was optimized:
4 mL of organic mixture (tert-butyl methyl ether and
ethyl acetate, 4:1) was added to a 2 ml urine sample
which had been previously spiked with prednisolone-
d6 (PD6, final concentration 2 ng/ml) used as internal
standard (IS). After shaking in a vertical rotary shaker
for 20 min, the sample was centrifuged at 1300 g for
15 min. The upper organic layer was collected with a
Pasteur pipette, transferred to a 10 ml glass tube and
dried under vacuum in a centrifugal evaporator at a
temperature of 30 °C. The residue was dissolved in
200 ll of the mobile phase (50% methanol and 50%
formic acid in a 0.1% aqueous solution) and trans-
ferred to vials for HPLC–MS/MS analysis. The injec-
tion volume was 20 ll.
Urine collection
Forty-two healthy Chianina beef (12 young cows and
30 young bulls) aged between 11 and 23 months were
reared in two selected farms in the Perugia province,
and submitted to periodic unplanned checks for resi-
dues of corticosteroid molecules included in the
National Residues Control Plans (Italian Ministry of
Health; Dept. of Food Safety and Veterinary Public
Health, 2014).
Regarding the housing, animals were kept outside
pens with overhead shelter with deep litter. All the
animals received the same feed, which was ad libitum.
Feed ingredients were consisted of corn meal, field
beans, middling of durum wheat, straw and hay
ground.
Urine samples were collected at the farm into long-
handled sterile container during the spontaneous mic-
turition. The sampling was done in the morning
between 8.00 and 11.00 AM.
A visual inspection was made to check the turbidity
or the presence of raw materials. Only clean urine was
sampled, frozen and taken to the laboratory for the
storage at �40 °C, until extraction and analysis.
Instrumentation
LC MS/MS analysis was carried out by a Thermo Fin-
nigan HPLC system (Thermo Fisher, San Jos�e, CA,
USA), consisting in a Surveyor MS quaternary pump
with a degasser, and a Surveyor AS autosampler, a
column oven and a Rheodyne valve with 20 ll sample
loop. The mass spectrometer system was a TSQ Quan-
tum triple quadrupole (Thermo Fisher Scientific, San
Jose, CA, USA) equipped with an electrospray inter-
face (ESI) set in the negative polarity ionisation mode.
The analysis was performed in multiple reaction mon-
itoring (MRM). Acquisition data were recorded and
elaborated using XCALIBURTM software from Thermo.
LC Conditions
Analytical separations were achieved using a Synergi
Hydro RP reverse-phase HPLC column
150 9 2.0 mm, with an internal diameter of 4 lm,
and a C18 guard column measuring 4 9 3.0 mm
(Phenomenex, Torrance, CA, USA), at a column oven
temperature of 30 °C. Binary gradient profiles were
developed using a water solution of 0.1% formic acid
(A) and methanol (B) at a flow rate of 250 ll/min.
The chromatographic conditions regarding phase B
were as follows: from 25 to 70% 0–20 min; achieving
95% in the 21st min, holding for 3 min, returning to
Journal of Animal Physiology and Animal Nutrition © 2016 Blackwell Verlag GmbH 3
L. Chiesa et al. Corticosteroids in urine of Chianina cattle breed
1
2
3
4
5
6
7
8
9
10
11
12
13
14
15
16
17
18
19
20
21
22
23
24
25
26
27
28
29
30
31
32
33
34
35
36
37
38
39
40
41
42
43
44
45
46
47
48
49
50
51
52
53
starting values in the 26th min, and finally equilibrat-
ing up to the 31st min.
MS/MS conditions
The LC instrument was coupled to a TSQ Quantum,
triple quadrupole mass spectrometer with an electro-
spray ionisation source (ESI) set in the negative mode.
Acquisition parameters were optimized in the ion
spray mode with direct continuous pump-syringe
infusion of standard solutions of the analytes at the
concentration of 1 lg/ml at a flow rate of the syringe
of 10 ll/min and a pump flow rate of 100 ll/min in
the ion source of the mass spectrometer.
The optimized parameters were the following: capil-
lary voltage 3200V; ion transfer capillary temperature
340 °C; and sheath and auxiliary gas (nitrogen) were
fixed at 30 and 10 (arbitrary units), respectively. The
collision gas was argon at 1.5 mTorr and the peak res-
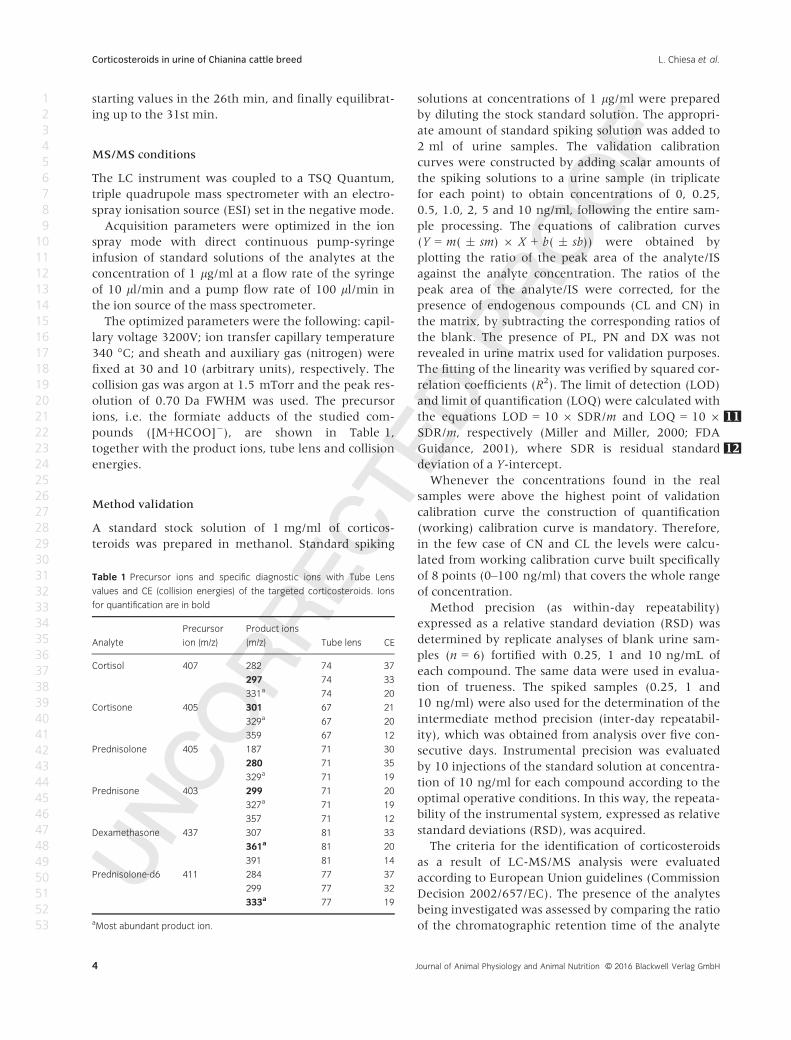
olution of 0.70 Da FWHM was used. The precursor
ions, i.e. the formiate adducts of the studied com-
pounds ([M+HCOO]�), are shown in Table 1,
together with the product ions, tube lens and collision
energies.
Method validation
A standard stock solution of 1 mg/ml of corticos-
teroids was prepared in methanol. Standard spiking
solutions at concentrations of 1 lg/ml were prepared
by diluting the stock standard solution. The appropri-
ate amount of standard spiking solution was added to
2 ml of urine samples. The validation calibration
curves were constructed by adding scalar amounts of
the spiking solutions to a urine sample (in triplicate
for each point) to obtain concentrations of 0, 0.25,
0.5, 1.0, 2, 5 and 10 ng/ml, following the entire sam-
ple processing. The equations of calibration curves
(Y = m( � sm) 9 X + b( � sb)) were obtained by
plotting the ratio of the peak area of the analyte/IS
against the analyte concentration. The ratios of the
peak area of the analyte/IS were corrected, for the
presence of endogenous compounds (CL and CN) in
the matrix, by subtracting the corresponding ratios of
the blank. The presence of PL, PN and DX was not
revealed in urine matrix used for validation purposes.
The fitting of the linearity was verified by squared cor-
relation coefficients (R2). The limit of detection (LOD)
and limit of quantification (LOQ) were calculated with
the equations LOD = 10 9 SDR/m 11and LOQ = 10 9
SDR/m, respectively (Miller and Miller, 2000; FDA
Guidance, 2001) 12, where SDR is residual standard
deviation of a Y-intercept.
Whenever the concentrations found in the real
samples were above the highest point of validation
calibration curve the construction of quantification
(working) calibration curve is mandatory. Therefore,
in the few case of CN and CL the levels were calcu-
lated from working calibration curve built specifically
of 8 points (0–100 ng/ml) that covers the whole range
of concentration.
Method precision (as within-day repeatability)
expressed as a relative standard deviation (RSD) was
determined by replicate analyses of blank urine sam-
ples (n = 6) fortified with 0.25, 1 and 10 ng/mL of
each compound. The same data were used in evalua-
tion of trueness. The spiked samples (0.25, 1 and
10 ng/ml) were also used for the determination of the
intermediate method precision (inter-day repeatabil-
ity), which was obtained from analysis over five con-
secutive days. Instrumental precision was evaluated
by 10 injections of the standard solution at concentra-
tion of 10 ng/ml for each compound according to the
optimal operative conditions. In this way, the repeata-
bility of the instrumental system, expressed as relative
standard deviations (RSD), was acquired.
The criteria for the identification of corticosteroids
as a result of LC-MS/MS analysis were evaluated
according to European Union guidelines (Commission
Decision 2002/657/EC). The presence of the analytes
being investigated was assessed by comparing the ratio
of the chromatographic retention time of the analyte
Table 1 Precursor ions and specific diagnostic ions with Tube Lens
values and CE (collision energies) of the targeted corticosteroids. Ions
for quantification are in bold
Analyte
Precursor
ion (m/z)
Product ions
(m/z) Tube lens CE
Cortisol 407 282 74 37
297 74 33
331a 74 20
Cortisone 405 301 67 21
329a 67 20
359 67 12
Prednisolone 405 187 71 30
280 71 35
329a 71 19
Prednisone 403 299 71 20
327a 71 19
357 71 12
Dexamethasone 437 307 81 33
361a 81 20
391 81 14
Prednisolone-d6 411 284 77 37
299 77 32
333a 77 19
aMost abundant product ion.
Journal of Animal Physiology and Animal Nutrition © 2016 Blackwell Verlag GmbH4
Corticosteroids in urine of Chianina cattle breed L. Chiesa et al.
1
2
3
4
5
6
7
8
9
10
11
12
13
14
15
16
17
18
19
20
21
22
23
24
25
26
27
28
29
30
31
32
33
34
35
36
37
38
39
40
41
42
43
44
45
46
47
48
49
50
51
52
53
to that of the internal standard; the relative retention
time of the analyte should correspond to that of the
calibration solution at a tolerance of �2.5%. Three
transitions were monitored for each analyte with a
signal-to-noise ratio greater than 3. All ion ratios of
compounds from real samples were within the recom-
mended tolerances when compared with the stan-
dards. The quantifier ion was the one with the highest
signal-to-noise value of the three diagnostic ions.
Statistical analysis
All calculations regarding the method validation were
performed in EXCEL software (Microsoft Corp., USA)
using the multiple linear regression analysis.
The Shapiro-Wilk test used to check the normality
of results of two datasets (young cows’ and young
bulls’ results). Based on the response of the normality
test, non-parametric Mann–Whitney Rank Sum Test
was used to check the differences between the median
values of two datasets. The statistical analysis was per-
formed using SIGMA STAT (Statistical Analysis System,
version 2.03) statistical software package (Jandel Sci-
entific GmbH, Herckrath, Germany). A p-value13 of
<0.05 was defined as the level of statistical signifi-
cance.
Results and discussion
Method validation
A fit-for-purpose LC–MS/MS method was developed
to analyse Chianina urine samples for different corti-
costeroids. Urine sampling was strictly performed as
recommended by the Italian National Residue Control
Plan; particular care was taken to exclude any possible
role played by faecal bacteria in the neo-formation of
PL that could give false positive results, as previously
reported (Arioli et al., 2010; Italian Ministry of
Health; Dept. of Food Safety and Veterinary Public
Health, 2014). The instrumental precision, expressed
as the relative standard deviation (RSD), was in the
range 2.8–7.2% for all of the analysed corticosteroids,
which is considered as a very good repeatability of the
instrumental system with stabile LC-MS/MS response.
Good linearity was obtained for matrix calibration
curves with correlation coefficients higher than 0.998
for all compounds in the observed concentration
range. The within-day precision (also the trueness)
was evaluated for three spiking levels (0.25, 1 and
10 ng/ml). In particular, the lowest spiked level gave
the highest RSD values in range 14–19.3%, while
other two were below 13.2%. The inter-day precision
was between 13% and 20.3%. These precision values
were lower than 22%, which was the value proposed
by Thompson (2000).
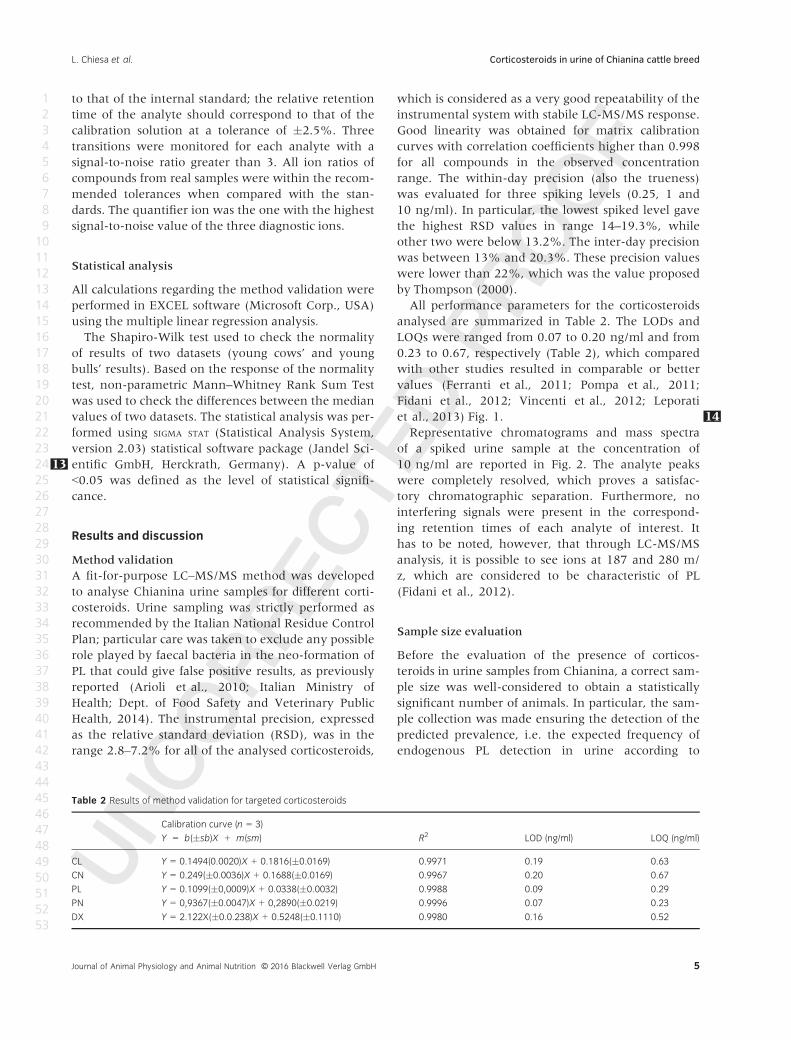
All performance parameters for the corticosteroids
analysed are summarized in Table 2. The LODs and
LOQs were ranged from 0.07 to 0.20 ng/ml and from
0.23 to 0.67, respectively (Table 2), which compared
with other studies resulted in comparable or better
values (Ferranti et al., 2011; Pompa et al., 2011;
Fidani et al., 2012; Vincenti et al., 2012; Leporati
et al., 2013) Fig. 1 14.
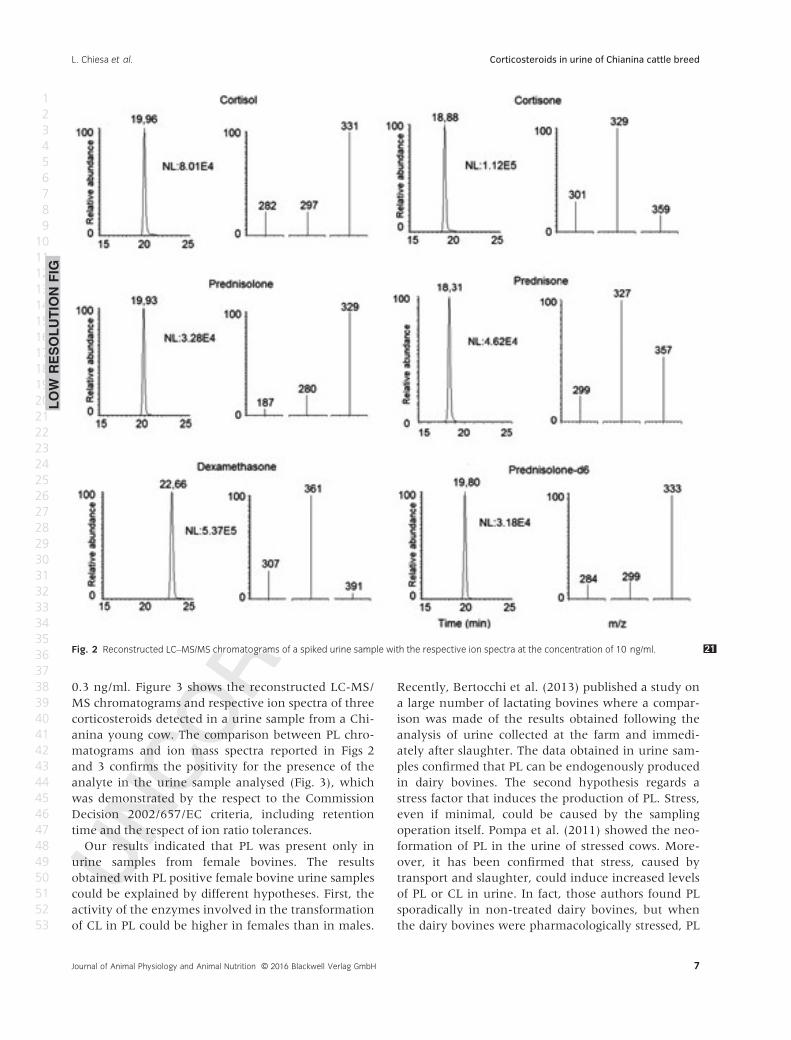
Representative chromatograms and mass spectra
of a spiked urine sample at the concentration of
10 ng/ml are reported in Fig. 2. The analyte peaks
were completely resolved, which proves a satisfac-
tory chromatographic separation. Furthermore, no
interfering signals were present in the correspond-
ing retention times of each analyte of interest. It
has to be noted, however, that through LC-MS/MS
analysis, it is possible to see ions at 187 and 280 m/
z, which are considered to be characteristic of PL
(Fidani et al., 2012).
Sample size evaluation
Before the evaluation of the presence of corticos-
teroids in urine samples from Chianina, a correct sam-
ple size was well-considered to obtain a statistically
significant number of animals. In particular, the sam-
ple collection was made ensuring the detection of the
predicted prevalence, i.e. the expected frequency of
endogenous PL detection in urine according to
Table 2 Results of method validation for targeted corticosteroids
Calibration curve (n = 3)
Y = b(�sb)X + m(sm) R2 LOD (ng/ml) LOQ (ng/ml)
CL Y = 0.1494(0.0020)X + 0.1816(�0.0169) 0.9971 0.19 0.63
CN Y = 0.249(�0.0036)X + 0.1688(�0.0169) 0.9967 0.20 0.67
PL Y = 0.1099(�0,0009)X + 0.0338(�0.0032) 0.9988 0.09 0.29
PN Y = 0,9367(�0.0047)X + 0,2890(�0.0219) 0.9996 0.07 0.23
DX Y = 2.122X(�0.0.238)X + 0.5248(�0.1110) 0.9980 0.16 0.52
Journal of Animal Physiology and Animal Nutrition © 2016 Blackwell Verlag GmbH 5
L. Chiesa et al. Corticosteroids in urine of Chianina cattle breed
1
2
3
4
5
6
7
8
9
10
11
12
13
14
15
16
17
18
19
20
21
22
23
24
25
26
27
28
29
30
31
32
33
34
35
36
37
38
39
40
41
42
43
44
45
46
47
48
49
50
51
52
53
Bottarelli and Ostianello (2011), the sample size is cal-
culated trough the following formula:
n ¼1:962 � P � ð1� PÞ
ðDÞ2
1.96 - the Z constant or deviation from the mean
value accepted to get the desired confidence level.
When the level of significance is 5% and the confi-
dence level is 95%, the Z constant should be 1.96;
P - the expected or frequency of sample positive for
the presence of PL;
D - the required precision.
Existing data on the frequency of PL detection suit-
able were mainly from urine sample of race horses
(78.5%; Fidani et al., 2012) and of bovine taken from
the slaughterhouse (cows at slaughter = 71% positive;
Bertocchi et al., 2013). Less data on sample urine of
bovine collected at the farm were available. A percent-
age of urine samples positive for PL at the farm of six
was calculated by Bertocchi et al. (2013), while a 5%
of urine bovine sampled at the farm was reported by
Vincenti et al. (2012). The author, however, evi-
denced that all these samples had a concentration
value of PL lower than reported detection limits. Fer-
ranti et al. (2011) reported a frequency of PL detec-
tion for urine sampled collected at the farm of 7%
and, recently, De Rijke et al. (2014) showed a fre-
quency of detection of the corticosteroid of 40%, but
in this work, the place of urine collection was not
mentioned.
Based on the frequencies reported regarding the
samples collected at the farm, it might be supposed a
prevalence for PL detection in Chianina urine of 6%
(P = 0.06); and a precision of �10% (D = 0.1). Hence,
applying the above-mentioned formula the required
sample size would be 21 animals. Finally, sample size
was extended to 42 considering the variability of the
samples in term of gender of the animals, age and dif-
ferent farm origin.
Analysis of Chianina urine samples
Based on previous researches and our own experi-
ence, we studied only free steroids in Chianina urine
samples. In particular, Antignac et al. (2002) revealed
that enzymatic hydrolysis proved to be unnecessary
for the cleavage of conjugated CL glucuronide and sul-
phate forms, as almost all CL in bovines is in its free
form. To some extent, this disagrees with the results
shown by Arioli et al. (2012), who found a significant
increase in CL concentration after enzymatic deconju-
gation. However, with regard to PL, Arioli et al.
(2012) showed that utilization of beta-glucuronidase is
not indispensable, as this corticosteroid is present
almost exclusively in bovine urine in its free form. In
addition, the deconjugation process itself can nega-
tively influence the accuracy of analyte measure-
ments (Pozo et al., 2008). Taking all of this into
account, we chose to perform our analysis on the free
form of the corticosteroids of interest.
The evaluation of corticosteroid profile in Chianina
urine was performed on 12 young cows and 32 young
bulls. The data obtained in the current study are pre-
sented in Tables 3A and 3B. All of the samples anal-
ysed were below the LOD regarding PN and DX. PL
was absent in all of the male urine samples analysed.
With regard to females, PL was detected in 3 of the 12
urine samples at concentrations of 1.5, 0.6 and
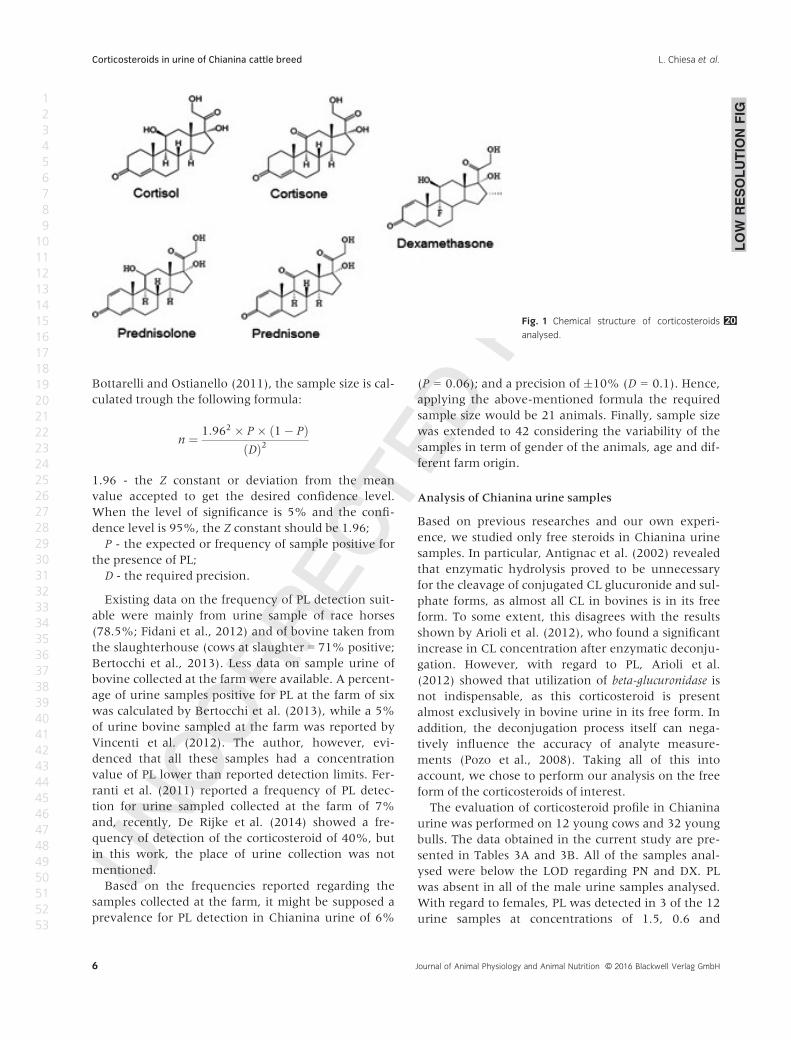
Fig. 1 20Chemical structure of corticosteroids
analysed.
LOW
RESOLUTIO
NFIG
Journal of Animal Physiology and Animal Nutrition © 2016 Blackwell Verlag GmbH6
Corticosteroids in urine of Chianina cattle breed L. Chiesa et al.
1
2
3
4
5
6
7
8
9
10
11
12
13
14
15
16
17
18
19
20
21
22
23
24
25
26
27
28
29
30
31
32
33
34
35
36
37
38
39
40
41
42
43
44
45
46
47
48
49
50
51
52
53
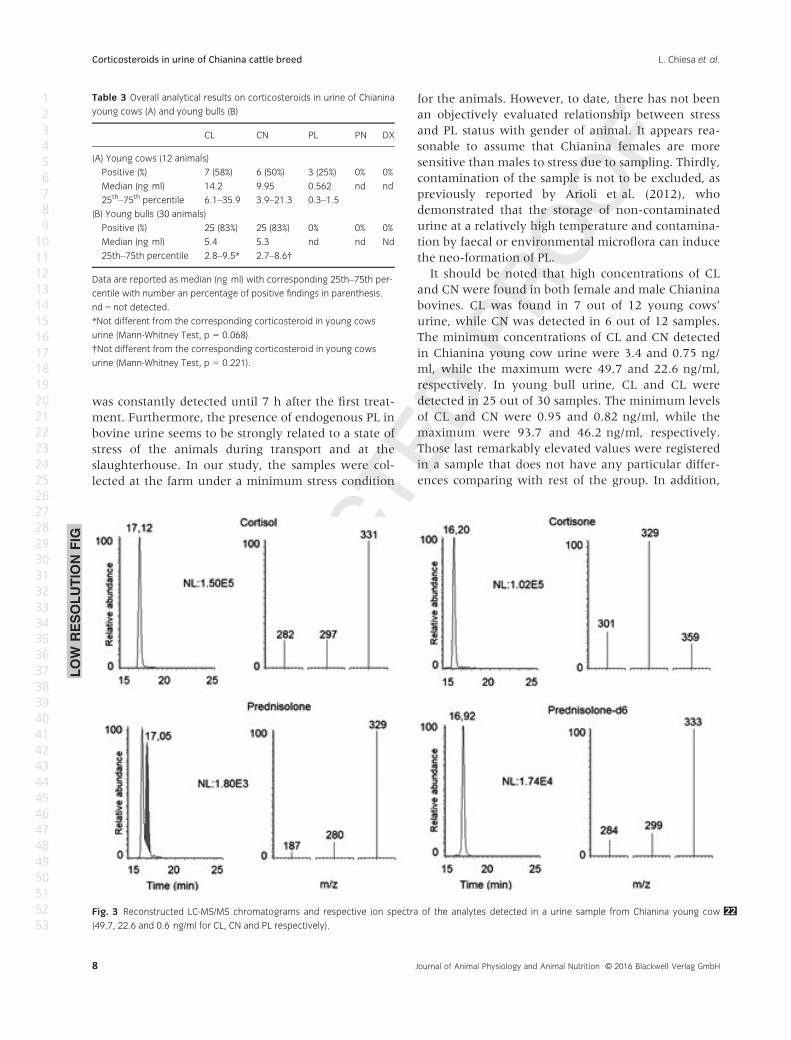
0.3 ng/ml. Figure 3 shows the reconstructed LC-MS/
MS chromatograms and respective ion spectra of three
corticosteroids detected in a urine sample from a Chi-
anina young cow. The comparison between PL chro-
matograms and ion mass spectra reported in Figs 2
and 3 confirms the positivity for the presence of the
analyte in the urine sample analysed (Fig. 3), which
was demonstrated by the respect to the Commission
Decision 2002/657/EC criteria, including retention
time and the respect of ion ratio tolerances.
Our results indicated that PL was present only in
urine samples from female bovines. The results
obtained with PL positive female bovine urine samples
could be explained by different hypotheses. First, the
activity of the enzymes involved in the transformation
of CL in PL could be higher in females than in males.
Recently, Bertocchi et al. (2013) published a study on
a large number of lactating bovines where a compar-
ison was made of the results obtained following the
analysis of urine collected at the farm and immedi-
ately after slaughter. The data obtained in urine sam-
ples confirmed that PL can be endogenously produced
in dairy bovines. The second hypothesis regards a
stress factor that induces the production of PL. Stress,
even if minimal, could be caused by the sampling
operation itself. Pompa et al. (2011) showed the neo-
formation of PL in the urine of stressed cows. More-
over, it has been confirmed that stress, caused by
transport and slaughter, could induce increased levels
of PL or CL in urine. In fact, those authors found PL
sporadically in non-treated dairy bovines, but when
the dairy bovines were pharmacologically stressed, PL
Fig. 2 21Reconstructed LC–MS/MS chromatograms of a spiked urine sample with the respective ion spectra at the concentration of 10 ng/ml.
LOW
RESOLUTIO
NFIG
Journal of Animal Physiology and Animal Nutrition © 2016 Blackwell Verlag GmbH 7
L. Chiesa et al. Corticosteroids in urine of Chianina cattle breed
1
2
3
4
5
6
7
8
9
10
11
12
13
14
15
16
17
18
19
20
21
22
23
24
25
26
27
28
29
30
31
32
33
34
35
36
37
38
39
40
41
42
43
44
45
46
47
48
49
50
51
52
53
was constantly detected until 7 h after the first treat-
ment. Furthermore, the presence of endogenous PL in
bovine urine seems to be strongly related to a state of
stress of the animals during transport and at the
slaughterhouse. In our study, the samples were col-
lected at the farm under a minimum stress condition
for the animals. However, to date, there has not been
an objectively evaluated relationship between stress
and PL status with gender of animal. It appears rea-
sonable to assume that Chianina females are more
sensitive than males to stress due to sampling. Thirdly,
contamination of the sample is not to be excluded, as
previously reported by Arioli et al. (2012), who
demonstrated that the storage of non-contaminated
urine at a relatively high temperature and contamina-
tion by faecal or environmental microflora can induce
the neo-formation of PL.
It should be noted that high concentrations of CL
and CN were found in both female and male Chianina
bovines. CL was found in 7 out of 12 young cows’
urine, while CN was detected in 6 out of 12 samples.
The minimum concentrations of CL and CN detected
in Chianina young cow urine were 3.4 and 0.75 ng/
ml, while the maximum were 49.7 and 22.6 ng/ml,
respectively. In young bull urine, CL and CL were
detected in 25 out of 30 samples. The minimum levels
of CL and CN were 0.95 and 0.82 ng/ml, while the
maximum were 93.7 and 46.2 ng/ml, respectively.
Those last remarkably elevated values were registered
in a sample that does not have any particular differ-
ences comparing with rest of the group. In addition,
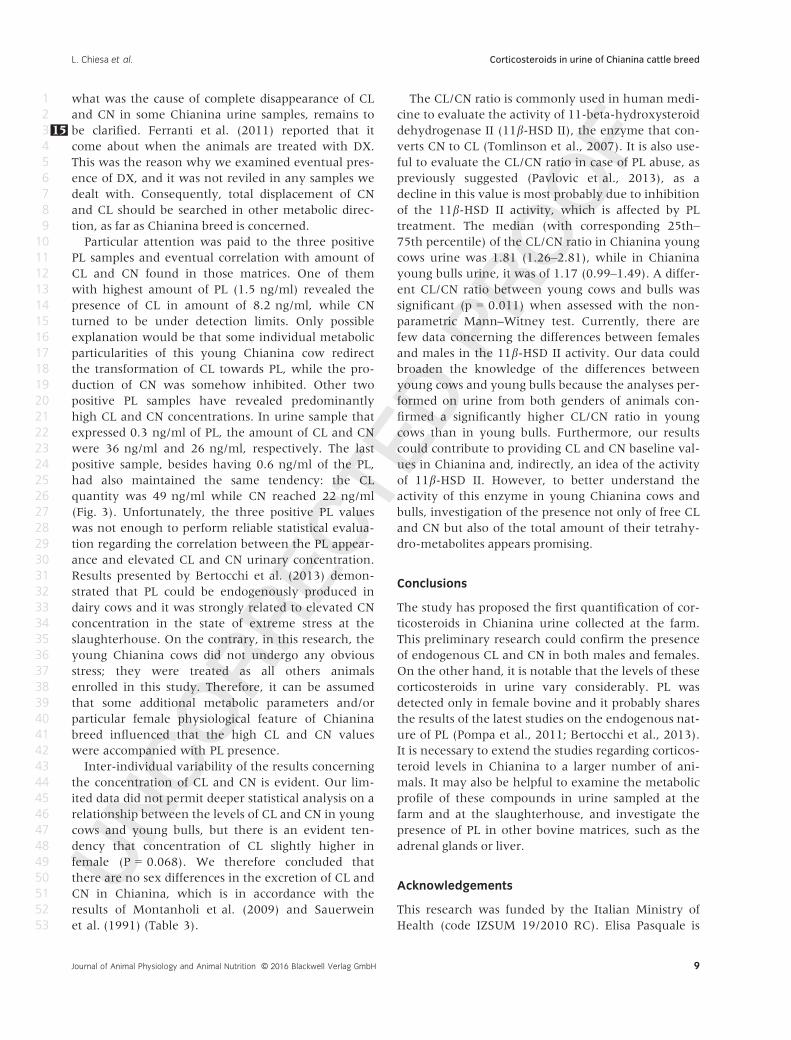
Table 3 Overall analytical results on corticosteroids in urine of Chianina
young cows (A) and young bulls (B)
CL CN PL PN DX
(A) Young cows (12 animals)
Positive (%) 7 (58%) 6 (50%) 3 (25%) 0% 0%
Median (ng ml) 14.2 9.95 0.562 nd nd
25th–75th percentile 6.1–35.9 3.9–21.3 0.3–1.5
(B) Young bulls (30 animals)
Positive (%) 25 (83%) 25 (83%) 0% 0% 0%
Median (ng ml) 5.4 5.3 nd nd Nd
25th–75th percentile 2.8–9.5* 2.7–8.6†
Data are reported as median (ng ml) with corresponding 25th–75th per-
centile with number an percentage of positive findings in parenthesis.
nd = not detected.
*Not different from the corresponding corticosteroid in young cows
urine (Mann-Whitney Test, p = 0.068).
†Not different from the corresponding corticosteroid in young cows
urine (Mann-Whitney Test, p = 0.221).
Fig. 3 22Reconstructed LC-MS/MS chromatograms and respective ion spectra of the analytes detected in a urine sample from Chianina young cow
(49.7, 22.6 and 0.6 ng/ml for CL, CN and PL respectively).
LOW
RESOLUTIO
NFIG
Journal of Animal Physiology and Animal Nutrition © 2016 Blackwell Verlag GmbH8
Corticosteroids in urine of Chianina cattle breed L. Chiesa et al.
1
2
3
4
5
6
7
8
9
10
11
12
13
14
15
16
17
18
19
20
21
22
23
24
25
26
27
28
29
30
31
32
33
34
35
36
37
38
39
40
41
42
43
44
45
46
47
48
49
50
51
52
53
what was the cause of complete disappearance of CL
and CN in some Chianina urine samples, remains to
be clarified.15 Ferranti et al. (2011) reported that it
come about when the animals are treated with DX.
This was the reason why we examined eventual pres-
ence of DX, and it was not reviled in any samples we
dealt with. Consequently, total displacement of CN
and CL should be searched in other metabolic direc-
tion, as far as Chianina breed is concerned.
Particular attention was paid to the three positive
PL samples and eventual correlation with amount of
CL and CN found in those matrices. One of them
with highest amount of PL (1.5 ng/ml) revealed the
presence of CL in amount of 8.2 ng/ml, while CN
turned to be under detection limits. Only possible
explanation would be that some individual metabolic
particularities of this young Chianina cow redirect
the transformation of CL towards PL, while the pro-
duction of CN was somehow inhibited. Other two
positive PL samples have revealed predominantly
high CL and CN concentrations. In urine sample that
expressed 0.3 ng/ml of PL, the amount of CL and CN
were 36 ng/ml and 26 ng/ml, respectively. The last
positive sample, besides having 0.6 ng/ml of the PL,
had also maintained the same tendency: the CL
quantity was 49 ng/ml while CN reached 22 ng/ml
(Fig. 3). Unfortunately, the three positive PL values
was not enough to perform reliable statistical evalua-
tion regarding the correlation between the PL appear-
ance and elevated CL and CN urinary concentration.
Results presented by Bertocchi et al. (2013) demon-
strated that PL could be endogenously produced in
dairy cows and it was strongly related to elevated CN
concentration in the state of extreme stress at the
slaughterhouse. On the contrary, in this research, the
young Chianina cows did not undergo any obvious
stress; they were treated as all others animals
enrolled in this study. Therefore, it can be assumed
that some additional metabolic parameters and/or
particular female physiological feature of Chianina
breed influenced that the high CL and CN values
were accompanied with PL presence.
Inter-individual variability of the results concerning
the concentration of CL and CN is evident. Our lim-
ited data did not permit deeper statistical analysis on a
relationship between the levels of CL and CN in young
cows and young bulls, but there is an evident ten-
dency that concentration of CL slightly higher in
female (P = 0.068). We therefore concluded that
there are no sex differences in the excretion of CL and
CN in Chianina, which is in accordance with the
results of Montanholi et al. (2009) and Sauerwein
et al. (1991) (Table 3).
The CL/CN ratio is commonly used in human medi-
cine to evaluate the activity of 11-beta-hydroxysteroid
dehydrogenase II (11b-HSD II), the enzyme that con-
verts CN to CL (Tomlinson et al., 2007). It is also use-
ful to evaluate the CL/CN ratio in case of PL abuse, as
previously suggested (Pavlovic et al., 2013), as a
decline in this value is most probably due to inhibition
of the 11b-HSD II activity, which is affected by PL
treatment. The median (with corresponding 25th–
75th percentile) of the CL/CN ratio in Chianina young
cows urine was 1.81 (1.26–2.81), while in Chianina
young bulls urine, it was of 1.17 (0.99–1.49). A differ-
ent CL/CN ratio between young cows and bulls was
significant (p = 0.011) when assessed with the non-
parametric Mann–Witney test. Currently, there are
few data concerning the differences between females
and males in the 11b-HSD II activity. Our data could
broaden the knowledge of the differences between
young cows and young bulls because the analyses per-
formed on urine from both genders of animals con-
firmed a significantly higher CL/CN ratio in young
cows than in young bulls. Furthermore, our results
could contribute to providing CL and CN baseline val-
ues in Chianina and, indirectly, an idea of the activity
of 11b-HSD II. However, to better understand the
activity of this enzyme in young Chianina cows and
bulls, investigation of the presence not only of free CL
and CN but also of the total amount of their tetrahy-
dro-metabolites appears promising.
Conclusions
The study has proposed the first quantification of cor-
ticosteroids in Chianina urine collected at the farm.
This preliminary research could confirm the presence
of endogenous CL and CN in both males and females.
On the other hand, it is notable that the levels of these
corticosteroids in urine vary considerably. PL was
detected only in female bovine and it probably shares
the results of the latest studies on the endogenous nat-
ure of PL (Pompa et al., 2011; Bertocchi et al., 2013).
It is necessary to extend the studies regarding corticos-
teroid levels in Chianina to a larger number of ani-
mals. It may also be helpful to examine the metabolic
profile of these compounds in urine sampled at the
farm and at the slaughterhouse, and investigate the
presence of PL in other bovine matrices, such as the
adrenal glands or liver.
Acknowledgements
This research was funded by the Italian Ministry of
Health (code IZSUM 19/2010 RC). Elisa Pasquale is
Journal of Animal Physiology and Animal Nutrition © 2016 Blackwell Verlag GmbH 9
L. Chiesa et al. Corticosteroids in urine of Chianina cattle breed
1
2
3
4
5
6
7
8
9
10
11
12
13
14
15
16
17
18
19
20
21
22
23
24
25
26
27
28
29
30
31
32
33
34
35
36
37
38
39
40
41
42
43
44
45
46
47
48
49
50
51
52
53
the recipient of a Cariplo Ph.D. fellowship in
Animal Production in the Laboratory of Inspection
of Food of Animal Origin at the University of
Milan.
Conflict of interest
The authors declare that they have no conflict of
interest.
References
Antignac, J. P.; Le Bizec, B.; Monteau, F.;
Andr�e, F., 2002: Study of natural and
artificial corticosteroid phase II metabo-
lites bovine urine using HPLC–MS/MS.
Steroids 67, 873–882.
Arioli, F.; Fidani, M.; Casati, A.; Fracchi-
olla, M. L.; Pompa, G., 2010: Investiga-
tion on possible transformations of
cortisol, cortisone and cortisol glu-
curonide in bovine faecal matter using
liquid chromatography-mass spectrome-
try. Steroids 75, 350–354.
Arioli, F.; Casati, A.; Fidani, M.; Silvestri,
M.; Pompa, G., 2012: Prednisolone and
prednisone neo-formation in bovine
urine after sampling. Animal 6, 1023–
1029.
Associazione Nazionale Allevatori Bovini
Italiani da Carne (ANABIC, national
association of breeders of Italian beef
cattle breeds). http://www.anabic.it/in-
dex1.htm Accessed 24 June 2014.
Bertocchi, L.; Dusi, G.; Ghidelli, V.; Hath-
away, T.; Nassuato, C.; Casati, A.;
Fidani, M.; Pompa, G.; Arioli, F., 2013:
Investigation on the origin of pred-
nisolone in urine and adrenal glands of
bovines. Food Additives & Contaminants.
Part A, Chemistry, Analysis, Control, Expo-
sure & Risk Assessment 30, 1055–1062.
Bottarelli, E.Ostianello, F. 2011. Epidemi-
ologia: Teoria ed esempi di medicina
veterinaria [Internet]. Edagricole – Edi-
zioni Agricole de Il Sole 24 ORE SpA.
113–114. Available from: http://
www.quadernodiepidemiologia.it/
epi/campion/dimens.htm
Capolongo, F.; Tapparo, M.; Merlanti, R.;
Ravarotto, L.; Tealdo, E.; Gallina, G.;
Montesissa, C.; Dacasto, M., 2007: Illicit
treatments in cattle and urinary 6beta-
hydroxycortisol/cortisol ratio. Analytica
Chimica Acta 586, 228–232.
Carlsson, H. E.; Lyberg, K.; Royo, F.; Hau,
J., 2007: Quantification of stress sensi-
tive markers in single fecal samples do
not accurately predict excretion of these
in the pig. Research in Veterinary Science
82, 423–428.
Courtheyn, D.; Le Bizec, B.; Brambilla, G.;
De Brabander, H. F.; Cobbaert, E.; Van
de Wiele, M.; Vercammen, J.; De
Wasch, K., 2002: Recent developments
in the use and abuse of growth promot-
ers. Analytica Chimica Acta 473, 71–82.
De Rijke, E.; Zoontjes, P. W.; Samson, D.;
Ostra, S.; Sterk, S. S.; van Ginkel, L. A.,
2014: Investigation of the presence of
prednisolone in bovine urine. Food Addi-
tives & Contaminants: Part A 31, 605–613.
Doornenbal, H., 1977: Physiological and
endocrine parameters in beef cattle:
breed, sex and year differences. Cana-
dian Journal of Comparative Medicine 41,
13–18.
European Commission 1996: EEC Council
Directive N° 23/1996 on measures to
monitor certain substances and residues
thereof in live animals and animal prod-
ucts and repealing Directives 85/358/
EEC and 86/469/EEC and decision 89/
187/EEC and 91/664/EEC. Official Jour-
nal of the European Communities. L 125,
10–32.16European Commission 2002: Commission
Decision of 12 August 2002 implement-
ing Council Directive 96/23/EC con-
cerning the performance of analytical
methods and the interpretation of
results. Official Journal of the European
Communities L 221, 8–36.17European Commission 2010: Commission
Regulation (EU) No 37/2010 of 22
December 2009 on pharmacologically
active substances and their classification
regarding maximum residue limits in
foodstuffs of animal origin. Official Jour-
nal of the European Communities L 15, 1–7.18European Commission Staff Working Doc-
ument (2010). Commission staff work-
ing document on the implementation of
national residue monitoring plans in the
member states in 2010 (Council Direc-
tive 96/23/EC).
Ferranti, C.; Palleschi, L.; Marchiafava, C.;
Pezzolato, M.; Bozzetta, E.; Caramelli,
M.; Draisci, R., 2011: Studies on the
presence of natural and synthetic corti-
costeroids in bovine urine. Steroids 76,
616–625.
Fidani, M.; Pompa, G.; Mungiguerra, F.;
Casati, A.; Fracchiolla, M. L.; Arioli, F.,
2012: Investigation of the presence of
endogenous prednisolone in equine
urine by high-performance liquid chro-
matography mass spectrometry and
high-resolution mass spectrometry.
Rapid Communications in Mass Spectrome-
try 26, 879–886.
Forabosco, F.; Groen, A. F.; Bozzi, R.; Van
Arendonk, J. A. M.; Filippini, F.;
Boettcher, P.; Bijma, P., 2004: Pheno-
typic relationships between longevity,
type traits and production in Chianina
beef cattle. Journal of Animal Science 82,
1572–1580.
Forabosco, F.; Boettcher, P.; Bozzi, R.;
Filippini, F.; Bijma, P., 2010: Genetic
selection strategies to improve longevity
in Chianina beef cattle. Journal of Animal
Science 5, 117–128.
Italian Ministry of Health; Dept. of Food
Safety and Veterinary Public Health.
National Residue Control Plan (NRCP),
Final Report (2014).
Leporati, M.; Capra, P.; Cannizzo, F. T.;
Biolatti, B.; Nebbia, C.; Vincenti, M.,
2013: Determination of prednisolone
metabolites in beef cattle. Food Additives
& Contaminants. Part A, Chemistry, Analy-
sis, Control, Exposure & Risk Assessment 30,
1044–1054. doi:10.1080/
19440049.2013.777975.
Mazzarino, M.; Rossi, F.; Giacomelli, L.;
Botre’, F., 2006: Effect of the systemic
versus inhalatory administration of syn-
thetic glucocorticoids on the urinary
steroid profile as studied by gas chro-
matography–mass spectrometry. Analyt-
ica Chimica Acta 559, 30–36.
Miller, N.; Miller, J. C., 2000: Statistics and
Chemometrics for Analytical Chemistry 4th
edn. Pearson Education Limited, Har-
low, UK.
Mongillo, P.; Prana, E.; Gabai, G.; Ber-
totto, D.; Marinelli, L., 2014: Effect of
age and sex on plasma cortisol and
dehydroepiandrosterone concentrations
in the dog (Canis familiaris). Research in
Veterinary Science 96, 33–38.
Montanholi, Y. R.; Swanson, K. C.; Schen-
kel, F. S.; McBride, B. W.; Caldwell, T.
R.; Miller, S. P., 2009: On the determi-
nation of residual feed intake and asso-
ciations of infrared thermography with
efficiency and ultrasound traits in beef
bulls. Livestock Science 125, 22–30.
Nebbia, C.; Capra, P.; Leporati, M.;
Girolami, F.; Barbarino, G.; Gatto, S.;
Vincenti, M., 2014: Profile of the
Journal of Animal Physiology and Animal Nutrition © 2016 Blackwell Verlag GmbH10
Corticosteroids in urine of Chianina cattle breed L. Chiesa et al.
1
2
3
4
5
6
7
8
9
10
11
12
13
14
15
16
17
18
19
20
21
22
23
24
25
26
27
28
29
30
31
32
33
34
35
36
37
38
39
40
41
42
43
44
45
46
47
48
49
50
51
52
53
urinary excretion of prednisolone and
its metabolites in finishing bulls and
cows treated with a therapeutic sched-
ule. BMC Veterinary Research 10, 237.
Osamu, N., 2001: Review: steroid analysis
for medical diagnosis. Journal of Chro-
matography A 935, 267–278.
Ott, S.; Soler, L.; Moons, C. P.; Kashiha,
M. A.; Bahr, C.; Vandermeulen, J.; Jans-
sens, S.; Guti�errez, A. M.; Escribano, D.;
Cer�on, J. J.; Berckmans, D.; Tuyttens, F.
A.; Niewold, T. A., 2014: Different stres-
sors elicit different responses in the sali-
vary biomarkers cortisol, haptoglobin,
and chromogranin A in pigs. Research in
Veterinary Science 82, 124–128.
Pavlovic, R.; Chiesa, L.; Soncin, S.; Pan-
seri, S.; Cannizzo, F. T.; Biolatti, B.;
Biondi, P. A., 2012: Determination of
cortisol, cortisone, prednisolone and
prednisone in bovine urine by liquid
Chromatography–electrospray ionisa-
tion single quadrupole mass spectrome-
try. Journal of Liquid Chromatography &
Related Technologies 35, 444–457.
Pavlovic, R.; Cannizzo, F. T.; Panseri, S.;
Biolatti, B.; Trutic, N.; Biondi, P. A.;
Chiesa, L., 2013: Tetrahydro-metabo-
lites of cortisol and cortisone in bovine
urine evaluated by HPLC-ESI-mass
spectrometry. Journal of Steroid Biochem-
istry and Molecular Biology 135, 30–35.
Pegolo, S.; Gallina, G.; Montesissa, C.;
Capolongo, F.; Ferraresso, S.; Pellizzari,
C.; Poppi, L.; Castagnaro, M.; Bargelloni,
L., 2012: Transcriptomic markers meet
the real world: finding diagnostic signa-
tures of corticosteroid treatment in com-
mercial beef samples. BioMed Central
Veterinary Research 8, 205.
Pompa, G.; Arioli, F.; Casati, A.; Fidani,
M.; Bertocchi, L.; Dusi, G., 2011:
Investigation of the origin of pred-
nisolone in bovine urine. Steroids 76,
104–110.
Pozo, O. J.; Eeno, P. V.; Thuyne, W. V.;
Deventer, K.; Delbeke, F. T., 2008:
Direct quantification of steroid glu-
curonides in human urine by liquid
chromatography-electrospray tandem
mass spectrometry. Journal of Chromatog-
raphy A 1183, 108–118.
Sauerwein, H.; D€ursch, I.; Meyer, H. H. D.,
1991: Quantitation of glucocorticoid
receptors in bovine skeletal muscle:
topographical distribution, sex effect
and breed comparisons. Journal of Steroid
Biochemistry and Molecular Biology 39,
941–945.
Savu, S. R.; Silvestro, L.; Haag, A.; S€orgel,
F., 1996: A confirmatory HPLC-MS/MS
method for ten synthetic corticosteroids
in bovine urines. Journal of Mass Spec-
trometry 31, 1651–1663.
Shimada, K.; Mitamura, K.; Higashi, T.,
2001: Gas chromatography and high-
performance liquid chromatography of
natural steroids. Journal of Chromatogra-
phy A 935, 141–172.
Thompson, M., 2000: Recent trends in
inter-laboratory precision at ppb and
sub-ppb concentrations in relation to
fitness for purpose criteria in proficiency
testing. Analyst 125, 385–386.
Timperio, A. M.; D’Alessandro, A.; Pariset,
L.; D’Amici, G. M.; Valentini, A.; Zolla,
L., 2009: Comparative proteomics and
transcriptomics analyses of livers from
two different Bos taurus breeds: “Chian-
ina and Holstein Friesian”. Journal of
Proteomics 73, 309–322.
Tomlinson, W.; Sherlock, M.; Hughes, B.;
Hughes, S.; Kilvington, F.; Barlett, W.;
Courtney, R.; Rejto, P.; Carley, W.; Ste-
wart, P. M., 2007: Inhibition of 11beta-
hydroxysteroid dehydrogenase type 1
activity in vivo limits glucocorticoid
exposure to human adipose tissue and
decreases lipolysis. Journal of Clinical
Endocrinology & Metabolism 92, 857–864.
U.S. Department of Health and Human
Services, Food and Drug Administra-
tion, Center for Drug Evaluation and
Research (CDER), Center for Veterinary
Medicine (CVM), May 2001, BP. Guid-
ance for Industry Bioanalytical methods
validation [online]. Available from URL
http://www.fda.gov/downloads/Drugs/
Guidances/ucm070107.pdf Accessed 7
July 201419Vincenti, M.; Leporati, M.; Capra, P.;
Gatto, S.; Attucci, A.; Barbarino, G.;
Nebbia, C., 2012: A field survey on the
presence of prednisolone and pred-
nisone in urine samples from untreated
cows. Food Additives & Contaminants. Part
A, Chemistry, Analysis, Control, Exposure &
Risk Assessment 29, 1893–1900.
Journal of Animal Physiology and Animal Nutrition © 2016 Blackwell Verlag GmbH 11
L. Chiesa et al. Corticosteroids in urine of Chianina cattle breed
1
2
3
4
5
6
7
8
9
10
11
12
13
14
15
16
17
18
19
20
21
22
23
24
25
26
27
28
29
30
31
32
33
34
35
36
37
38
39
40
41
42
43
44
45
46
47
48
49
50
51
52
53
Author Query Form
Journal: JPN
Article: 12509
Dear Author,
During the copy-editing of your paper, the following queries arose. Please respond to these by marking up
your proofs with the necessary changes/additions. Please write your answers on the query sheet if there is
insufficient space on the page proofs. Please write clearly and follow the conventions shown on the
attached corrections sheet. If returning the proof by fax do not write too close to the paper’s edge. Please
remember that illegible mark-ups may delay publication.
Many thanks for your assistance.
Query reference Query Remarks
1 AUTHOR: Please check that all the information displayed in your
figures, equations and tables are displayed correctly and that they
appear in the correct order.
2 AUTHOR: If you have not already completed a Copyright Transfer
Agreement, please log on to Wiley Author Serivices, https://
authorservices.wiley.com/bauthor/, sign-in and complete the
License Agreement form
3 AUTHOR: Please confirm that given names (red) and
surnames/family names (green) have been identified correctly.
4 AUTHOR: Please provide fax number for corresponding author.
5 AUTHOR: ANABIC, 2011 has been changed to Associazione
Nazionale Allevatori Bovini Italiani da Carne, 2014 so that this
citation matches the Reference List. Please confirm that this is
correct.
6 AUTHOR: Montanholi et al., 2013 has been changed to Montanholi
et al., 2009 so that this citation matches the Reference List. Please
confirm that this is correct.
7 AUTHOR: Doornenbal H., 1977 has been changed to Doornenbal,
1977 so that this citation matches the Reference List. Please confirm
that this is correct.
8 AUTHOR: NRCP, 2014 has been changed to Italian Ministry of
Health; Dept. of Food Safety and Veterinary Public Health, 2014 so
that this citation matches the Reference List. Please confirm that this
is correct.
9 AUTHOR: de Rijke et al., 2014has been changed to De Rijke et al.,
2014 so that this citation matches the Reference List. Please confirm
that this is correct.
10 AUTHOR: Page charges are £100 for each typeset page exceeding the
first 8 pages. Please download the page charge form if your paper is
more than 8 proof pages from http://www.blackwellpublishing.com/
pdf/JPN_Page_Charge_Form.pdf. Please return the completed form
to the Production Editor ([email protected], fax: +65 6643 8008). A
hardcopy via regular mail would not be necessary.
11 AUTHOR: Please check the equation LOD = 10 3 SDR/m correctly
presented.
12 AUTHOR: FDA Guidance, 2001 has not been included in the
Reference List, please supply full publication details.
13 AUTHOR: Both probability and the expected or frequency of sample
positive for the presence of PL values are mentioned as “p” in this
article. As per journal style probability “p” is uppercase romen. So
we changed probability “p” throughout as per journal style. please
check and conform.
14 AUTHOR: Figure 1 was not cited in the text. An attempt has been
made to insert the figure into a relevant point in the text - please
check that this is OK. If not, please provide clear guidance on where
it should be cited in the text.
15 AUTHOR: In addition. . ..samples. The sentence has been rephrased
for clarity. Please confirm.
16 AUTHOR: European Commission (1996) has not been cited in the
text. Please indicate where it should be cited; or delete from the
Reference List.
17 AUTHOR: European Commission (2002) has not been cited in the
text. Please indicate where it should be cited; or delete from the
Reference List.
18 AUTHOR: European Commission (2010) has not been cited in the
text. Please indicate where it should be cited; or delete from the
Reference List.
19 AUTHOR: U.S. Department of Health and Human Services, Food and
Drug Administration et al. (2001) has not been cited in the text.
Please indicate where it should be cited; or delete from the
Reference List.
20 AUTHOR: Figure 1 has been saved at a low resolution of 83 dpi.
Please resupply at 600 dpi. Check required artwork specifications at
http://authorservices.wiley.com/bauthor/illustration.asp
21 AUTHOR: Figure 2 has been saved at a low resolution of 108 dpi.
Please resupply at 600 dpi. Check required artwork specifications at
http://authorservices.wiley.com/bauthor/illustration.asp
22 AUTHOR: Figure 3 has been saved at a low resolution of 79 dpi.
Please resupply at 600 dpi. Check required artwork specifications at
http://authorservices.wiley.com/bauthor/illustration.asp