Embed Size (px)
Citation preview
O N L I N E @P L A N REPORT GUIDE2013

2 Copyright © 2013 The Nielsen CompanyVISIT http://en-us.nielsen.com/sitelets/cls/digital/online-atplan.html OR CALL 1-800-423-4511
ONLINE @PLAN
A leading profiling tool for online media planning, buying and selling.
A targeting and profiling tool assisting users in building solid online
strategies to reach their desired audiences, as well as demonstrating
the value of a website’s audience to advertisers.

3Copyright © 2013 The Nielsen Company
CONTENTSClick the blue links below to navigate directly to the content in this guide.
PRODUCT LOGIN . . . . . . . . . . . . . . . . . . . . . . . . . . . . . . . . . . . . . . . . . . . . . . . . . . . 4
HIERARCHY . . . . . . . . . . . . . . . . . . . . . . . . . . . . . . . . . . . . . . . . . . . . . . . . . . . . . . . . . . . . 4
HOMEPAGE . . . . . . . . . . . . . . . . . . . . . . . . . . . . . . . . . . . . . . . . . . . . . . . . . . . . . . . . . . . . 5
DEFINE TARGETS/LISTS . . . . . . . . . . . . . . . . . . . . . . . . . . . . . . . . . . . . . 6 -7
MARKET SIZING REPORT . . . . . . . . . . . . . . . . . . . . . . . . . . . . . . . . . . 8 -9
OPTIMIZING REPORT ....................................... 10 -11
PROFILING REPORT ........................................... 12-13
SEGMENT PROFILING REPORT . . . . . . . . . . . . . . . . . . . . . 14-15
WORKING WITH COMPLETED REPORTS ...... 16-20

4 Copyright © 2013 The Nielsen CompanyVISIT http://en-us.nielsen.com/sitelets/cls/digital/online-atplan.html OR CALL 1-800-423-4511
PRODUCT LOGIN
• Visit https://answers.nielsen.com/• Enter your Username (email address) and password.
If you do not know your password, click Forgotten Password?
Type in your email address and follow the instructions
in the email you receive.
• From the Nielsen Online menu, select @PLAN.
PRODUCT HIERARCHYNielsen @Plan utilizes the same three-tier hierarchy as Nielsen NetView, called Nielsen MarketView Dictionary.
The standard and custom reporting levels are as follows:
STANDARD HIERARCHYPARENT (P) Example: News Corp. Online
A consolidation or group of businesses that are owned by a parent company; a parent contains at least one brand.
BRAND (B) Example: Fox Networks Group
An operating unit or subsidiary of a parent company; a brand may contain channels.
CHANNEL (C) Example: Fox Broadcasting
A website with editorial content that focuses on a specific view of interest, i.e. news, sports, or entertainment.
DOMAIN (D) Example: www.americanidol.com
Most granular reporting levels of websites; they comprise brands and channels.
SUB-DOMAIN (S) Example: www.americanidol.com/photocontest
Most granular reporting levels of websites; they comprise brands and channels.
CUSTOM HIERARCHY@PLAN NETWORK (N) Example: Fox Digital Media Network
Publisher-defined vertical that can be viewed by all Nielsen @Plan subscribers.
NETVIEW CUSTOM ROLLUP (R) Example: MSNBC / NBC Sports
Publisher-defined vertical from Nielsen NetView that also appear in Nielsen @Plan.
ONLINE @PLAN: REPORT GUIDEONLINE @PLAN: REPORT GUIDE

5Copyright © 2013 The Nielsen Company
HOMEPAGE
1.) Click Create a New Report button to begin creating targets, lists, and reports.
2.) Run a Saved Report allows you to re-run a previously created report.
3.) My Saved Info menu contains folders with saved targets, lists, and reports.
4.) My Session Info contains folders with targets and lists that are created and used in the current session.
5.) Group Saved Info contains folders with targets and lists that are shared by employees from the same company.
6.) Account Settings gives users the option to change the data release in the Profile and Preferences section.
7.) Scheduled Reports section allows clients to build, revise, or delete scheduled reports.
8.) Help menu contains the Help Center, which provides tips and tricks for navigating the tool.
9.) Recently Run Reports displays the 10 most recently run reports in Nielsen @Plan.
10.) My @Plan Inbox displays scheduled reports, delivery notifications, and long-running reports
(reports that take more than a minute to load).
3
2
4
5
6
1 8
7
9
10
ONLINE @PLAN: REPORT GUIDEONLINE @PLAN: REPORT GUIDE

6 Copyright © 2013 The Nielsen CompanyVISIT http://en-us.nielsen.com/sitelets/cls/digital/online-atplan.html OR CALL 1-800-423-4511
DEFINE TARGETS/LISTS
SEARCH MODE
1.) On the Sites tab, click the Search radio button. Enter desired profile points, sites to search, and add to your targets/lists
2.) The default search setting is All Entities, which includes brands, channels, NetView Custom Roll-ups and
@Plan Networks. All Sites include everything in All Entities plus parents, domains, subdomains, and applications
BROWSE MODE
1.) On the Profile Points tab, click the Browse radio button. This mode allows you to peruse through categories
and subcategories of profile points and sites to add to your targets and lists
2.) A single click adds a profile point or site to the expression canvas
1
1
2
2
ONLINE @PLAN: REPORT GUIDEONLINE @PLAN: REPORT GUIDE

7Copyright © 2013 The Nielsen Company
DEFINE TARGETS/LISTS
1.) Create Group button allows user to group items as desired,
using parentheses around AND/OR conditions.
2.) Clear All button removes all target or list items
from the expression canvas with a single click.
3.) Expand button allows user to view items in the
expression canvas that do not fit on the screen.
4.) AUDIENCE VALIDITY METER
GREEN: Availability of sample data to generate results is above 30.
YELLOW: Availability of sample data to generate results is between 10 and 29.
RED: Availability of sample data to generate results is below 10.
5.) Auto Grouping check box automatically groups items by their AND/OR conditions with parentheses.
6.) Click drop-down for grouping options.
7.) Click Continue to Select Report button to move to the Select
Report screen or add a target/list to My Session Info.
8.) Click Save Target (List) button to add target or list
to My Saved Info menu for use in future sessions.
9.) Share Target (List) check box adds the target or list
to the Group Saved Info menu.
10.) Add Target (List) to Session adds target or list
to My Session Info menu for use in current session.
2 3 1
4
5
6
7
8
8
9
10
ONLINE @PLAN: REPORT GUIDEONLINE @PLAN: REPORT GUIDE

8 Copyright © 2013 The Nielsen CompanyVISIT http://en-us.nielsen.com/sitelets/cls/digital/online-atplan.html OR CALL 1-800-423-4511
MARKET SIZING REPORT
THE MARKET SIZING REPORT DISPLAYS THE OVERALL SIZE OF A TARGET AUDIENCE OR A SITE.
SELECT REPORT SCREEN1.) Select Market Sizing report.
2.) Choose desired target(s) for rows and columns from Select the Targets for your Report box.
3.) Select desired metrics from Select your Report Metrics box.
4.) Click Continue to View Your Results button.
1
2 3
4
ONLINE @PLAN: REPORT GUIDEONLINE @PLAN: REPORT GUIDE

9Copyright © 2013 The Nielsen Company
MARKET SIZING REPORT
HOW TO READ
1.) COMPOSITION %
The percentage of the entire online adult population that falls into a target audience or visits a particular site.
10.9% of the online adult population is comprised of Females living in a major U.S. city.
2.) UNIQUE AUDIENCE
The total number of people that fall into a target audience or visit a particular site.
The online adult population is comprised of 17,817,000 Females living in a major U.S. city.
3.) U.S. POPULATION COMPOSITION
The percentage of the U.S. population (online and offline) that falls into a target audience or visits a particular site.
9.2% of the U.S. population is a Female living in a major U.S. city.
1 2
•Target •Metrics
3
ONLINE @PLAN: REPORT GUIDEONLINE @PLAN: REPORT GUIDE

10 Copyright © 2013 The Nielsen CompanyVISIT http://en-us.nielsen.com/sitelets/cls/digital/online-atplan.html OR CALL 1-800-423-4511
OPTIMIZING REPORT
THE OPTIMIZING REPORT DISPLAYS THE WEBSITES THAT A GIVEN TARGET AUDIENCE IS MOST LIKELY TO VISIT.
SELECT REPORT SCREEN1.) Select Optimizing report.
2.) Choose desired target(s) for rows and columns from Select the Targets for your Report box.
3.) Select All Categories or a particular category/subcategory of sites.
4.) Select desired metrics from Select your Report Metrics box.
5.) Click Continue to View Your Results button.
1
2
3
4
5
ONLINE @PLAN: REPORT GUIDEONLINE @PLAN: REPORT GUIDE

11Copyright © 2013 The Nielsen Company
OPTIMIZING REPORT
HOW TO READ
1.) COMPOSITION %
The percentage of the entire online adult population
that falls into a target audience or visits a particular site.
24.9% of Oaktree Athletics website visitors are Female living in a major U.S. city.
2.) UNIQUE AUDIENCE
The total number of people in a target audience that visit a particular website.
40,000 visitors on the Oaktree Athletics website are Females living in a major U.S. city.
3.) INDEX
The probability that the target audience will visit a particular website when compared to the overall online adult population.
A visitor to Oaktree Athletics website is 1,874% more likely to be Females living in a major U.S. city than the online average.
4.) COVERAGE
The percentage of the target audience that the website reaches.
Oaktree Athletics reaches 1.8 of Females living in a major U.S. city who are active online.
1 2 3 4
•Site •Target •Metrics
ONLINE @PLAN: REPORT GUIDEONLINE @PLAN: REPORT GUIDE

12 Copyright © 2013 The Nielsen CompanyVISIT http://en-us.nielsen.com/sitelets/cls/digital/online-atplan.html OR CALL 1-800-423-4511
PROFILING REPORT
THE PROFILING REPORT DISPLAYS THE ONLINE AND OFFLINE BEHAVIORS OF A TARGET AUDIENCE
OR WEBSITE VISITORS.
SELECT REPORT SCREEN1.) Select Profiling report.
2.) Choose desired target(s) for rows and columns from Select the Targets for your Report box.
3.) Select All Categories or a particular category/subcategory of profile points.
4.) Select desired metrics from Select your Report Metrics box. U.S. Population Composition Percentage
and Index metrics are not selected by default for this report.
5.) Click Continue to View Your Results button.
1
2
3
4
5
ONLINE @PLAN: REPORT GUIDEONLINE @PLAN: REPORT GUIDE

13Copyright © 2013 The Nielsen Company
PROFILING REPORT
HOW TO READ
1.) COMPOSITION %
The percentage of the entire online adult population that falls into a target audience or visits a particular site.
45.1% of Site 1 audience is Female.
2.) UNIQUE AUDIENCE
The total number of website visitors or target audience members that exhibit a given behavior.
72,907,000 visitors to the Site 1 website are Female.
3.) INDEX
The probability that the target audience will visit a particular website when compared to the overall online adult population.
A visitor to Site 1 website is 2% less likely to be Female than the online average.
4.) COVERAGE
The reach percentage of website visitors or target audience members that exhibit a given behavior.
Site 1 reaches 76.2% of Females who are active online.
•Site •Target •Metrics
1 2 3 4
ONLINE @PLAN: REPORT GUIDEONLINE @PLAN: REPORT GUIDE

14 Copyright © 2013 The Nielsen CompanyVISIT http://en-us.nielsen.com/sitelets/cls/digital/online-atplan.html OR CALL 1-800-423-4511
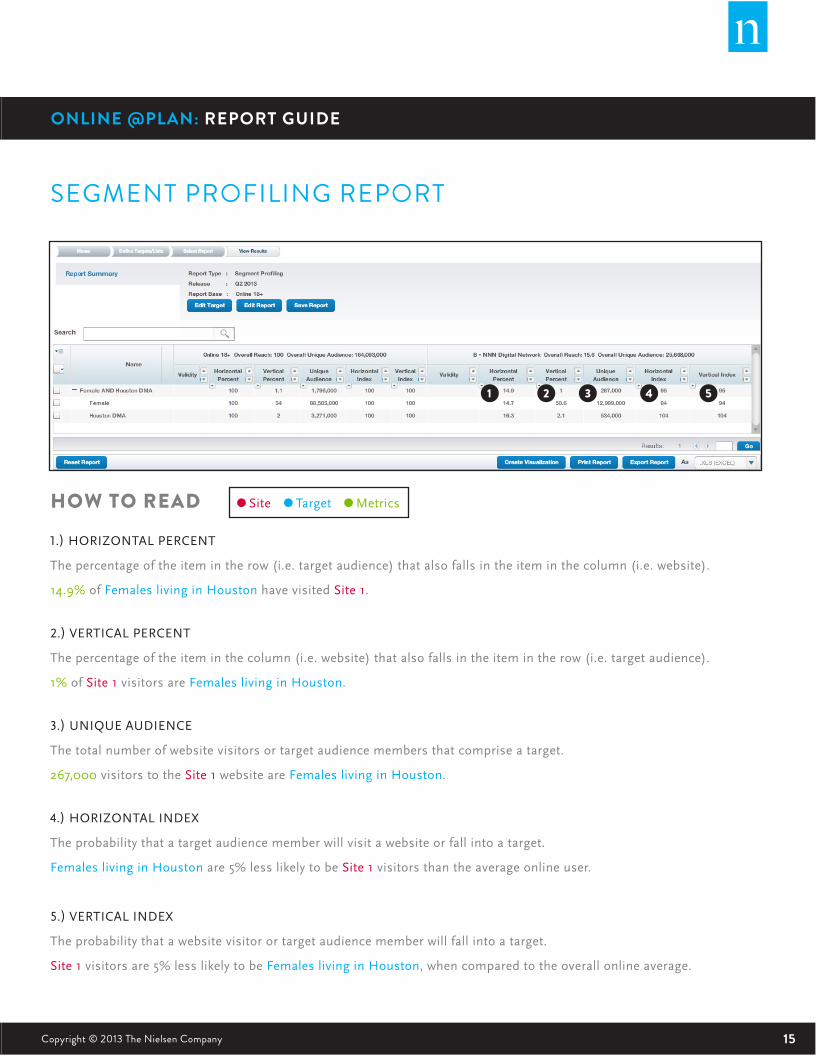
SEGMENT PROFILING REPORT
THE SEGMENT PROFILING REPORT PROVIDES A COMPARISON OF TARGET AUDIENCES.
IT ALSO ALLOWS USERS TO CROSS-TAB TARGETS WITH SITES.
SELECT REPORT SCREEN1.) Select Segment Profiling report.
2.) Choose desired target(s) for rows and columns from Select the Targets for your Report box.
3.) Select desired metrics from Select your Report Metrics box.
4.) Click Continue to View Your Results button.
1
2 3
4
ONLINE @PLAN: REPORT GUIDEONLINE @PLAN: REPORT GUIDE
15Copyright © 2013 The Nielsen Company
SEGMENT PROFILING REPORT
HOW TO READ
1.) HORIZONTAL PERCENT
The percentage of the item in the row (i.e. target audience) that also falls in the item in the column (i.e. website).
14.9% of Females living in Houston have visited Site 1.
2.) VERTICAL PERCENT
The percentage of the item in the column (i.e. website) that also falls in the item in the row (i.e. target audience).
1% of Site 1 visitors are Females living in Houston.
3.) UNIQUE AUDIENCE
The total number of website visitors or target audience members that comprise a target.
267,000 visitors to the Site 1 website are Females living in Houston.
4.) HORIZONTAL INDEX
The probability that a target audience member will visit a website or fall into a target.
Females living in Houston are 5% less likely to be Site 1 visitors than the average online user.
5.) VERTICAL INDEX
The probability that a website visitor or target audience member will fall into a target.
Site 1 visitors are 5% less likely to be Females living in Houston, when compared to the overall online average.
•Site •Target •Metrics
1 2 3 4 5
ONLINE @PLAN: REPORT GUIDEONLINE @PLAN: REPORT GUIDE

16 Copyright © 2013 The Nielsen CompanyVISIT http://en-us.nielsen.com/sitelets/cls/digital/online-atplan.html OR CALL 1-800-423-4511
WORKING WITH REPORTS
VISUALIZATIONClick the Create Visualization button to select and display search results visually with bar, pie or bubble charts.
ONLINE @PLAN: REPORT GUIDEONLINE @PLAN: REPORT GUIDE
17Copyright © 2013 The Nielsen Company
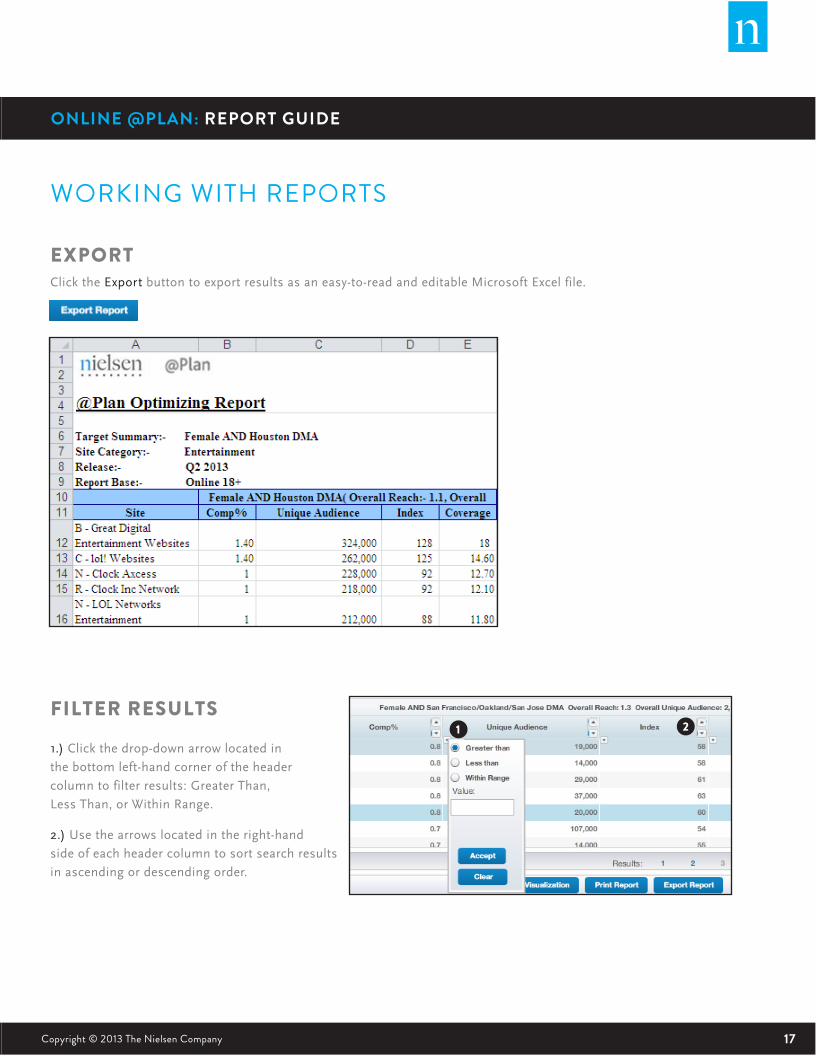
WORKING WITH REPORTS
EXPORTClick the Export button to export results as an easy-to-read and editable Microsoft Excel file.
FILTER RESULTS
1.) Click the drop-down arrow located in
the bottom left-hand corner of the header
column to filter results: Greater Than,
Less Than, or Within Range.
2.) Use the arrows located in the right-hand
side of each header column to sort search results
in ascending or descending order.
1 2
ONLINE @PLAN: REPORT GUIDEONLINE @PLAN: REPORT GUIDE

18 Copyright © 2013 The Nielsen CompanyVISIT http://en-us.nielsen.com/sitelets/cls/digital/online-atplan.html OR CALL 1-800-423-4511
ONLINE @PLAN: REPORT GUIDEONLINE @PLAN: REPORT GUIDE
WORKING WITH REPORTS
SAVE REPORT1.) Click the Save Report button in the Report Summary area of the screen.
2.) Name your report and save it in the folder of your choice.
3.) You will receive a confirmation that your report has been saved.

19Copyright © 2013 The Nielsen Company
4
ONLINE @PLAN: REPORT GUIDEONLINE @PLAN: REPORT GUIDE
WORKING WITH REPORTS
SCHEDULE / RETRIEVE SAVED REPORTS
1.) Click the Account Settings menu and then click Schedule Reports.
2.) Select the desired report
3.) Click the Accept button
4.) You can retrieve scheduled reports in the Inbox on the Homepage with each quarterly data release.
You can schedule up to ten reports.
1
2
3

20 VISIT http://en-us.nielsen.com/sitelets/cls/digital/online-atplan.html OR CALL 1-800-423-4511
ABOUT NIELSEN Nielsen Holdings N.V. (NYSE: NLSN) is a global information and
measurement company with leading market positions in marketing
and consumer information, television and other media measurement,
online intelligence, mobile measurement, trade shows and related
properties. Nielsen has a presence in approximately 100 countries,
with headquarters in New York, USA and Diemen, the Netherlands.
For more information, visit www.nielsen.com.
Copyright © 2013 The Nielsen Company. All rights reserved. Nielsen and
the Nielsen logo are trademarks or registered trademarks of CZT/ACN
Trademarks, L.L.C. Other product and service names are trademarks or
registered trademarks of their respective companies.