Embed Size (px)
Citation preview
TRANSITIONING TO A CONSUMER-LED ECONOMY
Louise Keely Hong Kong September 10, 2015
SOLD IN CHINA
Co
pyr
igh
t ©
20
15
Th
e N
iels
en C
om
pan
y. C
on
fid
enti
al a
nd
pro
pri
etar
y.
2
THE $67 TRILLION OPPORTUNITY FOR CONSUMER LED GROWTH
Source: The Demand Institute
Consumer spending potential of consumer-led growth, 2015-2025
BASE CASE
STRONG TRANSITION
420 TRILLION YUAN 330 TRILLION YUAN
+27%
Co
pyr
igh
t ©
20
15
Th
e N
iels
en C
om
pan
y. C
on
fid
enti
al a
nd
pro
pri
etar
y.
3
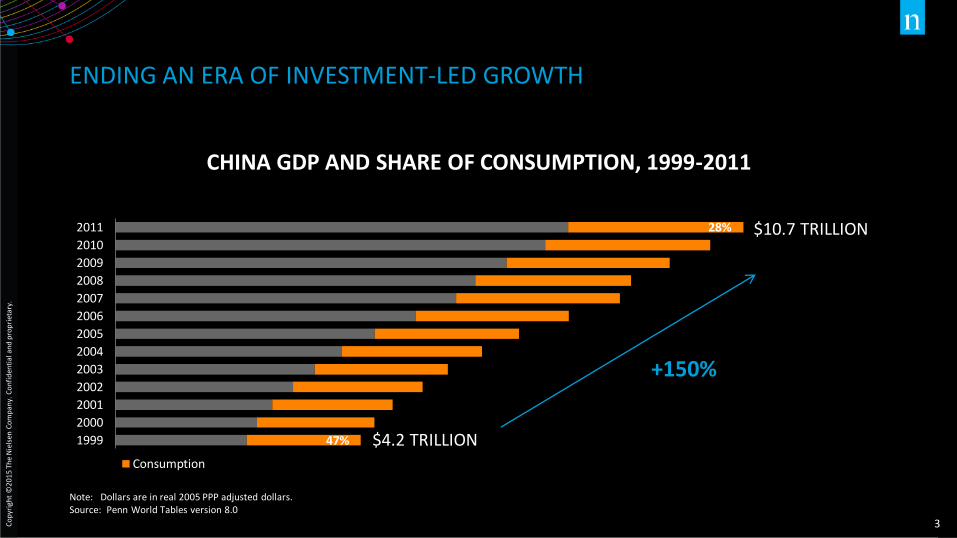
ENDING AN ERA OF INVESTMENT-LED GROWTH
CHINA GDP AND SHARE OF CONSUMPTION, 1999-2011
Note: Dollars are in real 2005 PPP adjusted dollars. Source: Penn World Tables version 8.0
1999
2000
2001
2002
2003
2004
2005
2006
2007
2008
2009
2010
2011
Consumption
$10.7 TRILLION 28%
47% $4.2 TRILLION
+150%
Co
pyr
igh
t ©
20
15
Th
e N
iels
en C
om
pan
y. C
on
fid
enti
al a
nd
pro
pri
etar
y.
4
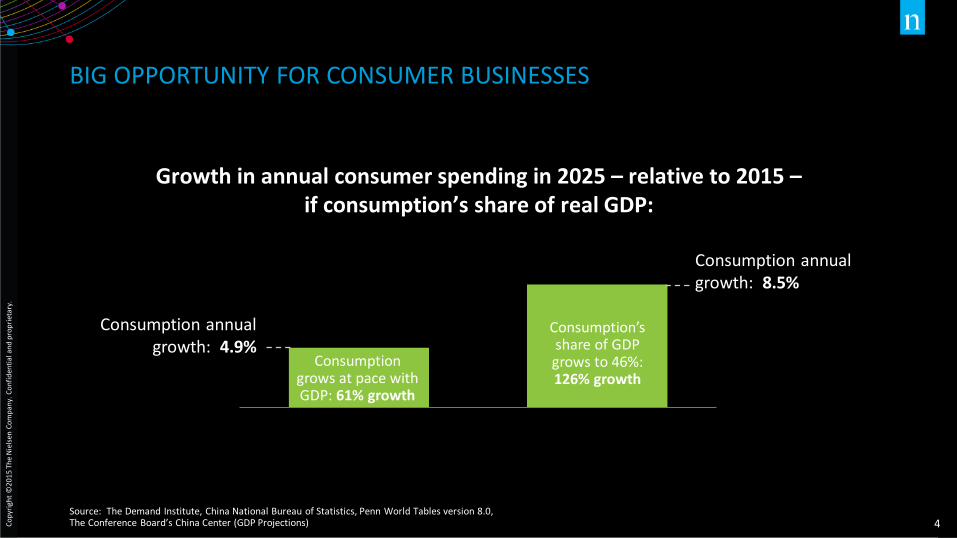
BIG OPPORTUNITY FOR CONSUMER BUSINESSES
Source: The Demand Institute, China National Bureau of Statistics, Penn World Tables version 8.0, The Conference Board’s China Center (GDP Projections)
Growth in annual consumer spending in 2025 – relative to 2015 – if consumption’s share of real GDP:
Consumption annual growth: 8.5%
Consumption annual growth: 4.9%
Consumption grows at pace with GDP: 61% growth
Consumption’s share of GDP grows to 46%: 126% growth

WHAT CAN BUSINESS LEADERS DO?
Co
pyr
igh
t ©
20
15
Th
e N
iels
en C
om
pan
y. C
on
fid
enti
al a
nd
pro
pri
etar
y.
6
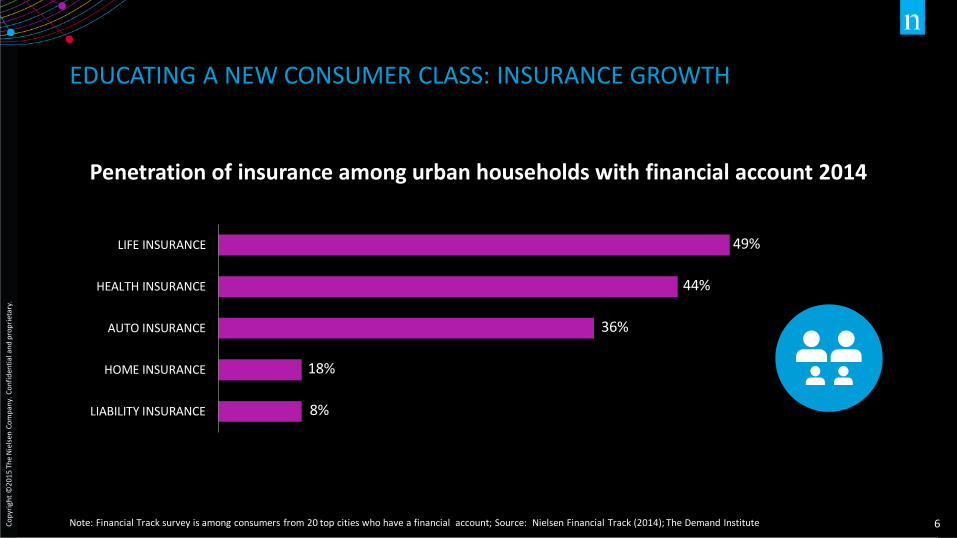
EDUCATING A NEW CONSUMER CLASS: INSURANCE GROWTH
Note: Financial Track survey is among consumers from 20 top cities who have a financial account; Source: Nielsen Financial Track (2014); The Demand Institute
Penetration of insurance among urban households with financial account 2014
LIABILITY INSURANCE
HOME INSURANCE
AUTO INSURANCE
HEALTH INSURANCE
LIFE INSURANCE 49%
44%
36%
18%
8%
Co
pyr
igh
t ©
20
15
Th
e N
iels
en C
om
pan
y. C
on
fid
enti
al a
nd
pro
pri
etar
y.
7
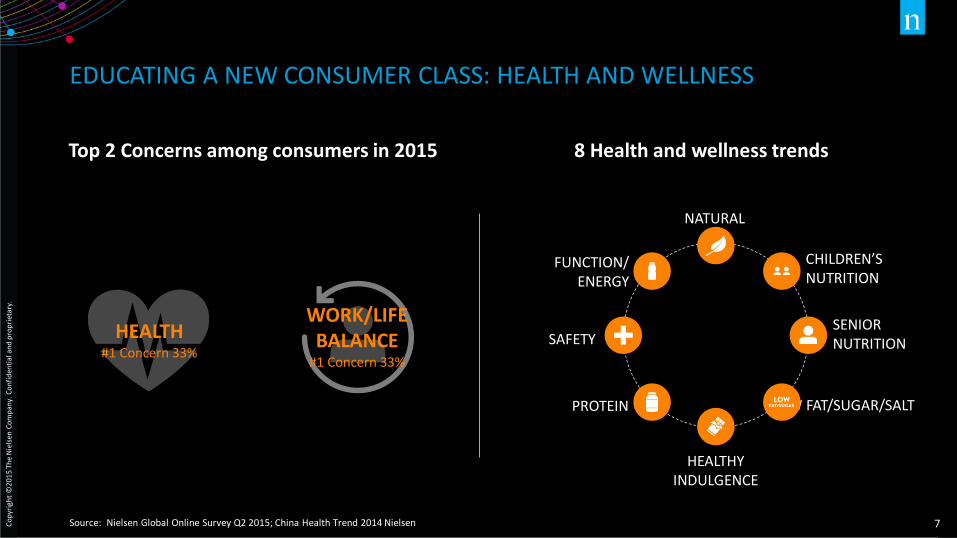
EDUCATING A NEW CONSUMER CLASS: HEALTH AND WELLNESS
Source: Nielsen Global Online Survey Q2 2015; China Health Trend 2014 Nielsen
FUNCTION/ ENERGY
8 Health and wellness trends
PROTEIN LOW FAT/SUGAR/SALT
SENIOR NUTRITION
CHILDREN’S NUTRITION
HEALTHY INDULGENCE
NATURAL
SAFETY
Top 2 Concerns among consumers in 2015
HEALTH #1 Concern 33%
WORK/LIFE BALANCE
#1 Concern 33%
Co
pyr
igh
t ©
20
15
Th
e N
iels
en C
om
pan
y. C
on
fid
enti
al a
nd
pro
pri
etar
y.
8
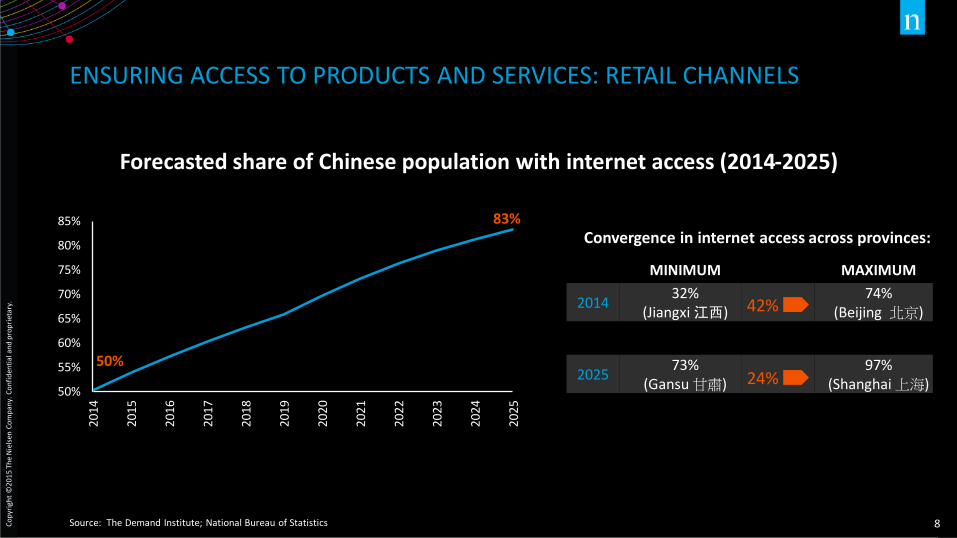
ENSURING ACCESS TO PRODUCTS AND SERVICES: RETAIL CHANNELS
Source: The Demand Institute; National Bureau of Statistics
Forecasted share of Chinese population with internet access (2014-2025)
50%
55%
60%
65%
70%
75%
80%
85%
2014
2015
2016
2017
2018
2019
2020
2021
2022
2023
2024
2025
Convergence in internet access across provinces:
MINIMUM MAXIMUM
2014 32%
(Jiangxi 江西) 74%
(Beijing 北京)
2025 73%
(Gansu 甘肅) 97%
(Shanghai 上海)
42%
24% 50%
83%
Co
pyr
igh
t ©
20
15
Th
e N
iels
en C
om
pan
y. C
on
fid
enti
al a
nd
pro
pri
etar
y.
9
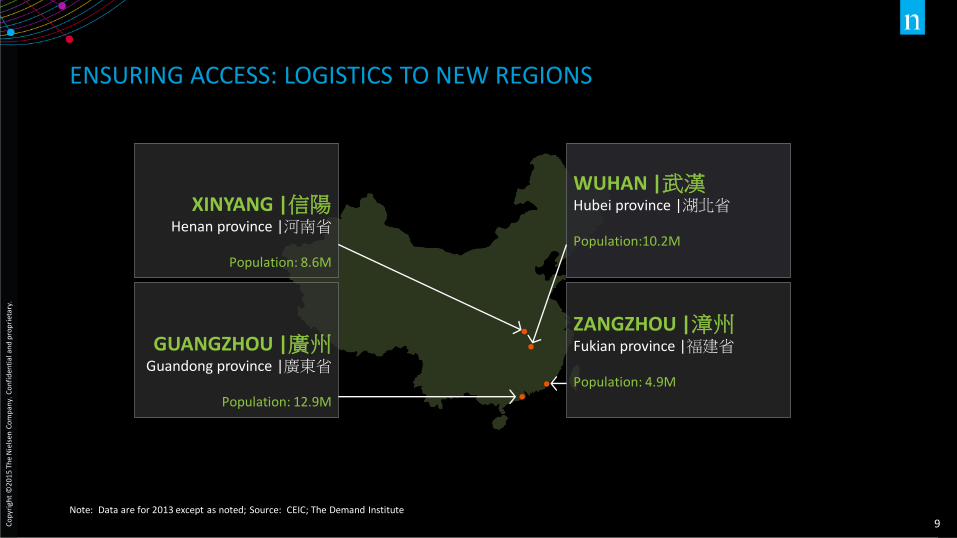
ENSURING ACCESS: LOGISTICS TO NEW REGIONS
Note: Data are for 2013 except as noted; Source: CEIC; The Demand Institute
XINYANG |信陽 Henan province |河南省
Population: 8.6M
GUANGZHOU |廣州 Guandong province |廣東省
Population: 12.9M
WUHAN |武漢 Hubei province |湖北省 Population:10.2M
ZANGZHOU |漳州 Fukian province |福建省 Population: 4.9M
Co
pyr
igh
t ©
20
15
Th
e N
iels
en C
om
pan
y. C
on
fid
enti
al a
nd
pro
pri
etar
y.
10
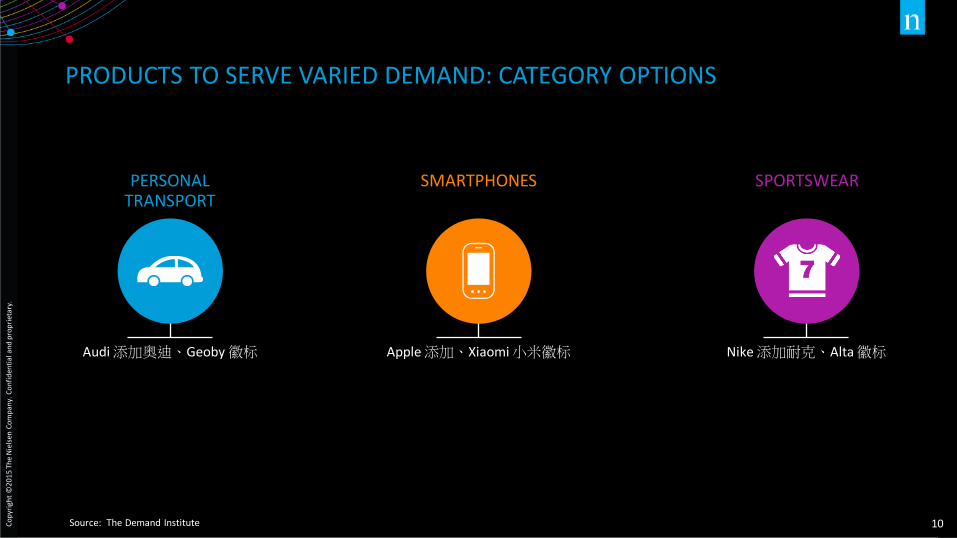
PRODUCTS TO SERVE VARIED DEMAND: CATEGORY OPTIONS
Source: The Demand Institute
PERSONAL TRANSPORT
SMARTPHONES SPORTSWEAR
Audi 添加奥迪、Geoby 徽标 Apple 添加、Xiaomi 小米徽标 Nike 添加耐克、Alta 徽标
Co
pyr
igh
t ©
20
15
Th
e N
iels
en C
om
pan
y. C
on
fid
enti
al a
nd
pro
pri
etar
y.
11
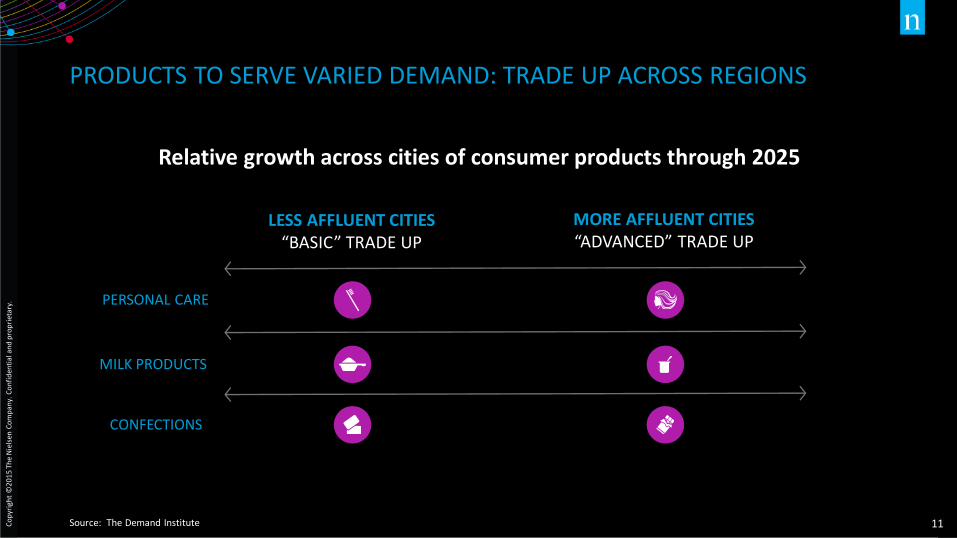
PRODUCTS TO SERVE VARIED DEMAND: TRADE UP ACROSS REGIONS
Source: The Demand Institute
Relative growth across cities of consumer products through 2025
MORE AFFLUENT CITIES “ADVANCED” TRADE UP
LESS AFFLUENT CITIES “BASIC” TRADE UP
PERSONAL CARE
MILK PRODUCTS
CONFECTIONS
Co
pyr
igh
t ©
20
15
Th
e N
iels
en C
om
pan
y. C
on
fid
enti
al a
nd
pro
pri
etar
y.
12
CONNECTED SPENDERS AS LEADING EDGE CONSUMERS
Focus on “middle class” consumers based on middle income not as relevant for luxury, financial
services sectors in China, and an income-based definition does not indicate willingness to spend
Connected Spender framework addresses, via willingness to spend spare cash once basic
essentials are covered, and by access to the internet.
We identify who they are, where they are found, how many there are today and project how many there will be in the future, and how they spend their money today and are likely to do so in the future.
Within this group, luxury and financial services sectors can identify their highest potential
Connected Spenders, based on metrics such as income and wealth
Co
pyr
igh
t ©
20
15
Th
e N
iels
en C
om
pan
y. C
on
fid
enti
al a
nd
pro
pri
etar
y.
13
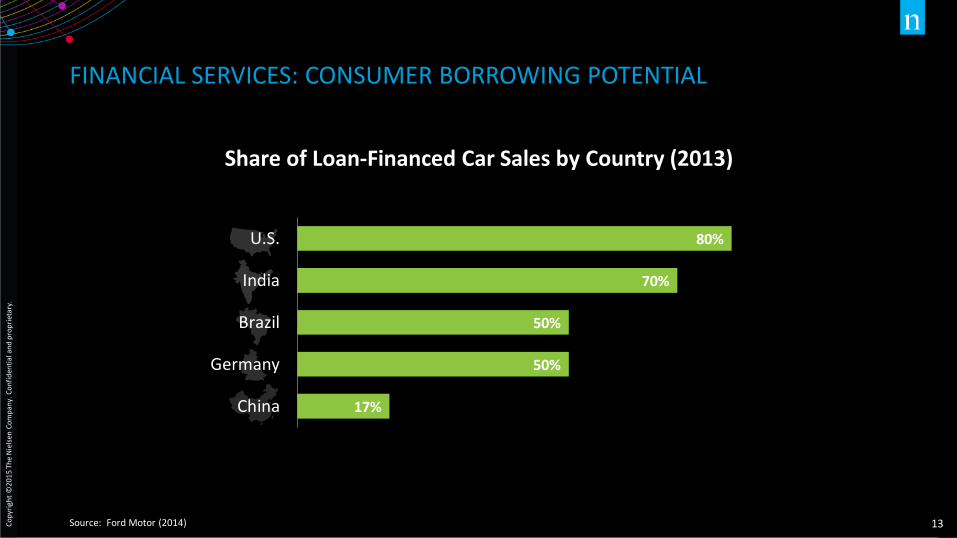
FINANCIAL SERVICES: CONSUMER BORROWING POTENTIAL
Source: Ford Motor (2014)
17%
50%
50%
70%
80%
China
Germany
Brazil
India
U.S.
Share of Loan-Financed Car Sales by Country (2013)
Co
pyr
igh
t ©
20
15
Th
e N
iels
en C
om
pan
y. C
on
fid
enti
al a
nd
pro
pri
etar
y.
14
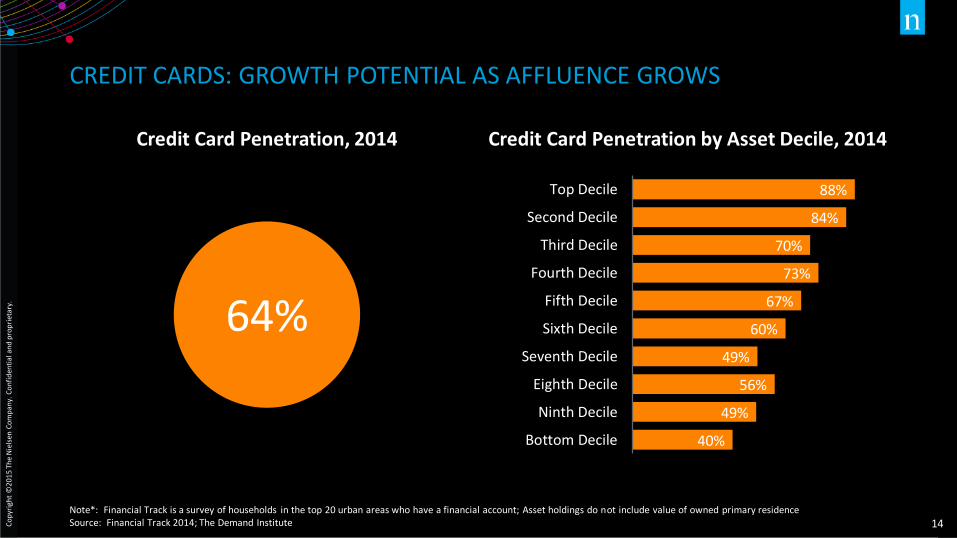
CREDIT CARDS: GROWTH POTENTIAL AS AFFLUENCE GROWS
88%
84%
70%
73%
67%
60%
49%
56%
49%
40%
Top Decile
Second Decile
Third Decile
Fourth Decile
Fifth Decile
Sixth Decile
Seventh Decile
Eighth Decile
Ninth Decile
Bottom Decile
Note*: Financial Track is a survey of households in the top 20 urban areas who have a financial account; Asset holdings do not include value of owned primary residence Source: Financial Track 2014; The Demand Institute
Credit Card Penetration by Asset Decile, 2014
64%
Credit Card Penetration, 2014
Co
pyr
igh
t ©
20
15
Th
e N
iels
en C
om
pan
y. C
on
fid
enti
al a
nd
pro
pri
etar
y.
15
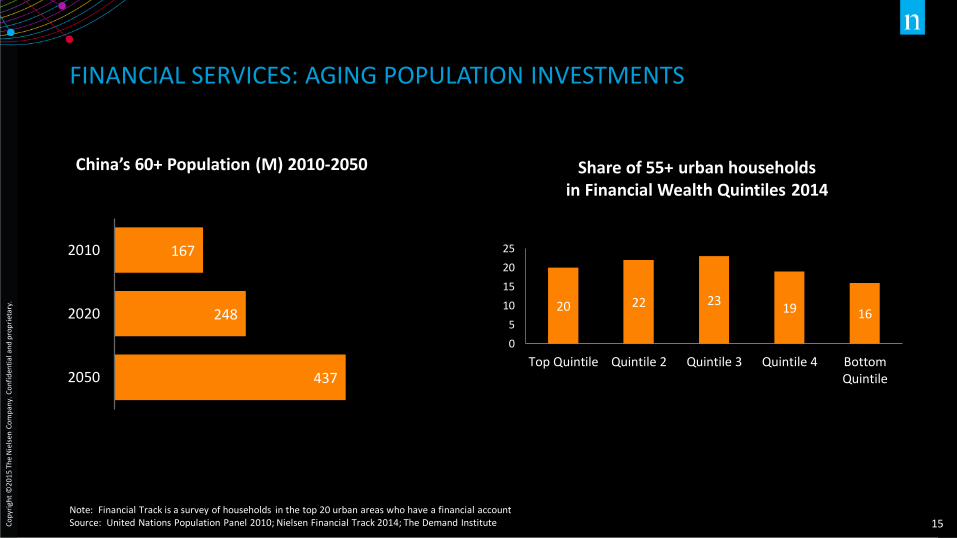
FINANCIAL SERVICES: AGING POPULATION INVESTMENTS
Note: Financial Track is a survey of households in the top 20 urban areas who have a financial account Source: United Nations Population Panel 2010; Nielsen Financial Track 2014; The Demand Institute
China’s 60+ Population (M) 2010-2050
167
248
437
2010
2020
2050
Share of 55+ urban households in Financial Wealth Quintiles 2014
20 22 23 19 16
0
5
10
15
20
25
Top Quintile Quintile 2 Quintile 3 Quintile 4 BottomQuintile
Co
pyr
igh
t ©
20
15
Th
e N
iels
en C
om
pan
y. C
on
fid
enti
al a
nd
pro
pri
etar
y.
16
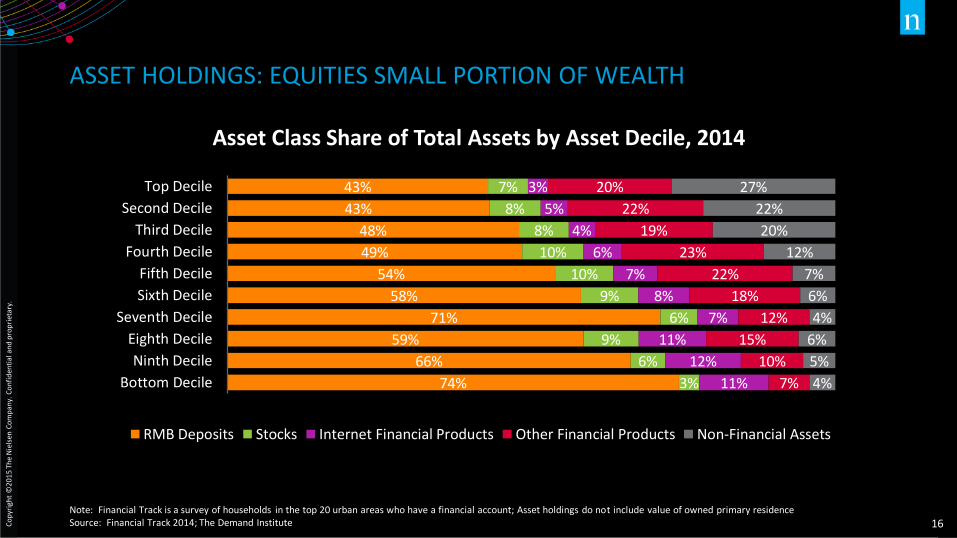
ASSET HOLDINGS: EQUITIES SMALL PORTION OF WEALTH
43%
43%
48%
49%
54%
58%
71%
59%
66%
74%
7%
8%
8%
10%
10%
9%
6%
9%
6%
3%
3%
5%
4%
6%
7%
8%
7%
11%
12%
11%
20%
22%
19%
23%
22%
18%
12%
15%
10%
7%
27%
22%
20%
12%
7%
6%
4%
6%
5%
4%
Top Decile
Second Decile
Third Decile
Fourth Decile
Fifth Decile
Sixth Decile
Seventh Decile
Eighth Decile
Ninth Decile
Bottom Decile
RMB Deposits Stocks Internet Financial Products Other Financial Products Non-Financial Assets
Note: Financial Track is a survey of households in the top 20 urban areas who have a financial account; Asset holdings do not include value of owned primary residence Source: Financial Track 2014; The Demand Institute
Asset Class Share of Total Assets by Asset Decile, 2014
Co
pyr
igh
t ©
20
15
Th
e N
iels
en C
om
pan
y. C
on
fid
enti
al a
nd
pro
pri
etar
y.
17
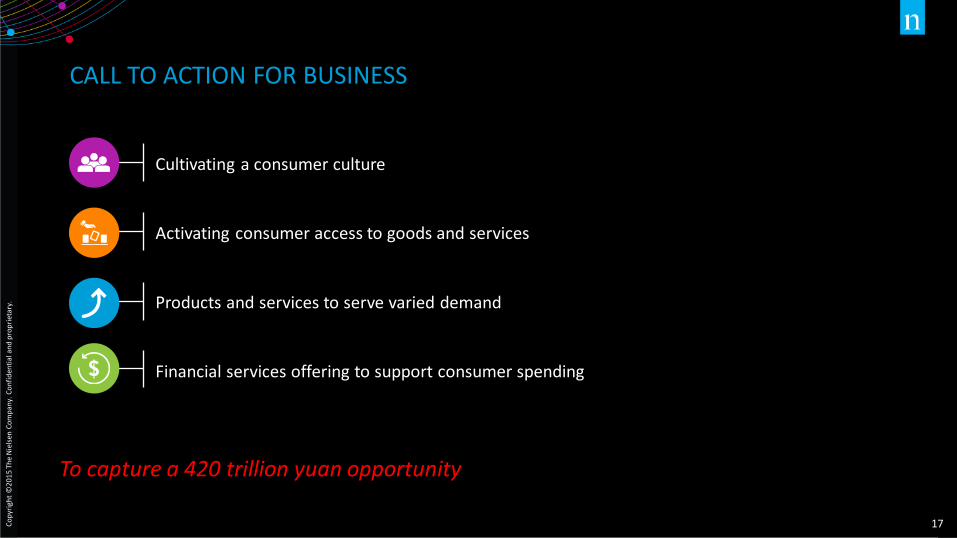
CALL TO ACTION FOR BUSINESS
Cultivating a consumer culture
Activating consumer access to goods and services
Products and services to serve varied demand
Financial services offering to support consumer spending
To capture a 420 trillion yuan opportunity

FINANCIAL SERVICES OPPORTUNITIES?
LUXURY MARKET OPPORTUNITIES?