Embed Size (px)
Citation preview

Crisis Chat
What We’ve Learned
Sara Knox
Network Coordinator, CONTACT USA
October 2012

Rationale for Online Chat Services
79% of all adults within the USA are on the Internet*
93% of all teenagers (aged 12-17) are on the Internet*
People in distress are reaching out online: Facebook, Twitter,
Craigslist postings, personal blogs, e-mails to crisis centers
- convenience
- anonymity
- to reduce stigma/shame
- lack of confidence and/or verbal acuity
- “testing the waters”
* Pew Research Center, Internet & American Life Project: adult data as of May, 2010;
teenager data as of September, 2009. www.pewinternet.org

Value to Visitors, Communities
There are few available safe online venues where
people can reach out for help.
Chat creates an outlet for populations traditionally hard
to engage in face-to-face mental health care:
- teens, those who are homebound, people with
social anxieties and phobias, and people with
hearing or speech impairments
Crisis Chat’s goals:
- Provide people with tools to make better health/life
decisions
- Increase culturally relevant access to support for
current and emerging generations
- Decrease stigma associated with accessing mental
health and support services

How Does Chat Differ From Phone Calls?
Average chat = 40-60min
New communication medium brings new styles of
communication
High level of disclosure (online disinhibition effect)
High levels of reported suicidal ideation

Rapid Growth Over the Last 2 Years
0
500
1000
1500
2000
2500
3000
Nov '1
0D
ec '1
0Jan
'11
Fe
b '11
Ma
r '1
1A
pr
'11
Ma
y '1
1Jun
'11
Jul '1
1A
ug
'11
Sep
t '1
1O
ct '1
1N
ov '1
1D
ec '1
1Ja
n '1
2F
eb '12
Ma
r '1
2A
pr
'12
Ma
y '1
2Ju
n '1
2Jul '1
2A
ug
' 12
Chats Initiated
Chats Initiated
This training manual cannot be copied or distributed without permission from CONTACT USA.

Number of Visitors by Hour and Day, Sept. ‘12
9am 10am 11am 12pm 1pm 2pm 3pm 4pm 5pm 6pm 7pm 8pm 9pm 10pm 11pm 12pm
Sun
Mon
5.3 4.3 4 0.8 8.5 9 17.3 16.5 11.8 13.8 23.5 28.8 29.5 4 Tues
0.5 6.5 10.3 12.5 13.8 15 17.8 19.3 28.3 21.3 7 Wed
2.8 5.3 9.5 2.3 1.3 7.3 9.3 14.8 12.8 21 17.5 19.5 27.5 19.5 6.3 Thurs
1 3 4.5 5.5 11.3 10.5 7 16 14.3 9.3 8.5 4.3 Fri
1.8 2.8 4 5.3 6.3 11 8.3 14 12.3 14.5 2.8 5.5 20.8 Sat
2.5 2 1.8 3.8 5 3.5 0.3
In the chart above, each box contains the average number of chat visitors per hour for
the last four weeks of September, 2012, shown in Eastern Time. Chats through
Lifeline that come to centers in both programs are included in this table, and after
some consideration I believe that’s appropriate, because it does influence the number
of staff or volunteers needed to handle the chat volume.
This table is color-coded by the minimum number of chat specialists I recommend be
used nationally to staff each shift. The boxes that are blank are hours we currently
have no coverage for, and therefore no data.
l1 l 2 l 3 l 4 l 5 l 6 l 7 l 8 l 9

Age of Visitors
1831
6019
3672
1974 1458
719 748 626 247 133 115 20
10-14 15-19 20-24 25-29 30-34 35-39 40-44 45-49 50-54 55-59 60-64 65+
This chart shows the number of chats we have received from visitors of
each age category year-to-date. Below is the breakdown of percentages
for each age category.
10-14 15-19 20-24 25-29 30-34 35-39 40-44 45-49 50-54 55-59 60-64 65+
10.4% 34.3% 20.9% 11.2% 8.3% 4.1% 4.3% 3.6% 1.4% .8% .7% .1%

Visitor Age & Concerns
Visitors on average are younger than
hotline callers
- 65% under the age of 25
Shift in presenting concerns
- Depression still ranks high (31% of Visitors)
- Also seeing bullying, self harm, eating
disorders, sexuality and gender identity
issues
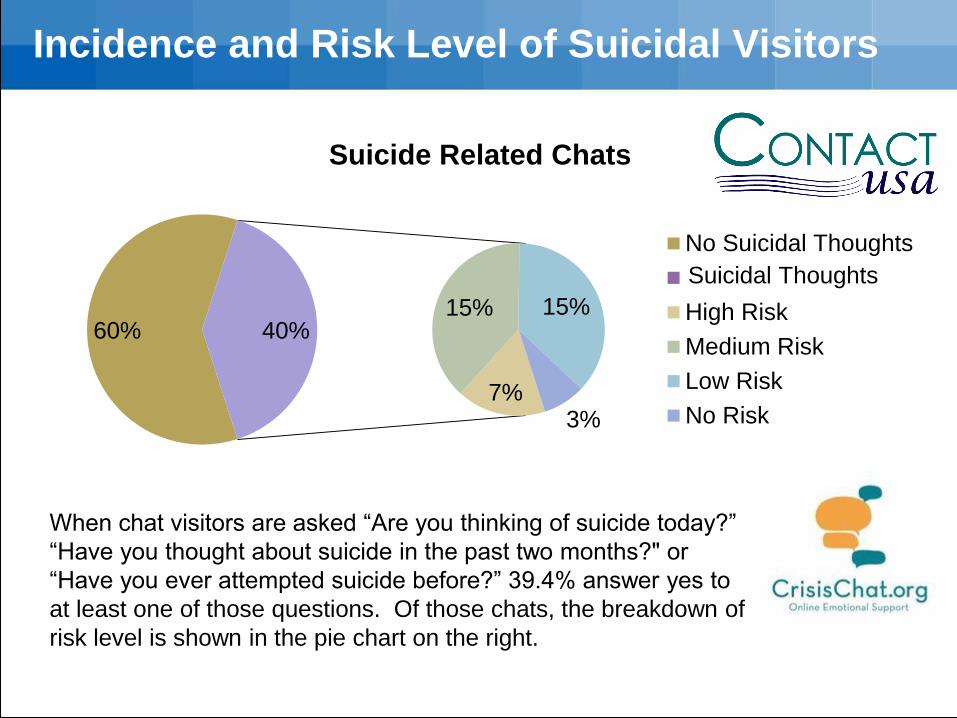
Incidence and Risk Level of Suicidal Visitors
60%
7%
15% 15%
3%
40%
Suicide Related Chats
No Suicidal Thoughts
High Risk
Medium Risk
Low Risk
No Risk
Suicidal Thoughts
When chat visitors are asked “Are you thinking of suicide today?”
“Have you thought about suicide in the past two months?" or
“Have you ever attempted suicide before?” 39.4% answer yes to
at least one of those questions. Of those chats, the breakdown of
risk level is shown in the pie chart on the right.

Risk Assessment & Safety Planning
Risk assessment:
- slower in text-based medium
- affected by out-of-sync communication
Safety Planning:
- especially harder at end of long, in-depth chats
- some Visitors will abruptly end a chat before
safety planning or next steps can be discussed
- some will be unable, resistant, or just not ready
to think proactively about positive next steps

Post-Chat Survey: “Do you feel you have been helped by this chat?”
32
160
57 129
488
282
0
100
200
300
400
500
600
Undecided No, Not atall - I feelvery bad
No, I stillfeel a little
bad
I don't feelbetter orworse
Yes, I feela littlebetter
Yes, I feelmuchbetter
For this chart, only engaged chats were counted. That includes the
chat types “Crisis Chat Visitor,” “3rd Party Visitor,” and “Info only.”
14% of engaged visitors answered this question in the post chat
survey.
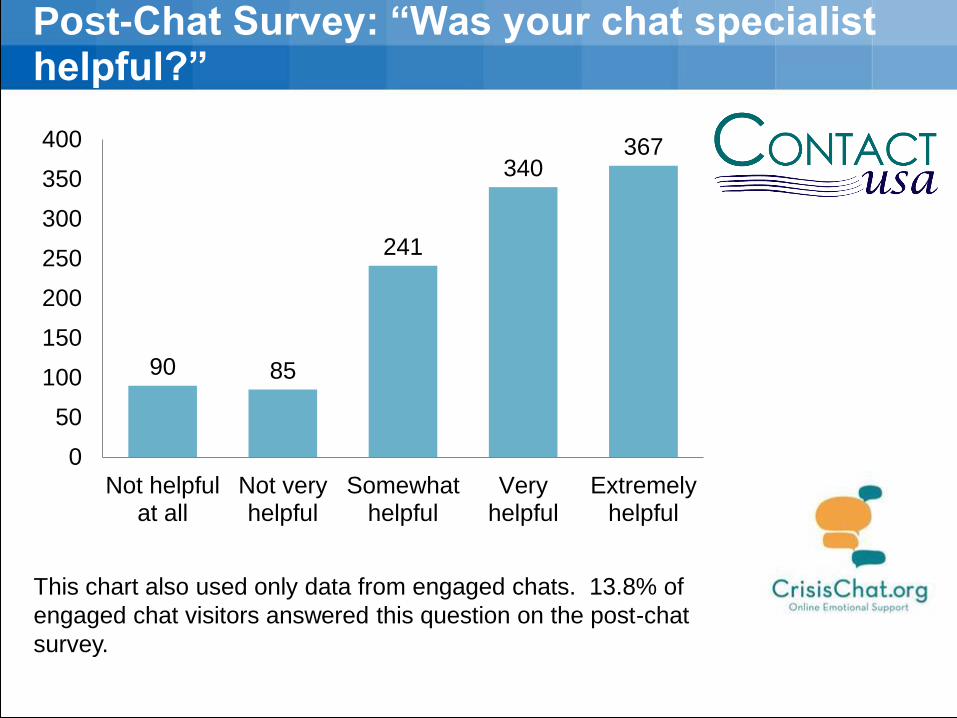
Post-Chat Survey: “Was your chat specialist helpful?”
90 85
241
340 367
0
50
100
150
200
250
300
350
400
Not helpfulat all
Not veryhelpful
Somewhathelpful
Veryhelpful
Extremelyhelpful
This chart also used only data from engaged chats. 13.8% of
engaged chat visitors answered this question on the post-chat
survey.
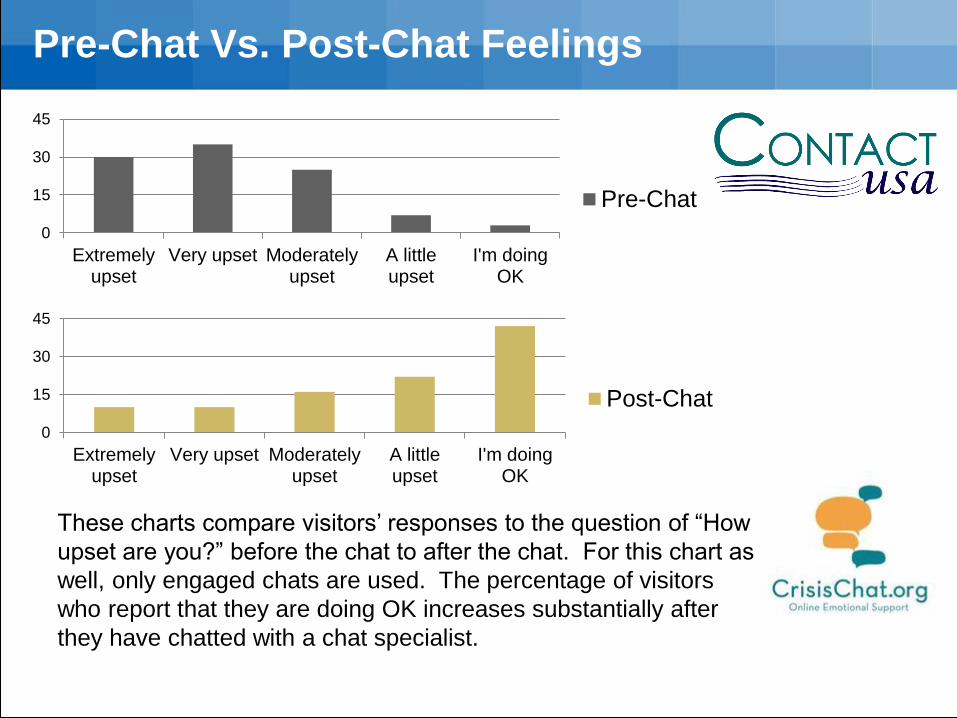
Pre-Chat Vs. Post-Chat Feelings
These charts compare visitors’ responses to the question of “How
upset are you?” before the chat to after the chat. For this chart as
well, only engaged chats are used. The percentage of visitors
who report that they are doing OK increases substantially after
they have chatted with a chat specialist.
0
15
30
45
Extremelyupset
Very upset Moderatelyupset
A littleupset
I'm doingOK
Pre-Chat
0
15
30
45
Extremelyupset
Very upset Moderatelyupset
A littleupset
I'm doingOK
Post-Chat

Summary of Efficacy Results
90% of chat visitors are at
moderate to very high levels of
distress at the time of chat
registration compared to 36% after
the chat.
Only 3% of chat visitors report
being “ok” before the chat, while
42% report being “ok” after the
chat.

Active Rescue:
When is it Appropriate?
Sara Knox
October 2012

Terms and Definitions
Active Engagement: Hotline staff make reasonable efforts to collaborate with callers
with thoughts of suicide to better secure their safety.
Imminent Risk: Based on information gathered during the exchange, Staff believe
that if no actions are taken, the person at risk is likely to seriously
harm or kill him/herself.
Determined if an individual states desire, intent, and capability.
Active Rescue:
Staff take all action necessary to secure the safety of a caller and
initiate emergency response with or without the person at risk’s
consent if they are unwilling or unable to take action on their own
behalf.

Active Rescue
How Often Does it Happen?
A Lifeline study (2007)* of 42,242 calls showed that 2.4% of
calls prompted emergency rescue (range: 0.5% to 8.5%).
* National Suicide Prevention Lifeline. (2010). Policy for Helping Callers
at Imminent Risk of Suicide.
When is Active Rescue Necessary?
“…without rescue services, the helper believes that the
caller is likely to die by suicide.” (Lifeline, p.ii)
Center Staff should only undertake such initiative without the
at-risk individual’s expressed desire to cooperate if they
believe that—without this intervention—the individual is
likely to sustain a life-threatening injury.
SAMPLE CONTACT WITH PERSON AT RISK
Handout:

Things to Consider:
What would you do if you were witnessing or
listening to this conversation?
Would you call 911?
What details influence that decision?
How would you explain that decision to the
helper?

SAMPLE CONTACT WITH PERSON AT RISK #2
Handout:

Things to Consider:
What would you do if you were witnessing or
listening to this contact?
Would you call 911?
What details influence that decision?
How would you explain that decision to the
helper?