Embed Size (px)
Citation preview

Onion ReportBrand Health& Demographics
•Source: • Nielsen Homescan data until 111h of June 2011• Nielsen Scantrack data (National Woolworths) until 05th June 2011
2
Copyright © 2011 The Nielsen Company. Confidential and proprietary.
Onion…..
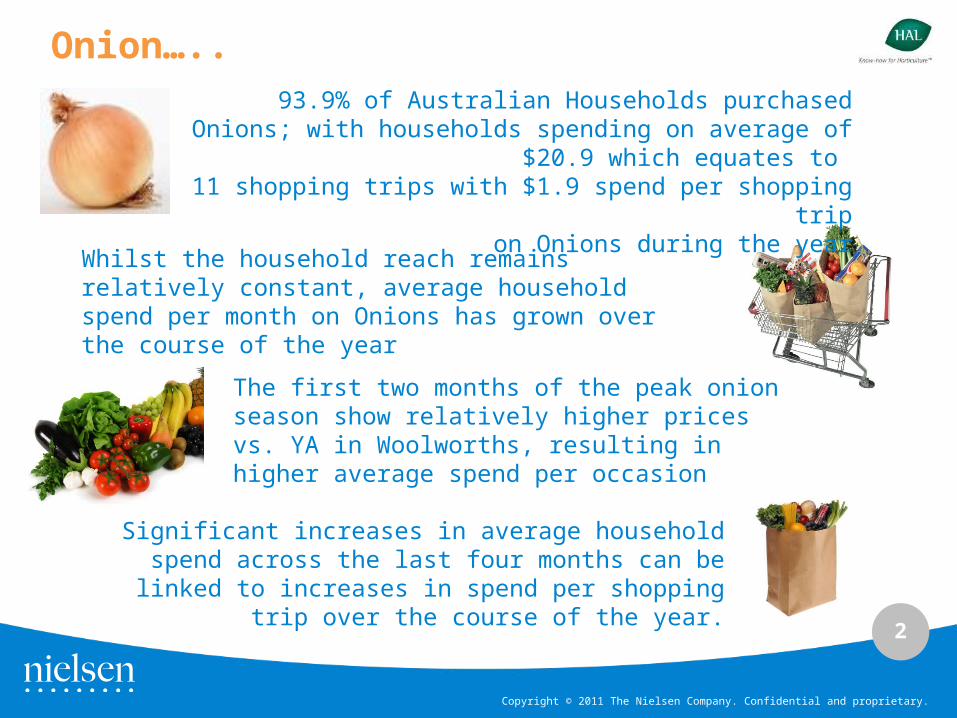
Whilst the household reach remains relatively constant, average household spend per month on Onions has grown over the course of the year
93.9% of Australian Households purchased Onions; with households spending on average of $20.9 which equates to
11 shopping trips with $1.9 spend per shopping tripon Onions during the year
The first two months of the peak onion season show relatively higher prices vs. YA in Woolworths, resulting in higher average spend per occasion
Significant increases in average household spend across the last four months can be linked to increases in spend per
shopping trip over the course of the year.

3
Copyright © 2011 The Nielsen Company. Confidential and proprietary.
Whilst all Lifestage groups have increased their average household spend on Onions, Young
Transitional households have seen the largest decrease in their contribution to commodity sales
Both Woolworths and ALDI has seen exceptional Onion values sales and SOT of trade growth through increased purchase frequency and higher spend per occasion…..
Opportunity to drive purchase frequency with Independent Grocers!
Onion…..
ALDI was the only retailer successful in growing its Onion buyer base over the last year; this was done whilst also growing average spend per household

4
Copyright © 2011 The Nielsen Company. Confidential and proprietary.
Key Measures

5
Copyright © 2011 The Nielsen Company. Confidential and proprietary.
* New Nielsen Scanning guides began capturing loose Zucchini/Courgette, Snow/Snap Peas, Cabbage, and Sweet Potato/Kumara purchasing despatched to panel in Sept 2009
Over the last year, 93.9% of Australian Households purchased Onions; with Households spending on average $20.9 on the commodity
Nielsen Homescan data until 11th June 2011
6
Copyright © 2011 The Nielsen Company. Confidential and proprietary.
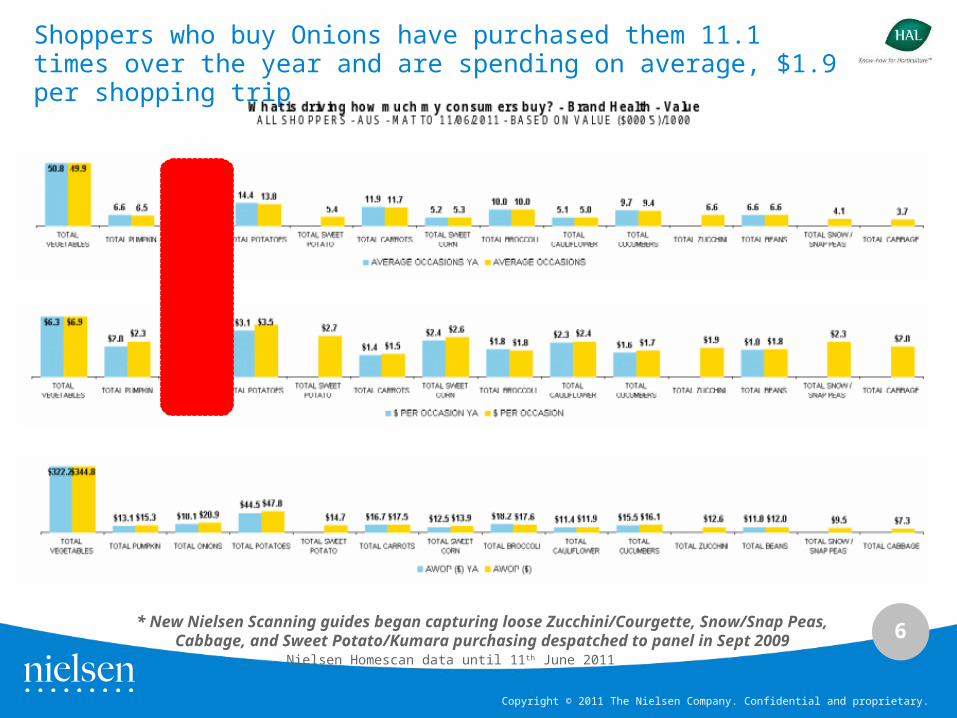
* New Nielsen Scanning guides began capturing loose Zucchini/Courgette, Snow/Snap Peas, Cabbage, and Sweet Potato/Kumara purchasing despatched to panel in Sept 2009
Shoppers who buy Onions have purchased them 11.1 times over the year and are spending on average, $1.9 per shopping trip
Nielsen Homescan data until 11th June 2011
7
Copyright © 2011 The Nielsen Company. Confidential and proprietary.
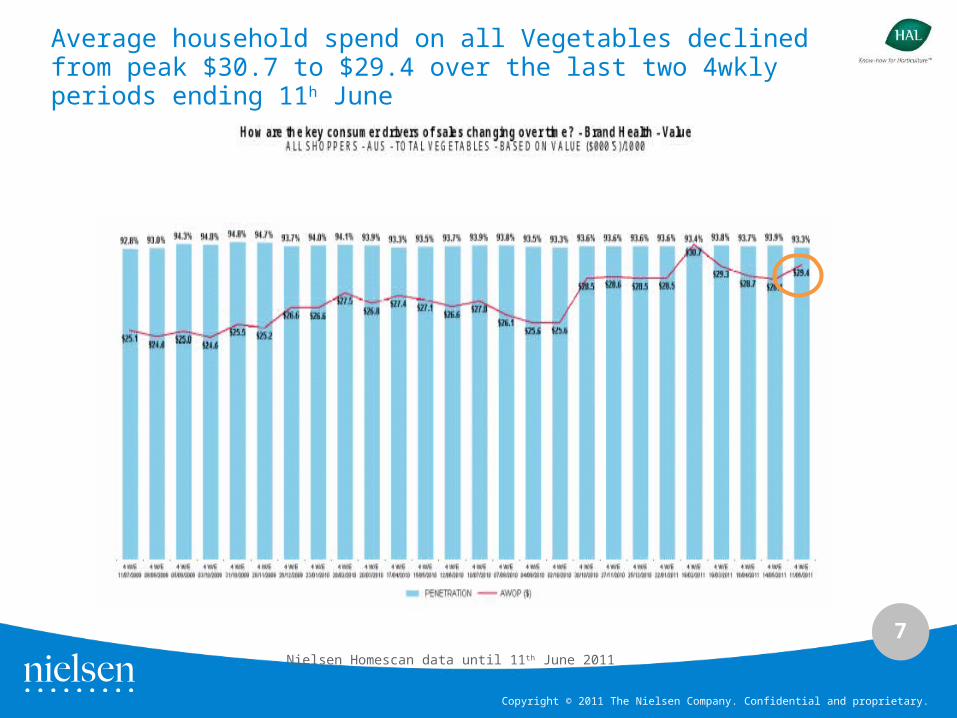
Average household spend on all Vegetables declined from peak $30.7 to $29.4 over the last two 4wkly periods ending 11h June
Nielsen Homescan data until 11th June 2011

8
Copyright © 2011 The Nielsen Company. Confidential and proprietary.
Whilst the household reach remains relatively constant, average household spend per month on Onions has grown over the course of the year
Nielsen Homescan data until 11th June 2011

9
Copyright © 2011 The Nielsen Company. Confidential and proprietary.
Significant increases in average Household spend across the last four months can be linked to increases in spend per shopping trip over the course of the year
Nielsen Homescan data until 11th June 2011

10
Copyright © 2011 The Nielsen Company. Confidential and proprietary.
Onion sales has declined by -0.8% in volume and sales have increased by 24.0% in value year on year whilst pricing has increased by $0.6
Nielsen ScanTrack data until 05th June 2011
11
Copyright © 2011 The Nielsen Company. Confidential and proprietary.
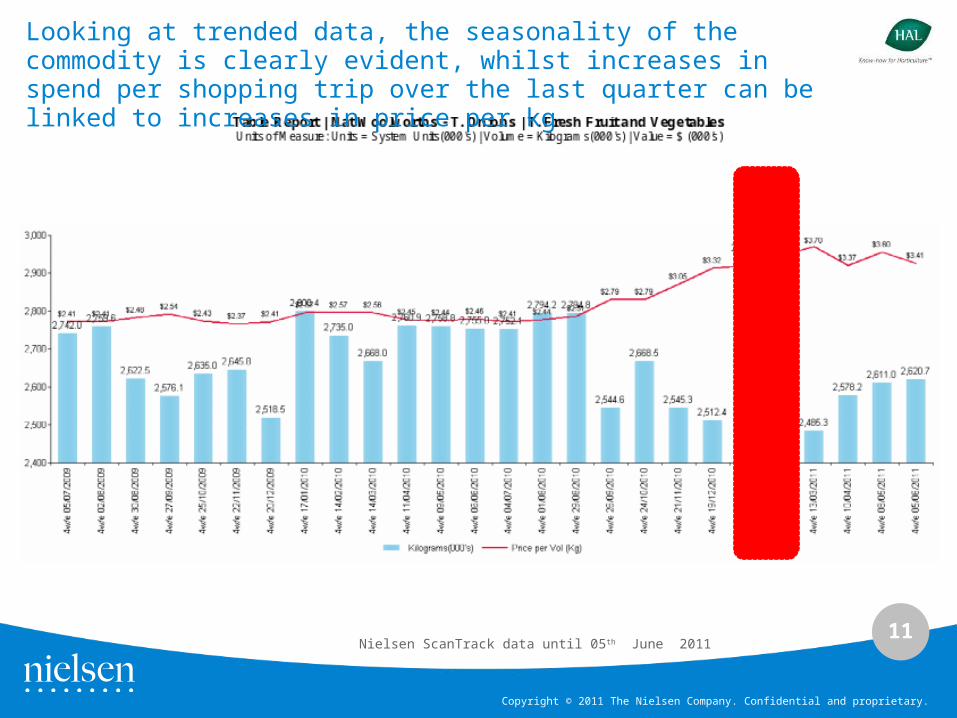
Looking at trended data, the seasonality of the commodity is clearly evident, whilst increases in spend per shopping trip over the last quarter can be linked to increases in price per kg
Nielsen ScanTrack data until 05th June 2011

12
Copyright © 2011 The Nielsen Company. Confidential and proprietary.
Demographics
13
Copyright © 2011 The Nielsen Company. Confidential and proprietary.
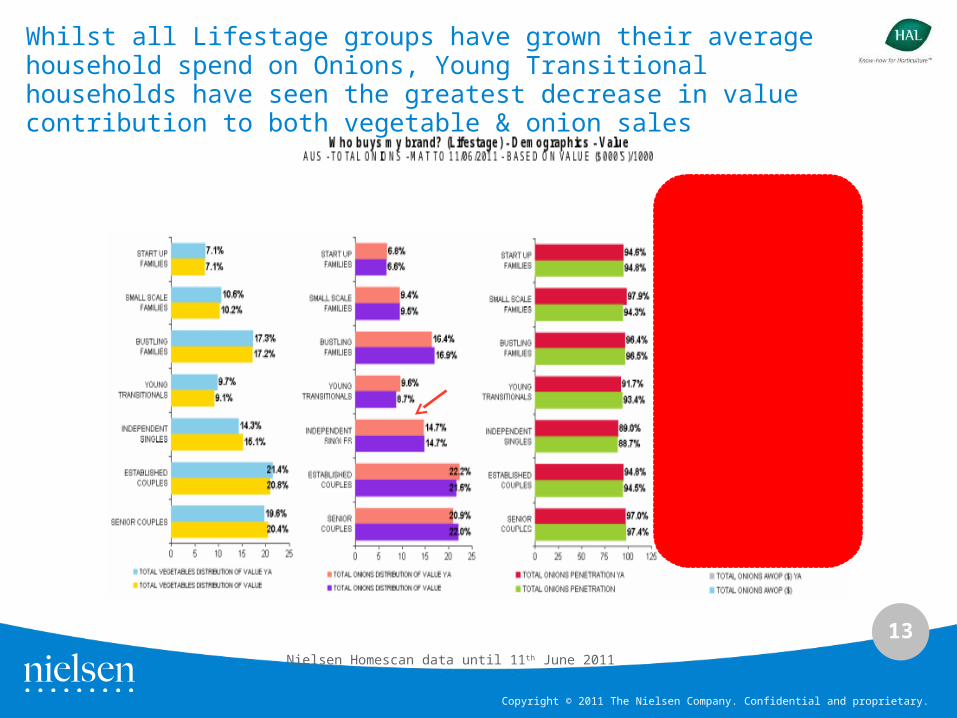
Whilst all Lifestage groups have grown their average household spend on Onions, Young Transitional households have seen the greatest decrease in value contribution to both vegetable & onion sales
Nielsen Homescan data until 11th June 2011
14
Copyright © 2011 The Nielsen Company. Confidential and proprietary.
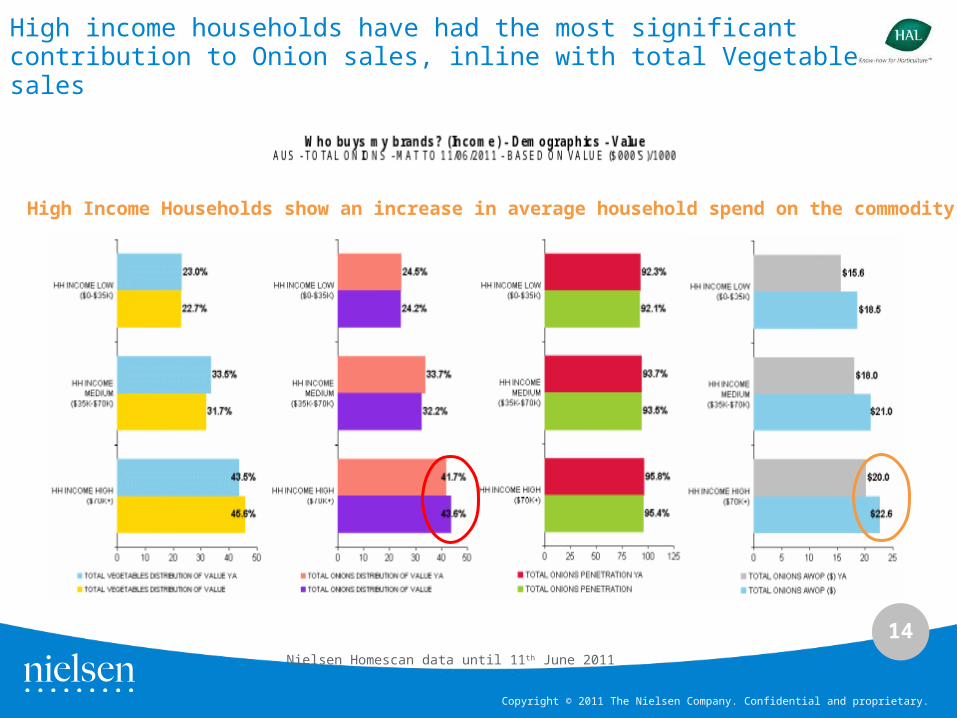
High income households have had the most significant contribution to Onion sales, inline with total Vegetable sales
Nielsen Homescan data until 11th June 2011
High Income Households show an increase in average household spend on the commodity
15
Copyright © 2011 The Nielsen Company. Confidential and proprietary.
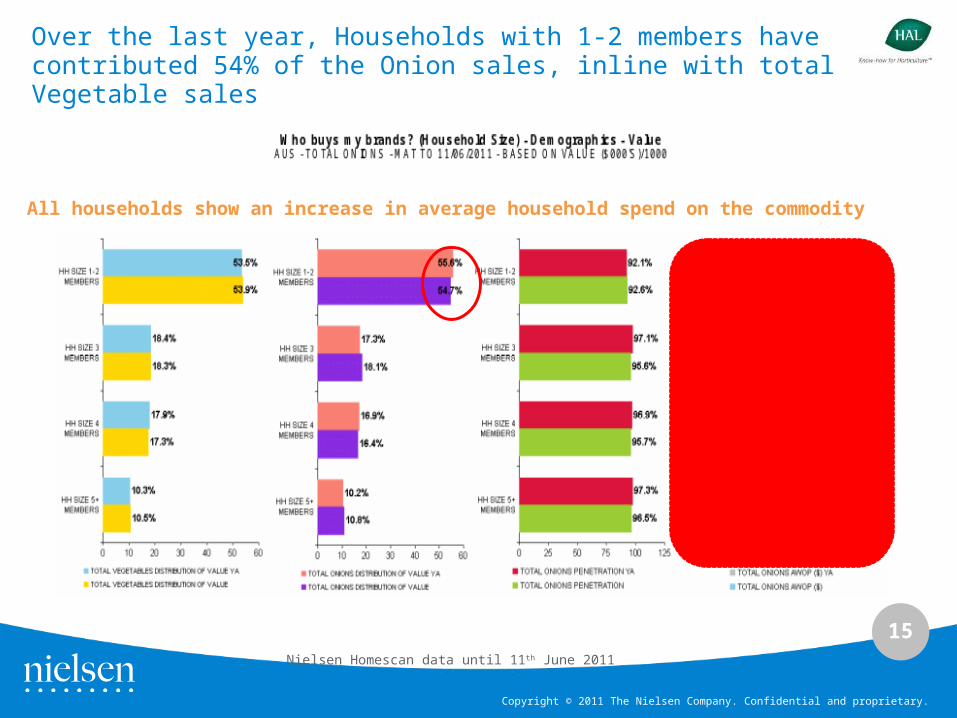
Over the last year, Households with 1-2 members have contributed 54% of the Onion sales, inline with total Vegetable sales
Nielsen Homescan data until 11th June 2011
All households show an increase in average household spend on the commodity

16
Copyright © 2011 The Nielsen Company. Confidential and proprietary.
Share of Trade

17
Copyright © 2011 The Nielsen Company. Confidential and proprietary.
Onions realised strong value growth across all retailers, with both Woolworths and ALDI making significant share of trade gains
Nielsen Homescan data until 11th June 2011
18
Copyright © 2011 The Nielsen Company. Confidential and proprietary.
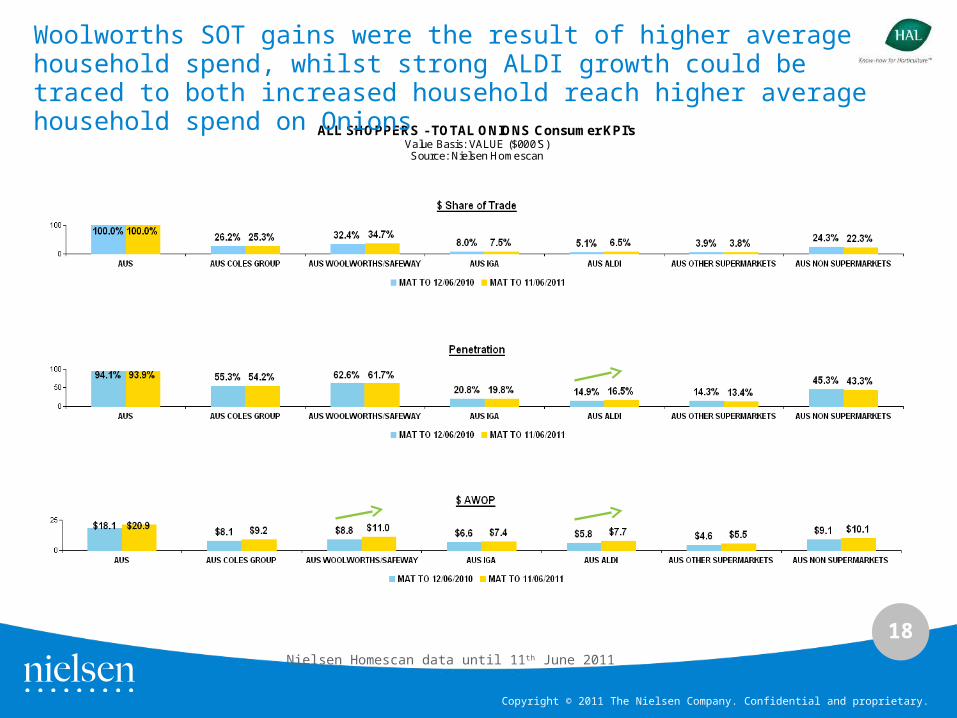
ALL SHOPPERS - TOTAL ONIONS Consumer KPI'sValue Basis: VALUE ($000'S) Source: Nielsen Homescan
Woolworths SOT gains were the result of higher average household spend, whilst strong ALDI growth could be traced to both increased household reach higher average household spend on Onions
Nielsen Homescan data until 11th June 2011
19
Copyright © 2011 The Nielsen Company. Confidential and proprietary.
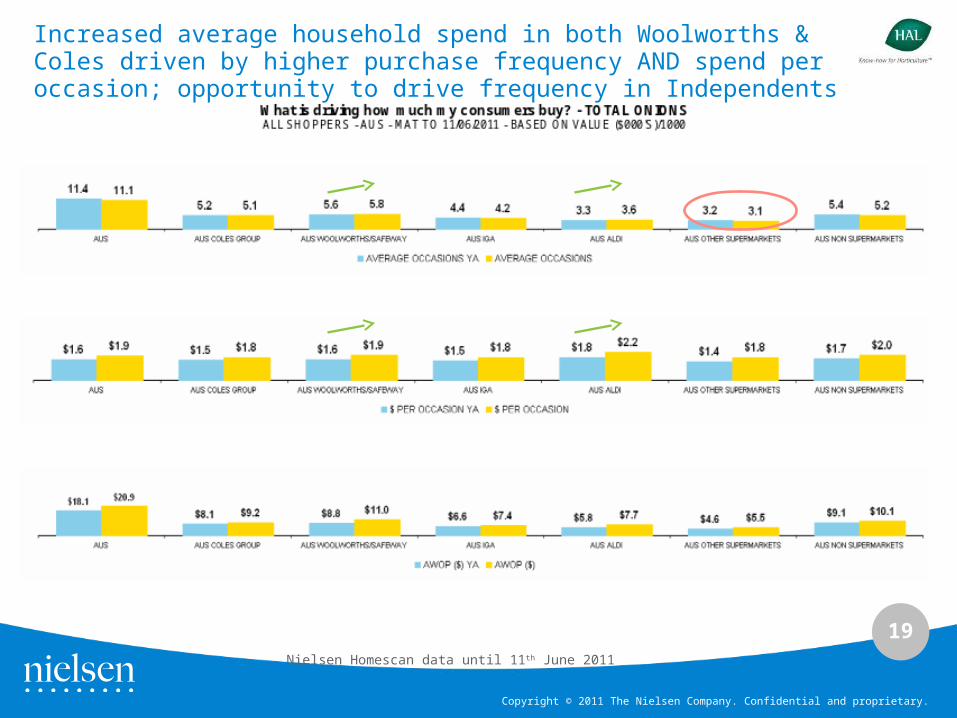
Increased average household spend in both Woolworths & Coles driven by higher purchase frequency AND spend per occasion; opportunity to drive frequency in Independents
Nielsen Homescan data until 11th June 2011

20
Copyright © 2011 The Nielsen Company. Confidential and proprietary.
Glossary

21
Copyright © 2011 The Nielsen Company. Confidential and proprietary.
Terms• Penetration – The proportion of households purchasing a product in the
specified period expressed as a percentage of all households.
• Average Weight of Purchase (AWOP) – The average volume/value/units of a product bought across all buyers of that product in the specified period.
• Occasions Per Buyer – The average no. of times each buyer purchases the specified product in a specified period. A product/date/shop combination, eg. a household purchasing 2 identical products on a shopping trip to Woolworths constitutes a single purchase occasion.
• Amount Per Occasion – Average value or units purchased on each purchase occasion.
• QTR – Quarter year; rolling 13 weeks.
• MAT – Moving annual total; a rolling yearly total which accumulates 52 weeks of data.
• PP – Prior Period
• YA – Year Ago.
22
Copyright © 2011 The Nielsen Company. Confidential and proprietary.
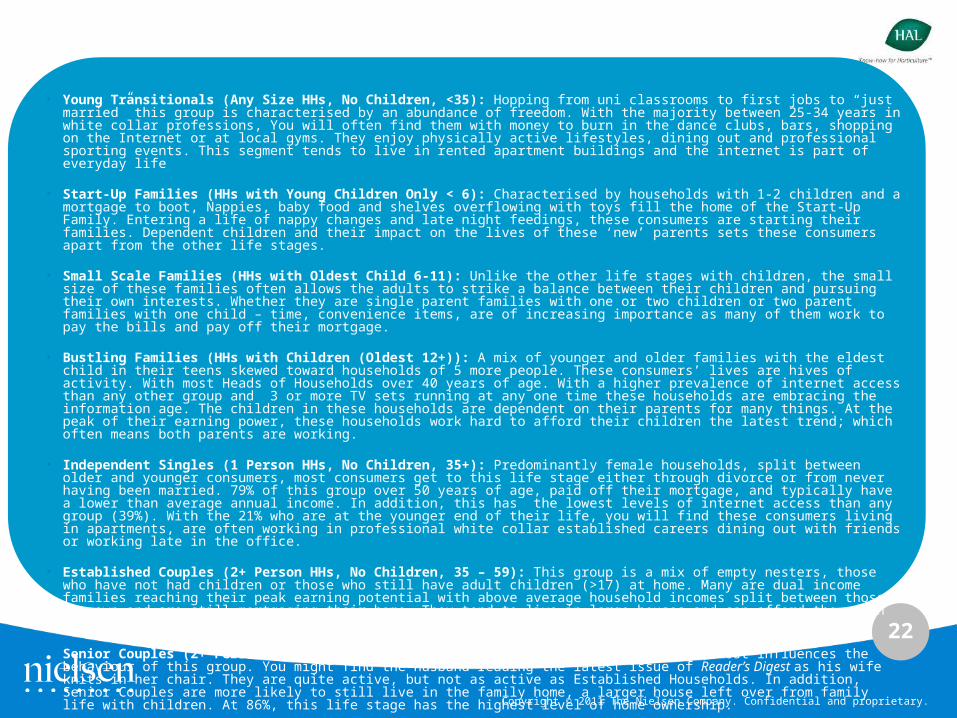
• Young Transitionals (Any Size HHs, No Children, <35): Hopping from uni classrooms to first jobs to “just married” this group is characterised by an abundance of freedom. With the majority between 25-34 years in white collar professions, You will often find them with money to burn in the dance clubs, bars, shopping on the Internet or at local gyms. They enjoy physically active lifestyles, dining out and professional sporting events. This segment tends to live in rented apartment buildings and the internet is part of everyday life
• Start-Up Families (HHs with Young Children Only < 6): Characterised by households with 1-2 children and a mortgage to boot, Nappies, baby food and shelves overflowing with toys fill the home of the Start-Up Family. Entering a life of nappy changes and late night feedings, these consumers are starting their families. Dependent children and their impact on the lives of these ‘new’ parents sets these consumers apart from the other life stages.
• Small Scale Families (HHs with Oldest Child 6-11): Unlike the other life stages with children, the small size of these families often allows the adults to strike a balance between their children and pursuing their own interests. Whether they are single parent families with one or two children or two parent families with one child – time, convenience items, are of increasing importance as many of them work to pay the bills and pay off their mortgage.
• Bustling Families (HHs with Children (Oldest 12+)): A mix of younger and older families with the eldest child in their teens skewed toward households of 5 more people. These consumers’ lives are hives of activity. With most Heads of Households over 40 years of age. With a higher prevalence of internet access than any other group and 3 or more TV sets running at any one time these households are embracing the information age. The children in these households are dependent on their parents for many things. At the peak of their earning power, these households work hard to afford their children the latest trend; which often means both parents are working.
• Independent Singles (1 Person HHs, No Children, 35+): Predominantly female households, split between older and younger consumers, most consumers get to this life stage either through divorce or from never having been married. 79% of this group over 50 years of age, paid off their mortgage, and typically have a lower than average annual income. In addition, this has the lowest levels of internet access than any group (39%). With the 21% who are at the younger end of their life, you will find these consumers living in apartments, are often working in professional white collar established careers dining out with friends or working late in the office.
• Established Couples (2+ Person HHs, No Children, 35 – 59): This group is a mix of empty nesters, those who have not had children or those who still have adult children (>17) at home. Many are dual income families reaching their peak earning potential with above average household incomes split between those who own and are still mortgaging their home. They tend to live in large houses and can afford the often three TV’s, internet access and all the mod cons our busy lifestyles have become accustom to.
• Senior Couples (2+ Person HHs, No Children, 60+): Companionship, rather than age, most influences the behaviour of this group. You might find the husband reading the latest issue of Reader’s Digest as his wife knits in her chair. They are quite active, but not as active as Established Households. In addition, Senior Couples are more likely to still live in the family home, a larger house left over from family life with children. At 86%, this life stage has the highest level of home ownership.

23
Copyright © 2011 The Nielsen Company. Confidential and proprietary.
*All Other supermarkets includes; Franklins, Ritchies, SPAR & Independents
Woolworths has held the dominant share of trade within Onions, contributing 34.7% of sales whilst ALDI has grown their share significantly over the last year
Nielsen Homescan data until 11th June 2011