Embed Size (px)
Citation preview
Dynamic Article LinksC<Journal ofMaterials Chemistry
Cite this: J. Mater. Chem., 2012, 22, 3825
www.rsc.org/materials PAPER
Dow
nloa
ded
by U
nive
rsity
of
Tor
onto
on
18 M
arch
201
3Pu
blis
hed
on 2
0 Ja
nuar
y 20
12 o
n ht
tp://
pubs
.rsc
.org
| do
i:10.
1039
/C2J
M13
929D
View Article Online / Journal Homepage / Table of Contents for this issue
One-pot synthesis of large scale graphene nanosheets from graphite–liquidcrystal composite via thermal treatment†
Afsaneh Safavi,* Maryam Tohidi, Farzaneh Aghakhani Mahyari and Hamidreza Shahbaazi‡
Received 12th August 2011, Accepted 28th November 2011
DOI: 10.1039/c2jm13929d
An easy and cost effective route for mass production of graphene nanosheets (GNSs) is an essential
requirement for design of different sensors, conductive composites and future nanoelectronic devices.
Scalable and large area GNSs were synthesized by a thermal treatment of a graphite–ionic liquid crystal
composite as a starting material. This composite was heated in a furnace with a flow of argon gas at 700�C for 1 h. Intercalation of ionic liquid crystals between graphite layers, their decomposition and
evolution of gases assist in exfoliation of graphite and separation of layers. The proposed method
extends the scope for production of high-quality, high-yield, unoxidized and defects free GNSs for
a wide range of applications. The ability to produce bulk GNSs from a graphitic precursor with an easy
and relatively low-cost approach can propel us to real-world applications of GNSs.
Introduction
Graphene has changed its status from being an unexpected
newcomer to a glamorous star in different fields of science and
technology.1 Graphene is expected to be comprised of a single
layer, but there is considerable interest in investigating bi-layer
and few-layer graphenes as well. Synthesis and characterization
of graphenes pose challenges, but there has been considerable
progress in the past few years or so.2
Mechanical exfoliation of graphene from graphite led to the
discovery of graphene nanosheets (GNSs).2,3 Its low productivity
makes it unsuitable for large-scale utilization.4,5 Chemical vapor
deposition (CVD) and epitaxial growth have been used for
synthesis of large area GNSs.2,6,7 However, it is usually necessary
to transfer the sample to other substrates in order to make useful
devices.8 Epitaxial growth of graphene films by vacuum graphi-
tization is another approach to obtain graphene.2,4,7,9 However,
this method suffers from the need for ultrahigh vacuum condi-
tions which is expensive.8,10
Conversion of nanodiamond, arc evaporation of graphite in
the presence of H2/He mixtures and microwave plasma-enhanced
CVD are also used for production of graphene which need very
expensive reagents and/or equipment.2 These methods produce
some quantities of other unwanted carbonaceous materials.11–13
Department of Chemistry, College of Sciences, Shiraz University, Shiraz,71454, Iran. E-mail: [email protected]; Fax: +98-711-2286008;Tel: +98-711-6137351
† Electronic supplementary information (ESI) available: Optical imagesof GOx and GNSs suspension in water, flake-like graphite–ILCcomposite and GNSs. SEM and TEM images of different ratios ofgraphite–ILC composite before and after thermal treatment. Ramanspectra of bi-layers GNS. See DOI: 10.1039/c2jm13929d
‡ Present address: Chemistry Department, University of Calgary, 2500Uni. Dr. NW, Calgary AB, Canada T2N1N4.
This journal is ª The Royal Society of Chemistry 2012
Bulk production of graphene with chemical or thermal
reduction of graphene oxide (GOx) has also been reported.4,7,14,15
Although this low cost method is efficient for the production of
single-layer graphene, this method has lengthy experimental
times and utilizes highly dangerous and toxic oxidizing and
reducing reagents. In fact, GOx is an insulator rather than
a semi-metal and is different from graphene.16 Although the
functional groups can be removed by reduction, this leaves
a significant number of defects, which disrupt the electronic
properties.17 Recently, exfoliation of natural graphite in various
solvents by sonication has been reported.18–20 This method
provides sufficient solvent–graphene interaction to balance the
energy cost for expansion of graphite layers. Although direct
liquid-phase exfoliation offers several advantages such as
simplicity and low cost, the resulting colloidal suspensions of
graphene are at low concentrations with small flakes.20,21 Also,
the dispersed GNSs tend to aggregate with drying.22 Sometimes,
after drying, residues of solvents remain, which prevent the
aggregation of graphene layers, but deleteriously affects its
potential applicability.18,20
In other methods, graphite is partially exfoliated by reactions
involving the intercalant,23 or through thermal shock following
acid treatment of natural or expandable graphite.18,24,25 These
methods are time-consuming.
Electrochemical exfoliation of graphite is another approach for
synthesis ofGNSs.26Recently, a solution routewas introduced for
the high-yield exfoliation of graphite into few-layer GNSs.27 This
method requires high voltage and is multi step with a long soni-
cation time that results in small flakes of GNSs.27 Therefore,
a facile, simple and direct approach to produce large-scale and
defects free GNSs with large area remains a great challenge.
Ionic liquids (ILs) are used for preparation of GNSs in several
approaches such as electrochemical methods28 and exfoliation of
J. Mater. Chem., 2012, 22, 3825–3831 | 3825

Dow
nloa
ded
by U
nive
rsity
of
Tor
onto
on
18 M
arch
201
3Pu
blis
hed
on 2
0 Ja
nuar
y 20
12 o
n ht
tp://
pubs
.rsc
.org
| do
i:10.
1039
/C2J
M13
929D
View Article Online
natural graphite by sonication because of their unique proper-
ties.19,20 Liquid crystals (LCs) are considered as the fourth state
of matter.29 Ionic liquid crystals (ILCs) can be considered as
materials that combine the properties of LCs and ILs.30 The ILC,
1,10-didodecyl-4,40-bipyridinium bis(triflimide), known as viol-
ogen is a thermotropic ILC (Scheme 1). Recently, we made use of
this ILC as a binder to fabricate new carbon composite elec-
trodes.31 Here, we report a one-pot, large-scale synthesis of high-
quality GNSs using thermal treatment of a graphite–ILC
composite.
Experimental methods
Chemicals
Graphite powder (particle size <100 mm, purity 99.9%) was
purchased from Fluka (Product Number 332461). 1,10-Dido-
decyl-4,40-bipyridinium bis(triflimide) was synthesized as
described elsewhere.31,32
Sample preparation
The graphite–ILC composite was prepared easily by hand-mix-
ing, in a mortar, the graphite powder and ILC with graphite/ILC
ratio of 30/70 (w/w). The uniform graphite–ILC composite was
prepared with successive mixing and heating to 100 �C. The
viscosity of ILC reduces with increasing temperature. Therefore,
repetitive mixing and heating of the composite can be effective in
increasing the homogeneity of the composite. The samples were
heated in a tube furnace (Azar Furnace-Iran, equipped with gas
flow lines) using argon (Ar) flow. The temperature programming
for GNSs preparation was heating up to 700 �C with a ramp of
3 �C min�1 and then remaining at 700 �C for 60 min. Graphite
oxide was synthesized from graphite by the Hummers method.33
The as-synthesized graphite oxide was suspended in water to give
GOx.4 Brown dispersion of GOx in water can be observed with
respect to black GNSs dispersion (ESI, Fig. S1†). It should be
mentioned that the dispersed GNSs are not stable more than
several minutes due to their defect-free (no oxygenated func-
tional groups) structures.
Scheme 1 Schematic presentation of GNSs synthesis process. Intercalation of
assist in exfoliation of graphite and separation of layers.
3826 | J. Mater. Chem., 2012, 22, 3825–3831
Characterization techniques
Scanning electron microscope (SEM) images were obtained by
Philips XL30 and Hitachi S-4160 field emission SEM (FESEM)
at accelerating voltages of 25 and 30 kV, respectively. High
resolution transmission electron microscope (HRTEM) and
TEM images were taken with electronic microscope (Tecnai F20-
200KV) and a Leo 912 AB, respectively. Atomic force micro-
scope (AFM) images were taken with Agilent 5500. Raman
spectroscopy was performed on a Jobin-Yvon LabRAM H800
with He-Ne laser of 633 nm as excitation source, spot size: 1 mm.
Spectra were taken on an extended range (100–4200 cm�1).
For Raman analysis, individual flakes were deposited from
dispersed GNSs in chlorobenzene onto a SiO2/Si substrate using
spin coating method. The 2D peaks of Raman spectra were fitted
by Lorentzian fitting. X-Ray photoemission spectroscopy (XPS)
measurements were conducted with an XR3E2 (VG Microtech)
twin anode X-ray source using Al-Ka ¼ 1486.6 eV. X-Ray
diffraction (XRD) patterns were obtained by using a D8
ADVANCE type (BRUKER-Germany) with Cu-Ka radiation
(l¼ 0.1542 nm). Powder XRD patterns were taken in 0.02� stepsat 1 s per step. FT-IR spectra were obtained by a Shimadzu FT-
IR 8300 spectrometer.
Results and discussion
Thermotropic ILC, 1,10-didodecyl-4,40-bipyridinium bis(tri-
flimide), has been used for preparation of the graphite–ILC
composite with different ratios (graphite/ILC: 70/30, 50/50 and
30/70 (w/w)) as the starting material for the synthesis of GNSs
(Scheme 1). This ILC compound has a smecticX (Smx) LC phase
at room temperature in which the molecules are arranged in
layers.31,32 The Sm phase of this ILC compound is stable up to its
decomposition temperature at 356 �C. Thus, it exhibits the widestrange of LC phase among all of the viologen salts.32 Interestingly,
the mixture of this ILC with graphite showed a layered appear-
ance and flake structure (ESI, Fig. S2A†). It is understood that
the inter-graphene layers in graphite can be intercalated by
various molecular species or ions.23,24,34,35 The graphite–ILC
composite was heated in a tube furnace under a flow of Ar.
ILCs between graphite layers, their decomposition and evolution of gases
This journal is ª The Royal Society of Chemistry 2012

Dow
nloa
ded
by U
nive
rsity
of
Tor
onto
on
18 M
arch
201
3Pu
blis
hed
on 2
0 Ja
nuar
y 20
12 o
n ht
tp://
pubs
.rsc
.org
| do
i:10.
1039
/C2J
M13
929D
View Article Online
Different temperatures and exposure times were examined to
obtain optimum conditions (heating up to 700 �C with a ramp of
3 �C min�1 and then remaining for 60 min) for GNSs synthesis.
With increasing the temperature, the reduction in viscosity of
ILC occurred. Prior to its decomposition temperature (356 �C),this bipyridinium ILC with Sm phase are arranged in layered
structures and can penetrate within the layers in graphite. It is
believed that similar to what has been reported for ILs,36 LCs
and ILCs with unsaturated groups can have p–p stacking with
aromatic carbon structures. After 356 �C up to 700 �C, ILCdecomposition occurred. As suggested previously, decomposi-
tion of ILs with fluorine-containing anions such as BF4, PF6 and
NTf2, results in formation of hydrogen fluoride (HF), alkenes,
haloalkanes, phosphorus-containing compounds, CF3H or
SO2.37 The evolution of gases due to decomposition of ILC can
result in exfoliation of graphite and assists in separation of
graphite layers (Scheme 1).23 It is noteworthy to mention that the
flow of Ar gas during the thermal treatment process prevents the
oxidation of graphite and the final product, GNSs. As will be
discussed later, the results of some characterization techniques
will support this dramatic advantage. Thus, the proposed
method results in large scale production of unoxidized GNSs
(ESI, Fig. S2B†).
The GNSs produced herein have been characterized by
a variety of microscopic and other physical techniques including
SEM, FESEM, TEM, HRTEM, AFM, XPS, XRD, FT-IR and
Raman spectroscopy.
SEM images of the graphite–ILC composite before and after
optimum thermal treatment were investigated. SEM observation
of this composite before thermal treatment shows the formation
of flake-like structures (ESI, Fig. S3†). For GNSs synthesis,
different ratios of graphite/ILC (w/w) such as 70/30, 50/50 and
30/70 (w/w) were examined (Fig. 1, ESI, Fig. S4 and S5†). The
SEM images of the synthesized GNSs in the ratio of 30/70 (w/w)
graphite/ILC are shown in Fig. 1. It is crucial to ascertain the
exfoliation state of the products after thermal treatment. It was
found that with decreasing the ratio of graphite/ILC up to 30/70,
Fig. 1 FESEM images of the producedGNSs at different magnification ((b) a
(h) are images of the GNSs with some generated hexagonal holes in their struc
composite with a ratio of 30/70 (w/w).
This journal is ª The Royal Society of Chemistry 2012
the exfoliation of graphite to graphene layers was increased. This
can be due to increasing the intercalation of ILC into graphite
and evolution of gases.23 Further decrease in this ratio (30/70 of
graphite/ILC) had no significant effect on the synthesized
product.
As it can be seen in Fig. 1g and 1h, some hexagonal holes are
generated in GNSs with a graphite/ILC ratio of 30/70, which are
ascribed to evolution of gases. From the SEM images, it can be
seen that GNSs were exfoliated into very thin layers. The high
magnification SEM image (Fig. 1b) demonstrates thin and folded
platelets transparent to the electrons. As reported previously,
scrolling is intrinsic to GNSs due to thin thickness.38 As a control
experiment, graphite powder without ILC was treated with the
same thermal conditions (blank sample). We examined the state
of the natural graphite powder and blank sample compared to
synthesized GNSs using SEM images (ESI, Fig. S6†). No
significant alteration was observed between the blank sample and
natural graphite powder (ESI, Fig. S6 and S7†). In contrast,
a considerable difference was distinguished between synthesized
GNSs and the blank sample.
The obtained GNSs were analyzed using TEM and HRTEM
by drop casting from the dispersion onto grids (Fig. 2 and ESI,
Fig. S8†). Fig. 2 shows the TEM images of the synthesized GNSs
in the ratios of 30/70 and 50/50 (w/w) graphite/ILC. The fully
exfoliated GNSs are transparent and exhibit a very stable nature
under the electron beam. Some of the GNSs tend to fold and
crumple slightly and thus become thermodynamically more
stable.38 Thinner GNSs were observed in the ratio of 30/70 (w/w)
graphite/ILC (Fig. 2 and ESI, Fig. S8†). A more definitive
identification of graphene can be made by electron diffraction
patterns.18 The inset of Fig. 2a shows the electron diffraction
pattern of the GNSwhich confirms its crystalline nature. Also for
comparison, the TEM image of the original graphite–ILC
composite was investigated (ESI, Fig. S9†). A significant differ-
ence was observed in the transparency of the graphite–ILC
composite and GNSs due to the diversity of their thicknesses.
The representative images from these techniques indicate that the
nd (d) are higher magnification of (a) and (c) images, respectively). (g) and
tures. Synthesis conditions: optimum thermal treatment of graphite–ILC
J. Mater. Chem., 2012, 22, 3825–3831 | 3827

Fig. 2 HRTEM (a)–(b) and TEM (c)–(d) images of the produced GNSs
with thermal treatment of the graphite–ILC composite with ratios of (a)–
(b) 30/70 (w/w) and (c)–(d) 50/50 (w/w). Inset: electron diffraction pattern
of GNS.
Dow
nloa
ded
by U
nive
rsity
of
Tor
onto
on
18 M
arch
201
3Pu
blis
hed
on 2
0 Ja
nuar
y 20
12 o
n ht
tp://
pubs
.rsc
.org
| do
i:10.
1039
/C2J
M13
929D
View Article Online
lateral sizes of GNSs are typically a few micrometres. By
analyzing a large number of TEM images, paying close attention
to the sheet edges, it was possible to generate sheet thickness
statistics as shown in Fig. 3. From these data we can estimate the
fraction of bi-layer and multi-layer GNSs (number of layers/total
number of observed sheets). On the basis of statistical sampling it
was estimated that 15%, 30%, 37% and 18% of the GNSs
comprised 2–3, 4, 5–10 and >10 layers of graphene, respectively
(see the histogram in Fig. 3d).
According to SEM and TEM results, the ratio of 30/70 (w/w)
graphite/ILC was selected for further analysis and
characterizations.
AFM was used to examine the thickness of the GNSs. Fig. 4
displays a typical tapping-mode AFM image of GNSs, exhibiting
sheet heights of �1–1.8 nm. This reveals characteristics of bi-
layer and multi-layer GNSs.39
Fig. 3 High magnification TEM images showing edges of the GNSs
consisting of (a) 2 and 8, (b) 4 and 5, and (c) 8 layers. (d) Histogram of the
number of sheets as a function of the number of layers per sheets.
3828 | J. Mater. Chem., 2012, 22, 3825–3831
Raman spectroscopy is a powerful nondestructive tool to
characterize carbonaceous materials, particularly for dis-
tinguishing ordered and disordered crystal structures of carbon.5
The typical features for carbon in Raman spectra are three peaks
that are observed at 1350 cm�1 (D band), 1580 cm�1 (G band)
and 2700 cm�1 (2D band).40 The G and D bands are attributed to
the first-order scattering of the E2g vibrational mode in graphite
sheets and structural defects (disorder-induced modes), respec-
tively.41,42 The second-order scattering is the 2D band which is
the overtone of the D band.42 Also, the so-called D0 peak can be
seen around �1620 cm�1 in defected graphite.18,43 Generally,
a perfect graphite crystal does not exhibit the D band. But, in
some methods, during the chemical or physical processing from
pristine graphite to GNSs, they may undergo structural changes
through the rearrangement of the carbon atoms in the basal
plane.44 For example, both oxidation and covalent functionali-
zation usually introduce defects in graphite and GNSs.1,3,7
According to previous works, the ratio between the intensity of
the D and G bands (ID/IG) could be used to qualitatively char-
acterize the extent of defects in the carbon structures.45,46 This
ratio is increased with increasing the defects and disorders.42
Decreasing the size of the crystalline grain can enhance this
ratio18,41,47 due to the limitation of the laser focal point size.48
Also broadening of the G band indicates the presence of defects
and disorders.44,46,49 So, the high degree of crystallinity of the
GNSs is confirmed by a weak or negligible D band and a strong
G band with a small D0 shoulder.50
For Raman analysis, individual flakes were deposited onto
a SiO2/Si substrate. Optical microscopy was used to identify the
position of single sheets, but because of its difficulty for identi-
fication, SEM was carried out first (Fig. 5a and 5c). Fig. 5b and
5d show Raman spectra for some marked sheets in the SEM
images. The G and 2D bands are clearly visible in all cases. These
spectra have small or non-existent D andD0 bands, indicating theabsence of defects. As shown in Fig. 5b and 5d, IG [ ID, so the
structural defects do not exist and the lateral size of GNSs is
Fig. 4 AFM image of GNSs with the corresponding AFM height image.
This journal is ª The Royal Society of Chemistry 2012
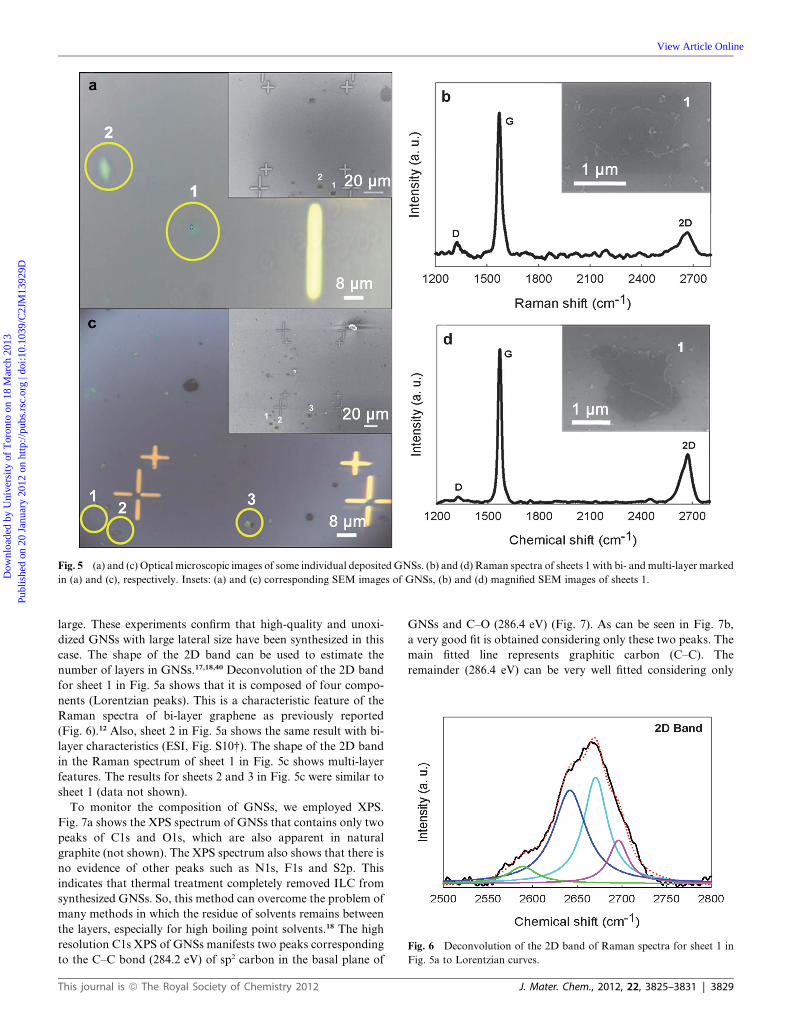
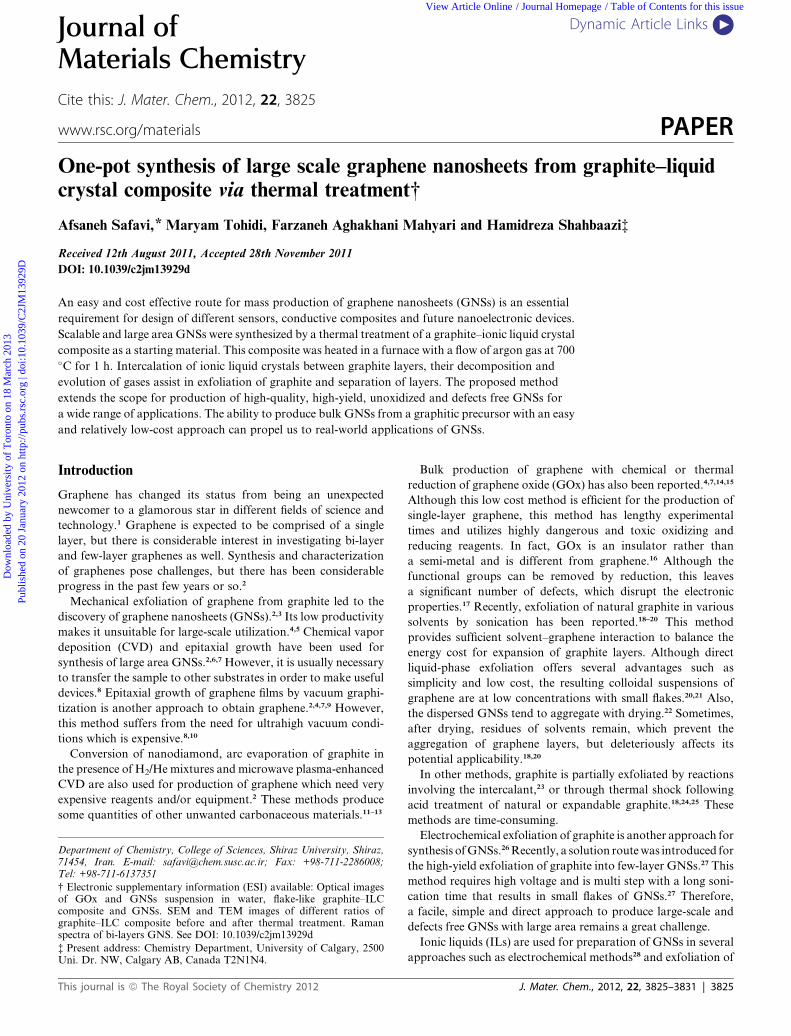
Fig. 5 (a) and (c) Optical microscopic images of some individual depositedGNSs. (b) and (d) Raman spectra of sheets 1 with bi- andmulti-layer marked
in (a) and (c), respectively. Insets: (a) and (c) corresponding SEM images of GNSs, (b) and (d) magnified SEM images of sheets 1.
Fig. 6 Deconvolution of the 2D band of Raman spectra for sheet 1 in
Fig. 5a to Lorentzian curves.
Dow
nloa
ded
by U
nive
rsity
of
Tor
onto
on
18 M
arch
201
3Pu
blis
hed
on 2
0 Ja
nuar
y 20
12 o
n ht
tp://
pubs
.rsc
.org
| do
i:10.
1039
/C2J
M13
929D
View Article Online
large. These experiments confirm that high-quality and unoxi-
dized GNSs with large lateral size have been synthesized in this
case. The shape of the 2D band can be used to estimate the
number of layers in GNSs.17,18,40 Deconvolution of the 2D band
for sheet 1 in Fig. 5a shows that it is composed of four compo-
nents (Lorentzian peaks). This is a characteristic feature of the
Raman spectra of bi-layer graphene as previously reported
(Fig. 6).12 Also, sheet 2 in Fig. 5a shows the same result with bi-
layer characteristics (ESI, Fig. S10†). The shape of the 2D band
in the Raman spectrum of sheet 1 in Fig. 5c shows multi-layer
features. The results for sheets 2 and 3 in Fig. 5c were similar to
sheet 1 (data not shown).
To monitor the composition of GNSs, we employed XPS.
Fig. 7a shows the XPS spectrum of GNSs that contains only two
peaks of C1s and O1s, which are also apparent in natural
graphite (not shown). The XPS spectrum also shows that there is
no evidence of other peaks such as N1s, F1s and S2p. This
indicates that thermal treatment completely removed ILC from
synthesized GNSs. So, this method can overcome the problem of
many methods in which the residue of solvents remains between
the layers, especially for high boiling point solvents.18 The high
resolution C1s XPS of GNSs manifests two peaks corresponding
to the C–C bond (284.2 eV) of sp2 carbon in the basal plane of
This journal is ª The Royal Society of Chemistry 2012
GNSs and C–O (286.4 eV) (Fig. 7). As can be seen in Fig. 7b,
a very good fit is obtained considering only these two peaks. The
main fitted line represents graphitic carbon (C–C). The
remainder (286.4 eV) can be very well fitted considering only
J. Mater. Chem., 2012, 22, 3825–3831 | 3829

Fig. 7 (a) XPS spectrum and (b) high resolution C1s XPS spectrum of GNSs. In (b) the background has been corrected for clarity. (c) XRD patterns of
(1) ILC, (2) graphite, (3) graphite–ILC, (4) synthesized GNSs and (5) GOx. (d) FT-IR spectra of (1) graphite, (2) synthesized GNSs and (3) GOx. Inset in
part c shows the 2q range of 25.0–27.0 for XRD patterns of 2 and 4.
Dow
nloa
ded
by U
nive
rsity
of
Tor
onto
on
18 M
arch
201
3Pu
blis
hed
on 2
0 Ja
nuar
y 20
12 o
n ht
tp://
pubs
.rsc
.org
| do
i:10.
1039
/C2J
M13
929D
View Article Online
a very low amount of C–O from the graphite starting material.
This result shows the absence of oxidization typically associated
with GOx.44
XRD technique was also used to analyze the crystallinity and
quality of the GNSs.12 As reported in the literature, for the
pristine graphite sample, the (002) peak appears at 26.5�, indi-cating an interlayer spacing of 0.336 nm.51,52 Some methods
introduce oxygenated functional groups on carbon sheets. With
increasing the oxidation process, the intensity of the (002)
diffraction line (d-space 0.336 nm at 26.5�) gradually weakens
and finally disappears and a new diffraction peak (d-space 0.69
nm at 12.8�) appears.51–53 So, we investigated the XRD data of
bulk GNSs and GOx (synthesized according to the Hummers
method)33 to validate the formation of unoxidized GNSs and the
complete removal of ILC from the composite after thermal
treatment (Fig. 7c). Fig. 7c shows XRD patterns for ILC, natural
graphite, graphite–ILC composite, bulk GNSs and GOx. The
XRD spectrum of ILC reveals some diffraction peaks in the
range of 5� to 20� (Fig. 7c). For the graphite–ILC composite
before thermal treatment, the diffraction peaks of ILC can be
observed besides the graphite. For the GNSs obtained by
thermal treatment of the graphite–ILC composite, the ILC peaks
have completely disappeared and several distinct peaks,
3830 | J. Mater. Chem., 2012, 22, 3825–3831
corresponding to known values of graphite, can be identified. It
is interesting to note that complete removal of ILC resolves the
main problem of the remaining residual reagents between the
layers in some methods such as direct liquid-phase exfolia-
tion.18,20 Comparison of the XRD patterns of natural graphite
and bulk GNSs indicates that the sp2 structure of carbon is
preserved after thermal treatment (Fig. 7c).28 The inset in Fig. 7c
shows that the (002) peak of graphene decreased by several
orders of magnitude compared to graphite.28 It is interesting that
no peak was observed at 12.8� corresponding to the oxidized
product (GOx). This shows that GNSs have a high crystalline
quality and the unoxidized product is produced by the proposed
method. This high degree of crystallinity of the GNSs was
previously confirmed by the electron diffraction pattern and
Raman spectroscopy. The results obtained from XRD show that
there were no impurities of other carbonaceous materials such as
amorphous carbon, carbides, diamond and CNTs in the
obtained GNSs.
Graphite, GNSs and GOx were also characterized by FT-IR
in the mid-infrared range, and the results are shown in Fig. 7d.
These compounds show the band at 1620 cm�1 attributed to the
aromatic C]C.44 Oxygenated functional groups were observed
in the IR spectrum of GOx (Fig. 7d). In the spectrum of GNSs,
This journal is ª The Royal Society of Chemistry 2012
Dow
nloa
ded
by U
nive
rsity
of
Tor
onto
on
18 M
arch
201
3Pu
blis
hed
on 2
0 Ja
nuar
y 20
12 o
n ht
tp://
pubs
.rsc
.org
| do
i:10.
1039
/C2J
M13
929D
View Article Online
no vibrational band is observed corresponding to the presence
of oxygenated functional groups. The absence of these vibra-
tions is indicative of the successful synthesis of unoxidized
GNSs.
Conclusions
We have proposed a scalable method to produce high-quality,
high-yield, unoxidized and defects free GNSs. Intercalation of
ILC between graphite layers, their decomposition and evolution
of gases assist in exfoliation of graphite and separation of layers.
This method enables the use of low-cost material and techniques
to produce GNSs in large quantities. This approach is direct,
facile and will not result in contamination of the GNSs with
residual reagents due to the complete removal of ILC. The
synthesized GNSs have high purity and the demonstrated
method does not produce other carbonaceous materials such as
diamond, CNTs, unwanted carbides and amorphous carbon.
Dry synthesis of GNSs has a dramatic advantage compared to
the liquid-phase exfoliation method with a drawback of final
product aggregation after drying. Large area production of
GNSs is a characteristic feature that promises making device-
sized graphene in the near future. The synthesized GNSs can
have potential applications in the design of different sensors and
conductive composites.
Acknowledgements
The authors wish to express their gratitude to Shiraz University
Research Council for the support of this work. The authors
also wish to thank Mr N. Maleki for his interest and support of
this work, Prof. L. C. Chen for taking Raman spectra and her
useful comments, Dr E. Goharshadi for taking some TEM
images and Dr E. Farjami for her kind assistance during this
work.
Notes and references
1 A. K. Geim, Science, 2009, 324, 1530.2 C. N. R. Rao, A. K. Sood, K. S. Subrahmanyam and A. Govindaraj,Angew. Chem., Int. Ed., 2009, 48, 7752.
3 A. K. Geim and K. S. Novoselov, Nat. Mater., 2007, 6, 183.4 H. L. Guo, X. F. Wang, Q. Y. Qian, F. B. Wang and X. H. Xia, ACSNano, 2009, 3, 2653.
5 G. Wang, J. Yang, J. Park, X. Gou, B. Wang, H. Liu and J. Yao, J.Phys. Chem. C, 2008, 112, 8192.
6 M. Eizenberg and J. M. Blakely, Surf. Sci., 1970, 82, 228.7 S. Park and R. S. Ruoff, Nat. Nanotechnol., 2009, 4, 217.8 L. Xu. Dong and Q. Chen, Front. Mater. Sci. China, 2010, 4, 45.9 K. S. Novoselov, A. K. Geim, S. V. Morozov, D. Jiang, Y. Zhang,S. V. Dubonos, I. V. Grigorieva and A. A. Firsov, Science, 2004,306, 666.
10 C. Berger, Z. Song, X. Li, X. Wu, N. Brown, C. Naud, D. Mayou,T. Li, J. Hass, A. N. Marchenkov, C. Berger, E. H. Conrad,P. N. First and W. A. de Heer, Science, 2006, 312, 1191.
11 C. N. R. Rao, K. Biswas, K. S. Subrahmanyam and A. Govindaraj, J.Mater. Chem., 2009, 19, 2457.
12 E. Dervishi, Z. Li, F. Watanabe, A. Biswas, Y. Xu, A. R. Biris,V. Saini and A. S. Biris, Chem. Commun., 2009, 4061.
13 K. S. Subrahmanyam, L. S. Panchakarla, A. Govindaraj andC. N. R. Rao, J. Phys. Chem. C, 2009, 113, 4257.
14 S. Stankovich, R. D. Piner, X. Q. Chen, N. Q. Wu, S. T. Nguyen andR. S. Ruoff, J. Mater. Chem., 2006, 16, 155.
15 K. H. Liao, A. Mittal, S. Bose, C. Leighton, K. A. Mkhoyan andC. W. Macosko, ACS Nano, 2011, 5, 1253.
This journal is ª The Royal Society of Chemistry 2012
16 I. Jung, M. Pelton, R. Piner, D. A. Dikin, S. Stankovich,S. Watcharotone, M. Hausner and R. S. Ruoff, Nano Lett., 2007, 7,3569.
17 G. Eda, G. Fanchini and M. Chhowalla, Nat. Nanotechnol., 2008, 3,270.
18 Y. Hernandez, V. Nicolosi, M. Lotya, F. M. Blighe, Z. Sun, S. De,I. T. Mcgovern, B. Holland, M. Byrne, Y. k. Gun’ko, J. J. Boland,P. Niraj, G. Duesberg, S. Krishnamurthy, R. Goodhue,J. Hutchison, V. Scardaci, A. C. Ferrari and J. N. Coleman, Nat.Nanotechnol., 2008, 3, 563.
19 X. Zhou, T. Wu, K. Ding, B. Hu, M. Hou and B. Han, Chem.Commun., 2010, 46, 386.
20 X. Wang, P. F. Fulvio, G. A. Baker, G. M. Veith, R. R. Unocic,S. M. Mahurin, M. Chi and S. Dai, Chem. Commun., 2010, 46, 4487.
21 J. Zheng, C. A. Di, Y. Liu, H. Liu, Y. Guo, C. Du, T. Wu, G. Yu andD. Zhu, Chem. Commun., 2010, 46, 5728.
22 Y. Si and E. T. Samulski, Chem. Mater., 2008, 20, 6792.23 L. M. Viculis, J. J. Mack and R. B. Kaner, Science, 2003, 299, 1361.24 G. Chen, W. Weng, D. Wu, C. Wu, J. Lu, P. Wang and X. Chen,
Carbon, 2004, 42, 753.25 X. Li, X. Wang, L. Zhang, S. Lee and H. Dai, Science, 2008, 319,
1229.26 C. Y. Su, A. Y. Lu, Y. Xu, F. R. Chen, A. N. Khlobystov and L. J. Li,
ACS Nano, 2011, 5, 2332.27 J. Wang, K. K. Manga, Q. Bao and K. P. Loh, J. Am. Chem. Soc.,
2011, 133, 8888.28 N. Liu, F. Luo, H. Wu, Y. Liu, C. Zhang and J. Chen, Adv. Funct.
Mater., 2008, 18, 1518.29 Liquid Crystals: The Fourth State of Matter, ed. F. D. Saeva, Marcel
Dekker, New York, 1979.30 K. Binnemans, Chem. Rev., 2005, 105, 4148.31 A. Safavi and M. Tohidi, J. Phys. Chem. C, 2010, 114, 6132.32 P. K. Bhowmik, H. Han, I. K. Nedeltchev and J. Cebe, Mol. Cryst.
Liq. Cryst., 2004, 419, 27.33 W. S. Hummers and R. E. Offeman, J. Am. Chem. Soc., 1958, 80,
1339.34 Y. Matsuo, S. Higashika, K. Kimura, Y. Miyamoto, T. Fukutsuka
and Y. Sugie, J. Mater. Chem., 2002, 12, 1592.35 L. M. Viculis, J. J. Mack, O. M. Mayer, H. T. Hahn and R. B. Kaner,
J. Mater. Chem., 2005, 15, 974.36 T. Fukushima, A. Kosaka, Y. Ishimura, T. Yamamoto, T. Takigawa,
N. Ishii and T. Aida, Science, 2003, 300, 2072.37 H. Ohtani, S. Ishimura and M. Kumai, Anal. Sci., 2008, 24, 1335.38 J. C. Meyer, A. K. Geim, M. I. Katsnelson, K. S. Novoselov,
T. J. Booth and S. Roth, Nature, 2007, 446, 60.39 A. Gupta, G. Chen, P. Joshi, S. Tadigadapa and P. C. Eklund, Nano
Lett., 2006, 6, 2667.40 A. C. Ferrari, J. C. Meyer, V. Scardaci, C. Casiraghi, M. Lazzeri,
F. Mauri, S. Piscanec, D. Jiang, K. S. Novoselov, S. Roth andA. K. Geim, Phys. Rev. Lett., 2006, 97, 187401-1.
41 F. Tuinstra and J. L. Koenig, J. Chem. Phys., 1970, 53, 1126.42 C. Casiraghi, A. Hartschuh, H. Qian, S. Piscanec, C. Georgi,
A. Fasoli, K. S. Novoselov, D. M. Basko and A. C. Ferrari, NanoLett., 2009, 9, 1433.
43 R. J. Nemanich and S. A. Solin, Phys. Rev. B, 1979, 20, 392.44 T. Y. Kim, H. W. Lee, J. E. Kim and K. S. Suh, ACS Nano, 2010, 4,
1612.45 C. Gao, Y. Z. Jin, H. Kong, R. L. D. Whitby, S. F. A. Acquah,
G. Y. Chen, H. H. Qian, A. Hartschuh, S. R. P. Silva, S. Henley,P. Fearon, H. W. Kroto and D. R. M. Walton, J. Phys. Chem. B,2005, 109, 11925.
46 X. Zhao, Q. Zhang and D. Chen, Macromolecules, 2010, 43, 2357.47 A. C. Ferrari and J. Robertson, Phys. Rev. B, 2000, 61, 14095.48 M. Choucair, P. Thordarson and J. A. Stride, Nat. Nanotechnol.,
2009, 4, 30.49 T. C. Chieu and M. S. Dresselhaus, Phys. Rev. B, 1982, 26, 5867.50 A. Malesevic, R. Vitchev, K. Schouteden, A. Volodin, L. Zhang,
G. V. Tendeloo, A. Vanhulsel and C. V. Haesendonck,Nanotechnology, 2008, 19, 305604.
51 C. Xu, X. D. Wu, J. W. Zhu and X. Wang, Carbon, 2008, 46, 386.52 M. H. Alonso, A. A. Abdada, M. J. McAllister, I. A. Aksay and
R. K. Prud’homme, Langmuir, 2007, 23, 10644.53 D. A. Dikin, S. Stankovich, E. J. Zimney, R. D. Piner,
G. H. B. Dommett, G. Evmenenko, S. T. Nguyen and R. S. Ruoff,Nature, 2007, 448, 457.
J. Mater. Chem., 2012, 22, 3825–3831 | 3831